Molecular BioSystems - Marcotte Lab · 2013-12-17 · Molecular BioSystems This article was...
16
Molecular BioSystems This article was published as part of the Computational and Systems Biology themed issue Please take a look at the full table of contents to access the other papers in this issue.
Transcript of Molecular BioSystems - Marcotte Lab · 2013-12-17 · Molecular BioSystems This article was...

MolecularBioSystems
This article was published as part of the
Computational and Systems Biology themed issue
Please take a look at the full table of contents to access the other papers in this issue.
Global signatures of protein and mRNA expression levelsw
Raquel de Sousa Abreu,aLuiz O. Penalva,
aEdward M. Marcotte
band
Christine Vogel*b
Received 27th April 2009, Accepted 22nd July 2009
First published as an Advance Article on the web 1st October 2009
DOI: 10.1039/b908315d
Cellular states are determined by differential expression of the cell’s proteins. The relationship
between protein and mRNA expression levels informs about the combined outcomes of
translation and protein degradation which are, in addition to transcription and mRNA stability,
essential contributors to gene expression regulation. This review summarizes the state of
knowledge about large-scale measurements of absolute protein and mRNA expression levels, and
the degree of correlation between the two parameters. We summarize the information that can be
derived from comparison of protein and mRNA expression levels and discuss how corresponding
sequence characteristics suggest modes of regulation.
Making proteins
In a cell, ratios between protein and mRNA are mainly
determined by translation and protein degradation
(Fig. 1)—two processes that are highly regulated both at a
global and at a gene-specific level.1,2 Their deregulation can
lead to diverse diseases, ranging from cancer to Alzheimer’s
(Table 1). Thus, much effort has been placed on identification
of mRNA motifs or protein sequences that have regulatory
functions. Recently, high-throughput approaches have
been used to simultaneously measure protein and mRNA
concentrations allowing for systematic studies of protein
expression regulation on proteome-wide scale. Here, we
discuss the utility of these approaches in the study of global
regulation of translation and protein degradation.
Protein expression and turnover: an introduction to
mechanisms and regulation
Translation
Eukaryotic translation consists of initiation, elongation and
termination3,4 and requires a number of specialized factors.
Translation initiation mostly occurs in a cap-dependent
manner through a cap structure, m7GpppN5 (Fig. 2),
although exceptions are known, e.g. ref. 6 and 7: internal
ribosome entry sites (IRESs) recruit the ribosome directly
to the start codon, bypassing the requirement of the cap
structure.6,7 Ribosomes recognize a start codon within a
translation initiation site, i.e. the Kozak sequence8,9 which is
conserved across eukaryotes.10 Several factors can affect
translation initiation. For instance, ribosomes can bind to
uORFs (upstream open reading frames) positioned in the
a Children’s Cancer Research Institute, University of Texas HealthScience Center at San Antonio, TX, USA
bCenter for Systems and Synthetic Biology, Institute for Cellular andMolecular Biology, University of Texas at Austin, TX, USA.E-mail: [email protected]
w This article is part of a Molecular BioSystems themed issue onComputational and Systems Biology.
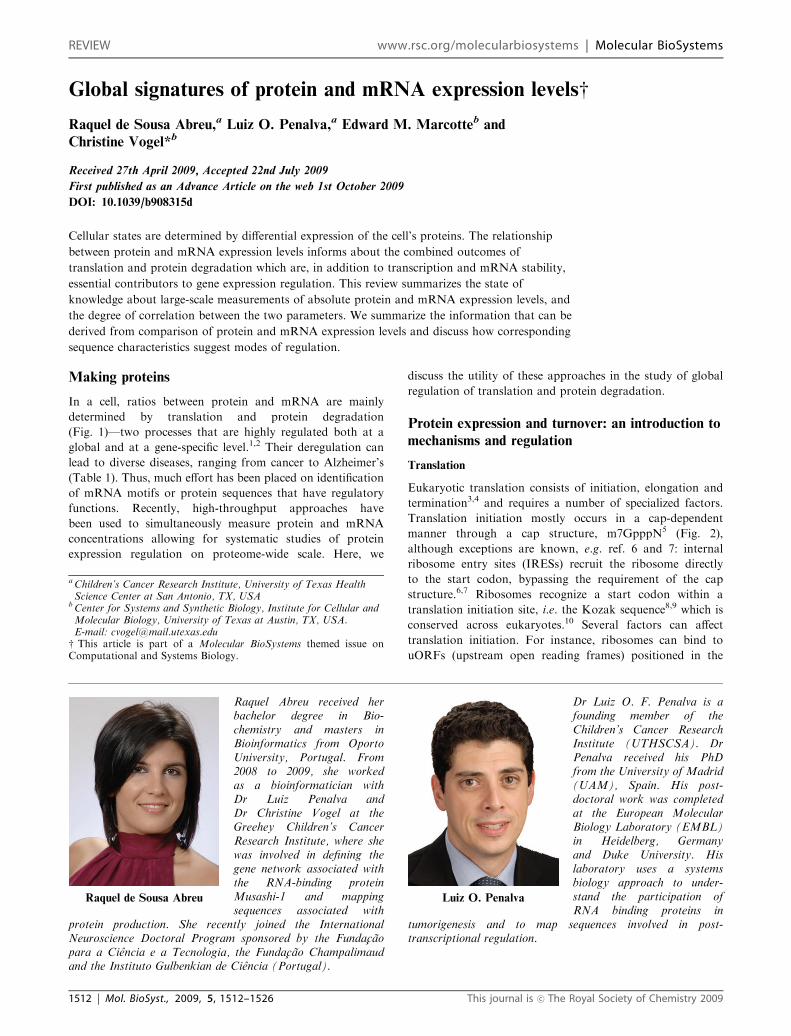
Raquel de Sousa Abreu
Raquel Abreu received herbachelor degree in Bio-chemistry and masters inBioinformatics from OportoUniversity, Portugal. From2008 to 2009, she workedas a bioinformatician withDr Luiz Penalva andDr Christine Vogel at theGreehey Children’s CancerResearch Institute, where shewas involved in defining thegene network associated withthe RNA-binding proteinMusashi-1 and mappingsequences associated with
protein production. She recently joined the InternationalNeuroscience Doctoral Program sponsored by the Fundacaopara a Ciencia e a Tecnologia, the Fundacao Champalimaudand the Instituto Gulbenkian de Ciencia (Portugal).
Luiz O. Penalva
Dr Luiz O. F. Penalva is afounding member of theChildren’s Cancer ResearchInstitute (UTHSCSA). DrPenalva received his PhDfrom the University of Madrid(UAM), Spain. His post-doctoral work was completedat the European MolecularBiology Laboratory (EMBL)in Heidelberg, Germanyand Duke University. Hislaboratory uses a systemsbiology approach to under-stand the participation ofRNA binding proteins in
tumorigenesis and to map sequences involved in post-transcriptional regulation.
1512 | Mol. BioSyst., 2009, 5, 1512–1526 This journal is �c The Royal Society of Chemistry 2009
REVIEW www.rsc.org/molecularbiosystems | Molecular BioSystems

mRNA’s 50UTR and change levels of translation of the main
open reading frame in a competitive manner.11 Secondary
structures also affect translation by slowing down ribosome
passage,12 and a sub-optimal Kozak sequence can negatively
affect initiation.
Translation elongation constitutes the rate at which amino
acids from acyl-tRNAs are added sequentially to the growing
polypeptide. Three major elongation factors (eEF1A, eEF1B
and eEF2) are regulated via phosphorylation/desphosphorylation
in response to several stimuli.13 Elongation rates are also
affected by changes in initiation rates, as well as by the choice
of codons, and correspondingly, the abundance of the
respective tRNAs. The common assumption is that frequent
codons have more tRNA genes than infrequent codons; and
for this reason, codon and tRNA adaptation have been used
as proxies of translation efficiency.
Several processes prior to translation can influence
translation efficiency of a given mRNA. For example, the
poly(A) tail length of the mRNA affects transcript stability,
but it also correlates with translational efficiency: on average,
efficiently translated mRNAs have longer poly(A) tails and are
shorter, more stable, and more efficiently transcribed than
inefficiently translated mRNAs,14–16 although exceptions are
known.17 Translation can also be influenced by modification,
e.g. phosphorylation, or proteolysis of core components of the
translation machinery, as well as cis-regulatory elements
(sequence motifs) and specific trans-acting factors, e.g.
RNA-binding proteins (RBPs) and microRNAs.1,18–21 cis-
Regulatory elements that function as binding sites for specific
RBPs occur anywhere along the mRNA, but are mostly found
in either the 50 or the 30UTRs (Fig. 2), e.g. ref. 22. For
example, iron-response elements, adenosine- and uridine-rich
elements and specific secondary structures like stem loops are
very common.1 trans-Acting factors mostly function during
translation initiation.23 They can block the access of the
general initiation factor elF4E to the cap, prevent the inter-
action between elF4E and elF4G, interfere with elF4G and
elF3 interaction, or prevent ribosome recruitment (Fig. 2).18
Although protein biosynthesis is similar in all domains of life,
eukaryotic synthesis is more complex than the prokaryotic one.
An important difference is the coupling of transcription and
translation in prokaryotes: the bacterial nascent mRNA
molecule begins to be translated even before its transcription
from DNA is complete.24 In contrast, eukaryotic translation
takes place in the cytoplasm after transcription inside the
nucleus, leading to much more elaborate regulation of eukaryotic
gene expression. Other differences include: (a) eukaryotic
ribosomes are larger than prokaryotic ones, (b) in prokaryotes,
the initiating amino acid is N-formylmethionine rather than
methionine, and (c) mechanisms and regulation of translation
initiation. Eukaryotes use many more translation factors than
do prokaryotes, and interactions between these factors are
much more elaborate. Regulation in prokaryotes usually occurs
through blocking of the access to the initiation site, while in
eukaryotes several structural elements might be involved,
namely the m7G cap, sequences flanking the AUG start codon,
the position of the AUG codon relative to the 50 end of the
mRNA, and secondary structures within the 50UTR.23,25
Degradation
Protein degradation is highly specific and tightly regulated; it
comprises two major systems: lysosomal degradation and
ubiquitin mediated proteolysis. Lysosomal degradation
Fig. 1 Essential steps in gene expression. Genes are expressed by
production of mRNAs from DNA, and protein from mRNAs. Much
interest has been paid to the ‘first half’ of these processes, e.g.
transcription regulation. This review focuses on the ‘second half’ of
these processes, in particular translation and protein degradation and
how these influence the number of protein molecules observed per
mRNA.
Edward M. Marcotte
Edward Marcotte is theWilliam and Gwyn ShiveEndowed Professor of Meta-bolism and Bioinformatics andProfessor of Chemistry andBiochemistry at the Universityof Texas at Austin. He receivedhis PhD from the University ofTexas and was an AlexanderHollaender DistinguishedPostdoctoral Fellow at theUniversity of California, LosAngeles, where he alsoco-founded the Los Angeles-based bioinformatics companyProtein Pathways. He is
currently fellow of the Mr and Mrs Corbin J. Robertson,Sr. Regents Chair in Molecular Biology and co-directs theUniversity of Texas Center for Systems and Synthetic Biology.
Christine Vogel
Christine Vogel is a researchassociate at the University ofTexas at Austin, and hercurrent scientific interestsrevolve around the use oflarge-scale proteomics methodsto decipher regulation ofprotein expression andstability. After a masters inBiochemistry at the FriedrichSchiller University, Jena,Germany, she pursued a PhDwith Dr Cyrus Chothia andDr Sarah Teichmann at theMRC Laboratory of Mole-cular Biology in Cambridge,
UK. In 2005, she joined Dr Edward Marcotte’s lab at theUniversity of Texas at Austin as a postdoctoral fellow, fundedby the International Human Frontier Science Program.
This journal is �c The Royal Society of Chemistry 2009 Mol. BioSyst., 2009, 5, 1512–1526 | 1513

includes receptor-mediated endocytosis, pinocytosis, phago-
cytosis and autophagy.26 In ubiquitin–proteasome mediated
proteolysis, target proteins are ubiquitinylated and sub-
sequently degraded by the proteasome, as reviewed in ref. 27.
In eukaryotes, degradation regulation often occurs during
poly-ubiquitinylation (Fig. 2). It is the rate-limiting selectivity
step of ubiquitinylation and therefore proteolysis is mainly
determined by E3 ubiquitin-ligases that specifically recognize
Table 1 Regulatory elements of translation and protein turnover APP: amyloid precursor protein, ASYN: alpha synuclein, c-myc: v-myc avianmyelocytomatosis viral oncogene homolog, BACE1: b-site APP cleaving enzyme-1, the rate-limiting enzyme for b-amyloid (Ab) production, Bcl-2:B cell lymphoma 2, DNMT3A/B: DNA methyltransferases 3A and 3B, ARE: AU-rich elements, Wnt-5a: wingless-type MMTV integration sitefamily, member 5A, COX-2: cyclooxygenase-2, TNFa: tumor necrosis factor (TNF superfamily, member 2), eIF4G: eukaryotic translationinitiation factor 4G, eIF4E: eukaryotic translation initiation factor 4E, eIF2a: eukaryotic translation initiation factor 2, subunit 1 alpha, 35 kDa,b-ENaC: beta-subunit of the epithelial sodium channel, FMR1: fragile X mental retardation 1, PP2Ac: protein phosphatase 2A catalytic subunit,Sod1: superoxide dismutase 1, FMRP: fragile X mental retardation protein, GARS: glycyl-tRNA synthetase, PABP: poly(A) binding protein,IRE: iron-responsive element, IRES: internal ribosome entry site, I-kB: inhibitor of nuclear factor kB, Mdm2: Mdm2 p53 binding protein homolog(mouse), Nedd4: neuronal precursor cell-expressed developmentally downregulated 4, Msi1: Musashi1, uORF: upstream open reading frame,PCNA: proliferating cell nuclear antigen, FBW7: F-box and WD repeat domain-containing 7, p27/CDKN1B: cyclin-dependent kinase inhibitor1B (p27, Kip1), SKP2: S-phase kinase-associated protein 2, SoSLIP: Sod1 stem loop interacting with FMRP, b-TrCP: b-transducin repeat-containing protein, TPO: thrombopoietin, YARS: tyrosyl-tRNA synthetase
Translation
Regulatory element Target of regulation Regulatory processAssociated disease/biological process
cis-Elements IRE APP Intracellular levels of APP are tightly regulated byiron through interaction of the IRE RNA stemloop with iron-regulatory proteins.
Alzheimer’s disease130
ASYN Presence of an IRE-like sequence suggests apotential regulatory element through which ironinflux may increase ASYN expression.
Parkinson’sdisease131
IRES c-myc Single mutation in the c-myc IRES causesenhanced initiation of translation via acap-independent mechanism and promotesexcess of c-myc production.
Multiple myeloma132
p27 ELAV/Hu proteins block the ribosomeentry site inhibiting IRES activity and p27translation.133,134
Cancer135
uORF Mdm2 The long isoform (L-Mdm2) contains 2 uORFsthat decrease the overall Mdm2 translationefficiency. Oppositely, S-Mdm2 (short 50UTR)allows high translational efficiency and Mdm2overexpression.136,137
Cancer138
TPO Thrombopoietin translation is stronglyinhibited by the presence of uORFs whichsuppress efficient initiation.139 Inactivationof uORFs by mutation leads to excessiveproduction of TPO and elevated platelets.
Hereditarythrombocythemia140
ARE Wnt-5a HuR inhibits translation of Wnt-5a when boundto highly conserved AU-rich sequences in the30UTR of the Wnt-5a mRNA.141
Cancer142,143
COX-2 and TNFa The RNA-binding protein TIA-1 binds to AU-rich elements in the 30UTR region of COX-2and TNFa and acts as a translational silencer.Defects in TIA-1 activity may result inupregulated expression of COX-2 and TNFa.144,145
Cancer andinflammation146,147
G-quartet, ‘‘kissingcomplex’’ andSoSLIP motifs
e.g. PP2Ac, Sod1 The RNA-binding protein FMRP interacts withmRNAs (e.g. PP2Ac, Sod1) via G-quartet,‘‘kissing complex’’ or SoSLIP (Sod1 stem loopinteracting with FMRP) motifs. This interactioncan be involved in the (i) retention of mRNAs intranslationally inactive messenger RNPs;148,149
(ii) inhibition of translation preventing ribosomescanning;150 (iii) or positive modulation oftranslation.151
Fragile Xsyndrome152
(G/A)UnAGU(n = 1–3)
Msi1 targets The RNA-binding protein Msi1 inhibits thecap-dependent translation of its target mRNAsby competing with eIF4G to bind PABP, andthus inhibiting formation of the 80S ribosomecomplex.153
Medulloblastoma,154
glioma,155,156
astrocytoma,156
retinoblastoma157 andcolorectal adenoma158
1514 | Mol. BioSyst., 2009, 5, 1512–1526 This journal is �c The Royal Society of Chemistry 2009

Table 1 (continued )
Translation
Regulatory element Target of regulation Regulatory processAssociated disease/biological process
Initiationfactors
eIF4E Angiogenesis factors,onco-proteins,pro-survival proteinsand proteins involvedin tumor invasionand metastasis
Elevated eIF4E levels, caused by directoverexpression or by hyper-phosphorylationof 4EBP1, trigger enhanced assembly of thetranslation initiation complex and thereby drivecap-dependent translation.
Malignancy, cellulartransformation,tumor growth andmetastasis159–161
eIF2a BACE1 Phosphorylation of the initiation factor eIF2aincreases the translation of BACE1 and causesb-amyloid overproduction.
Alzheimer’sdisease162
Translationmachinery
Ribosomal pro-teins
Protein synthesis Altered expression of some ribosomal proteinshas been reported in several human cancersindicating the potential importance ofribosome function and translational controlin tumor progression.
Cancer163–166
YARS and GARS Protein synthesis Mutations and deletions in these tRNAsynthetase genes cause impaired or alteredprotein synthesis.
Neurodegenerativedisorders167,168
Signaling path-ways
PI3K/Akt pathway mTOR When PI3K/Akt pathway is activated,signaling can be propagated to varioussubstrates, including mTOR. mTOR activates S6kinase-1, which activates ribosomal protein S6and leads to increased protein translation.It also phosphorylates 4EBP-1, causing it todissociate from eIF4E, and freeing eIF4E toparticipate in formation of the translationinitiation complex.
Several forms ofcancer169
miRNAs e.g. miR-15 andmiR-16; miR-29;let-7
e.g. Bcl-2;DNMT3A/B; RAS
Expression of miR-15 and miR-16 causesdownregulation of Bcl2;170 miR-29 suppressesDNMT3A/B;171 let-7 regulates the expression ofRAS and other genes involved in cell cycle andcell division.172
Cancer, cardiovas-cular diseases, andimmune system,173
and muscle dis-orders174
Protein degradation
Ubiquitin andubiquitin-likeproteinconjugation
E1Ub, E1SUMO PCNA PCNA, the essential processivity factor ofpolymerases, is regulated by ubiquitinand ubiquitin-like modifiers. Mono- orpoly-ubiquitin or SUMO conjugation to PCNAdictates the activation of specificrepair pathways.
DNA repair175,176
Ubiquitinligases
FBW7 e.g. cyclin E, c-myc,c-jun and Notch
FBW7 is the substrate recognition component ofthe SCF-type ubiquitin ligase. SCFFBW7
degrades several proto-oncogenes that functionin cellular growth and division pathways,including c-myc, cyclin E, Notch and c-jun.
Cancer177
SKP2 and b-TrCP CDKs and CDKinhibitors
The F-box proteins, SKP2 and b-TrCP,provide the specific, rapid and timelyproteolysis of cell cycle regulators, whichultimately control activation and inactivation ofCDKs and CDK inhibitors during cell cycleprogression.
Cancer biogenesisand tumorprogression178
b-TrCP I-kB I-kB phosphorylation recruits the ubiquitinligase SCF-b-TrCP to I-kB which in turnpromotes Lys48-linked ubiquitinylation andproteasomal degradation, thereby activating thetranscription factor NF-kB.
Immune andinflammatoryresponses,179,180 andgastric carcinoma181
Nedd4 b-ENaC Mutation in the b/g subunit of the renal Na+
channel (b-ENaC), interdicts its interaction withthe E3 ligase Nedd4. The Na+ channel cannotthen be target for degradation and accumulates,leading to excessive reabsorption of Na+
accompanied by H2O and causes a severe formof early-onset hypertension.
Liddlesyndrome182,183
This journal is �c The Royal Society of Chemistry 2009 Mol. BioSyst., 2009, 5, 1512–1526 | 1515

degradation or destruction signals (degrons) of the target
protein and mediate the attachment of a poly-ubiquitin
chain.28,29 Ubiquitinylation serves as a secondary signal which
targets the substrate to the proteasome.
Primary degradation signals are encoded in the protein’s
sequence (Fig. 2). So-called N-degrons are part of the N-end
rule which relates the in vivo half-life of a protein to the identity
of its N-terminal residue.30 Other degradation signals are not
restricted to the N-terminus. One such sequence is PEST which
is rich in proline, glutamic acid, serine and threonine.31 PEST
sequences correlate with rapid protein turnover, and direct a
protein to the ubiquitin–proteasome pathway.32,33 Unstructured
regions, i.e. regions in the protein that do not assume a
particular three-dimensional structure, can also destabilize the
protein.34–36 The protein degradation signals are often condi-
tional or masked such that recognition requires a prior activa-
tion or a cryptic exposition, for example by subunit separation,
local unfolding or post-translational modification.37,38 Degrada-
tion signals, along with the global and gene-specific mechanisms
by which they are recognized, are still not well understood. The
signals have been characterized for individual proteins, but have
yet to be demonstrated for large-scale data.36,39
The ubiquitin pathway and the proteasome appear to be
present and highly conserved in all eukaryotes. In fact, yeast
and human ubiquitin differ at only 3 of 76 residues.40 In
prokaryotes, ubiquitin has not yet been found; however
prokaryotic homologs41,42 and ubiquitin-like proteins43 exist.
Similarly, homologs of the proteasome were found in
prokaryotes, but their physiological roles have not been
well-established yet.
Large-scale methods to study protein translation and
turnover
Much of our knowledge on translation and degradation
regulation traditionally comes from studies on individual
genes limiting our understanding of global aspects of
regulation. Fortunately, we now have access to more extensive
datasets resulting from high-throughput methods to measure
translation and to identify mRNA populations associated with
particular regulators.
Translation efficiency can be studied with a variety of
methods. We can employ microarrays to measure (i) mRNA
concentrations, (ii) association of mRNAs with specific
RNA-binding proteins, and (iii) association of mRNAs with
ribosomes, and thus the efficiency with which these mRNAs
are translated. RIP-Chip (RBP immunoprecipitation followed
by DNA microarray analysis) extracts mRNAs associated
with specific RNA-binding proteins,44,45 and hence assesses
translation regulation in the context of putative regulators.
A variant of this approach, called TRAP (translating
ribosome affinity purification), targets ribosomal proteins,
and it has been used to assess the ‘translation profile’ in
neurons,46,47 yeast48 and plant.49 Sucrose gradients serve to
separate mRNA populations according to their density, as
dictated by their levels of association with ribosomes.
Untranslated or free mRNA remains at the top of the gradient
while highly translated mRNA (polysomal fraction) is present
at the bottom. Arava et al. combined this method with
microarray analysis to estimate ribosome occupancy and
density along mRNAs.50,51 Recent work describes another
Fig. 2 Elements of eukaryotic translation and protein degradation regulation. The number of protein molecules present per mRNA is influenced
both by translation and protein degradation. Both rates are regulated by several processes whose signals are encoded in the mRNA and protein
sequences. Transcription and mRNA degradation (stability) affect the steady-state concentrations of mRNAs, but not (formally) the protein-
per-mRNA ratio—the latter of which is the focus of this review. Some processes, e.g. binding of miRNAs or RNA-binding proteins, affect both
translation and mRNA stability.
1516 | Mol. BioSyst., 2009, 5, 1512–1526 This journal is �c The Royal Society of Chemistry 2009

method to measure translation.52 Ribosomes protect a region
of B30 nucleotides from nuclease digestion (footprints).
Strong association of a ribosome for a given mRNA leads to
many protected fragments. These fragments are converted to a
DNA library and sequenced at large scale. By comparing reads
of fragments obtained by nuclease digestion to fragments
obtained by random fragmentation, Ingolia et al. could efficiently
calculate levels of translation for 44600 yeast genes.52
Several datasets on translation efficiency and regulation
exist for yeast,50–54 as well as data on mRNA half-lives17
and targets of RNA-binding proteins.55–57 For humans, a
number of genome-wide datasets have also become available,
e.g. on polysomal profiling,58,59 mRNA decay,60,61 poly(A) tail
lengths,62 and the impact of miRNAs.63,64
Protein degradation is less well-studied at large scale than
translation efficiency and fewer methods exist. In a classic
experiment, cellular translation is inhibited with cyclo-
heximide, and decreases in protein abundance are measured
over time. This approach has been applied to yeast at large
scale, using a tagged protein library to monitor
protein decay.65 Recent work measured protein stability of
B6000 human proteins,39 using genetic constructs ensuring
comparable translation rates.
Several large-scale studies exist in which changes in
protein concentrations are compared to changes in mRNA
concentrations.66–69 For example, two recent studies examined
the effects of miRNA knockdown on protein and mRNA
expression:63,64 changes at the mRNA level (RKnockdown/RControl)
suggest regulation of mRNA stability and transcriptional
feedback; changes at the protein level (PKnockdown/PControl)
result from changes in mRNA stability, transcription, translation
and protein degradation. However, these and other studies
report only relative protein and mRNA concentrations and
cannot be used to compare protein and mRNA levels directly.
Absolute concentrations are required for the equations
described below and are the focus of this review.
Absolute concentrations are harder to obtain and less
available than relative concentrations. Absolute mRNA
concentrations have been estimated from single-channel
microarrays, SAGE data as well as next-generation deep
sequencing data. Dual-channel microarrays have also been
used to estimate absolute mRNA concentration, using
genomic DNA as reference. Absolute protein concentrations
have been estimated using Western blotting, 2D-gels in
combination with mass spectrometry, or libraries of
GFP-tagged proteins.39,70–73 As the latter are available only
for some organisms and sometimes only a small fraction of
genes, shotgun proteomics approaches employing quantitative
mass spectrometry have become a useful alternative to
estimate absolute concentrations for a large number of
proteins, e.g. ref 74 and 75.
Protein-per-mRNA ratios as a tool for studying
translation and protein degradation
In very basic terms, changes in concentration of a protein
depend on the mRNA concentration, translation efficiency
and degradation of the existing protein (Fig. 1). If transcription
and mRNA stability are in steady-state, we can treat
kTranslation and R as constants and combine them into a new
constant describing protein production kProteinProduction:
kProteinProduction = kTranslationR (1)
Protein degradation depends on protein concentration, and it
can be modeled in the form of a first-order rate equation,
using the kProteinDegradation as a rate constant. Combining
kProteinProduction and kProteinDegradation, we can now describe
the change in protein concentration dP during time dt as an
ordinary differential equation:
dP/dt = kProteinProduction � kProteinDegradationP (2)
This equation is central to common models describing protein
production and turnover reflecting the processes described in
Fig. 1. While the equation requires several assumptions
(discussed below), it is simple enough that it can be analyti-
cally solved (integrated) to provide an estimate of the protein
concentration P at any time point t, employing P0 as the
starting concentration:
Pt = (P0 � kProteinProduction/kProteinDegradation)e�kProteinDegradationt
+ kProteinProduction/kProteinDegradation
= RkTranslation/kProteinDegradation(1 � e�kProteinDegradationt)
+ P0e�kProteinDegradationt (3)
In biological systems, we often examine steady-state or
equilibrium conditions. For example, for a yeast culture
growing in log-phase, the measured molecule concentrations
correspond to the ‘average’ cell cycle state of all cells in the
population, and these concentrations are approximately
constant over time. In contrast, molecule concentrations in
individual growing and dividing cells are not in steady-state,
neither are cell populations which respond to stimuli by
inducing or repressing expression. However, after some
time t after a stimulus, the cell population may again reach
steady-state which is possibly different from the original one.
We may choose to compare measurements from two different
steady-states, e.g. cells grown in different media, or a wild-type
cell population vs. a population with a gene-knockout.
In steady-state, i.e. dP/dt = 0 for eqn (2) and t ) N for
eqn (3), the concentration P reaches an equilibrium of:
PN = kProteinProduction/kProteinDegradation
= RNkTranslation/kProteinDegradation (4)
This relationship is interesting for several reasons. We can
use eqn (4) to estimate missing variables. For example,
Beyer et al. predicted protein degradation rates for thousands
of yeast genes, given measurements of protein and mRNA
concentrations as well as translation rates.76 The predicted
rates agreed well with published data on protein stabilities.65,77
Eqn (3) and (4) show that the protein concentration is a
direct function of both the mRNA concentration as well as
translation and protein degradation rates. In other words, we
can use eqn (3) and (4) to predict protein concentrations for a
gene, given information on the concentration of the corres-
ponding mRNA and the rates. However, we often lack
measurements of translation and degradation rates, and
typically only mRNA data are abundantly available. Thus,
This journal is �c The Royal Society of Chemistry 2009 Mol. BioSyst., 2009, 5, 1512–1526 | 1517

the mRNA concentration has often been used to approximate
the protein concentration in the cell. As we can see from
eqn (4), the steady-state protein concentration is directly
proportional to mRNA concentration, and the proportionality
factor is kTranslation/kProteinDegradation. The proportionality
between protein and mRNA concentration holds also true
for the transient, non-steady-state case (eqn (3)): the higher the
mRNA concentration, the higher the protein concentration if
all other variables are fixed. However, despite this proportionality,
eqn (3) and (4) show that mRNA concentration can only
partially explain variation in protein concentration, and the
exclusive use of mRNA concentrations neglects the essential
roles of translation and protein degradation.
Since translation and degradation rates are difficult to
measure, we can use known protein and mRNA concentrations
to learn about the combined outcomes of the rates, as can be
seen from rearranging eqn (4):
PN/RN = kTranslation/kProteinDegradation (5)
The protein-per-mRNA ratio P/R described in eqn (5) is the
focus of the discussions below. Studies in bacteria, yeast, and
multi-cellular organisms have examined the protein-
per-mRNA ratio in its relationship to gene characteristics that
hint for regulation at the level of translation or protein
degradation. The protein-per-mRNA ratio informs about
the combined outcome of translation and degradation, but it
cannot inform us about the type of influence. Fortunately, this
information can come from sequence properties. By examining
sequence properties of genes with different protein-per-mRNA
ratios, we learn about the influence of regulatory processes on
production and degradation rates.
We use the protein-per-mRNA ratio to normalize for effects
of transcription, i.e. to ‘factor out’ the influence of mRNA
expression levels on the levels of protein expressed in the cell.
If there was no translation or degradation regulation,
P/R would be identical for all genes. In a plot of mRNA
versus protein concentrations, all data points would lie on a
straight line with a perfect correlation (e.g. Pearson’s R2 = 1).
In reality, this is not observed (Fig. 3A–C, Table 2). Protein-
per-mRNA ratios vary widely for genes measured from one
cellular sample. The deviation from a straight line is the
product of several processes: (i) measurement noise; (ii) noise
in gene expression regulation;72,78 (iii) inability to detect the
correct protein amounts due to post-translational modifi-
cations; and (iv) gene-specific regulation of translation and
protein degradation influencing protein expression levels in the
particular steady-state conditions under study.
Fig. 3 Protein versusmRNA concentrations across organisms. (A, B and C). Protein and mRNA concentrations correlate to a large extent across
bacteria, yeast and human. Data for E. coli were taken from ref. 74; the yeast proteomics data were averaged from concentrations reported in
ref. 70–72 and 94, as well as RNA concentrations from ref. 17, 97 and 129. The human data are from ref. 94: Daoy medulloblastoma cellular lysate
was analyzed via LC-MS/MS on an LTQ-Orbitrap and protein concentrations for 1025 proteins were estimated using APEX.74 mRNA
concentrations were estimated using Nimblegen arrays, (D) across years. The graph shows the correlations for three different groups of organisms
(bacteria, uni- and multi-cellular eukaryotes), with data points colored according to significance of the correlation. White data points are
non-significant correlation coefficients.
1518 | Mol. BioSyst., 2009, 5, 1512–1526 This journal is �c The Royal Society of Chemistry 2009

The protein-per-mRNA ratio is different for different
genes, but it may also change for a given gene under
different conditions. One example is the yeast transcription
factor GCN4.79 Under logarithmic growth in rich medium,
GCN4’s protein-per-mRNA ratio is very low, as the gene is
transcribed but not translated due to interference of
several uORFs in the mRNA’s 50UTR. Under amino acid
deprivation, however, GCN4 translation is activated, allowing
the transcription factor to regulate genes of the starvation
response.
Table 2 Protein and matching mRNA measurements in various organisms. The table lists publications of absolute mRNA and matching proteinconcentrations, as far as quantitative information was available. We show the squared Pearson correlation coefficient R2 even if some publicationsquoted an unsquared R. In addition or instead, some publications provide the Spearman rank correlation coefficient Rs. All correlations aresignificant at a P-value o 0.001, unless marked as %. LC-MS/MS: liquid chromatography-tandem mass spectrometry; APEX: absolute proteinexpression; SAGE: serial analysis of gene expression; emPAI: exponentially modified protein abundance index; TAP: tandem affinity purification;LC: liquid chromatography; 2D-PAGE: two-dimensional polyacrylamide gel electrophoresis; MALDI-MS: matrix-assisted laser desorption/ionization mass spectrometry; SCX: strong cation exchange chromatography
Correlation
Organism N Method Comments Ref.R2 Rs
Bacteria0.20–0.28 0.39–0.46 Desulfovibrio vulgaris 392–427 LC-MS/MS vs. NimbleGen
microarrays3 conditions: lactate-exponential,formate-exponential,lactate-stationary
99,107
0.42 0.64 E. coli 1147 LC-MS/MS vs. Affymetrixmicroarrays
To estimate protein concentration,we normalized the reported uniquepeptide count by the predictednumber of peptides
184
0.47 0.69 E. coli 437 LC-MS/MS vs. SAGE andmicroarrays
APEX74 for protein quantitation 74
0.40 — Streptomycescoelicolor
894 LC-MS/MS vs. microarrays emPAI96 vs. mRNA/gDNA forquantitation
185
Uni-cellular eukaryotes0.87 — Saccharomyces
cerevisiae106 2D-PAGE vs. SAGE Correlation highly biased by a
small number of genes with verylarge protein and mRNA levels
186,187
0.58 0.74 S. cerevisiae 66 2D-PAGE vs. SAGE, Affymetrixmicroarrays
— 70
0.44 — S. cerevisiae 2044 MudPIT and 2D-PAGE datasetsvs. Affymetrix microarrays, SAGE
Higher and lower correlations atspecific subsets (subcellularlocation and functional groups)
92
— 0.57 S. cerevisiae 4251 TAP/Western vs. Affymetrixmicroarrays
— 71
— 0.58 S. cerevisiae 3600 Proteomic datasets from ref. 71and 92 vs. microarrays, SAGE
— 76
0.73 0.85 S. cerevisiae 346 LC-MS/MS, 2D-PAGE, WesternBlot vs. SAGE and microarrays
APEX74 for protein quantitation 74
0.42 — S. cerevisiae 4600 Proteomic datasets from ref. 71and 188 vs. deep sequencing ofribosome-bound mRNAs
— 52
0.34 0.61 Schizosaccharomycespombe
1367 LC-MS/MS vs. microarrays — 114
— 0.37–0.60 P. falciparum 340–949 LC-MS/MS vs. microarrays Several time-points of the lifecell cycle
116
Multi-cellular eukaryotes0.27–0.46 0.68 A. thaliana
(mustard weed)4105 LC-MS/MS vs. microarrays 6 different organs; APEX74 for
protein quantitation118
— 0.44–0.59 C. elegans(nematode worm)
2695 SCX, LC-MS/MS vs. Affymetrixmicroarrays and SAGE
Protein-Affymetrix andprotein-SAGE
75
— 0.36–0.66 D. melanogaster(fruit fly)
2695 SCX, LC-MS/MS vs. Affymetrixmicroarrays and SAGE
Protein-Affymetrix andprotein-SAGE
75
0.23% — H. sapiens 19 2D-PAGE vs. transcript imaging Liver 120— 40.24% H. sapiens 28 2D-PAGE, MALDI-MS vs.
Affymetrix microarrays76 lung adenocarcinomas and 9non-neoplastic lung tissues
189
None — H. sapiens 3 — Prostate; MMP2, MMP9, TIMP1 1900–0.40 — H. sapiens 58 Immunohistochemistry vs.
Affymetrix and Agilentmicroarrays.
58 antigens in different prostatecell types
93
0.09% — H. sapiens 71 2D-PAGE vs. Affymetrixmicroarrays
Monocytes from 30 unrelatedwomen; Correlations varied indifferent biological categories ofgene ontology
191
0.29 0.46 H. sapiens 1025 LC-MS/MS data from ref. 94vs. NimbleGen microarrays
Daoy medulloblastoma cell line;APEX74 for proteinquantitation; this study
This paper
This journal is �c The Royal Society of Chemistry 2009 Mol. BioSyst., 2009, 5, 1512–1526 | 1519

Simplifying assumptions
Before outlining what is known about protein-per-mRNA
ratios and their characteristics in different organisms, we
briefly point out simplifying assumptions made in eqn (1) to
(5) which may be addressed in more refined models. First,
future models may incorporate temporal changes in the
mRNA concentration, caused by transcription and mRNA
degradation. Similar to eqn (3), the mRNA concentration
at time t is estimated as a function of kTranscription and
kmRNADegradation, and the integrated term is substituted for R
in eqn (2):
dP/dt = kTranslation(C0e�kmRNADegradationt
+ kTranscription/kmRNADegradation) � kProteinDegradationP
(6)
A detailed derivation and discussion of eqn (6) are provided by
Hargrove and Schmidt.80
Second, future studies may include non-linear or
non-parametric approaches. Indeed, protein and mRNA
concentrations correlate better at log- than at linear-scale
(Fig. 3), and thus protein degradation in eqn (2)
(kProteinDegradationP) may be replaced by kProteinDegradationlog(P)
or higher-order equations such as kProteinDegradationP +
k2ProteinDegradationP2 + . . . To address the non-linearity of
biological processes, we use a non-parametric correlation
coefficient in comparisons of protein and mRNA concentrations,
i.e. Spearman rank Rs (Table 2). In contrast to Pearson’s R2,
Rs measures the correspondence between rank-ordered data
points disregarding the actual value. In Table 2 we list both R2
and Rs for a variety of organisms.
Third, a refined model of protein production and turnover
may treat translation not as a rate constant, but as a function
of other variables. For example, the translation ‘rate’ of a
protein is a composite of the rate of peptide bond formation
between amino acids,78 and a gene-specific translation rate
which depends on ribosome occupancy and density,51 but also
on tRNA availability. Ribosome occupancy and density along
the mRNA, in turn, are influenced by the cellular ribosome
concentration, as well as sequence properties and secondary
structures of the mRNA that may help or hinder ribosome
attachment. Thus, a more complex model may treat trans-
lation as a function of mRNA and protein concentrations,
ribosome, tRNA or amino acid concentrations, or for example
the expression of translation and other regulatory factors.
Changes in protein localization as well as time delays between
transcription, translation and degradation may also be
included. Similar reasoning applies to kProteinDegradation.
Finally, the relationships discussed above do not include
stochasticity in gene expression. Stochastic variation, i.e.
noise, occurs both during measurement of the participating
variables (measurement noise), as well as during gene
expression per se (biological noise). Biological noise originates
from inherent stochasticity of biochemical processes,
differences across individual cells in a population, subtle
environmental differences and genetic mutations.81 Noise can
be intrinsic, i.e. inherent to the gene under measurement, or
extrinsic, reflecting global or pathway-specific differences in
expression over time. Noise in gene expression influences
genetic selection and evolution at the molecular and cellular
level.81–84 Stochasticity can be modeled using an additional
term e in eqn (2). It can also be estimated using a discrete
stochastic model in which E(P) is the expected value of the
protein concentration drawn from a Poisson distribution
centered around kProteinProduction/kProteinDegradation,85 in
analogy to eqn (3).
E(P) = kProteinProduction/kProteinDegradation (7)
The relationship between transcription and translation
influences the levels of noise: frequent transcription followed
by inefficient translation results in less intrinsic noise in protein
levels than infrequent transcription followed by efficient
translation.81 Few proteins produced from a large number of
mRNAs result in less noise, and indeed some key regulators in
Escherichia coli have very low translation rates.86 Similarly,
essential genes in yeast have comparatively low rates of
translation.78
Studies assessing the contribution of stochasticity to
translation regulation target individual genes in specific
systems, e.g. ref. 87, or tagged genes in populations allowing
for analysis of single cells.86,88–91 These studies differ from the
genome-wide measurements discussed below; the latter cannot
inform about cell-to-cell variation, but the variation observed
in these measurements is likely to originate primarily from
measurement noise.
Steady-state concentrations of protein molecules
per mRNA and their correlates
For a little over a decade now researchers have been able to
estimate and compare protein and mRNA concentrations
from different organisms (Table 2). While the ‘holy grail’ of
these comparisons seems to lie in finding high correlations,92
correlation coefficients between mRNA and protein
concentrations vary widely across organisms, and are often
surprisingly low. In bacteria, the squared Pearson’s correlation
coefficient (R2) ranges from 0.20 to 0.47, in yeasts from 0.34 to
0.87, and in multi-cellular organisms from 0.09 to 0.46
(Table 2, Fig. 3).
The squared Pearson correlation coefficient describes how
much variation in one variable can be explained by changes in
another variable. For example, the R2 for several recent
measurements lies around a value of B0.4 (Fig. 3D), implying
that B40% of the variance in protein expression can be
explained by changes at the transcript level, B60% by other
changes. While there is a clear and significant correspondence
between the protein and mRNA concentrations in protein
extracts from various organisms, more than half of the
variation in protein concentrations cannot be explained by
variation in mRNA concentrations. The remaining variation
derives from organism-specific regulation of translation
and protein degradation, but also from differences in the
accuracy of the underlying methods that provided the
measurements.
Multi-cellular organisms display, on average, the lowest
correlations between protein and mRNA concentrations
(Table 2, Fig. 3D). Bacteria have slightly lower correlations
than yeast and Plasmodium—which is surprising given that
1520 | Mol. BioSyst., 2009, 5, 1512–1526 This journal is �c The Royal Society of Chemistry 2009

bacteria lack many post-transcriptional regulatory processes
that eukaryotes have. On the other hand, since transcription
regulation of individual genes in bacteria could be limited by
the operon structure of their genome, gene expression may be
fine-regulated at the level of translation leading to a lack of
correlation between protein and mRNA. Of the six human
datasets available only two have significant correlations
(ref. 93 and data from ref. 94; Fig. 3C). However, fruit fly
and worm have high Spearman rank correlations between
protein and mRNA concentrations75 (Table 2; Fig. 3D
excludes these organisms because of missing R2 values).
Our ability to accurately measure protein and mRNA
concentrations influences the observed protein vs. mRNA
correlation, and this ability seems to be improving over time;
the number of highly significant measurements has increased
during the last few years (Fig. 3D). In particular in yeast,
construction of TAP-tagged and GFP-tagged strain
collections71,95 has enabled estimates of protein concentrations
of several thousands of genes, and these measurements are
comparatively accurate. In addition, sensitivity of mass
spectrometry based approaches has improved considerably,
and methods to measure absolute protein concentrations have
been developed.74,96 Single-channel microarray analyses,
SAGE97 and deep sequencing98 have allowed more accurate
measurement of absolute mRNA concentrations. The most
significant (but not the highest) correlation between protein
and mRNA concentrations in yeast (R2 = 0.42, Table 2;
P-value o 10�300, Fig. 3D) stems from a very recent study
which was the first not to use total mRNA, but only trans-
lationally active transcripts, i.e. those that are bound to
ribosomes52 when comparing these to protein measurements.
Sequence characteristics correlating with protein-per-mRNA
ratios
Biological explanations for variation in the protein-
per-mRNA ratio (or lack of correlation between protein and
mRNA concentrations) come from analyses of sequence and
other properties of the respective genes and proteins. The
protein-per-mRNA ratio for a particular gene can be very
high (or very low) because it is necessary for the cell to fine-
regulate translation and/or degradation of the protein product
under the steady-state condition examined. For a given gene,
the protein-per-mRNA ratio can differ depending on the
cellular conditions. As discussed above, several sequence-
encoded features qualify as potential correlates, as they are
assumed to influence the efficiency of translation or protein
degradation (Fig. 2). ‘‘Correlates’’ are characteristics that
correlate significantly with a variable of interest. In an analogy
to factor analysis, correlates could be regarded as factors
whose (linear) combination explains variation in the protein-
per-mRNA ratio.
Below we summarize these findings on correlates of protein-
per-mRNA ratios, mostly coming from analyses in bacteria99
and yeast.70,71,76,100–105 Most of the present studies analyzed
the correlation of each sequence feature individually with the
protein-per-mRNA ratio in the cell. Such an approach is
useful, but it neglects the inter-correlation between different
sequence features, for example, nucleotide composition may
correlate with mRNA secondary structures or with codon
usage. Some studies addressed the inter-correlation by
employing multiple regression and other methods. Whenever
appropriate, we also mention findings on sequence correlates
of translation and degradation rates.
The relationship between protein and mRNA concentrations
also informs about a simple property of gene expression: the
average number of protein molecules produced per mRNA.
In E. coli, this number centers around 560,74 in yeast it is an
order of magnitude larger.70,74 For individual genes, this
number can vary by orders of magnitude. Thus gene
expression comprises an impressive amount of recycling: each
mRNA molecule in the cell is translated into protein several
hundreds to thousands of times before its degradation.
Bacteria
In bacteria, codon usage and amino acid composition have the
strongest correlation with the protein-per-mRNA ratio,
explaining each 410% of the total protein-per-mRNA
variation, respectively.106,107 Other characteristics such as
mRNA stability, protein stability, composition of translation
initiation site (Shine–Dalgarno sequence), start and stop
codon context, or gene length have smaller roles.106,107 This
finding is somewhat unexpected as it suggests translation
regulation at the level of elongation, i.e. choice of codons,
rather than initiation, e.g. Shine–Dalgarno sequence. Codon
usage is commonly assumed to influence translation via tRNA
availability: codons with rare tRNAs slow down translation
and vice versa. A recent analysis in E. coli has shown that
mRNA secondary structure, rather than codon usage,
regulates expression of individual genes.108 For a given gene,
codon usage has no influence on its expression level; however,
the authors suggest that globally, across all genes, optimal
codons were selected for highly expressed genes to maximize
elongation speed.108
Uni-cellular eukaryotes
In yeast, the protein-per-mRNA ratio is also positively
correlated with codon usage, the sequence around the trans-
lation initiation site, and tRNA adaptation.77,109 It is also
correlated with experimental data on translation state,51
protein half-life110 and the mRNA concentration.76,77,110
Minor contributors are mRNA stability, 50UTR secondary
structures, as well as amino acid composition.74 Similarly to
bacteria,100 elongation-related features of translation rather
than initiation-related features affect the protein-per-mRNA
ratio the most.110
Proteins with large protein-per-mRNA ratios tend to be of
low molecular weight;74 consistent with the inverse correlation
between codon adaptation (as a proxy of P/R) and molecular
weight.111 In contrast, mRNA concentration and protein
molecular weight are not correlated112—rendering the
influence of molecular weight (and sequence length) specific
to translation and protein stability. Similarly, mRNA and
protein expression have different impacts on protein structure
and evolutionary rate,113 suggesting distinct pressures
associated with cost of transcription and translation. For
example, while evolutionary rate is negatively correlated with
This journal is �c The Royal Society of Chemistry 2009 Mol. BioSyst., 2009, 5, 1512–1526 | 1521

mRNA expression along the entire sequence, the negative
correlation with protein expression is smaller within a protein
domain, i.e. structured, stable regions, than outside. The
authors relate this to the biologically different roles of the
molecules:113 mRNAs are messengers, while proteins convey
functional benefits.
In fission yeast, deviation from a correlation between
protein and mRNA levels could be explained to some degree
by differential phosphorylation and ubiquitinylation.114 Yeast
mRNAs with weakly folded 50UTRs have higher translation
rates, and higher abundances of the corresponding proteins.115
The authors also found a positive correlation between
transcript half-life and ribosome occupancy that is more
pronounced for short-lived transcripts which suggests competition
between translation and mRNA degradation.115
Gene function influences both the strength of the correlation
between protein and mRNA, and the value of the protein-per-
mRNA ratio. Similar to what has been observed at the level of
transcription regulation, translation regulation under different
conditions results both in generic and in gene-specific
responses.77 In fission yeast, correlation is strong for kinases,
cell cycle genes, signaling and metabolic proteins, but weak in
some protein complexes.114 The same is observed for cell cycle
genes in baker’s yeast when averaging correlations or when
averaging concentrations across a population of cells in
different cell cycle stages.92 In contrast, cell cycle genes from
individual cells in specific cell cycle stages are highly regulated
at the level of transcription, translation and degradation,
and protein and mRNA concentrations will not correlate.
Eukaryotic genes with low protein-per-mRNA ratios may
undergo ‘‘translation on demand’’76 similar to GCN4
mentioned above: translation of the mRNAs is held back
(causing a low protein concentration) until the protein
products are needed.
Extensive proteomics and transcriptomics datasets also exist
for the seven life stages of the uni-cellular protist Plasmodium
falciparum.116 While the authors observed correlation
coefficients of up to R2 = 0.53 (Rs = 0.72) (Table 2), they
could only identify few sequence motifs in the UTRs whose
presence correlated with protein-per-mRNA ratios. A more
recent study revealed extensive post-transcriptional regulation
for 500 Plasmodium proteins, in particular at the level of gene
isoform expression, post-translational modifications, and
temporal delays between transcription and translation.117
Multi-cellular eukaryotes
In contrast to yeast and bacteria, fewer datasets on protein
and matching mRNA concentrations are available for
multi-cellular organisms compared. This lack is mostly due
to the difficulties in large-scale data acquisition, as the
eukaryotic gene structure is more complex than the prokaryotic
one (e.g. splice variants) and tagged libraries as those for yeast
do not exist for whole animal or plant genomes.
A study inCaenorhabditis elegans andDrosophila melanogaster75
confirms the inverse correlation of expression levels with
gene length—however, the authors consider that the mass
spectrometry based protein detection biases against short
genes. The overall correlation between mRNA and protein
concentrations proved to be highly significant, but modest
compared to yeast and bacteria (Table 2); the number of
protein molecules per transcript varies widely. The correlation
is particularly poor for genes of signal transduction and
transcriptional regulation, possibly due to extensive post-
transcriptional regulation, or due to their low (and hence
error-prone) estimated concentrations. This finding for worm
and fly contrasts observations in yeast: genes of signal
transduction had high correlations between protein and
mRNA concentrations.114 In worm and fly, there is no
correlation of the protein-per-mRNA ratio with GC content,
coding sequence or UTR lengths, but there is a weak, but
significant and positive correlation with protein half-lives of
orthologous yeast proteins65 suggesting that protein stability is
one of the major factors determining P/R.
A study in the plant Arabidopsis thaliana describes a good
correlation between protein and mRNA levels (Rs = 0.68 to
0.52, Table 2),118 similar to the correlations observed for worm
and fly. Under dehydration stress, the presence of upstream
start codons, stable 50UTRs and high GC content were found
to repress ribosome attachment and hence translation in
plant.119
In human, these analyses have so far been confounded by
technical limitations: protein expression datasets are either
very small (e.g. for o100 proteins59,120,121) or concentrations
were measured not as absolute quantities, but only relative to
a reference set.63,64,67 The resulting correlations between
protein and mRNA concentrations are very modest
(Table 2, Fig. 3).
Conclusions
The relationship between protein and mRNA concentrations
is a simple measure informing about the combined outcomes
of complex processes: the global steady-state regulation of
translation and protein degradation. Biologically meaningful
variation in protein-per-mRNA ratios depends on our ability
to measure concentrations accurately and at large scale, and
the last years have seen improvements in both methods and
significance of the observed correlations (Fig. 3D). In yeast
and bacteria, and to a lesser extent animals and plants, there is
a substantial and significant correlation between protein and
mRNA concentrations (Table 2, Fig. 3). Typically B30 to
even B85% of the variation in protein levels can be attributed
to variation in mRNA expression. The other 15 to 70% of the
variation is explained by post-transcriptional and post-
translation regulation and by measurement errors. Differences
in the protein vs. mRNA correlation between prokaryotes
and eukaryotes or uni- and multi-cellular organisms are
surprisingly small: the most significant measurements of
protein vs. mRNA concentrations collected during the last
years may center around R2 = 0.4 (Fig. 3D). If this observation
holds true in future, it would imply that the contribution
of translation and protein degradation to gene expression
regulation is similar across organisms, and that the processes
play a large, perhaps even dominant role in regulation of
protein expression levels.
Much attention has been paid to general characteristics of
protein-per-mRNA ratios, in particular those encoded in the
1522 | Mol. BioSyst., 2009, 5, 1512–1526 This journal is �c The Royal Society of Chemistry 2009

gene sequence. We can use these sequence characteristics in
combination with mRNA expression data to explain observed
variation in protein expression levels. Gene length correlates
with protein-per-mRNA ratios in all organisms. It is not clear
why protein length and translational efficiency are linked, and
what the underlying causality may be. Highly abundant
proteins demand efficient and correct folding to avoid
accumulation of toxic unfolded proteins in the cell,111 and
this demand may require short sequences. However, this
reasoning does not explain why ribosome density is lower in
long than in short yeast mRNAs.50,51,112 The variation in
ribosome density may arise from differences in translation
initiation between long and short genes50,51,112 or a decrease in
density along the sequence due to ribosome infidelity. Indeed,
a recent study52 has found high ribosome densities in the first
30 to 40 codons compared to the rest of the sequence. Long
sequences may also be expressed at low levels because their
protein synthesis is energetically more costly, i.e. it requires
more amino acids and cellular energy. Thus, we do not know
whether highly expressed proteins tend to be short because of
their frequent translation, or whether they are frequently
translated because they are short. It is also possible that the
mRNA length has no direct influence on translational
efficiency but is an independent parameter under the same
influence of a third variable, i.e. both are needed for high
expression.
In bacteria and uni-cellular organisms, codon and tRNA
adaptation are strong correlates of the protein-per-
mRNA ratio.77,106,107,109 In multi-cellular organisms,
this relationship has not been demonstrated (yet); however,
we observe it indirectly through a link between codon usage
and gene length, and the link between length and
protein expression discussed above.122,123 Future work may
address in particular multi-cellular organisms, for which
only few large-scale datasets exist. These organisms are
expected to have many more regulatory features
(e.g. miRNAs, translation factors, splicing) than uni-cellular
organisms, and also require more complex regulation,
spatially and temporally, for example in different tissues or
during development.
Gene expression regulation is characterized by extensive
inter-correlations both between rates of transcription, trans-
lation and degradation, and between sequence-encoded
correlates of these. There are positive and statistically signifi-
cant correlations between transcription and translation rates,
protein concentrations and translation, mRNA concentration
and transcription, as well as molecule stabilities in
yeast.65,74,76,77,124 Correspondingly, more abundant mRNAs
tend to be shorter and more efficiently translated as reflected
by their higher ribosome occupancy and, to a lesser extent,
higher ribosome density.16,50,51,125
High protein concentrations can result from both frequent
transcription and high mRNA stability, as well as from
frequent translation and high protein stability. While many
ribosomal proteins maximize all these processes, some
metabolic proteins have high translation rates and are stable,
but transcription rate is relatively low.126 Protein stability
usually concurs with translation, i.e. proteins of high trans-
lation levels are also stable. In contrast, mRNA stability often
opposes transcription.112,126 Less stable molecules are costly
for the cell, but allow flexible responses to environmental
stimuli,127 i.e. low molecule stability may be appropriate for
genes whose expression needs to change rapidly, for example
genes of the TCA cycle, glycolysis and gluconeogenesis in
yeast.126 The coordination between changes in transcription
and translation in response to stimuli has been termed
‘‘potentiation’’:53 genes that are upregulated in their transcrip-
tion under different conditions also become more efficiently
translated. Inter-correlations between variables suggest that
the underlying causality between the measures is highly
complex. During evolution, gene expression regulation has
been optimized at multiple levels, and there are different
strategies of gene expression regulation. To account for these
inter-correlations between variables, future work needs
to include multivariate methods, just as factor analysis or
multiple regression.
Some surprising findings have emerged from the studies
discussed here. For example, evidence in both bacteria and
yeast suggests that elongation, rather than translation
initiation, is the pre-dominant step during translation and its
influence on the protein-per-mRNA ratio—which is surprising
as in multi-step reactions it is often the first step that is
rate-limiting and tightly regulated. Further, recent work has
pointed to an interesting twist in the relationship between
transcription and translation. Both between fission and
budding yeast126 as well as between fruit fly and nematode
worm75 protein expression levels appear to be more conserved
than mRNA expression levels of the respective orthologous
genes. The observation is unexpected since much of divergence
between organisms has been attributed to rapid changes at the
level of transcription regulation, e.g. ref. 128. If this is true,
translation and protein degradation regulation must have
diverged as rapidly to counteract the trends at the tran-
scription level and to produce protein concentrations that
are similar across organisms. However, proteins are the
active species in the cell, and hence protein levels may be
required to be more conserved than mRNA levels, similar to
amino acid sequences being better conserved than nucleotide
sequences. To what extent the finding may be an artifact of
limited dynamical ranges of protein expression data or may
be real remains to be shown. Polysomal profiling, for
example, has shown that translation efficiency is largely
conserved between fission and budding yeast.16 More work
will have to be done to resolve these contradictions, and other
surprises may come once we obtain more large-scale datasets
on mRNA and matching protein concentrations, in particular
for human.
Acknowledgements
We thank Georg Stadler for advice and useful discussions.
This work was supported by the Children’s Cancer Research
Institute (to RSA and LOFP), the NIH (to LOFP and EMM),
NHGRI (to LOFP), and NSF (to EMM), the Welch (F-1515,
to EMM), Tengg (to LOFP), and Packard (to EMM)
Foundations, and the International Human Frontier Science
Program (to CV).
This journal is �c The Royal Society of Chemistry 2009 Mol. BioSyst., 2009, 5, 1512–1526 | 1523

References
1 F. Gebauer and M. W. Hentze, Nat. Rev. Mol. Cell Biol., 2004,5(10), 827–835.
2 A. Ciechanover, Nat. Rev. Mol. Cell Biol., 2005, 6(1), 79–87.3 A. Marintchev and G. Wagner, Q. Rev. Biophys., 2004, 37(3–4),197–284.
4 L. D. Kapp and J. R. Lorsch, Annu. Rev. Biochem., 2004, 73,657–704.
5 G. Hernandez, Trends Biochem. Sci., 2009, 34(4), 166–175.6 T. E. Graber and M. Holcik,Mol. BioSyst., 2007, 3(12), 825–834.7 M. E. Filbin and J. S. Kieft, Curr. Opin. Struct. Biol., 2009, 19(3),267–276.
8 M. Kozak, J. Cell Biol., 1989, 108(2), 229–241.9 M. Kozak, Gene, 1999, 234(2), 187–208.10 M. Kozak, J. Cell Biol., 1991, 115(4), 887–903.11 S. E. Calvo, D. J. Pagliarini and V. K. Mootha, Proc. Natl. Acad.
Sci. U. S. A., 2009, 106(18), 7507–7512.12 J. Pelletier and N. Sonenberg, Biochem. Cell Biol., 1987, 65(6),
576–581.13 G. J. Browne and C. G. Proud, Eur. J. Biochem., 2002, 269(22),
5360–5368.14 T. Preiss and M. W. Hentze, Nature, 1998, 392(6675), 516–520.15 D. C. Schwartz and R. Parker, Mol. Cell. Biol., 1999, 19(8),
5247–5256.16 D. H. Lackner, T. H. Beilharz, S. Marguerat, J. Mata, S. Watt,
F. Schubert, T. Preiss and J. Bahler, Mol. Cell, 2007, 26(1),145–155.
17 Y. Wang, C. L. Liu, J. D. Storey, R. J. Tibshirani, D. Herschlagand P. O. Brown, Proc. Natl. Acad. Sci. U. S. A., 2002, 99(9),5860–5865.
18 I. Abaza and F. Gebauer, RNA, 2008, 14(3), 404–409.19 K. Abdelmohsen, Y. Kuwano, H. H. Kim and M. Gorospe, Biol.
Chem., 2008, 389(3), 243–255.20 D. P. Bartel and C. Z. Chen, Nat. Rev. Genet., 2004, 5(5),
396–400.21 M. A. Valencia-Sanchez, J. Liu, G. J. Hannon and R. Parker,
Genes Dev., 2006, 20(5), 515–524.22 F. Mignone, C. Gissi, S. Liuni and G. Pesole, GenomeBiology,
2002, 3(3), reviews0004.1.23 N. Sonenberg and A. G. Hinnebusch, Cell (Cambridge, Mass.),
2009, 136(4), 731–745.24 A. Ralston,Nat. Educ., 2008, 1(1)http://www.nature.com/scitable/
topicpage/Simultaneous-Gene-Transcription-and-Translation-in-Bacteria-1025.
25 M. Kozak, Gene, 2005, 361, 13–37.26 A. Ciechanover, Ann. N. Y. Acad. Sci., 2007, 1116, 1–28.27 M. H. Glickman and A. Ciechanover, Phys. Rev., 2002, 82(2),
373–428.28 X. L. Ang and J. Wade Harper, Oncogene, 2005, 24(17), 2860–2870.29 T. Ravid and M. Hochstrasser, Nat. Rev. Mol. Cell Biol., 2008,
9(9), 679–690.30 A. Bachmair, D. Finley and A. Varshavsky, Science, 1986,
234(4773), 179–186.31 S. Rogers, R. Wells and M. Rechsteiner, Science, 1986, 234(4774),
364–368.32 M. L. Spencer, M. Theodosiou and D. J. Noonan, J. Biol. Chem.,
2004, 279(35), 37069–37078.33 M. Rechsteiner and S. W. Rogers, Trends Biochem. Sci., 1996,
21(7), 267–271.34 H. J. Dyson and P. E. Wright, Nat. Rev. Mol. Cell Biol., 2005,
6(3), 197–208.35 P. Tompa, J. Prilusky, I. Silman and J. L. Sussman, Proteins:
Struct., Funct., Bioinf., 2008, 71(2), 903–909.36 J. Gsponer, M. E. Futschik, S. A. Teichmann and M. M. Babu,
Science, 2008, 322(5906), 1365–1368.37 L. O. Martinez, B. Agerholm-Larsen, N. Wang, W. Chen and
A. R. Tall, J. Biol. Chem., 2003, 278(39), 37368–37374.38 Z. E. Floyd and J. M. Stephens, J. Biol. Chem., 2002, 277(6),
4062–4068.39 H. C. Yen, Q. Xu, D. M. Chou, Z. Zhao and S. J. Elledge,
Science, 2008, 322(5903), 918–923.40 S. Vijay-Kumar, C. E. Bugg, K. D. Wilkinson, R. D. Vierstra,
P. M. Hatfield and W. J. Cook, J. Biol. Chem., 1987, 262(13),6396–6399.
41 M. W. Lake, M. M. Wuebbens, K. V. Rajagopalan andH. Schindelin, Nature, 2001, 414(6861), 325–329.
42 C. Wang, J. Xi, T. P. Begley and L. K. Nicholson, Nat. Struct.Biol., 2001, 8(1), 47–51.
43 M. J. Pearce, J. Mintseris, J. Ferreyra, S. P. Gygi andK. H. Darwin, Science, 2008, 322(5904), 1104–1107.
44 L. O. Penalva and J. D. Keene, Biotechniques, 2004, 37(4), 604,606, 608–610.
45 S. A. Tenenbaum, C. C. Carson, P. J. Lager and J. D. Keene,Proc. Natl. Acad. Sci. U. S. A., 2000, 97(26), 14085–14090.
46 J. P. Doyle, J. D. Dougherty, M. Heiman, E. F. Schmidt,T. R. Stevens, G. Ma, S. Bupp, P. Shrestha, R. D. Shah,M. L. Doughty, S. Gong, P. Greengard and N. Heintz, Cell(Cambridge, Mass.), 2008, 135(4), 749–762.
47 M. Heiman, A. Schaefer, S. Gong, J. D. Peterson, M. Day,K. E. Ramsey, M. Suarez-Farinas, C. Schwarz, D. A. Stephan,D. J. Surmeier, P. Greengard and N. Heintz, Cell (Cambridge,Mass.), 2008, 135(4), 738–748.
48 T. Inada, E. Winstall, S. Z. Tarun, Jr., J. R. Yates, 3rd,D. Schieltz and A. B. Sachs, RNA, 2002, 8(7), 948–958.
49 M. E. Zanetti, I. F. Chang, F. Gong, D. W. Galbraith andJ. Bailey-Serres, Plant Physiol., 2005, 138(2), 624–635.
50 Y. Arava, F. E. Boas, P. O. Brown and D. Herschlag,Nucleic Acids Res., 2005, 33(8), 2421–2432.
51 Y. Arava, Y. Wang, J. D. Storey, C. L. Liu, P. O. Brown andD. Herschlag, Proc. Natl. Acad. Sci. U. S. A., 2003, 100(7),3889–3894.
52 N. T. Ingolia, S. Ghaemmaghami, J. R. Newman andJ. S. Weissman, Science, 2009, 324(5924), 218–223.
53 T. Preiss, J. Baron-Benhamou, W. Ansorge and M. W. Hentze,Nat. Struct. Biol., 2003, 10(12), 1039–1047.
54 V. L. MacKay, X. Li, M. R. Flory, E. Turcott, G. L. Law,K. A. Serikawa, X. L. Xu, H. Lee, D. R. Goodlett, R. Aebersold,L. P. Zhao and D. R. Morris, Mol. Cell. Proteomics, 2004, 3(5),478–489.
55 A. P. Gerber, S. Luschnig, M. A. Krasnow, P. O. Brown andD. Herschlag, Proc. Natl. Acad. Sci. U. S. A., 2006, 103(12),4487–4492.
56 A. P. Gerber, D. Herschlag and P. O. Brown, PLoS Biol., 2004,2(3), e79.
57 D. J. Hogan, D. P. Riordan, A. P. Gerber, D. Herschlag andP. O. Brown, PLoS Biol., 2008, 6(10), e255.
58 V. K. Rajasekhar, A. Viale, N. D. Socci, M. Wiedmann, X. Huand E. C. Holland, Mol. Cell, 2003, 12(4), 889–901.
59 A. Grolleau, J. Bowman, B. Pradet-Balade, E. Puravs, S. Hanash,J. A. Garcia-Sanz and L. Beretta, J. Biol. Chem., 2002, 277(25),22175–22184.
60 A. Raghavan, R. L. Ogilvie, C. Reilly, M. L. Abelson,S. Raghavan, J. Vasdewani, M. Krathwohl and P. R. Bohjanen,Nucleic Acids Res., 2002, 30(24), 5529–5538.
61 E. Yang, E. van Nimwegen, M. Zavolan, N. Rajewsky,M. Schroeder, M. Magnasco and J. E. Darnell, Jr., GenomeRes., 2003, 13(8), 1863–1872.
62 H. A. Meijer, M. Bushell, K. Hill, T. W. Gant, A. E. Willis,P. Jones and C. H. de Moor, Nucleic Acids Res., 2007, 35(19),e132.
63 D. Baek, J. Villen, C. Shin, F. D. Camargo, S. P. Gygi andD. P. Bartel, Nature, 2008, 455(7209), 64–71.
64 M. Selbach, B. Schwanhausser, N. Thierfelder, Z. Fang,R. Khanin and N. Rajewsky, Nature, 2008, 455(7209), 58–63.
65 A. Belle, A. Tanay, L. Bitincka, R. Shamir and E. K. O’Shea,Proc. Natl. Acad. Sci. U. S. A., 2006, 103(35), 13004–13009.
66 B. Lin, J. T. White, W. Lu, T. Xie, A. G. Utleg, X. Yan, E. C. Yi,P. Shannon, I. Khrebtukova, P. H. Lange, D. R. Goodlett,D. Zhou, T. J. Vasicek and L. Hood, Cancer Res., 2005, 65(8),3081–3091.
67 R. D. Unwin, D. L. Smith, D. Blinco, C. L. Wilson, C. J. Miller,C. A. Evans, E. Jaworska, S. A. Baldwin, K. Barnes, A. Pierce,E. Spooncer and A. D. Whetton, Blood, 2006, 107(12),4687–4694.
68 T. F. Orntoft, T. Thykjaer, F. M. Waldman, H. Wolf andJ. E. Celis, Mol. Cell. Proteomics, 2002, 1(1), 37–45.
69 Q. Tian, S. B. Stepaniants, M. Mao, L. Weng, M. C. Feetham,M. J. Doyle, E. C. Yi, H. Dai, V. Thorsson, J. Eng, D. Goodlett,J. P. Berger, B. Gunter, P. S. Linseley, R. B. Stoughton,
1524 | Mol. BioSyst., 2009, 5, 1512–1526 This journal is �c The Royal Society of Chemistry 2009

R. Aebersold, S. J. Collins, W. A. Hanlon and L. E. Hood,Mol. Cell. Proteomics, 2004, 3(10), 960–969.
70 B. Futcher, G. I. Latter, P. Monardo, C. S. McLaughlin andJ. I. Garrels, Mol. Cell. Biol., 1999, 19(11), 7357–7368.
71 S. Ghaemmaghami, W. K. Huh, K. Bower, R. W. Howson,A. Belle, N. Dephoure, E. K. O’Shea and J. S. Weissman,Nature, 2003, 425(6959), 737–741.
72 J. R. Newman, S. Ghaemmaghami, J. Ihmels, D. K. Breslow,M. Noble, J. L. Derisi and J. S. Weissman, Nature, 2006, 441,840–846.
73 A. A. Cohen, N. Geva-Zatorsky, E. Eden, M. Frenkel-Morgenstern, I. Issaeva, A. Sigal, R. Milo, C. Cohen-Saidon,Y. Liron, Z. Kam, L. Cohen, T. Danon, N. Perzov and U. Alon,Science, 2008, 322(5907), 1511–1516.
74 P. Lu, C. Vogel, R. Wang, X. Yao and E. M. Marcotte,Nat. Biotechnol., 2007, 25(1), 117–124.
75 S. P. Schrimpf, M. Weiss, L. Reiter, C. H. Ahrens, M. Jovanovic,J. Malmstrom, E. Brunner, S. Mohanty, M. J. Lercher,P. E. Hunziker, R. Aebersold, C. von Mering andM. O. Hengartner, PLoS Biol., 2009, 7(3), e48.
76 A. Beyer, J. Hollunder, H. P. Nasheuer and T. Wilhelm,Mol. Cell. Proteomics, 2004, 3(11), 1083–1092.
77 R. Brockmann, A. Beyer, J. J. Heinisch and T. Wilhelm,PLoS Comput. Biol., 2007, 3(3), e57.
78 H. B. Fraser, A. E. Hirsh, G. Giaever, J. Kumm and M. B. Eisen,PLoS Biol., 2004, 2(6), e137.
79 T. E. Dever, Cell (Cambridge, Mass.), 2002, 108(4), 545–556.80 J. L. Hargrove and F. H. Schmidt, FASEB J., 1989, 3(12),
2360–2370.81 J. M. Raser and E. K. O’Shea, Science, 2005, 309(5743),
2010–2013.82 L. Lopez-Maury, S. Marguerat and J. Bahler, Nat. Rev. Genet.,
2008, 9(8), 583–593.83 J. Ansel, H. Bottin, C. Rodriguez-Beltran, C. Damon,
M. Nagarajan, S. Fehrmann, J. Francois and G. Yvert, PLoSGenet., 2008, 4(4), e1000049.
84 B. Lehner, Mol. Syst. Biol., 2008, 4, 170.85 D. J. Wilkinson, Nat. Rev. Genet., 2009, 10(2), 122–133.86 E. M. Ozbudak, M. Thattai, I. Kurtser, A. D. Grossman and
A. van Oudenaarden, Nat. Genet., 2002, 31(1), 69–73.87 A. M. Kierzek, J. Zaim and P. Zielenkiewicz, J. Biol. Chem., 2001,
276(11), 8165–8172.88 K. Ahmad and S. Henikoff, Cell (Cambridge, Mass.), 2001,
104(6), 839–847.89 N. Rosenfeld, J. W. Young, U. Alon, P. S. Swain and
M. B. Elowitz, Science, 2005, 307(5717), 1962–1965.90 W. J. Blake, K. A. M, C. R. Cantor and J. J. Collins,
Nature, 2003, 422(6932), 633–637.91 J. M. Raser and E. K. O’Shea, Science, 2004, 304(5678),
1811–1814.92 D. Greenbaum, C. Colangelo, K. Williams and M. Gerstein,
GenomeBiology, 2003, 4(9), 117.93 L. E. Pascal, L. D. True, D. S. Campbell, E. W. Deutsch,
M. Risk, I. M. Coleman, L. J. Eichner, P. S. Nelson andA. Y. Liu, BMC Genomics, 2008, 9, 246.
94 S. R. Ramakrishnan, C. Vogel, J. T. Prince, Z. Li, L. O. Penalva,M. Myers, E. M. Marcotte, D. P. Miranker and R. Wang,Bioinformatics, 2009, 25(11), 1397–1403.
95 R. Howson, W. K. Huh, S. Ghaemmaghami, J. V. Falvo,K. Bower, A. Belle, N. Dephoure, D. D. Wykoff,J. S. Weissman and E. K. O’Shea, Comp. Funct. Genomics,2005, 6(1–2), 2–16.
96 Y. Ishihama, Y. Oda, T. Tabata, T. Sato, T. Nagasu,J. Rappsilber and M. Mann, Mol. Cell. Proteomics, 2005, 4(9),1265–1272.
97 V. E. Velculescu, L. Zhang, B. Vogelstein and K. W. Kinzler,Science, 1995, 270(5235), 484–487.
98 B. T. Wilhelm and J. R. Landry, Methods, 2009, 48(3), 249–257.99 L. Nie, G. Wu and W. Zhang, Biochem. Biophys. Res. Commun.,
2006, 339(2), 603–610.100 G. Lithwick and H. Margalit, Genome Res., 2003, 13(12),
2665–2673.101 A. Mehra and V. Hatzimanikatis, Biophys. J., 2006, 90(4), 1136–1146.102 A. Mehra, K. H. Lee and V. Hatzimanikatis, Biotechnol. Bioeng.,
2003, 84(7), 822–833.
103 P. M. Kane, J. Biol. Chem., 1995, 270(28), 17025–17032.104 P. M. Sharp and G. Matassi, Curr. Opin. Genet. Dev., 1994, 4(6),
851–860.105 M. P.Washburn, D.Wolters and J. R. Yates, 3rd,Nat. Biotechnol.,
2001, 19(3), 242–247.106 L. Nie, G. Wu, F. J. Brockman and W. Zhang, Bioinformatics,
2006, 22(13), 1641–1647.107 L. Nie, G. Wu and W. Zhang, Genetics, 2006, 174(4), 2229–2243.108 G. Kudla, A. W. Murray, D. Tollervey and J. B. Plotkin,
Science, 2009, 324(5924), 255–258.109 O. Man and Y. Pilpel, Nat. Genet., 2007, 39(3), 415–421.110 G. Wu, L. Nie and W. Zhang, Curr. Microbiol., 2008, 57(1),
18–22.111 D. A. Drummond, J. D. Bloom, C. Adami, C. O. Wilke and
F. H. Arnold, Proc. Natl. Acad. Sci. U. S. A., 2005, 102(40),14338–14343.
112 D. H. Lackner and J. Bahler, Int. Rev. Cell Mol. Biol., 2008, 271,199–251.
113 M. Eames and T. Kortemme, Structure (London), 2007, 15(11),1442–1451.
114 M. W. Schmidt, A. Houseman, A. R. Ivanov and D. A. Wolf,Mol. Syst. Biol., 2007, 3, 79.
115 M. Ringner and M. Krogh, PLoS Comput. Biol., 2005, 1(7), e72.116 K. G. Le Roch, J. R. Johnson, L. Florens, Y. Zhou,
A. Santrosyan, M. Grainger, S. F. Yan, K. C. Williamson,A. A. Holder, D. J. Carucci, J. R. Yates, 3rd andE. A. Winzeler, Genome Res., 2004, 14(11), 2308–2318.
117 B. J. Foth, N. Zhang, S. Mok, P. R. Preiser and Z. Bozdech,GenomeBiology, 2008, 9(12), R177.
118 K. Baerenfaller, J. Grossmann, M. A. Grobei, R. Hull,M. Hirsch-Hoffmann, S. Yalovsky, P. Zimmermann,U. Grossniklaus, W. Gruissem and S. Baginsky, Science, 2008,320(5878), 938–941.
119 R. Kawaguchi and J. Bailey-Serres, Nucleic Acids Res., 2005,33(3), 955–965.
120 L. Anderson and J. Seilhamer, Electrophoresis, 1997, 18(3–4),533–537.
121 M. N. Harris, B. Ozpolat, F. Abdi, S. Gu, A. Legler,K. G. Mawuenyega, M. Tirado-Gomez, G. Lopez-Beresteinand X. Chen, Blood, 2004, 104(5), 1314–1323.
122 H. Miyasaka, J. Mol. Evol., 2002, 55(1), 52–64.123 L. Duret and D. Mouchiroud, Proc. Natl. Acad. Sci. U. S. A.,
1999, 96(8), 4482–4487.124 J. Garcia-Martinez, F. Gonzalez-Candelas and J. E. Perez-Ortin,
GenomeBiology, 2007, 8(10), R222.125 J. Warringer and A. Blomberg, BMC Evol. Biol., 2006, 6, 61.126 T. Tuller, M. Kupiec and E. Ruppin, PLoS Comput. Biol., 2007,
3(12), e248.127 G. Yagil, Curr. Top. Cell. Regul., 1975, 9, 183–236.128 R. P. Zinzen and E. E. Furlong, GenomeBiology, 2008, 9(11), 240.129 F. C. Holstege, E. G. Jennings, J. J. Wyrick, T. I. Lee,
C. J. Hengartner, M. R. Green, T. R. Golub, E. S. Lander andR. A. Young, Cell (Cambridge, Mass.), 1998, 95(5), 717–728.
130 J. T. Rogers, A. I. Bush, H. H. Cho, D. H. Smith,A. M. Thomson, A. L. Friedlich, D. K. Lahiri, P. J. Leedman,X. Huang and C. M. Cahill, Biochem. Soc. Trans., 2008, 36(6),1282–1287.
131 C. M. Cahill, D. K. Lahiri, X. Huang and J. T. Rogers, Biochim.Biophys. Acta, Gen. Subj., 2009, 1790(7), 615–628.
132 S. A. Chappell, J. P. LeQuesne, F. E. Paulin, M. L. deSchoolmeester,M. Stoneley, R. L. Soutar, S. H. Ralston, M. H. Helfrich andA. E. Willis, Oncogene, 2000, 19(38), 4437–4440.
133 M. Kullmann, U. Gopfert, B. Siewe and L. Hengst, Genes Dev.,2002, 16(23), 3087–3099.
134 J. Coleman and W. K. Miskimins, RNA Biol., 2009, 6(1), 84–89.135 I. M. Chu, L. Hengst and J. M. Slingerland, Nat. Rev. Cancer,
2008, 8(4), 253–267.136 X. Jin, E. Turcott, S. Englehardt, G. J. Mize and D. R. Morris,
J. Biol. Chem., 2003, 278(28), 25716–25721.137 C. Y. Brown, G. J. Mize, M. Pineda, D. L. George and
D. R. Morris, Oncogene, 1999, 18(41), 5631–5637.138 H. P. Harding, I. Novoa, Y. Zhang, H. Zeng, R. Wek,
M. Schapira and D. Ron, Mol. Cell, 2000, 6(5), 1099–1108.139 N. Ghilardi, A. Wiestner and R. C. Skoda, Blood, 1998, 92(11),
4023–4030.
This journal is �c The Royal Society of Chemistry 2009 Mol. BioSyst., 2009, 5, 1512–1526 | 1525

140 M. Cazzola and R. C. Skoda, Blood, 2000, 95(11), 3280–3288.141 K. Leandersson, K. Riesbeck and T. Andersson, Nucleic Acids
Res., 2006, 34(14), 3988–3999.142 N. Kremenevskaja, R. von Wasielewski, A. S. Rao, C. Schofl,
T. Andersson and G. Brabant, Oncogene, 2005, 24(13),2144–2154.
143 E. Blanc, G. L. Roux, J. Benard and G. Raguenez, Oncogene,2005, 24(7), 1277–1283.
144 D. A. Dixon, Prog. Exp. Tumor Res., 2003, 37, 52–71.145 M. Piecyk, S. Wax, A. R. Beck, N. Kedersha, M. Gupta,
B. Maritim, S. Chen, C. Gueydan, V. Kruys, M. Streuli andP. Anderson, EMBO J., 2000, 19(15), 4154–4163.
146 D. A. Dixon, G. C. Balch, N. Kedersha, P. Anderson,G. A. Zimmerman, R. D. Beauchamp and S. M. Prescott,J. Exp. Med., 2003, 198(3), 475–481.
147 F. Balkwill, Cytokine Growth Factor Rev., 2002, 13(2), 135–141.148 J. C. Darnell, O. Mostovetsky and R. B. Darnell, Genes Brain
Behav., 2005, 4(6), 341–349.149 J. C. Darnell, K. B. Jensen, P. Jin, V. Brown, S. T. Warren and
R. B. Darnell, Cell (Cambridge, Mass.), 2001, 107(4), 489–499.150 M. Castets, C. Schaeffer, E. Bechara, A. Schenck,
E. W. Khandjian, S. Luche, H. Moine, T. Rabilloud,J. L. Mandel and B. Bardoni, Hum. Mol. Genet., 2005, 14(6),835–844.
151 E. G. Bechara, M. C. Didiot, M. Melko, L. Davidovic,M. Bensaid, P. Martin, M. Castets, P. Pognonec,E. W. Khandjian, H. Moine and B. Bardoni, PLoS Biol., 2009,7(1), e16.
152 B. Bardoni, L. Davidovic, M. Bensaid and E. W. Khandjian,Expert Rev. Mol. Med., 2006, 8(8), 1–16.
153 H. Kawahara, T. Imai, H. Imataka, M. Tsujimoto,K. Matsumoto and H. Okano, J. Cell Biol., 2008, 181(4),639–653.
154 A. Nakano, Y. Kanemura, K. Mori, E. Kodama, A. Yamamoto,H. Sakamoto, Y. Nakamura, H. Okano, M. Yamasaki andN. Arita, Pediatr. Neurosurg., 2007, 43(4), 279–284.
155 Y. Kanemura, K. Mori, S. Sakakibara, H. Fujikawa, H. Hayashi,A. Nakano, T. Matsumoto, K. Tamura, T. Imai, T. Ohnishi,S. Fushiki, Y. Nakamura, M. Yamasaki, H. Okano and N. Arita,Differentiation, 2001, 68(2–3), 141–152.
156 Y. H. Ma, R. Mentlein, F. Knerlich, M. L. Kruse,H. M. Mehdorn and J. Held-Feindt, J. Neuro-Oncol., 2008,86(1), 31–45.
157 G. M. Seigel, A. S. Hackam, A. Ganguly, L. M. Mandell andF. Gonzalez-Fernandez, Mol. Vision, 2007, 13, 823–832.
158 A. Schulenburg, P. Cech, I. Herbacek, B. Marian, F. Wrba,P. Valent and H. Ulrich-Pur, J. Pathol., 2007, 213(2), 152–160.
159 B. W. Konicek, C. A. Dumstorf and J. R. Graff, Cell Cycle, 2008,7(16), 2466–2471.
160 Y. Mamane, E. Petroulakis, L. Rong, K. Yoshida, L. W. Ler andN. Sonenberg, Oncogene, 2004, 23(18), 3172–3179.
161 H. G. Wendel, R. L. Silva, A. Malina, J. R. Mills, H. Zhu,T. Ueda, R. Watanabe-Fukunaga, R. Fukunaga, J. Teruya-Feldstein, J. Pelletier and S. W. Lowe, Genes Dev., 2007, 21(24),3232–3237.
162 T. O’Connor, K. R. Sadleir, E. Maus, R. A. Velliquette, J. Zhao,S. L. Cole, W. A. Eimer, B. Hitt, L. A. Bembinster, S. Lammich,S. F. Lichtenthaler, S. S. Hebert, B. De Strooper, C. Haass,D. A. Bennett and R. Vassar, Neuron, 2008, 60(6), 988–1009.
163 N. Kondoh, M. Shuda, K. Tanaka, T. Wakatsuki, A. Hada andM. Yamamoto, Anticancer Res., 2001, 21(4A), 2429–2433.
164 H. Kasai, D. Nadano, E. Hidaka, K. Higuchi, M. Kawakubo,T. A. Sato and J. Nakayama, J. Histochem. Cytochem., 2003,51(5), 567–574.
165 H. Wang, L. N. Zhao, K. Z. Li, R. Ling, X. J. Li and L. Wang,BMC Cancer, 2006, 6, 91.
166 T. Kobayashi, Y. Sasaki, Y. Oshima, H. Yamamoto, H. Mita,H. Suzuki, M. Toyota, T. Tokino, F. Itoh, K. Imai andY. Shinomura, Int. J. Mol. Med., 2006, 18(1), 161–170.
167 A. Jordanova, J. Irobi, F. P. Thomas, P. Van Dijck,K. Meerschaert, M. Dewil, I. Dierick, A. Jacobs, E. De Vriendt,V. Guergueltcheva, C. V. Rao, I. Tournev, F. A. Gondim,M. D’Hooghe, V. Van Gerwen, P. Callaerts, L. Van Den Bosch,J. P. Timmermans, W. Robberecht, J. Gettemans,J. M. Thevelein, P. De Jonghe, I. Kremensky andV. Timmerman, Nat. Genet., 2006, 38(2), 197–202.
168 A. Antonellis, S. Q. Lee-Lin, A. Wasterlain, P. Leo, M. Quezado,L. G. Goldfarb, K. Myung, S. Burgess, K. H. Fischbeck andE. D. Green, J. Neurosci., 2006, 26(41), 10397–10406.
169 J. LoPiccolo, G. M. Blumenthal, W. B. Bernstein andP. A. Dennis, Drug Resist. Updates, 2008, 11(1–2), 32–50.
170 A. Cimmino, G. A. Calin, M. Fabbri, M. V. Iorio, M. Ferracin,M. Shimizu, S. E. Wojcik, R. I. Aqeilan, S. Zupo, M. Dono,L. Rassenti, H. Alder, S. Volinia, C. G. Liu, T. J. Kipps,M. Negrini and C. M. Croce, Proc. Natl. Acad. Sci. U. S. A.,2005, 102(39), 13944–13949.
171 M. Fabbri, R. Garzon, A. Cimmino, Z. Liu, N. Zanesi,E. Callegari, S. Liu, H. Alder, S. Costinean, C. Fernandez-Cymering, S. Volinia, G. Guler, C. D. Morrison, K. K. Chan,G. Marcucci, G. A. Calin, K. Huebner and C. M. Croce,Proc. Natl. Acad. Sci. U. S. A., 2007, 104(40), 15805–15810.
172 C. D. Johnson, A. Esquela-Kerscher, G. Stefani, M. Byrom,K. Kelnar, D. Ovcharenko, M. Wilson, X. Wang, J. Shelton,J. Shingara, L. Chin, D. Brown and F. J. Slack, Cancer Res.,2007, 67(16), 7713–7722.
173 M. Li, C. Marin-Muller, U. Bharadwaj, K. H. Chow, Q. Yao andC. Chen, World J. Surg., 2009, 33(4), 667–684.
174 J. F. Chen, T. E. Callis and D. Z. Wang, J. Cell Sci., 2009, 122(1),13–20.
175 C. Hoege, B. Pfander, G. L. Moldovan, G. Pyrowolakis andS. Jentsch, Nature, 2002, 419(6903), 135–141.
176 P. L. Kannouche and A. R. Lehmann, Cell Cycle, 2004, 3(8),1011–1013.
177 M.Welcker and B. E. Clurman,Nat. Rev. Cancer, 2008, 8(2), 83–93.178 D. Frescas andM. Pagano,Nat. Rev. Cancer, 2008, 8(6), 438–449.179 J. Caamano and C. A. Hunter, Clin. Microbiol. Rev., 2002, 15(3),
414–429.180 S. Kempe, H. Kestler, A. Lasar and T. Wirth, Nucleic Acids Res.,
2005, 33(16), 5308–5319.181 L. Wu, Z. Pu, J. Feng, G. Li, Z. Zheng and W. Shen, J. Surg.
Oncol., 2008, 97(5), 439–444.182 O. Staub, I. Gautschi, T. Ishikawa, K. Breitschopf,
A. Ciechanover, L. Schild and D. Rotin, EMBO J., 1997,16(21), 6325–6336.
183 S. Paul, BioEssays, 2008, 30(11–12), 1172–1184.184 R. W. Corbin, O. Paliy, F. Yang, J. Shabanowitz, M. Platt,
C. E. Lyons, Jr., K. Root, J. McAuliffe, M. I. Jordan, S. Kustu,E. Soupene and D. F. Hunt, Proc. Natl. Acad. Sci. U. S. A., 2003,100(16), 9232–9237.
185 K. P. Jayapal, R. J. Philp, Y. J. Kok, M. G. Yap, D. H. Sherman,T. J. Griffin and W. S. Hu, PLoS One, 2008, 3(5), e2097.
186 S. P. Gygi, Y. Rochon, B. R. Franza and R. Aebersold,Mol. Cell.Biol., 1999, 19(3), 1720–1730.
187 S. P. Gygi, B. Rist, S. A. Gerber, F. Turecek, M. H. Gelb andR. Aebersold, Nat. Biotechnol., 1999, 17(10), 994–999.
188 L. M. de Godoy, J. V. Olsen, J. Cox, M. L. Nielsen,N. C. Hubner, F. Frohlich, T. C. Walther and M. Mann,Nature, 2008, 455(7217), 1251–1254.
189 G. Chen, T. G. Gharib, C. C. Huang, J. M. Taylor, D. E. Misek,S. L. Kardia, T. J. Giordano, M. D. Iannettoni, M. B. Orringer,S. M. Hanash and D. G. Beer, Mol. Cell. Proteomics, 2002, 1(4),304–313.
190 R. Lichtinghagen, P. B. Musholt, M. Lein, A. Romer,B. Rudolph, G. Kristiansen, S. Hauptmann, D. Schnorr,S. A. Loening and K. Jung, Eur. Urol., 2002, 42(4), 398–406.
191 Y. Guo, P. Xiao, S. Lei, F. Deng, G. G. Xiao, Y. Liu, X. Chen,L. Li, S. Wu, Y. Chen, H. Jiang, L. Tan, J. Xie, X. Zhu, S. Liangand H. Deng, Acta Biochim. Biophys. Sin., 2008, 40(5), 426–436.
1526 | Mol. BioSyst., 2009, 5, 1512–1526 This journal is �c The Royal Society of Chemistry 2009