Molecular BioSystems - RSC Publishing Home
18
This is an Accepted Manuscript, which has been through the Royal Society of Chemistry peer review process and has been accepted for publication. Accepted Manuscripts are published online shortly after acceptance, before technical editing, formatting and proof reading. Using this free service, authors can make their results available to the community, in citable form, before we publish the edited article. We will replace this Accepted Manuscript with the edited and formatted Advance Article as soon as it is available. You can find more information about Accepted Manuscripts in the Information for Authors. Please note that technical editing may introduce minor changes to the text and/or graphics, which may alter content. The journal’s standard Terms & Conditions and the Ethical guidelines still apply. In no event shall the Royal Society of Chemistry be held responsible for any errors or omissions in this Accepted Manuscript or any consequences arising from the use of any information it contains. Accepted Manuscript Molecular BioSystems www.rsc.org/molecularbiosystems
Transcript of Molecular BioSystems - RSC Publishing Home

This is an Accepted Manuscript, which has been through the Royal Society of Chemistry peer review process and has been accepted for publication.
Accepted Manuscripts are published online shortly after acceptance, before technical editing, formatting and proof reading. Using this free service, authors can make their results available to the community, in citable form, before we publish the edited article. We will replace this Accepted Manuscript with the edited and formatted Advance Article as soon as it is available.
You can find more information about Accepted Manuscripts in the Information for Authors.
Please note that technical editing may introduce minor changes to the text and/or graphics, which may alter content. The journal’s standard Terms & Conditions and the Ethical guidelines still apply. In no event shall the Royal Society of Chemistry be held responsible for any errors or omissions in this Accepted Manuscript or any consequences arising from the use of any information it contains.
Accepted Manuscript
Molecular BioSystems
www.rsc.org/molecularbiosystems

Journal Name ►
ARTICLE TYPE
This journal is © The Royal Society of Chemistry [year] [journal], [year], [vol], 00–00 | 1
Features of S-Nitrosylation Based on Statistical Analysis and Molecular
Dynamic Simulation: Cysteine Acidity, Surrounding Basicity, Steric
Hindrance and Local Flexibility
Shangli Cheng,a Ting Shi,
a Xiao-Lei Wang,
a Liang Juan,
a Hongyi Wu,
a Lu Xie,
b Yixue Li,
ab and Yi-Lei
Zhao* ab
5
Received (in XXX, XXX) Xth XXXXXXXXX 20XX, Accepted Xth XXXXXXXXX 20XX
DOI: 10.1039/b000000x
S-Nitrosylation involves in protein functional regulation and cellular signal transduction. Though
intensive efforts were made, the molecular mechanisms of S-nitrosylation were not yet fully understood.
In this work, we carried out a survey on 213 protein structures with S-nitrosylated cysteine sites and 10
molecular dynamic simulations of hemoglobin as a case study. It was observed that the S-nitrosylated
cysteines were of a lower pKa, a higher population of basic residues, a lower population of big-volume
residues in the neighborhood, and higher flexibility, relatively. The case study of hemoglobin showed that,
compared to that in the T-state, the Cysβ93 in the R-state hemoglobin possessed the above structural
features, in agreement with the previous report that the R-state was more reactive in S-nitrosylation. 15
Besides, basic residues moved closer to the Cysβ93 in the dep-R-state hemoglobin, while big-volume
residues approached to the Cysβ93 in the dep-T-state. Using the four characteristics - cysteine acidity,
surrounding basicity, steric hindrance, and local flexibility, a 3-dimensional model of S-nitrosylation was
constructed to explain 61.9% of the S-nitrosylated and 58.1% of the non-S-nitrosylated cysteines. Our
study suggests that cysteine deprotonation is prerequisite for protein S-nitrosylation, and these 20
characteristics might be useful in identifying specificity of protein S-nitrosylation.
Introduction
Thiol group of cysteine is modified toward S-nitrosothiol in
protein S-nitrosylation, and the process is reversible.1,2 25
Accumulating evidences suggest that S-nitrosylation play a key
role in regulation of protein functions,3 human health and
diseases4,5 as well as cellular signaling.6,7 In particular, protein S-
nitrosylation is molecular basis of NO-related cellular signal
transduction.8,9 Many human diseases, such as Parkinson’s 30
disease,10 neurodegeneration11 and cancer,8 even some
physiological processes in plant12 are related with S-nitrosylation.
Biological methods and proteomic experiments are employed to
identify the S-nitrosylated cysteine sites in proteins.13-16
It is reported that S-nitrosylation is highly specific and 35
selective.6,17 However, the mechanism of protein S-nitrosylation
is still unclear.18 Many possible pathways have been reported,
such as 1) the NO depended S-nitrosylation,18,19 2) the trans-S-
nitrosation,20 3) the Cu2+ induced S-nitrosylation in the presence
of NO.21 It is likely that deprotonation of thiol group of cysteine 40
is involved in the pathways.9,18 By using sequence-based
bioinformatical method, the acid-based motif22-24 and a revised
acid-based motif25 were proposed. Besides, structure-based
analyses were reported as well.25,26 For example, based on a few
protein structures, S-nitrosylated cysteines were reported to have 45
a higher predicted pKa values and locate in highly exposed areas
of protein.26 Up to now, few significant characteristics and rare
systematic investigations were found on 3-demensional structures
to explain the selectivity of S-nitrosylation.
A special case of S-nitrosylation is hemoglobin, in which the 50
S-nitrosylation is preferentially formed on Cysβ93 in R-state
hemoglobin, rather than T-state.8 Conformational transition
between R- and T-state hemoglobin, which is caused by
oxygenation and deoxygenation, led to the S-nitrosylation and de-
nitrosylation, respectively.27-29 The Cysβ93 in the R-state 55
hemoglobin is more reactive for S-nitrosylation than that in the T-
state.30 For the physiological significance, S-nitrosylation of
hemoglobin can affect the response of hypoxic vasodilation in
human respiratory cycle.28 According to these reasons,
hemoglobin is selected as a model protein to analyze the process 60
of S-nitrosylation affected by structural changes, rather than
sequence differences.
In our work, we collected 213 structures of S-nitrosylated
proteins from PDB database by BLAST tool (Standard Protein
BLAST in webserver of NCBI). The structure-based 65
investigations on the S-nitrosylated proteins were carried out,
including pKa, atomic distribution, steric hindrance and local
Page 1 of 17 Molecular BioSystems
Mol
ecul
arB
ioS
yste
ms
Acc
epte
dM
anus
crip
t

flexibility. Since the process of S-nitrosylation was related with
the deprotonation of cysteine, the hemoglobin with deprotonated
Cysβ93 was involved in this work. In all, four states of
hemoglobin, including R-state, T-state, dep-R-state (R-state with
deprotonated Cysβ93) and dep-T-state (T-state with deprotonated 5
Cysβ93), were selected to detect dynamic characteristics.
According to the discovered characteristics (Fig. 1), a 3-D
structure-based S-nitrosylation model was constructed, explaining
61.92% of the S-nitrosylated and 58.13% of the non-S-
nitrosylated cysteine sites in the collected proteins. 10
Materials and Methods
Collection of S-nitrosylated proteins
The S-nitrosylated proteins studied in this work were collected in
sequence from the previously reported GPS-SNO paper31 and
references therein (Table S8, ESI†). The structural information of 15
the S-nitrosylated proteins was then obtained by the BLAST tool
and the PDB database. The BLAST thresholds of identity and
positivity were set to be greater than 0.95. Overall 213 proteins
containing 323 S-nitrosylated cysteine sites and 965 non-S-
nitrosylated cysteine sites were obtained. In the redundancy 20
analysis using CD-HIT,32 sequence similarity of 179 S-
nitrosylated proteins was less than 0.7. The CD-HIT was used to
cluster and compare protein sequences by similarity tolerance.
Analysis of pKa
Acidity constant, pKa, can be the quantitative measurement of 25
dissociation of thiol group (-SH). Because some PDB files
contained the non-standard amino acids, they cannot be correctly
recognized by the program of PROPKA 3.1,33 in which the pKa
value was estimated according to coulomb interactions, the
description of internal and the surface residues. In our study, the 30
pKa values of 276 out of S-nitrosylated cysteines and 685 out of
non-S-nitrosylated cysteines were calculated based on protein
structures by the program.
Analysis of neighboring atoms
The atoms of the neighboring residues were analyzed within a 35
series of distant threshold, including 3.5, 4.0, 4.5, 5.0, 5.5, 6.0,
6.5, 7.0, 7.5 and 8.0 Å, where the distance was from the sulfur of
all cysteine sites to the neighboring atoms. The 20 types of amino
acids were grouped into five categories, i.e. polar amino acid (Ser,
Thr, Cys, Pro, Asn, and Gln), acidic amino acid (Asp and Glu), 40
basic amino acid (Lys, Arg, and His), aromatic amino acid (Phe,
Tyr and Trp) and aliphatic amino acid (Gly, Ala, Val, Leu, Ile
and Met).34 Mann-Whitney test was used for the distributional
analysis of the different types of atoms. The percentage
difference value was defined in Formula 1. 45
Where PN(i), NN(i), P and N represent the number of atom(i)
in S-nitrosylated set, the number of atom(i) in non-S-nitrosylated
set, the number of S-nitrosylated cysteines and the number of
non-S-nitrosylated cysteines, respectively. If the percentage
difference value was greater than 0, the type of atoms was high 50
abundant in S-nitrosylated cysteine set, and vice versa.
Analysis of steric hindrance
To analyze of the steric hindrance, the atoms (X) locating in front
of the cysteine residues were selected, with the distance to the
sulfur atom of cysteine less than 8 Å, and the angle of C-S---X 55
larger than 90o, where the C atom was the side-chain carbon, and
the X atom was located in the half ball of 8 Å (Fig. 4). The X
atom could cause steric hindrance in the process of S-
nitrosylation, which might prevent oxidant agents from attacking
the thiol group. 60
Analysis of flexibility
The B-factor reflects the local structural fluctuations. In order to
evaluate the local flexibility of S-nitrosylated or non-S-
nitrosylated cysteine, the B-factor (B-value) of cysteine was
calculated using Karplus algorithm by protein sequences.35 65
Hemoglobin and molecular dynamics simulations
Since the R- and T-state of hemoglobin shared the identical
amino acid sequence with different capacity for S-nitrosylation,36
the interactions between the neighboring amino acid residues and
Cysβ93 site were investigated by molecular dynamics (MD) 70
simulations based on four types of hemoglobins. The four types
of hemoglobins included the R-state, T-state, dep-R-state and
dep-T-state hemoglobins. The initial structures for R- and T-
states of hemoglobin were chosen from 1HHO37 and 2HHB38 in
PDB database. The full α2β2 structure of R-states were 75
constructed with α and β subunits (1HHO) based on symmetry.39
In the preparation of four hemoglobin structures, histidine
residues connecting to the heme were protonated at the δ-position,
while the other histidine residues were protonated at the ε-
position. The hemoglobin molecules were immersed in the 80
octahedral boxes of TIP3P water with 10 Å to the edge. In all, the
systems of R-state, T-state, dep-R-state and dep-T-state contained
8870, 8956, 8864 and 8955 water molecules, respectively. Six
sodium ions in the cases of R-state and T-state40 and eight sodium
ions in the cases of dep-R-state and dep-T-state were added into 85
the water boxes for charge neutralization. In the MD simulations,
the AMBER force field 99SB was used for all amino acids and
heme motif.41 The cut-off of 10.0 Å40 and SHAKE algorithm42,43
were used for the short-range non-bonded and hydrogen bonds
under periodic boundary condition. After the conjugate gradient 90
method was performed under the minimization step, the system
was gradually heated from 0 to 300 K. Finally, the 20 ns
simulations of the R-, T-, dep-R- and dep-T-state hemoglobins
were carried out in the absence of any restraint under conditions
of 300 K, NTP and time-step of 2 fs. Each simulation was 95
repeated for 14 times, with rearranged random number. For each
state of hemoglobin, 280 ns MD simulations were carried out. In
total, 1120 ns MD trajectory were obtained. Typically, the frames
in a range of 5 to 20 ns in each trajectory were used for analysis.
Results and discussions 100
S-Nitrosylated cysteine has a lower pKa
In our work, the pKa values of thiol group in cysteine residue
were calculated using PROPKA 3.1. The results showed that the
pKa value of the S-nitrosylated cysteine (11.54±2.54, using 276
S-nitrosylated cysteine sites) was lower than that of the non-S-105
nitrosylated cysteine (11.95±2.75, using 685 non-S-nitrosylated
cysteine sites) (Fig. 2a). Compared to P-T Doulias’ study26, our
data set covered and expanded the S-nitrosylated cysteines in his
work, where pKa of S-nitrosylated cysteines (10.0±2.10, using
Page 2 of 17Molecular BioSystems
Mol
ecul
arB
ioS
yste
ms
Acc
epte
dM
anus
crip
t

142 S-nitrosylated cysteine sites) was higher than non-S-
nitrosylated cysteines’ (9.88±2.20, using 559 non-S-nitrosylated
cysteine sites) using PROPKA 2.0. If the complete dataset was
used, our results still stood for that the pKa values of S-
nitrosylated (227 sites) and non-S-nitrosylated (638 sites) were 5
calculated as 9.36±3.24 and 9.89±2.68, respectively. We
speculated that a larger data set and updated software might be
responsible for the differences.
Since the average pKa values of S-nitrosylated and non-S-
nitrosylated cysteine were all larger than physiological pH, the 10
cysteines existed mostly in the protonated state. However, the
lower pKa of S-nitrosylated cysteines was suggested that the thiol
group (-SH) of S-nitrosylated cysteine would be relatively more
feasible to be deprotonated than the non-S-nitrosylated cysteines.
Moreover, in the case of hemoglobin, the S-nitrosylation of both 15
R- and T-state Cysβ93 were accelerated under a more basic
environment in previous study.30 Such a pKa (>7.0) does not
grant the formation of thiol anion (RS-) yet, so basic environment
was necessary to enhance the process.
Basic residues around S-nitrosylated cysteines improve and 20
stabilize the deprotonated cysteines
To analyze the physicochemical environments around the sulfur
of cysteine, we extracted the characteristics of atomic distribution
of the 323 S-nitrosylated and 965 non-S-nitrosylated sites.
According to five groups of amino acids, namely polar (S, T, C, P, 25
N and Q), acidic (D and E), basic (K, R and H), aromatic (F, Y
and W) and aliphatic (G, A, V, L, I and M) group, the percentage
difference values (PDVs)44 between S-nitrosylated and non-S-
nitrosylated cysteines were calculated (Fig. 2b, Table S6.1-6.10,
ESI†). The PDVs of different types of atoms were tested using 30
Mann-Whitney test (Table S1-S5, ESI†). Within a range of less
than 6 Å around the sulfur of cysteines, the basic and acidic
residues were of a high abundancy in S-nitrosylated cysteine sites.
It was suggested that S-nitrosylated cysteines distributed in
highly charged environments. This result was consistent with the 35
previous study of -SNO group surrounded by charged
residues,45,46 that is, the basic residues were present highly
frequently in the S-nitrosylated cysteine sites. Among the basic
residues, histidine was abundant in S-nitrosylated cysteines
within 5.0 Å (P<0.05, Table S6.1-6.4, ESI†). These results 40
suggested that a basic environment could facilitate the process of
cysteine deprotonation under physiological pH. Moreover, for the
aromatic and aliphatic groups, Phe (P<0.05, Table S6.3-6.10,
ESI†), Leu (P<0.05, Table S6.3-6.10, ESI†) and Tyr (Table S6.3-
6.10, ESI†) were of high abundancy in the non-S-nitrosylated 45
cysteines in a distance range between 4.5 and 8 Å. These results
demonstrated that a non-polar environment would be disfavored
for S-nitrosylation.
Correspondingly, the hemoglobin MD simulations showed that
more basic residues surrounded Cysβ93 in the R- and dep-R-state 50
hemoglobin. The average distance from sulfur of Cysβ93 to the
neighboring atoms was calculated by the repeated trajectories of
MD simulations. The neighboring basic residues, including
Hisβ92, Hisβ143, Hisβ146, Lysβ95 and Lysβ144, were analyzed
based on different radius around the sulfur atom of Cysβ93. 55
When the distance was set as less than 6 Å, it was observed that
basic residues, especially Hisβ92 and Lysβ144, were presented
more frequently around Cysβ93 in R-state than that in T-state
hemoglobin (Fig. 3a, 3b). When the Cysβ93 was deprotonated in
dep-R-state, basic residues of Hisβ143 and Lysβ144 moved 60
closer to the Cysβ93 (Fig. 3c) and additional hydrogen bonds
were formed between N-H and thiol anion in certain frames (Fig
S1, ESI†) while only Hisβ146 approached to the Cysβ93 in dep-
T-state hemoglobin (Fig. 3d). Thus, the deprotonated Cysβ93
immersed in a more basic environment in the dep-R-state 65
hemoglobin. This indicated that basic amino acid residues likely
stabilized the deprotonated Cysβ93, which might be important in
the process of S-nitrosylation.
Integrating the analysis of 323 S-nitrosylated cysteines (Fig. 2b)
and MD simulations of hemoglobin (Fig. 3), we proposed that 70
basic amino acids, especially histidine, were critical for the S-
nitrosylated cysteines. It was suggested that the basic amino acids
could form basic environment that could be contributive for the
deprotonation of S-nitrosylated cysteines and the stabilization of
deprotonated cysteines. In the collected S-nitrosylated proteins, 75
49 S-nitrosylated proteins with 53 S-nitrosylated cysteines were
in line with this characteristic (Table S7, ESI†).
Steric hindrance inhibits S-nitrosylation
In order to evaluate the steric hindrance caused by the
neighboring atoms around the sulfur of S-nitrosylated and non-S-80
nitrosylated cysteines, we analyzed distributional characteristics
of the neighboring atoms in the half ball of 8 Å (Fig. 4). The S-
nitrosylated cysteines had less neighboring atoms than the non-S-
nitrosylated cysteines, for that the medians and interquartile
ranges were estimated as 48 and 19 for the former, 50 and 12 for 85
the latter, respectively. (P<0.01, with Mann-Whitney test. See Fig
S2, ESI†) When the atoms were attributed to amino acid residues
and ranked by the volume of amino acids, it was found that the
atoms of amino acids with big volume, such as Tyr, Phe, Arg, and
Lue, were more in non-S-nitrosylated cysteines than that in S-90
nitrosylated cysteines (Fig. 4). The steric hindrance caused by
these big-volume residues would affect the attacking of oxidant
agents and the binding of NO group. Also, the previous study
reported that there were more exposing S-nitrosylated cysteines
than non-S-nitrosylated cysteines in protein structure.25 Our 95
results suggested that steric hindrance could disadvantage for the
process of S-nitrosylation.
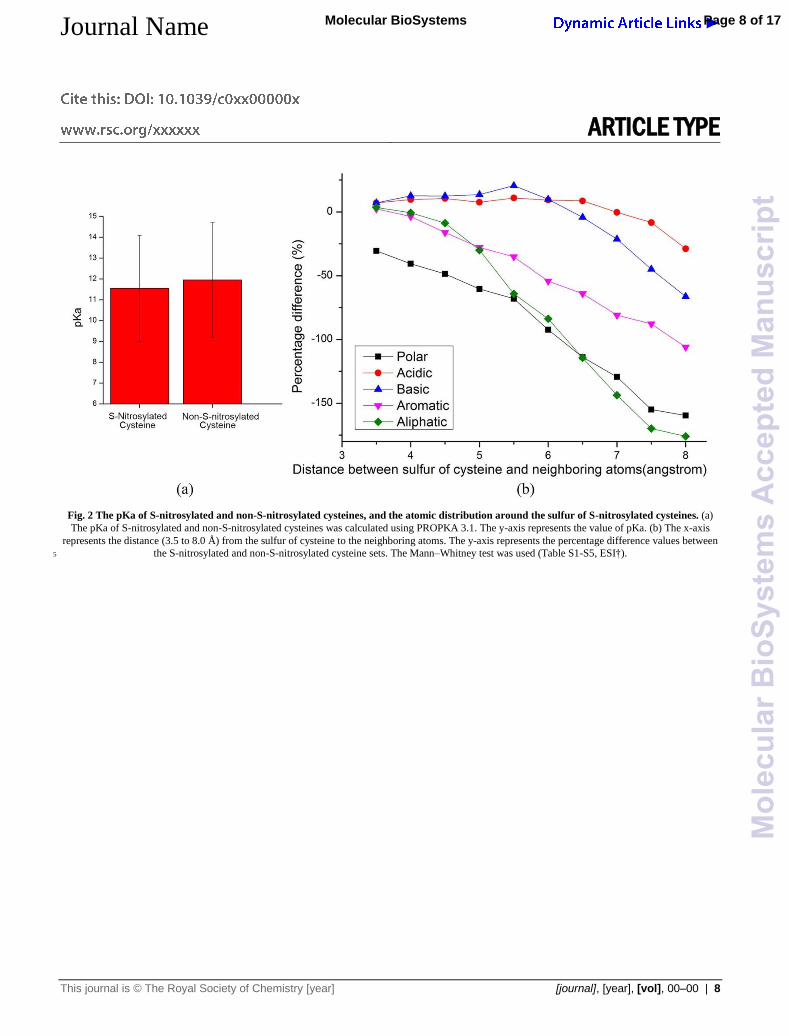
For comparison, the similar statistical analyses were carried
out on the hemoglobin trajectories of MD simulations. The
neighboring aromatic and aliphatic residues with big volume, 100
including Pheβ103, Tyrβ145, Leuβ91 and Leuβ141, were
analyzed based on different cut-off radius around the sulfur of
Cysβ93. For R-, T-, dep-R- and dep-T-state hemoglobin, MD
simulations were repeated for 14 times. The average distances
were calculated from sulfur of Cysβ93 to the neighboring atoms. 105
The results showed that these big-volume residues were closer to
the Cysβ93 in T-state hemoglobin than that in R-state
hemoglobin, especially Tyrβ145 (Fig. 5a, 5b). When the Cysβ93
was deprotonated, the big-volume residues, including Pheβ103,
Tyrβ145 and Leuβ141, moved away in dep-R-state hemoglobin. 110
And these big-volume amino acids were not observed around the
Cysβ93 within the radius of 6 Å in dep-R-state hemoglobin (Fig.
5c). Compared to the dep-R-state hemoglobin, Tyrβ145 was
closed to Cysβ93 in dep-T-state hemoglobin (Fig 5c, 5d).
Based on these analyses, we extracted the characteristic that 115
few residues with big volume located around S-nitrosylated
Page 3 of 17 Molecular BioSystems
Mol
ecul
arB
ioS
yste
ms
Acc
epte
dM
anus
crip
t

cysteine sites in protein structures. This represented less steric
hindrance occurred around S-nitrosylated cysteines. Combined
with the mechanism of oxidant-mediated S-nitrosylation, the big-
volume residues would prevent the oxidant from attacking
cysteine. In summary, it was indicated that steric hindrance 5
would inhibit protein S-nitrosylation. This result was in good
agreement with another oxidant-mediated post-translational
modification of tyrosine nitration.44
S-Nitrosylated cysteines are more flexible
The B-factor can reflect the cysteine’s fluctuation, and it can be 10
used to evaluate the flexibility of cysteine. The B-factor values of
the S-nitrosylated and non-S-nitrosylated cysteines were
calculated using Karplus algorithm. Our calculations indicated
that the S-nitrosylated cysteines (Score was 0.965±0.036) were
more flexible than the non-S-nitrosylated cysteines (Score was 15
0.958±0.035).
For hemoglobin, there were three cysteines, including Cysα104,
Cysβ93 and Cysβ112. The Cysβ93 in R-state can be S-
nitrosylated. The cysteines of Cysα104, Cysβ112 in R-state, as
well as cysteines of Cysα104, Cysβ112 and Cysβ93 in T-state 20
cannot be S-nitrosylated. Thus, these five cysteines were used as
non-S-nitrosylated cysteines. In the MD simulations of
hemoglobin, the results showed that the Cysβ93 in the R-state
had a larger RMSF than other five cysteines in both R- and T-
state hemoglobin (Table 1), suggesting that the S-nitrosylated 25
Cysβ93 was more flexible. It was also found that there was a free
space (26.25 Å3) near the Cysβ93 in the R-state hemoglobin (Fig.
S3, ESI†), which would allow the Cysβ93 to move freely. This
indicated that the Cysβ93 in the R-state hemoglobin would have
more opportunity to contact with oxidant agents. 30
Furthermore, the distribution of dihedral angles (SG-CB-CA-C)
in the Cysβ93 of hemoglobin was obtained, where SG, CB, CA
and C denoted the sulfur atom, the carbon of side chain, the alpha
carbon and the carbon of main chain, respectively. The dihedral
angles in the R-state hemoglobin were stabilized at ~0o (Fig. 6a), 35
while the dihedral angles in the T-state hemoglobin moved back
and forth at ~120o and ~240o (Fig. 6b). Moreover, the dihedral
angles of the Cysβ93 in the dep-R-state hemoglobin were much
more fluctuated, which could adopt ~0o, ~120o and ~240o,
compared to that in the dep-T-state (Fig. 6c, 6d). 40
In brief, the S-nitrosylated cysteines were more flexible in
protein structures. When cysteines were deprotonated, the
dihedral angles of the S-nitrosylated cysteines were more active
and conducive to the sulfur of the S-nitrosylated cysteines
contacting with oxidants. 45
Less Cys residues locate around S-nitrosylated cysteines
By calculating the atomic distribution of sulfur atoms from
neighboring cysteines, we found that the sulfur atoms of these
residues were less available around the S-nitrosylated cysteines
(Fig. 7). The previous study also showed a similar phenomenon 50
that there were less other cysteines in the neighboring region.24
Especially, when the distance was less than 3.5 Å (The disulfide
bond length is about 2.05 Å), the frequency of sulfur atoms of
Cys around S-nitrosylated cysteine sites was much lower than
that around the non-S-nitrosylated (Table S6, ESI†). It was 55
considered that these reductive cysteines would compete with the
cysteines for oxidant agents in the process of S-nitrosylation.
Deprotonation of non-S-nitrosylated cysteines causes
instability of protein structures
Besides the consistent characteristics found in both statistic and 60
molecular simulations, the instability of hemoglobin were noted
when the non-S-nitrosylated cysteine of Cysβ93 was
deprotonated in the dep-T-state hemoglobin. Based on the results
of MD simulations, which were repeated for 14 times, the root-
mean-square deviation (RMSD) of each trajectory was analyzed 65
to evaluate the structural changes in R-, T-, dep-R- and dep-T-
state (Fig. S4, ESI†). To assess the rate of change in hemoglobin
structure during MD simulations, the average differential
coefficient of the RMSD of each trajectory was calculated, where
a larger average differential coefficient meant larger change in 70
protein structure. Thus, for each state of hemoglobin (R-, T-, dep-
R-, and dep-T-state), there were 14 values of average differential
coefficient. According to the distribution of the average
differential coefficient, the structure of dep-T-state hemoglobin
changed largely compared to the dep-R-, T- and R-state (Fig. 8), 75
suggesting a protein structure would become unstable when a
“non-S-nitrosylated” cysteine was deprotonated. Furthermore,
RMSD of each amino acid residue was calculated, and amino
acids with larger RMSF gathered at the loop between Aspβ79 and
Glyβ83 (Fig S5, ESI†). It was proposed that the deprotonation of 80
Cysβ93 might enhance the movement of the loop through
allosteric regulation.
Discussion
In this work, we collected 213 S-nitrosylated proteins with
structural information, containing 323 S-nitrosylated cysteine 85
sites and 965 non-S-nitrosylated cysteine sites. First, compared to
the non-S-nitrosylated cysteines, the S-nitrosylated cysteines had
a lower pKa, a higher abundancy of basic residues, such as His
and Lys, and a lower abundancy of aromatic and aliphatic
residues, such as Phe, Tyr and Leu. The basic residues formed a 90
basic environment around the S-nitrosylated cysteines in S-
nitrosylated proteins, while the aromatic and aliphatic residues
formed non-polar environment around the non-S-nitrosylated. It
was suggested that basic environment could enhance the
cysteines’ deprotonation, which might be an important step in S-95
nitrosylation. Furthermore, in MD simulations of hemoglobin, the
basic residues became closer to the deprotonated Cysβ93 in the
dep-R-state hemoglobin, suggesting that basic environments
formed by basic residues can further stabilize the deprotonated
cysteines. Second, the S-nitrosylated cysteines had a lower 100
population of big-volume residues, such as Phe, Tyr and Leu, in
the half ball of 8 Å. In MD simulations of hemoglobin, Pheβ103
and Tyrβ145 moved away when the Cysβ93 was deprotonated in
the dep-R-state hemoglobin, while Tyrβ145 was closed to
Cysβ93 in dep-T-state hemoglobin. Based on the mechanism of 105
oxidant-mediated S-nitrosylation, the big-volume residues would
prevent oxidant agents from approaching to contact with the
cysteine sites. This indicated that steric hindrance might make
significant contributions to the process of S-nitrosylation. Third,
by the analysis of B-factor, the S-nitrosylated cysteines were 110
more flexible in structures. In MD simulations of hemoglobin, the
Cysβ93 in the R-state hemoglobin had a higher RMSF than that
in the T-state. It was speculated that the flexibility of cysteines
could affect the S-nitrosylation as well. In particular, the proper
Page 4 of 17Molecular BioSystems
Mol
ecul
arB
ioS
yste
ms
Acc
epte
dM
anus
crip
t

fluctuation of the SG-CB-CA-C conformation in dep-R-state
allowed the Cysβ93 sulfur atom to contact NO reagent by chance.
In addition, a low abundancy of the sulfur atoms of neighboring
Cys was observed in S-nitrosylated cysteines.
As we know it that the conformation of hemoglobin was R-5
state in lung, while the hemoglobin was T-state in vein.27 A
probable process of S-nitrosylation was proposed in hemoglobin
according to our analyses. First, under physiological pH, the basic
residues would enhance the deprotonation of the Cysβ93 in R-
state hemoglobin. Second, the basic residues moved closer to the 10
deprotonated Cysβ93 and stabilized it. Third, the big-volume
residues moved away from the deprotonated Cysβ93. Then, in
coordination with high flexibility, the Cysβ93 was S-nitrosylated
by adding NO group in lung. However, there were not these S-
nitrosylated characteristics in T-state hemoglobin. Since the S-15
nitrosylation was reversible, NO was released from the T-state
hemoglobin in vein. This was the blood flow regulation by S-
nitrosylation.
In previous study, S. M. Marino proposed a revised acid-based
motif and a structural model (covered 15 S-nitrosylated 20
proteins).24 In our work, we proposed a 3-dimensional model of
S-nitrosylation associated with the distribution of amino acid
residues in protein structures (Fig. 9). If there were more basic
residues (including His and Lys) and less big-volume residues
(including Phe, Tyr and Leu) around a cysteine, it would be 25
easier for the cysteine to be S-nitrosylated. The reason was that a
cysteine could be deprotonated and stabilized by the neighboring
basic residues. The charged environment formed by basic
residues was necessary for S-nitrosylation.44 Furthermore, less
big-volume residues, which located around cysteine sites in 30
protein structures, would allow NO agent to access the target
cysteines. This model might shed light on the deep
comprehension in the process of S-nitrosylation.
In the model, there were two major conditions: I) atom number
of basic amino acids (His and Lys) were non-zero in a distance 35
less than 5 Å (The distance was from sulfur of cysteine to the
neighboring atoms); II) atom number of big-volume residues (Phe,
Tyr and Leu) were less than twenty two in a distance less than 8
Å (twenty two was the average number of big-volume atoms in
data set). Besides the two main conditions, a minor condition 40
from statistical analysis (Fig 7, Table S1, ESI†) was extracted: III)
no other cysteines existed in a distance less than 5 Å. Under these
three conditions, the 3-D S-nitrosylation model explained 200 out
of 323 S-nitrosylated cysteine sites (61.92%) and 561 out of 965
non-S-nitrosylated cysteine sites (58.13%). 45
Conclusion
In this work, 213 protein structures with 323 S-nitrosylated
cysteine sites and 965 non-S-nitrosylated cysteine sites were
collected to study characteristics of S-nitrosylation using
statistical analyses and MD simulations, where hemoglobin was 50
employed as a case. Four major characteristics were observed,
including 1) a lower pKa, 2) a higher population of basic residues,
3) a lower population of big-volume residues in the neighborhood,
and 4) higher flexibility. The MD simulations of hemoglobin
showed that basic residues could enhance the deprotonation of S-55
nitrosylated cysteines, and the basic environments could further
stabilize the deprotonated cysteines. Moreover, steric hindrance
caused by big-volume residues would play important role in the
process of S-nitrosylation, and the flexibility of cysteines could
also affect the S-nitrosylation. In conclusion, a 3-dimensional 60
model of S-nitrosylation was proposed, which could explain 61.9%
of the S-nitrosylated and 58.1% of the non-S-nitrosylated
cysteines. Our study suggested that deprotonation was a
prerequisite for protein S-nitrosylation, and the model would
improve the understanding of S-nitrosylation in structural 65
characteristics. Much more structural characteristics based on
larger dataset obtained by homology modeling would lead a more
powerful structural model.
Acknowledgements
YLZ, LX, and YXL conceived and designed the investigation. 70
SLC, JL, and HYW performed the structure analyses and MD
simulations. SLC, TS, XLW, and YLZ wrote the paper. This
work is supported in part by National High-Tech R&D Program
of China “863” (No. 2012AA020403) and the National Basic
Research Program of China “973” (Nos. 2012CB721005, 75
2013CB966802), National Science Foundation of China (Nos.
21377085, 21303101, 31121064, J1210047), MOE New Century
Excellent Talents in University (No. NCET-12-0354), and the
SJTU-HPC computing facility award.
Notes and references 80
a State Key Laboratory of Microbial Metabolism, School of Life Sciences
and Biotechnology, Shanghai Jiao Tong University, Shanghai 200240,
China. Fax: +86-21-34207190; Tel: +86-21-34207190; E-mail:
[email protected] b Shanghai Center for Bioinformation Technology, Shanghai 201203, 85
China.
1 D. T. Hess, A. Matsumoto, S. O. Kim, H. E. Marshall and J. S.
Stamler, Nat Rev Mol Cell Bio, 2005, 6, 150-166.
2 M. Benhar, M. T. Forrester and J. S. Stamler, Nat Rev Mol Cell Bio, 90
2009, 10, 721-732.
3 Y. Iwakiri, Nitric Oxide-Biol Ch, 2011, 25, 95-101.
4 M. W. Foster, T. J. McMahon and J. S. Stamler, Trends Mol Med,
2003, 9, 160-168.
5 A. M. Evangelista, M. J. Kohr and E. Murphy, Antioxid Redox Signal, 95
2013, 19, 1209-1219.
6 S. R. Tannenbaum and J. E. Kim, Nat Chem Biol, 2005, 1, 126-127.
7 S. R. Jaffrey, H. Erdjument-Bromage, C. D. Ferris, P. Tempst and S.
H. Snyder, Nat Cell Biol, 2001, 3, 193-197.
8 Z. Q. Wang, Cancer Lett, 2012, 320, 123-129. 100
9 D. D. Thomas and D. Jourd'heuil, Antioxid Redox Signal, 2012, 17,
934-936.
10 J. G. Fang, T. Nakamura, D. H. Cho, Z. Z. Gu and S. A. Lipton, P
Natl Acad Sci USA, 2007, 104, 18742-18747.
11 D. H. Cho, T. Nakamura, J. G. Fang, P. Cieplak, A. Godzik, Z. Gu 105
and S. A. Lipton, Science, 2009, 324, 102-105.
12 C. Lindermayr and J. Durner, J Proteomics, 2009, 73, 1-9.
13 H. Li, X. Xing, G. Ding, Q. Li, C. Wang, L. Xie, R. Zeng and Y. Li,
Mol. Cell. Proteomics, 2009, 8, 1839-1849.
14 G. Hao, B. Derakhshan, L. Shi, F. Campagne and S. S. Gross, P Natl 110
Acad Sci USA, 2006, 103, 1012-1017.
15 F. Torta, V. Usuelli, A. Malgaroli and A. Bachi, Proteomics, 2008, 8,
4484-4494.
16 B. Derakhshan, P. C. Wille and S. S. Gross, Nat Protoc, 2007, 2,
1685-1691. 115
17 D. A. Mitchell and M. A. Marletta, Nat Chem Biol, 2005, 1, 154-158.
18 K. A. Broniowska, Antioxid Redox Signal, 2012, 17, 969.
19 G. Czapski and S. Goldstein, Free Radic Biol Med, 1995, 19, 785-
794.
Page 5 of 17 Molecular BioSystems
Mol
ecul
arB
ioS
yste
ms
Acc
epte
dM
anus
crip
t

20 Y. Yang and J. Loscalzo, P Natl Acad Sci USA, 2005, 102, 117-122.
21 G. Stubauer, A. Giuffre and P. Sarti, J Biol Chem, 1999, 274, 28128-
28133.
22 Y. J. Chen, W. C. Ku, P. Y. Lin, H. C. Chou, K. H. Khoo and Y. J.
Chen, J Proteome Res, 2010, 9, 6417-6439. 5
23 A. Martinez-Ruiz, L. Villanueva, C. Gonzalez de Orduna, D. Lopez-
Ferrer, M. A. Higueras, C. Tarin, I. Rodriguez-Crespo, J. Vazquez
and S. Lamas, P Natl Acad Sci USA, 2005, 102, 8525-8530.
24 Y. Xu, J. Ding, L. Y. Wu and K. C. Chou, PLoS One, 2013, 8,
e55844. 10
25 S. M. Marino and V. N. Gladyshev, J Mol Biol, 2010, 395, 844-859.
26 P. T. Doulias, J. L. Greene, T. M. Greco, M. Tenopoulou, S. H.
Seeholzer, R. L. Dunbrack and H. Ischiropoulos, P Natl Acad Sci
USA, 2010, 107, 16958-16963.
27 T. J. McMahon, Nat Med, 2002, 8, 711-717. 15
28 J. S. Stamler, L. Jia, J. P. Eu, T. J. McMahon, I. T. Demchenko, J.
Bonaventura, K. Gernert and C. A. Piantadosi, Science, 1997, 276,
2034-2037.
29 J. P. Pezacki, N. J. Ship and R. Kluger, J Am Chem Soc, 2001, 123,
4615-4616. 20
30 L. Jia, C. Bonaventura, J. Bonaventura and J. S. Stamler, Nature,
1996, 380, 221-226.
31 Y. Xue, Z. X. Liu, X. J. Gao, C. J. Jin, L. P. Wen, X. B. Yao and J. A.
Ren, PLoS One, 2010, 5, e11290.
32 Li, W. and A. Godzik, Bioinformatics, 2006. 22, 1658-1659. 25
33 M. H. M. Olsson, C. R. Sondergaard, M. Rostkowski and J. H.
Jensen, J Chem Theory Comput, 2011, 7, 525-537.
34 T.-Y. Lee, Y.-J. Chen, T.-C. Lu, H.-D. Huang and Y.-J. Chen, PLoS
One, 2011, 6, e21849.
35 P. Karplus and G. Schulz, Naturwissenschaften, 1985, 72, 212-213. 30
36 D. J. Singel and J. S. Stamler, Annu Rev Physiol, 2005, 67, 99-145.
37 B. Shaanan, J Mol Biol, 1983, 171, 31.
38 G. Fermi, J Mol Biol, 1984, 175, 159.
39 L. Mouawad, D. Perahia, C. H. Robert and C. Guilbert, Biophys J,
2002, 82, 3224-3245. 35
40 O. K. Yusuff, J. O. Babalola, G. Bussi and S. Raugei, J Phys Chem B,
2012, 116, 11004-11009.
41 V. Hornak, R. Abel, A. Okur, B. Strockbine, A. Roitberg and C.
Simmerling, Proteins-Struct Funct Bioinform, 2006, 65, 712-725.
42 J. P. Ryckaert, J. Comput. Phys., 1977, 23, 327. 40
43 R. Gnanasekaran, Y. Xu and D. M. Leitner, J Phys Chem B, 2010,
114, 16989-16996.
44 S. Cheng, B. Lian, J. Liang, T. Shi, L. Xie and Y. L. Zhao, Mol
Biosyst, 2013, 9, 2860-2868.
45 M. R. Talipov and Q. K. Timerghazin, J Phys Chem B, 2013, 117, 45
1827-1837.
46 N. Gould, P. T. Doulias, M. Tenopoulou, K. Raju and H.
Ischiropoulos, J Biol Chem, 2013, 288, 26473-26479.
50
Page 6 of 17Molecular BioSystems
Mol
ecul
arB
ioS
yste
ms
Acc
epte
dM
anus
crip
t

Fig. 1 The flow chart shows the correlations between S-nitrosylation and the characteristics.
5
Page 7 of 17 Molecular BioSystems
Mol
ecul
arB
ioS
yste
ms
Acc
epte
dM
anus
crip
t
Journal Name ►
ARTICLE TYPE
This journal is © The Royal Society of Chemistry [year] [journal], [year], [vol], 00–00 | 8
Fig. 2 The pKa of S-nitrosylated and non-S-nitrosylated cysteines, and the atomic distribution around the sulfur of S-nitrosylated cysteines. (a)
The pKa of S-nitrosylated and non-S-nitrosylated cysteines was calculated using PROPKA 3.1. The y-axis represents the value of pKa. (b) The x-axis
represents the distance (3.5 to 8.0 Å) from the sulfur of cysteine to the neighboring atoms. The y-axis represents the percentage difference values between
the S-nitrosylated and non-S-nitrosylated cysteine sets. The Mann–Whitney test was used (Table S1-S5, ESI†). 5
Page 8 of 17Molecular BioSystems
Mol
ecul
arB
ioS
yste
ms
Acc
epte
dM
anus
crip
t

Journal Name ►
ARTICLE TYPE
This journal is © The Royal Society of Chemistry [year] [journal], [year], [vol], 00–00 | 9
Fig. 3 The neighboring basic residues around the Cysβ93 in R-state (a), T-state (b), dep-R-state (c) and dep-T-state (d) hemoglobin. The x-axis
represents the distance between the sulfur of the Cysβ93 and the neighboring atoms from different residues. The y-axis (■) represents the number of atoms.
5
Page 9 of 17 Molecular BioSystems
Mol
ecul
arB
ioS
yste
ms
Acc
epte
dM
anus
crip
t

Fig. 4 Steric hindrance caused by the atoms in the half ball of 8 Å.
The x-axis represents the different types of amino acids ranked by volume
(BIGC670101 in AAindex) from large to small. The y-axis represents the 5
average number of atoms in S-nitrosylated cysteine sites and non-S-
nitrosylated cysteine sites.
Page 10 of 17Molecular BioSystems
Mol
ecul
arB
ioS
yste
ms
Acc
epte
dM
anus
crip
t
Journal Name ►
ARTICLE TYPE
This journal is © The Royal Society of Chemistry [year] [journal], [year], [vol], 00–00 | 11
Fig. 5 The neighboring big-volume residues around the Cysβ93 in R-state (a), T-state (b), dep-R-state (c) and dep-T-state (d) hemoglobin. The x-
axis represents the distance between sulfur of the Cysβ93 and the neighboring atoms from different residues. The y-axis (■) represents the number of
atoms.
5
Page 11 of 17 Molecular BioSystems
Mol
ecul
arB
ioS
yste
ms
Acc
epte
dM
anus
crip
t

Fig. 6 The dihedral angle of Cysβ93 in R-state (a), T-state (b), dep-R-
state (c) and dep-T-state (d) hemoglobin. The dihedral angle was
analysed from 0 to 360˚. The colour bar represents the frequency (%) of 5
the dihedral angle.
Page 12 of 17Molecular BioSystems
Mol
ecul
arB
ioS
yste
ms
Acc
epte
dM
anus
crip
t

Fig. 7 The atomic distribution of the sulfur atoms of neighboring
cysteines in S-nitrosylated and non-S-nitrosylated cysteine sets. The x-
axis represents the distance from the sulfur of S-nitrosylated or non-S-5
nitrosylated cysteines to the sulfur of neighboring cysteines. The y-axis
represents the frequency of neighboring sulfur atoms, which was
normalized by the number of S-nitrosylated cysteines and the number of
non-S-nitrosylated cysteines, respectively.
10
Page 13 of 17 Molecular BioSystems
Mol
ecul
arB
ioS
yste
ms
Acc
epte
dM
anus
crip
t

Fig. 8 The rate of change for RMSDs of the R-state, T-state, dep-R-
state and dep-T-state hemoglobin in the repeated MD simulations.
The x-axis represents the average rate of change calculated by RMSD
curve in MD simulations. The y-axis represents the frequency of different 5
rate of change.
Page 14 of 17Molecular BioSystems
Mol
ecul
arB
ioS
yste
ms
Acc
epte
dM
anus
crip
t

Fig. 9 The 3-D structural model of S-nitrosylation. The x-axis
represents the distance to the sulfur of cysteine (green ball). The y-axis
represents the frequency of the neighboring residues.
5
Page 15 of 17 Molecular BioSystems
Mol
ecul
arB
ioS
yste
ms
Acc
epte
dM
anus
crip
t

Table 1 The RMSF of the cysteines in the R-state and T-state
hemoglobin. The Cysβ93 in the R-state can be S-nitrosylated. The
cysteines in the T-state, as well as the Cysα104 and Cysβ112 in the R-5
state, cannot be S-nitrosylated.
R-state (Å) T-state (Å)
Cysα104 0.445 0.455 Cysβ93 0.995 0.755
Cysβ112 0.464 0.448
Page 16 of 17Molecular BioSystems
Mol
ecul
arB
ioS
yste
ms
Acc
epte
dM
anus
crip
t

%100P
N
P)i(NN)i(PN
valuedifferencePercentage
(1)
5
10
Page 17 of 17 Molecular BioSystems
Mol
ecul
arB
ioS
yste
ms
Acc
epte
dM
anus
crip
t