MOHAMMED ALI ABDULLAH...
28
OIL FATE AND SLICK TRAJRCTORY PREDICTION FOR MARINE OIL POLLUTION CONTROL STRATEGIES MOHAMMED ALI ABDULLAH AL-MUHANDES UNIVERSITI TEKNOLOGI MALAYSIA
Transcript of MOHAMMED ALI ABDULLAH...

OIL FATE AND SLICK TRAJRCTORY PREDICTION FOR MARINE OIL
POLLUTION CONTROL STRATEGIES
MOHAMMED ALI ABDULLAH AL-MUHANDES
UNIVERSITI TEKNOLOGI MALAYSIA

OIL FATE AND SLICK TRAJECTORY PREDICTION FOR MARINE OIL
POLLUTION CONTROL STRATEGIES
MOHAMMED ALI ABDULLAH AL-MUHANDES
A thesis submitted in partial fulfilment of the
requirements for the award of the degree of
Master of Engineering (Marine Technology)
Faculty of Mechanical Engineering
Universiti Teknologi Malaysia
MARCH 2012

iii
Dedicated to father, mother, wife, siblings, children and dear friends and lecturers

iv
ACKNOWLEDGEMENT
IN THE NAME OF ALLAH S.W.T, THE MOST GRACIOUS THE MOST
MERCIFUL
Thanks to ALLAH for giving the strength to complete this thesis in time.
During preparation this thesis, I am greatly indebted to many individuals for their
assistance. In particular, my supervisor Associate Professor Dr. Zamani Bin Ahmad
and co. supervisor Dr. Jaswar who helped and encouraged me to complete this thesis.
They also gave me a lot of impetus guidance throughout my thesis. My appreciation
goes also to everybody in maritime affairs authority in Yemen to mitigate the
difficulties in front of my way. Finally, most importantly I would like to thank my
family and relatives for their financial and moral support.

v
ABSTRACT
The impact of oil pollution is significant and its effects can be seen in different
marine related aspects including fisheries, tourism and costal industries. Hence, the
choice of the most effective oil pollution combating strategy is very important to
minimize the effect of oil spills on the environmental and socio-economic activities.
An efficient strategy includes the prediction of oil fate and slick trajectory to
determine which shoreline will be affected and which combating technique is most
suitable. In this research, a model describing the selection of oil pollution combating
strategy has been developed. Software simulations and mathematical relationships
were used to predict the oil fate and slick trajectory. For oil fate, ADIOS2 program
was used to predict evaporation, dispersion and change in viscosity processes and
mathematical relationships were used to predict spreading and emulsification
processes respectively. Slick trajectory calculator program was used to predict the
movement of oil. A case study has been performed on a simulated oil pollution
scenario off the South West coast of Johor, Malaysia. The type of oil was Arabian
Heavy, Amoco with API 28 spilled at 103o 28‟ 50 E and 1
o 07‟ 12 N. The model
predicted that nine hours after the time of spill, the weathering processes such as
spreading, evaporation, dispersion, emulsification and viscosity were 637748 m2, 104
m3, 3.7 m
3, 470 m
3 and 60 cSt respectively and the trajectory with over all bearing of
26.3o towards a sensitive shoreline with Tanjung Pelepas Port, Tanjung Bin Power
Plant and mangrove areas. The model proposed the use of the combination of oil
pollution combating equipment including booms, skimmers, pumps, manual and
motorized equipment, in addition to chemical dispersant and placement of such
equipment. Using the selected strategy model predicted that the pollutant would be
effectively controlled.
vi
ABSTRAK
Impak pencemaran tumpahan minyak memberi kesan yang sangat besar kepada
industri berkaitan maritim termasuk perikanan, pelancongan dan industri persisiran
pantai. Dengan itu pilihan strategi yang berkesan bagi mengatasi masalah
pencemaran tumpahan minyak adalah penting untuk meminimumkan kesannya
terhadap alam sekitar dan aktiviti sosio-ekonomi. Strategi yang cekap termasuklah
menentukan ciri-ciri tumpahan dan unjuran arah aliran pencemaran bagi mengetahui
kawasan persisiran yang akan terjejas dan kaedah penyelesaian yang bersesuaian. Di
dalam penyelidikan ini, sebuah model yang menerangkan cara pemilihan strategi
mengatasi tumpahan minyak telah dibangunkan. Simulasi menggunakan perisian
komputer dan secara persamaan matematik telah digunakan untuk meramalkan ciri-
ciri dan arah aliran tumpahan minyak. Perisian ADIOS2 digunakan untuk meramal
proses-proses pengewapan, penyebaran dan perubahan kelikatan dan persamaan
matematik digunakan untuk meramal penyerakan dan proses emulsifikasi. Sebuah
program pengiraan unjuran pergerakan tumpahan minyak digunakan untuk
menentukan pergerakan minyak. Kajian kes telah dijalankan dengan melakukan
simulasi tumpahan minyak di kawasan pantai Barat Daya Johor dengan
menggunakan jenis minyak Arabian Heavy, Amoco (API 28) pada koordinat 103o
28‟ 50 T and 1o 07‟ 12 U. Model meramalkan bahawa selepas sembilan jam kondisi
penyerakan, pengewapan, penyebaran, emulsifikasi dan kelikatan tumpahan minyak
adalah masing-masing 637748 m2, 104 m
3, 3.7 m
3, 470 m
3 dan 60 cSt dengan
unjuran kedudukan 26.3o menuju persisiran di mana terdapat Pelabuhan Tanjung
Pelepas, Janakuasa Tanjung Bin kawasan hutan bakau. Model mencadangkan
penggunaan kaedah kombinasi peralatan untuk mengatasi masalah tumpahan minyak
seperti boom, penapis minyak, pam, peralatan manual dan peralatan yang
menggunakan kuasa sebagai tambahan kepada tambahan bahan kimia penyebaran
yang berkenaan dan penempatan peralatan-peralatan tersebut. Dengan strategi yang
dipilih model meramalkan tumpahan minyak akan dapat dikawal dengan berkesan.

vii
TABBLE OF CONTENTS
CHAPTER TITLE PAGE
DECLARATION ii
DEDICATION iii
ACKNOWLEDGEMENT iv
ABSTRACT v
ABSTRAK vi
TABLE OF CONTENTS vii
LIST OF FIGURES xiii
LIST OF TABLES xvi
LIST OF ABBREVIATIONS xix
LIST OF SYMBOLS xx
1 INTRODUCTION
1.1 Research background 1
1.2 Problem statement 3
1.3 Objectives 4
1.4 Scope of project 5
1.5 Organization of the thesis 5
2 LITERATURE REVIEW
2.1 Introduction 7
2.2 Oil classification 8
2.2.1 Chemical classification 8
2.2.1.1 Low molecular weight hydrocarbon 8
2.2.1.2 Medium molecular weight hydrocarbon 9
2.2.1.3 High molecular weight hydrocarbon 9

viii
2.2.2 Physical classification 10
2.2.2.1 Group 1 10
2.2.2.2 Group 2 11
2.2.2.3 Group 3 11
2.2.2.4 Group 4 12
2.3 International regulations 13
2.3.1 Protocol of 1978 (MARPOL 73/78) Annex I 13
2.3.2 OPRC convention (1990) 13
3.3.3 Marine pollution control act (2001) 14
2.3.4 Spill pollution contingency convention (2010) 14
2.3.5 International oil pollution compensation funds (2005) 14
2.4 Oil fate and trajectory 15
2.4.1 Oil fate 15
2.4.1.1 Spreading 16
2.4.1.2 Evaporation 17
2.4.1.3 Dispersion 19
2.4.1.4 Emulsification 20
2.4.2 Oil slick trajectory 21
2.4.3 Aerial surveillance 23
2.5 Types of shorelines 26
2.5.1 Types of shorelines according to their activities 27
2.5.1.1 Environmental activities 27
2.5.1.2 Fishing, shellfish and aquaculture activities 27
2.5.1.3 Socio-economic activities 28
2.5.2 Types of shorelines according to beaches 28
2.6 Contingency plan and incident command system 30
2.6.1 Contingency plan 30
2.6.2 Incident command system 35
2.6.2.1 Levels of oil spill response organizations 36
2.6.2.2 Responsibilities 37
2.7 View on strategies and in hand equipment 39
2.7.1 Types of response strategies 40
2.7.1.1 Offshore recovery strategy 40
2.7.1.2 Dispersion strategy 41

ix
2.7.1.3 In-situ burning strategy 44
2.7.1.4 Shoreline clean up strategy 45
2.7.1.5 Shoreline protection strategy 47
2.7.2 Examples of major spills and response strategies 49
2.7.2.1 Exxon Valdez 49
2.7.2.2 Sea empress 50
2.7.3 Examples of choosing strategy models 52
2.7.3.1 Flinders ports choosing strategy model 52
2.7.3.2 O‟connoli choosing strategy model 54
2.7.3.3 The Cantabria choosing strategy model 55
2.7.3.4 Comparison among choosing strategy 56
models
3 RESEARCH METHODOLOGY
3.1 Introduction 58
3.2 Research methodology flow chart 59
3.3 Prediction of oil pollutants fate 60
3.3.1 Spreading 60
3.3.2 Evaporation 61
3.3.3 Dispersion 62
3.3.4 Viscosity 63
3.3.5 Emulsification 64
3.4 The predicting of oil slick trajectory 65
3.5 Sensitivity of shorelines and priority for protection 66
3.5.1 Ranking of resources 66
3.5.1.1 Ranking of biological resources 66
3.5.1.2 Ranking of human use features 67
3.5.1.3 Priority ranking of shorelines 68
3.6 Establishment matrix of equipments and useful techniques 69
3.7 Determination of control strategies 70
3.7.1 Introduction 70
3.7.2 Offshore recovery strategy 73
3.7.3 Offshore dispersion strategy 74

x
3.7.4 Shoreline clean-up strategy 75
3.7.5 Shoreline protection strategy 76
3.8 Case of study 78
4 RESULTS
4.1 Introduction 79
4.2 Results of oil fate prediction 79
4.2.1 Spreading 79
4.2.2 Evaporation 82
4.2.3 Dispersion 83
4.2.4 Viscosity 84
4.2.5 Emulsification 85
4.3 Results of oil slick trajectory prediction 86
4.4 Results of shoreline analysis and protection priority 91
4.4.1 Tanjung Pelepas Port 91
4.4.2 Tanjung Bin Power Plant 92
4.4.3 Mangroves 93
4.4.4 Puteri Harbour 94
4.5 Results of Equipment and solution techniques 95
4.5.1 In-hand booms 96
4.5.1.1 Types of booms and their characteristics 96
4.5.1.2 Specifications of booms 97
4.5.2 In-hand skimmers 99
4.5.2.1 Types skimmer and their characteristics 99
4.5.2.2 Specifications of in-hand skimmers 100
4.5.3 In-hand pumps 102
4.5.3.1 Types of pumps and their characteristic 102
4.5.3.2 Specifications of pumps 103
4.5.4 In-hand sorbent materials 105
4.5.4.1 Types of sorbent material and their 105
characteristics
4.5.4.2 Specifications of sorbent materials 106

xi
4.5.5 In-hand dispersion system 107
4.5.5.1 Characteristics of dispersion usage 107
4.5.5.2 Specifications of spray system 107
4.5.6 Data of additional in-hand equipment 108
4.5.6.1 Vessels 108
4.5.6.2 Storage tanks 109
4.5.6.3 Manual and motorized equipments 109
4.6 Results of demonstrating combating strategies 110
4.6.1 Offshore recovery strategy 112
4.6.1.1 Stage one 113
4.6.1.2 Stage two 114
4.6.2 Offshore dispersion strategy 115
5.6.2.1 Stage one 116
4.6.2.2 Stage two 117
4.6.3 Shoreline protection strategy 118
4.6.3.1 Zone one 118
4.6.3.2 Zone two 121
4.6.4 Shoreline recovery and clean-up 124
4.6.5 Result of combating based on prediction 126
5 DISCUSSION
5.1 Introduction 129
5.2 Effect of oil fate prediction 130
5.2.1 Spreading 130
5.2.2 Evaporation 132
5.2.3 Dispersion 132
5.2.4 Viscosity 133
5.2.5 Emulsification 133
5.3 Effect of oil slick trajectory prediction 134
5.4 Effect of shoreline analysis and protection priority 136
5.4.1 Tanjung Pelepas Port 136
5.4.2 Tanjung Bin Power Plant 137
xii
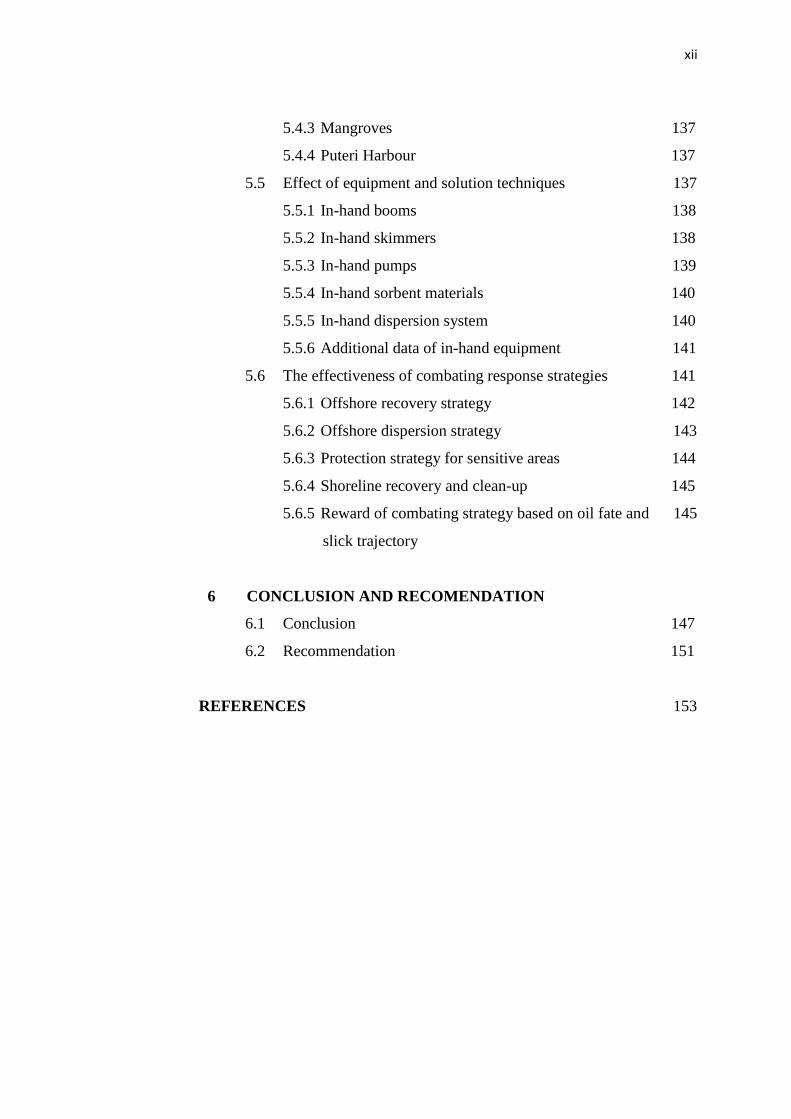
5.4.3 Mangroves 137
5.4.4 Puteri Harbour 137
5.5 Effect of equipment and solution techniques 137
5.5.1 In-hand booms 138
5.5.2 In-hand skimmers 138
5.5.3 In-hand pumps 139
5.5.4 In-hand sorbent materials 140
5.5.5 In-hand dispersion system 140
5.5.6 Additional data of in-hand equipment 141
5.6 The effectiveness of combating response strategies 141
5.6.1 Offshore recovery strategy 142
5.6.2 Offshore dispersion strategy 143
5.6.3 Protection strategy for sensitive areas 144
5.6.4 Shoreline recovery and clean-up 145
5.6.5 Reward of combating strategy based on oil fate and 145
slick trajectory
6 CONCLUSION AND RECOMENDATION
6.1 Conclusion 147
6.2 Recommendation 151
REFERENCES 153

xiii
LIST OF FIGURES
FIGURE TITLE PAGE
2.1 The main processes of oil on water 16
2.2 Fate processes over time 16
2.3 ADIOS2 software 20
2.4 The percentage of emulsified oil within time 21
2.5 Oil slick trajectory software 22
2.6 Wind speed effect on the oil slick 23
2.7 Way of helicopter approaching an oil tanker 24
2.8 Oil on water quantification calculator 25
2.9 Environmental and economical types of shorelines 26
2.10 Chain of contingency plans 31
2.11 Tiering levels of oil spills 33
2.12 Oil Spill Response Organization for Small Spill 36
2.13 Oil Spill Response Organization for Medium Spill 36
2.14 Oil spill response organization for large spill 37
2.15 Mechanical clean-up recommendation 40
2.16 Dispersion and emulsification of oil in water 42
2.17 Range of viscosity where dispersant application 43
2.18 Spray system and offshore dispersion strategy 43
2.19 Typical boom operation for in-situ burning 44
2.20 Different types of shoreline clean up techniques 45
2.21 Shoreline recovery techniques 47
2.22 Terminals/Harbours booms 48
2.23 Boom deployment calculator software 48
2.24 Flinders Ports choosing strategies model 53
xiv
2.25 O‟connoli choosing strategies model 55
2.26 Cantabria choosing strategies model 56
3.1 Flow chart of research methodology 59
3.2 Assessment procedures and offshore response strategies 70
3.3 Shoreline clean up response strategy 71
3.4 Protection response strategy 72
4.1 Prediction of oil spill elliptical diameters from 7 a.m. to 4 p.m. 81
4.2 Prediction of changing of oil slick area from 7 a.m. to 4 p.m. 81
4.3 Predicted quantity of evaporated oil 82
4.4 Predicted quantity of naturally dispersed oil 83
4.5 Predicted quantity of remaining oil after dispersion and evaporation 83
4.6 Predicted change of density of spilled oil 84
4.7 Predicted change of viscosity of spilled oil 84
4.8 Predicted the ratio of water in oil and its relation to wind speed 85
4.9 Predicted quantity of oil and oil with emulsion within 9 hours 85
4.10 Predicted output data of oil slick position at 8 am 86
4.11 Predicted output data of oil slick position at 11 am 87
4.12 Predicted output data of oil slick position from 11 am to 12 noon 87
4.13 Predicted output data of oil slick position at 2 pm 88
4.14 Predicted output data of oil slick position from 2 to 3 pm 88
4.15 Predicted output data of oil slick position from 3 to 4 pm 89
4.16 Predicted output data of oil slick position at 4 pm 89
4.17 Predicted trajectory line pointed on each hour 90
4.18 Predicted trajectory line by using Google earth 91
4.19 Sensitive areas south west of Johor 94
4.20 Mangrove forest south west Johor 95
4.21 Protection Strategy for zone 1 119
4.22 Output of Booms 1 and 2 at zone 1 119
4.23 Output of Boom 3 at zone 1 120
4.24 Output of Boom 4 at zone 1 120
4.25 Staggered chevron and exclusion booming in Zone 2 122
4.26 Output of the Boom 1 of the second zone equal 70 m 122
4.27 Output of Boom 2 of the second zone equal 20 m 123

xv
4.28 General budget after offshore combating 126
4.29 Quantity of recovered oil resulted of offshore recovery 127
4.30 Quantity of oil resulted of offshore chemically dispersed oil 127
4.31 Quantity of remained oil after offshore recovery and dispersion 128
strategies

xvi
LIST OF TABLES
TABLE TITLE PAGE
2.1 Physical properties of group 1 oils 10
2.2 Physical properties of group 2 11
2.3 Physical properties of group 3 11
2.4 Physical properties of group 4 12
2.5 Thickness of typical colors of oil on water 25
2.6 Types of beaches, oil accumulation and duration of spill 29
2.7 Comparison of combating strategy flow charts 57
3.1 Level vulnerability of biological resources 67
3.2 Ranking of human use features 67
3.3 Ranking of shorelines 68
3.4 Techniques and their equipments 69
3.5 Suitability of skimmers as offshore recovery strategy 73
3.6 Suitability usage of pumps as offshore recovery strategy 74
3.7 Suitability of dispersants as offshore dispersion strategy 74
3.8 Shoreline clean up strategy 76
3.9 Techniques of shoreline protection strategy 77
3.10 Input data of wind and sea current 78
xvii
4.1 Wind speed and oil volume 80
4.2 Summary report of slick trajectory 90
4.3 Types of booms and their characteristics 96
4.4 Specifications of Fence boom 97
4.5 Specifications of Air inflated boom 98
4.6 specifications of shore sealing boom 98
4.7 Types of skimmers and their characteristics and mechanism 99
4.8 Specifications of oleophilic skimmer 100
4.9 Specifications of offshore weir skimmer 100
4.10 Specifications of shoreline and harbour weir skimmer 101
4.11 Specifications of vacuum skimmers 101
4.12 Specifications of mechanical skimmer 102
4.13 Types of pump and their characteristics 103
4.14 Specifications of Peristaltic pump 104
4.15 Specifications of diaphragm pump 104
4.16 Specifications of centrifugal pump 105
4.17 Types of sorbent materials and their characteristics 106
4.18 In-hand sorbent material and their capacity 106
4.19 Advantages and limitations of using chemical dispersant 107
4.20 Specifications of in hand spray system 108
4.21 Specifications of oil pollution control vessel 109
4.22 In-hand equipment to perform offshore recovery 112

xviii
4.23 The first step of offshore recovery strategy 113
4.24 The second step of offshore recovery strategy 114
4.25 Combating equipment and effective work 115
4.26 The first step of offshore dispersion strategy 116
4.27 The second step of offshore dispersion strategy 117
4.28 Effective deployment in Zone one 118
4.29 Suitable used technique in Zone 1 121
4.30 Effective deployment in Zone two 121
4.31 Suitable used technique in Zone two 123
4.32 quantity of combated oil as resulted of offshore operations 126
5.1 Result of slick trajectory until 10 am 134
5.2 Result of slick trajectory until 4 pm 135
xix
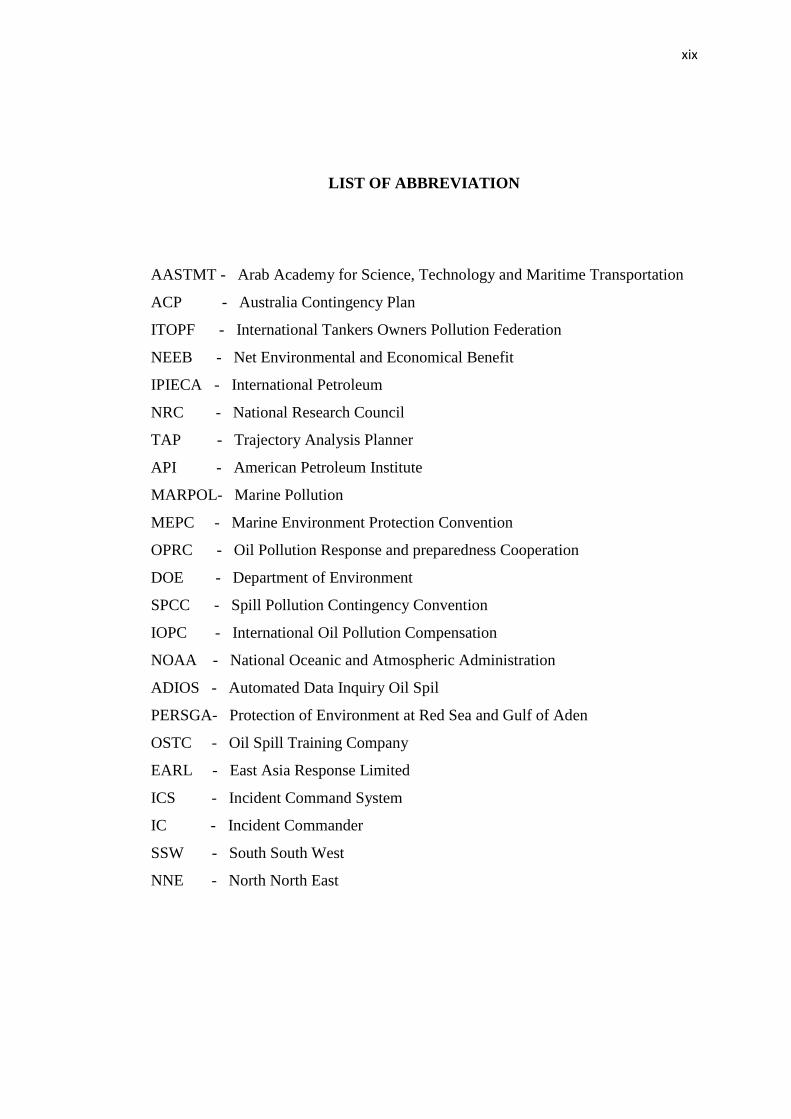
LIST OF ABBREVIATION
AASTMT - Arab Academy for Science, Technology and Maritime Transportation
ACP - Australia Contingency Plan
ITOPF - International Tankers Owners Pollution Federation
NEEB - Net Environmental and Economical Benefit
IPIECA - International Petroleum
NRC - National Research Council
TAP - Trajectory Analysis Planner
API - American Petroleum Institute
MARPOL- Marine Pollution
MEPC - Marine Environment Protection Convention
OPRC - Oil Pollution Response and preparedness Cooperation
DOE - Department of Environment
SPCC - Spill Pollution Contingency Convention
IOPC - International Oil Pollution Compensation
NOAA - National Oceanic and Atmospheric Administration
ADIOS - Automated Data Inquiry Oil Spil
PERSGA- Protection of Environment at Red Sea and Gulf of Aden
OSTC - Oil Spill Training Company
EARL - East Asia Response Limited
ICS - Incident Command System
IC - Incident Commander
SSW - South South West
NNE - North North East

xx
LIST OF SYMBOLS
A - constatnts derived from distilation data
AS - silver/sheen color area
AR - rainbow color area
AB/b - black/brown color area
AB/O - brown/orange color area
B - constatnts derived from distilation data
C3 - the constant viscosity equal to 0.7 for heavy fuel oil and 0.25 for light oil
Cdis - an experimentally determined parameter
Da - the fraction of sea surface dispersed per hour
Db - the fraction of the dispersed oil not returning to the slick
De - dispersion of wave energy per unit surface area
dmax - maximum droplet size 70 microns
dmin - minimum droplet size 5 microns
Fbw - fraction of breaking waves per wave period per unit area
FE - volume fraction evaporated
g - gravitational acceleration
h - average thickness of oil
Hrms - root-mean wave height in meters, assumed to be related to the spectrally
based significant wave height
H(t) - the thickness of slick as a function of time
K2 - mass transfer coefficient for evaporation
Ko - reference mass transport coefficient defined at 1 m/s
Lmax - the length of the major axes of ellipse
Lmin - the length of the minor axes of ellipse
N - speed of boat or aircraft
N(δ) - the number of oil droplets per unit volume of water per droplet diameter

xxi
P1 - vapor pressure of the ith Pseudo component
Qdis - application rate of dispersant
Rdis - desired dispersant-to-oil volume ratio
R - gas constant = 8.3144 j/k, mole
S - swath widh on the water surface
st - oil- water interfacial tension (dyne/m)
T - ambient temperature
t - time
T0 - initial boiling point at FE of zero K
TG - gradient of boiling point, TB and FE line (K)
Uw - the wind speed
Ve - water content of the emulsion
Vdis - application rate of dispersant
Vo/w - volume of oil entrained per unit volume of water
Voil - the total volume of an oil spill
V1 - molar volume of the ith Pseudo component (m3/ mole)
c - depth-averaged current velocity
V0 - initial volume of spilled oil
w - wind velocity at 10 m above the mean seawater surface
X1(t) - downwind dimension
Y(t) - fraction of water in emulsion as a function of time
θ - jet angle with respect to x - axis
µ - viscosity (cp)
ρ0 - the density of oil
ρw - the density of water
αc - current drift factor ( 1.1 )
αw - wind drift factor ( 0.3 )
------------------------------------------------------------------------------------------------------
If the above illustration of any symbol conflicts with the illustration of that symbol given in the
following text then preference should be given to the illustration, which is provided in the following
chapters.

xxii

1
CHAPTER 1
INTRODUCTION
1.1 Research background
Marine oil pollutions have negative impact on the marine environment and
have significantly adverse effects on fisheries, tourism, and costal industries and
sometimes are used as weapon such as made by Israel against Lebanon in 1982 and
the second Arab Gulf War between Iraq and the allied forces led by the U.S
(Muhanna, 2006). The direct impact of oil spills can cause damage to fishing and
aquaculture resources by physical contamination and toxic effects. Also, it disrupts
the maritime and coastal business activities. The nature and extent of the impact of
oil spill on seafood production depends on the characteristics of the spilled oil, the
circumstances of the incident and the type of fishing activity or businesses in the
affected (IOTPF, statistic, 2009). Also shoreline industries are directly affected
because of extension of heavy oil along the coastline such as the 1978 Amoco Cadiz
spill, the loss of 220 thousand metric tons of crude oil and bunker fuel polluted some
240 miles of the Brittany coast (Grigalunas, et al, 1986). In addition, the coastal
population communities may affected be as described by White and Molly (2003) in
the first 1.5 years after 1986 spill, and contrast their findings with earlier works
regarding the effects of oil on tropical community.
Usually, oil pollution is caused by ships, offshore units, seaports, pipelines
and oil handling facilities. There are Information gathered from published sources
such as shipping press, vessel owners and their insurers and other specialized
publications which says that the large spills are often resulting from collisions,
2
groundings, structural damage, fires and explosions, whereas the majority of
individual reports relate only to small operational spillages (ITOPF, 2004). In the
event of oil pollution incident, predicting the oil slick trajectory and oil fate will lead
to prompt an effective oil pollution control strategies to mitigate or minimize the
damages resulting from such incidences on environment and socio-economic
activities.
The prediction of oil slick trajectory depends upon the seawater current and
wind directions and speeds with assistance of transmission technology to confirm the
trace of predicted trajectory. Whereas the oil behavior is affected by a number of
physical and chemical characteristics, climate and the sea conditions which lead to
spreading, dispersion, evaporation and emulsification. The prediction should be
verified by air and/or sea reconnaissance to deploy and control the operation at sea,
for timely protection of sites along threatened coastlines and the preparation of
resources for shoreline clean-up.
Employing the contingency plan to combat the oil pollution and choosing the
suitable strategy for each place requires good background information about the
sensitivity of attacked shoreline environmentally and economically. After that,
employing the righteous equipments and techniques, which are available for
recovery, dispersion and clean-up should be properly implemented to reach the net of
environmental and economical benefit (NEEB).

3
1.2 Problem statement
Marine oil pollution has negative impact on the environment and socio-
economic activities for short and long terms, and the major spill is considered as a
disaster because of its destructive effects. The effects of an oil spill on the
environment and socio-economic activities and the effectiveness of cleanup and
control vary significantly with the type of oil spilled. As happened in 1978, the
incident of Amco Cadiz oil spill where 220 thousand metric tonnes of crude oil and
bunker fuel extend along 240 miles of the Brittany coast. Resulted a negative impact
on the environment and the coastal population communities at least in the first 1.5
year (White and Molly, 2003).
The severity of the effects of an oil spill on the natural resources and socio-
economic depends on many factors. These factors include the type and amount of oil
and its behavior once spilled into seawater, the physical characteristics of the
affected area, weather conditions and seasonal time of year, which affect on the oil
fate and slick trajectory, the type and effectiveness of response operations and the
biological characteristics of the area (Fingas, M., 2000). Oil pollution control
strategies need to be developed for each oil fate and slick trajectory scenario. Since
each scenario is unique and independent, simulation method is preferred.
The simulation of oil pollution incident in the south west of Johor state in
Malaysia is used. Software simulations and mathematical relationships are used to
predict the oil fate and slick trajectory. Based on the predictions, the combating
strategies are chosen according to the sensitivity of the shorelines which may be
affected and the capability of in-hand combating equipment. The suitable response
operations lead to minimizing the long and short-term impacts on the environment
and economical activities in this area.

4
1.3 Objectives
Study all of the circumstances of oil pollution response operations. The right
way to make combating operation effective, it must be based on a scientific
background to reach the optimum response level. The scientific background consists
of knowing how the oil spill affects the environmental and economical resources.
To avoid or mitigate the harshness of oil spill incident, there are some technical
procedures that should be followed. The procedures include to where the oil slick is
moving because of the forces of wind and sea current, what is happening to the
physical and chemical characteristics of the spilled oil, what is the nature of coast
lines and how the in-hand equipments could be employed effectively. The objectives
of this research are as:
i. Predict the oil pollutants fate
ii. Predict the oil slick trajectory
iii. Identify the types of shorelines which may be affected and their
characteristics
iv. Establish a matrix of equipments and the useful techniques

5
1.4 Scope of Project
This project covers the following:
i. Variables for the research have been strategically limited to common
variables used to define oil fate and oil trajectory. These are spreading,
evaporation, dispersion, viscosity and emulsification. Variables not
commonly used in the real world such as dissolution, photo-oxidation,
biodegradation and sedimentation here are not included.
ii. For data analysis and simulation of trajectory, currently available
mathematical formulas and software have been used. For example, software
by OSTC for calculation of slick trajectory has been used and ADIOS2 has
been used to predict the weathering processes.
iii. The model has been designed to be applicable for the development of the oil
pollution combating strategies of typical weather conditions.
1.5 Organization of the research
This research is organized into six chapters:
i. Chapter one gives introduction, shows the importance of this research and
discusses a general overview of research activities
ii. Chapter two reviews the main areas of oil pollution control which are related
to this research

6
iii. Chapter three explains the methods which will be used to achieve the
objectives of this research
iv. Chapter four consists of the results which are gotten from this research
v. Chapter five contains the discussion on the results
vi. Chapter six includes the conclusion of this research and the suggested future
works