
Modification and optimization of a 50 MHz inductively coupled argon plasma with special reference to...
30
Swctrochimica Acta. Vol. 378. No. 2. pp. 97-126. 1982 Printed in Great Britain osfx-8547m2m2oo97-~~,~,o Pewmon Press Ltd. Modification and optimization of a 50 MHz inductively coupled argon plasma with special reference to analyses using organic solvents* P. W. J. M. BOUMANS and M. CH. Lux-STEtNERt Philips Research Laboratories, 5600 MD Eindhoven, The Netherlands (Receiued 29 April 1981; in revised fomt I July 1981) Abstract-The torch and nebulizer of an existing argon ICP system were modified and the system was (re-) optimized for aqueous and organic liquids. The paper describes the design considerations and construction of (I) a new, streamlined torch including a torch base used in this study, where a demountable rather than a prealigned version of the torch was preferred; (2) a cross-flow pneumatic nebulizer with adjustable teflon capillaries including a spray chamber with flow spoiler, concentric aerosol pick-up tube, and “U” tube with unequal legs to smooth the flow of wasted liquid to the drain. The (re-)optimization of the ICP system for analysis of aqueous solutions with inorganic matter or with both inorganic and organic matter is discussed in the light of earlier work in this laboratory regarding the selection of “compromise conditions” and the choice of representative spectral lines and measurement criteria for establishing such compromise conditions. In this context the authors consider the concepts of norm temperature and “hard” and “soft” lines. as well as recent results of measurements of spatial distributions in ICPs. The authors further describe experiments aimed at the optimization of the operating conditions of an “organic ICY using methyl isobutyl ketone (MIBK) as organic solvent. Trends of net line and background signals and signal-to-background ratios with the ICP parameters (power; outer, inter- mediate and carrier gas flow; observation height; liquid feed rate) are reported, and a rational choice of compromise conditions for the ICP is argued. Performance characteristics of the mod&d ICP system, such as detection limits, precision and interference level, achieved under compromise conditions, have been communicated in a previous report [Spectrochim. Acta 36B. 1031 (1981)] to demonstrate the capabilities of the system for analysis of aqueous solutions. Detection limits in MIBK and oil diluted in MIBK are reported in the present work as an illustration of the performance of the system when used for organic liquid analysis. 1. !NTR~DIJCTI~N IN A PREVIOUS publication from this laboratory [l] we have shown some performance characteristics of a modified 50 MHz inductively coupled argon plasma (ICP) system operated with a cross-flow pneumatic nebulizer. These characteristics were presented in terms of detection limits, interferences and precision achieved at trace levels in pure aqueous solutions and aqueous solutions containing substantial amounts of NaCl, CaC& or a mixture of nickel and cobalt nitrates. It was shown that the background equivalent concentrations (BEC) attained with this ICP system under compromise conditions for simultaneous multi-element analysis correlated excellently with those reported by WINGE et al. [2] for a 27 MHz ICP system, also operated with a cross-flow pneumatic nebulizer under compromise conditions. The BECs found in this laboratory were, on average, a factor of 5.5 better than those of WINGE et al., which was ascribed to an accumulation of various effects each of which make their own small contribution. These improved BECs led to detection limits in pure water that were a factor of 2-g better than those of WINGE et al.121, depending on the magnitude of the shot noise contribution to the relative standard deviation of the background signal and therefore on the wavelength of the analysis lines. In solutions with the *This paper includes extracts from the Ph.D. Thesis of M. CH. LUX-STEINER. ton leave from: Institute of Toxicology, Swiss Federal Institute of Technology, Zurich, Switzerland. Present address: University of Konstanz, Physics Department, Konstanz, Federal Republic of Germany. ill P. W. J. M. BOUMANS. R. J. MCKENNA and M. BOSVELD, Spectrochim. Acta 368, 1031 (1981). [21 R. K. WINCE, V. J. PETERSON and V. A. FASSEL, Appl. Specctrosc.33, 106 (1979). 91
Transcript of Modification and optimization of a 50 MHz inductively coupled argon plasma with special reference to...

Swctrochimica Acta. Vol. 378. No. 2. pp. 97-126. 1982 Printed in Great Britain
osfx-8547m2m2oo97-~~,~,o
Pewmon Press Ltd.
Modification and optimization of a 50 MHz inductively coupled argon plasma with special reference to analyses
using organic solvents*
P. W. J. M. BOUMANS and M. CH. Lux-STEtNERt
Philips Research Laboratories, 5600 MD Eindhoven, The Netherlands
(Receiued 29 April 1981; in revised fomt I July 1981)
Abstract-The torch and nebulizer of an existing argon ICP system were modified and the system was (re-) optimized for aqueous and organic liquids. The paper describes the design considerations and construction of
(I) a new, streamlined torch including a torch base used in this study, where a demountable rather than a prealigned version of the torch was preferred;
(2) a cross-flow pneumatic nebulizer with adjustable teflon capillaries including a spray chamber with flow spoiler, concentric aerosol pick-up tube, and “U” tube with unequal legs to smooth the flow of wasted liquid to the drain.
The (re-)optimization of the ICP system for analysis of aqueous solutions with inorganic matter or with both inorganic and organic matter is discussed in the light of earlier work in this laboratory regarding the selection of “compromise conditions” and the choice of representative spectral lines and measurement criteria for establishing such compromise conditions. In this context the authors consider the concepts of norm temperature and “hard” and “soft” lines. as well as recent results of measurements of spatial distributions in ICPs. The authors further describe experiments aimed at the optimization of the operating conditions of an “organic ICY using methyl isobutyl ketone (MIBK) as organic solvent. Trends of net line and background signals and signal-to-background ratios with the ICP parameters (power; outer, inter- mediate and carrier gas flow; observation height; liquid feed rate) are reported, and a rational choice of compromise conditions for the ICP is argued.
Performance characteristics of the mod&d ICP system, such as detection limits, precision and interference level, achieved under compromise conditions, have been communicated in a previous report [Spectrochim. Acta 36B. 1031 (1981)] to demonstrate the capabilities of the system for analysis of aqueous solutions. Detection limits in MIBK and oil diluted in MIBK are reported in the present work as an illustration of the performance of the system when used for organic liquid analysis.
1. !NTR~DIJCTI~N
IN A PREVIOUS publication from this laboratory [l] we have shown some performance characteristics of a modified 50 MHz inductively coupled argon plasma (ICP) system operated with a cross-flow pneumatic nebulizer. These characteristics were presented in terms of detection limits, interferences and precision achieved at trace levels in pure aqueous solutions and aqueous solutions containing substantial amounts of NaCl, CaC& or a mixture of nickel and cobalt nitrates. It was shown that the background equivalent concentrations (BEC) attained with this ICP system under compromise conditions for simultaneous multi-element analysis correlated excellently with those reported by WINGE et al. [2] for a 27 MHz ICP system, also operated with a cross-flow pneumatic nebulizer under compromise conditions. The BECs found in this laboratory were, on average, a factor of 5.5 better than those of WINGE et al., which was ascribed to an accumulation of various effects each of which make their own small contribution. These improved BECs led to detection limits in pure water that were a factor of 2-g better than those of WINGE et al.121, depending on the magnitude of the shot noise contribution to the relative standard deviation of the background signal and therefore on the wavelength of the analysis lines. In solutions with the
*This paper includes extracts from the Ph.D. Thesis of M. CH. LUX-STEINER.
ton leave from: Institute of Toxicology, Swiss Federal Institute of Technology, Zurich, Switzerland. Present address: University of Konstanz, Physics Department, Konstanz, Federal Republic of Germany.
ill P. W. J. M. BOUMANS. R. J. MCKENNA and M. BOSVELD, Spectrochim. Acta 368, 1031 (1981). [21 R. K. WINCE, V. J. PETERSON and V. A. FASSEL, Appl. Specctrosc. 33, 106 (1979).
91

YR P. W J. M. BOUMANS and M CI+. I_IJX-SIFINEK
stated matrices, the detection limits of individual lines worsened by a factor of 1 B-l.3 for the NaCl matrix (10 mgml-‘) and a factor of 1.2-2 for the CaClz matrix (27.7 mg ml-‘). With the nickel-cobalt matrix, the detection limits of the individual lines worsened by a factor that depended on the degree of line interference, but it was possible. in general, to keep the deterioration of the detection limits of the elements to within a factor of 1.3-3 by a judicious choice of the analysis lines.
The purpose of the previous work [I] was, inter alia, to assess the performance of the modified ICP system, including the updated spectrometric equipment for trace analysis of inorganic materials, and in that scope a detailed analysis of the limiting noise was made.
This paper deals with investigations that chronologically preceded the work repor- ted in [I]. These investigations have extended over various years and were tentatively referred to in conference papers [3-6]. We summarize and assemble the various fragments in a uniform picture and indicate the relation of these studies to other work from this laboratory, in particular that described in [7-91, and recent work involving the measurement and interpretation of the spatial characteristics of analyte emission in ICPs by HORLICK and his group [N-12] and KAWAGUCHI and his group [13, 141.
When the work was started, the following targets were set. (i) Re-designing the torch of our 50 MHz ICP system so that organic solvents could
be analysed and at the same time all advantages of the “old” torch [8,9,15] for analysis of inorganic aqueous solutions would be maintained.
(ii) Developing a cross-flow pneumatic nebulizer on the basis of teflon capillaries to achieve: (a) high temporal stability in aerosol production, also for solutions with high salt content, (b) corrosion resistivity to hydrofluoric acid and organic solvents, (c) easy and reproducible adjustment and (d) simplicity in construction and maintenance.
(iii) Designing a sample introduction device for controlled feed of organic liquids, including aggressive liquids, to the nebulizer using a peristaltic pump.
(iv) Checking for the new facilities the validity of earlier established empirical relationships between analytical characteristics, such as net line and background signals, signal-to-background ratios (SBR), interferences, and the ICP parameters (power, gas flows, observation height, sample feed rate) for inorganic aqueous solutions.
(v) Adapting the parameter setting, if required, to achieve new compromise conditions for inorganic aqueous solutions yielding at least a performance similar to that realized with the former facilities.
(vi) Establishing any adaptations in the parameter setting required for aqueous solutions with both inorganic and organic matter.
(vii) Finding empirical relationships between the analytical characteristics and the ICP parameters in the case of organic solvents and making on this basis a rational choice of compromise conditions for analysis of organics.
This paper discusses the starting-points used to achieve these targets, the ways in which the goals were realized,-and the results that were obtained.
[3] M. CH. LUX-STEINER, Ph.D: Thesis, Swiss Federal Institute of Technology, Zurich, Switzerland ( 1980).
[4] M. CH. LUX-STEINER and P. W. J. M. BOUMANS. Paper No. 158 presented at the 21st Coll. Spectr. Int. and 8th Int. Conf. Atomic Spectr.. Cambridge (1979).
[S] M. CH. LUX-STEINER and P. W. J. M. BOUMANS. Paper No. 81, ht. Winter Conf. 1980: Developments in Atomic Plasma Spectrochemical Analyses, San Juan, Puerto Rico (1980).
[6] P. W. J. M. BOUMANS, Second ICP Conference, Noordwijk aan Zee, 1978; ICP Infonnolion Newslell. 3, 124 (1978).
[7[ P. W. J. M. BOUMANS and F. J. DE BOER, Spectrochim. Acre 3OB, 309 (1975). [8] P. W. J. M. BOUMANS and F. J. DE BOER, Spectrochim. Acra 31B. 355 (1976). [9] P. W. J. M. BOUMANS and F. J. DE BOER, Spectrochim. Acrn 32B. 365 (1977).
[IO] T. EDMONDS and G. HORLICK, Appl. Spectrosc. 22,68 (1977). [l I] M. W. BLADES and G. HORLICK, Speckochim. Acta 36B, OoO (1981).
[I21 M. W. BLADES and G. HORLICK, Speckwhim. Acln 36B, 000 (1981). [ 131 H. KAWAGUCHI, T. ITO, K. OTA and A. MIZUIKE. Speclrochim. Acta YB. I99 (1980).
[I41 H. KAWAGUCHI, T. ITO and A. MIZUIKE. Specrrochim. Acta 36B. 615 (1981).
(IS] P. W. J. M. BOUMANS and F. J. DE BOER, Specwochim. Acto 27B. 391 (1972).
Modification and optimization of a 50 MHZ inductively coupled argon plasma 99
2. EXPERIMENTAL
2.1. Torch configuration 2.1.1. Starting-points. Our original torch 18, 151 contained a simple cylindrical
intermediate tube and could not be used for organic materials without modification. Scorr et al. [16] designed a torch with a tulip-shaped intermediate tube and this torch, in the form described by FASSEL and KNISELEY [ 171, was used by FASSEL et al. [ 181 for the determination of wear metals in lubricating oils using methyl isobutyl ketone (MIBK) as diluent. Experience with torches of this type in connection with the RF facilities available in this laboratory had confirmed that a tulip-shaped intermediate tube did have definite advantages for organic liquid analysis, but that in addition to this shape and the main dimensions of the torch shown in [ 171, many critical factors as to the precise shapes of intermediate and carrier gas tubes had to be considered. Such crucial details were not revealed in the schematic drawing [17], neither were these points discussed in the publication on oil analysis, where only the basic statements were made that “There is a tendency for the formation of carbon-like deposits on the rims of the two inner tubes of the torch. The auxiliary argon flow provides an improved spatial separation of the plasma and these tubes”.
The lack of detailed information on the FASSEL-KNISELEY torch [17] and the fact that we wished to achieved optimum operation with our free-running 50 MHz genera- tor induced us to design a new torch using the following starting-points:
(a) An outer tube having the same outer and inner dia. as the original torch so that no redesigning of the work coil would be required.
(b) Introduction of the tulip shape of the intermediate tube [16,17]. (c) Definition of the precise shapes and dimensions of the intermediate and carrier
gas tubes by exploiting the experience on torch design reported by GREENFIELD et al. [N-213, SCOJT et al. [la], ALLEMAND [22] and ALLEMAND and BARN= [23], on the one hand, and studying empirically the effect of variations in these shapes and dimensions on the gas flow patterns, the plasma configuration, and the extent of carbon deposition when the ICP was operated with an organic solvent.
2.1.2. Torch design. We used an assembly of separate tubes fitted into a plexiglass base provided with adjustment screws (Section 2.1.3). The following variations in torch geometry were essentially considered.
Outer tube: the extension above the load coil was varied between 3 and 15 mm. Intermediate tube: the outer dia. of the cup was first varied so that the distance
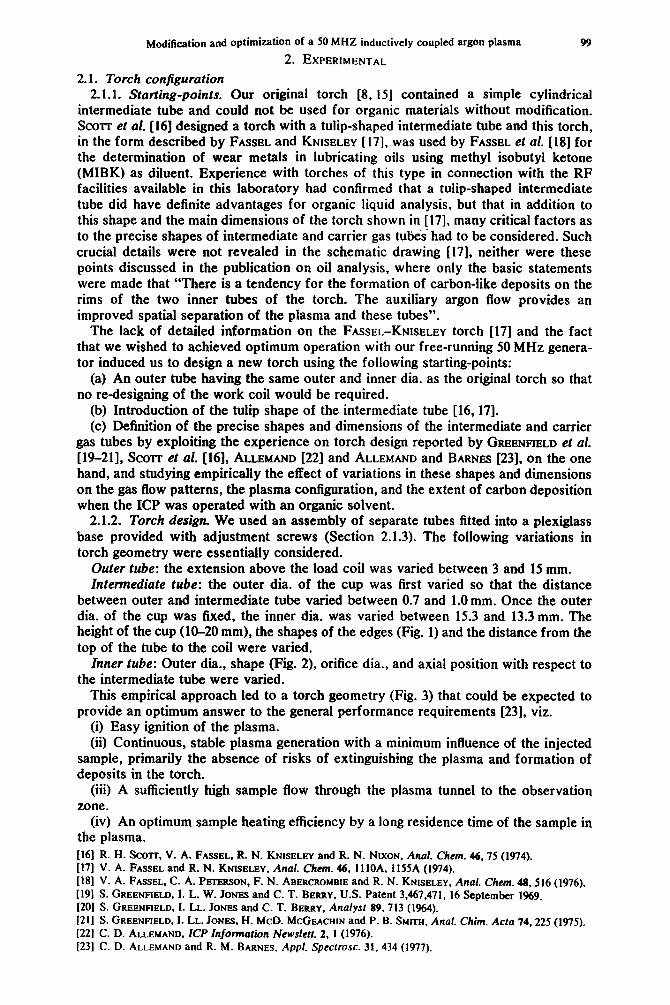
between outer and intermediate tube varied between 0.7 and 1.0 mm. Once the outer dia. of the cup was fixed, the inner dia. was varied between 15.3 and 13.3 mm. The height of the cup (10-20 mm), the shapes of the edges (Fig. 1) and the distance from the top of the tube to the coil were varied.
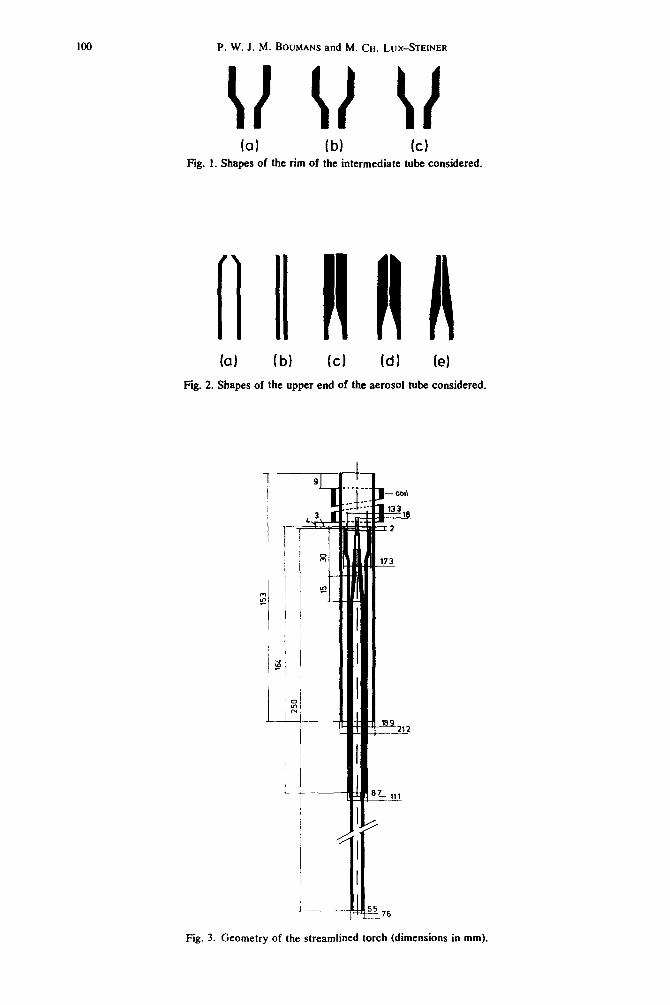
Inner tube: Outer dia., shape (Fig. 2), orifice dia., and axial position with respect to the intermediate tube were varied.
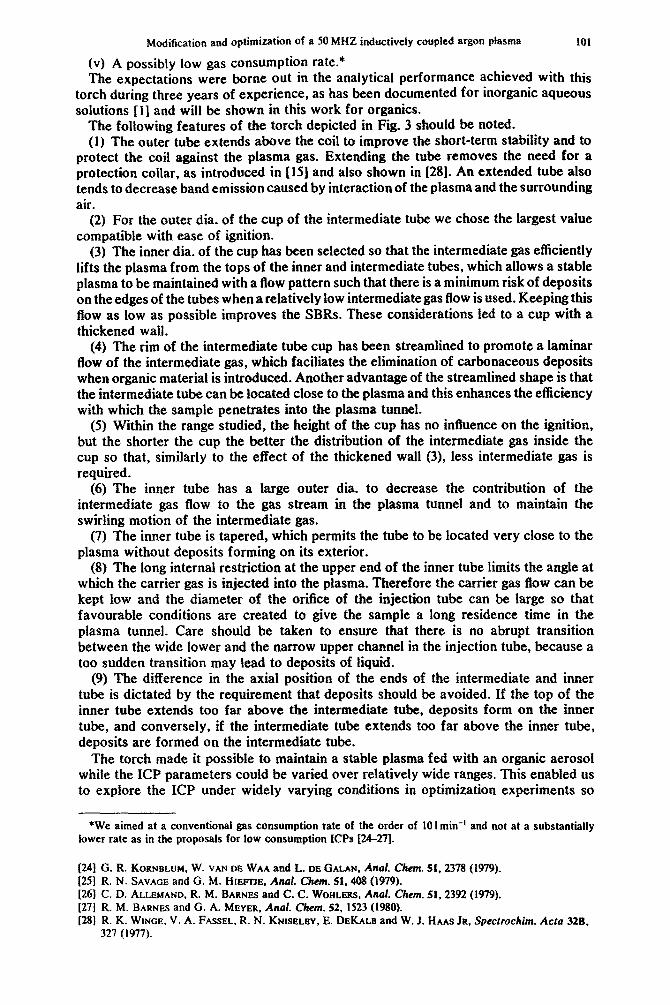
This empirical approach led to a torch geometry (Fig. 3) that could be expected to provide an optimum answer to the general performance requirements [23], viz.
(i) Easy ignition of the plasma. (ii) Continuous, stable plasma generation with a minimum influence of the injected
sample, primarily the absence of risks of extinguishing the plasma and formation of deposits in the torch.
(iii) A sufficiently high sample flow through the plasma tunnel to the observation zone.
(iv) An optimum sample heating efficiency by a long residence time of the sample in the plasma. [161 R. H. SCOTT, V. A. FASSEL, R. N. KNISELEY and R. N. NWON, And. Chem. 46.75 (1974). 1171 V. A. FASSEL and R. N. KNISELEY, Anal. Chem. 46, 1 llOA, 1lSSA (1974). [18] V. A. FASSEL. C. A. P ETF~RWN, F. N. ABERCROMBIE and R. N. KNISELEY, Anal. Chem. 48,516 (1976). [191 S. GREENFIELD, I. L. W. JONES and C. T. BERRY, U.S. Patent 3.467,471. 16 September 1969. [201 S. GREENFIELD, I. LL. JONES and C. T. BERRY, Analyst 89,713 (1964). [211 S. GREENFIELD, I. LL. JONES. H. McD. MCGEACHIN and P. B. SMITH, Anal. C/h. Acta 74,225 (1975). [221 C. D. ALLEMAND, ICP Information Newslett. 2. I (1976). [231 C. D. ALLEMAND and R. M. BARNES, Appl. Spectrosc. 31,434 (1977).
P. W. J. M. BOUMANS and M. CH. LUX-STEINER
II ‘11 \I
(0) (bl (cl
Fig. 1. Shapes of the rim of the intermediate tube considered.
(al lb) (cl id) (e) Fig. 2. Shapes of the upper end of the aerosol tube considered.
Fig. 3. Geometry of the streamlined torch (dimensions in mm).
M~ification and optimi~tion of a 50 MHZ inductively coupled argon plasma
(v) A possibly low gas consumption rate.*
101
The expectations were borne out in the analytical performance achieved with this torch during three years of experience, as has been documented for inorganic aqueous solutions f 11 and will be shown in this work for organics.
The following features of the torch depicted in Fig_ 3 should be noted. (1) The outer tube extends above the coil to improve the short-term stability and to
protect the coil against the plasma gas. Extending the tube removes the need for a protection collar, as introduced in [I51 and also shown in [28]. An extended tube also tends to decrease band emission caused by interaction of the plasma and the surrounding air.
(2) For the outer dia. of the cup of the intermediate tube we chose the largest value compatible with ease of ignition.
(3) The inner dia. of the cup has been selected so that the intermediate gas efficiently lifts the plasma from the tops of the inner and intermediate tubes, which allows a stable plasma to be maintained with a flow pattern such that there is a minimum risk of deposits on the edges of the tubes when a relatively low intermediate gas flow is used. Keeping this flow as low as possible improves the SBRs. These considerations led to a cup with a thickened wail.
(4) The rim of the intermediate tube cup has been streamlined to promote a laminar flow of the intermediate gas, which faciliates the elimination of carbonaceous deposits when organic material is introduced. Another advantage of the streamlined shape is that the intermediate tube can be located close to the plasma and this enhances the efficiency with which the sample penetrates into the plasma tunnel.
(5) Within the range studied, the height of the cup has no influence on the ignition, but the shorter the cup the better the distribution of the intermediate gas inside the cup so that, similarly to the effect of the thickened wall (3), less intermediate gas is required.
(6) The inner tube has a large outer dia. to decrease the contribution of the intermediate gas flow to the gas stream in the plasma tunnel and to maintain the swirling motion of the intermediate gas.
(7) The inner tube is tapered, which permits the tube to be located very close to the plasma without deposits forming on its exterior.
(8) The long internal restriction at the upper end of the inner tube limits the angle at which the carrier gas is injected into the plasma. Therefore the carrier gas flow can be kept kw and the diameter of the or&e of the injection tube can be large so that favourable conditions are created to give the sample a long residence time in the plasma tunnel. Care should be taken to ensure that there is no abrupt transition between the wide lower and the narrow upper channel in the injection tube, because a too sudden transition may lead to deposits of liquid.
(9) The difference in the axial position of the ends of the intermediate and inner tube is dictated by the requirement that deposits should be avoided. If the top of the inner tube extends too far above the intermediate tube, deposits form on the inner tube, and conversely, if the intermediate tube extends too far above the inner tube, deposits are formed on the intermediate tube.
The torch made it possible to maintain a stable piasma fed with an organic aerosol while the ICP parameters could be varied over relatively wide ranges. This enabled us to explore the ICP under widely varying conditions in optimization experiments so
*We aimed at a conventional gas consumption rate of the order of 10 I min-’ and not at a substantially lower rate as in the proposals for low consumption ICPs (24-271.
[24] G. R. KO~~BLUM, W. VAN DE WAA and L. DE GALAN, And. C&m. 51,2378 (1979). 1251 R. N. SAVAGE and G. M. HIEFTJE. Anal. Chem. 51,408 (1979). [261 C. D. ALIXMAND, R. M. BARNU: and C. C. WOHLERS, Anal. Chem. 51,2392 (1979). [27] R. M. BARNES and G. A. MEYER, Anal. Chem. 52, 1523 (1980). (281 R. K. WINCE, V. A. FASSEL, R. N. KNISELEY. E. DEKALB and W. J. HAAS JR, Spectrochim. Acta 32B.
327 (1977).

102 P. W. J. M. BOUMANS and M. CH. LUX-STEINER
that the optimum could be approached from various sides. This, in turn, increased the likelihood that the eventually found optimum would be close to the “true” optimum and would not represent “emergency conditions” that were decided upon because the optimum was beyond the working range.
2.1.3. Torch base. In this study we preferred a demountable torch to one with prealigned tubes. The latter type is generally preferable in routine work and the commercial version of the torch depicted in Fig. 3 is therefore of a fixed type*.
Bases of demountable torches have been described by various authors [15,29-361. The base used here has some features in common with that proposed by ABDALLAH et
al. [30] and by MERMET and TRASSY 1351.
The construction of the torch base, made of plexiglass, is shown schematically in Figs. 4 and 5. Each tube is fixed in a separate holder by a conc&ntric screw that presses two “0” rings against a cylindrical “washer” enveloping the tube. The three holders are fixed together by two sets of three rotationally symmetrical adjustment screws and tightened by “0” rings. These adjustment screws permit radial movement of the outer and inner tube holders with respect to the holder of the intermediate tube without affecting the gas tightness of the assembly. Thus fine adjustments in the relative radial position of the tubes can be made during ICP operation.
The holder of the intermediate tube contains the gas inlets of the outer and intermediate gas (Fig. 5). Each gas is fed via a concentric channel to four tangential inlets. In this way a swirling motion of the gases is achieved if the total cross-section of the four inlets is the limiting cross-section in the gas introduction line, so that a slight overpressure can build up in the concentric channel.
90s
Fig. 4. Schematic drawing of the axial cross-section of the torch base. (1) Holder of outer tube. (2) Holder of intermediate tube. (3) Holder of inner tube. (4) Concentric screws for fixing the tubes into the holders. (5) Cylindrical washers and “0” rings (0). (6) Screws positioned radially at 120”: these screws fix the holders together and provide for radial adjustment of the
tubes. (cs). Tangential gas inlets (see Fig. 5).
*Philips, S. A., Bd de I’Europe 131, Wavre, Belgium.
[29] G. W. DICKINSON and V. A. FASSEL, Anal. Gem. 41, I021 (1969). 1301 M. H. ABDALLAH, R. DIEMIASZONEK, J. JAROSZ, J. M. MERMET, J. ROBIN and C. TRASSY, Anal. Chim.
Acfa 84.271 (1976). [31] R. H. WENDT and V. A. FASSEL, Anal. Chem. 37,920 (1965). [32] C. VEILLON and M. MARGOSHES. Spectrochim. Acta 23B, 503 (1968). 1331 F. E. LICHTE and S. R. KOIRTYOHANN. ICP Information Newsleft. 1, 200 (1976). (341 K. 0~~s and K. KREFTA. ICP Information NewsleN. 1,200 (1976). [351 J. M. MERMET and C. TRASSY, Appl. Spectrosc. 31,237 (1977). I361 J. F. ALDER and J. M. MERMET. Specrrochim. Acta 28B. 421 (1973).

Modification and optimization of a 50 MHZ inductively coupled argon plasma 103
Fig. 5. Schematic drawing of cross-section perpendicular to the axis of the torch base at the positions (cs) in Fig. 4. (2) Holder of intermediate tube. (7) Gas inlet into the concentric channel. (8) Concentric channel. (9) Tangential gas inlets into the central channel. (IO) Central
channel.
2.2. Nebulizer and spray chamber 2.2.1. Starting-points. At least five types of nebulizer have been proposed in
ICP-AES. viz. (1) (2) (3) (4) (5)
[37] J.
Ult&onic nebulizers (see e.g. [7,8, 15,21,29, 37-461); Cross-flow pneumatic nebulizers (see e.g. [9, 16, 21,43,47-561); Glass, concentric pneumatic nebulizers (see e.g. 155-601); Babington-type nebulizers (see e.g. [61-66]); Fritteddisk nebulizers (see e.g. [67]).
M. MERMET and J. ROBIN, Proc. 14th CoZZ. Speck Ink, Debrecen 1967, vol. 2, p. 715. Hilger, London (1%8).
[38] J. M. MERMET, C. Trussv and P. RIPOCHE. Paper No. 64. Znr. Winter Conf. 1980; Developments in Atomic Plasma Spectrochemical Analysis, San Juan, Puerto Rico (1980).
[39] K. W. OLSON. W. J. HMS JR and V. A. FASSEL. Anal. Chem. 49,632 (1977). [40] V. A. FASSEL, Spec. Tech. Publ. 618, p. 22. American Society for Testing and Materials, Philadelphia,
PA (1977). 1411 J. C. SOUILLIART and J. ROBIN, Analusis 1.427 (1972). [42] H. C. HOARE and R. A. MO~TYN, Anal. Chem. 39, 1153 (1967). [43] S. S. BERMAN. J. W. MCLAREN and S. N. WILLIE. Anal. Chem. 52,489 (1980). [44] R. C. FRY and M. B. DENTON. Anal. Chem. 49, 1413 (1977). [45] C. TRASSY, French Patent No. 79-155575 (1979). Cf. ZCP Znformafion Newsfett. 5, 580 (1980). [46] K. 0. OLSON, W. J. HMS JR and V. A. FASSSEL. U.S. Patent 4, 109,863 (1977). [471 S. E. VALENTE and W. G. SWRENK. Appf. Spectrusc. 24, 197 (1970). [48] R. N. KNISELEY. H. AMENSON, C. C. BUTLER and V. A. FASSEL. Appl. Spectrosc. 28,285 (1974). [49] K. OHLS, K. H. KOCH and H. GROTE. Fresenius Z Anal. Chem. 284, 177 (1977). [50] J. W. NOVAK JR. D. E. LILLIE, A. W. BOORN and R. F. BROWNER. Anal. Chem. 52,576 (1980). [51] H. ANDERSON, H. KAISER and B. MEDD~NGS. Paper No. 65. Znr. Winter Conf. 1980: Developments in
Plasma Spectrochemical Analyses, San Juan, Puerto Rico (1980). [52] C. C. WOHLERS and C. J. HOFFMAN. Paper No. 67, Znt. Winter Conf. 1980: Developments in Plasma
Spectrochemical Analyses, San Juan, Puerto Rico (1980). [53] S. A. MYERS, D. H. TWCY and R. D. EDIGER. Paper No. 62, Znt. Winter Conf. 1980: Developments in
Plasma Spectrochemical Analyses, San Juan, Puerto Rico (1980). [54] A. GU~~AV.S~ON, ZCP Znfonnation Newslett. 6, 312 (1979). [551 S. GREENF~ELD, H. McD. MCGEACH~N and F. A. CHAMBERS, ZCP Znformafion Newsleft. 3, 117 (1977). [56] C. C. WOHLERS, ZCP Information Newsleft. 3, 37 (1977). [57] G. L. Gow, Ann. Chim. Phys. 18, 5 (1879). [58] J. E. ME~NHARD, ZCP Information Newsleft. 2, 163 (1976). [59] J. E. MEINHARD, Paper No. 63, Znt. Winter Conf. 1980: Developments in Atomic Plasma Spec-
trochemical Analyses, San Juan, Puerto Rico (1980). [60] J. E. MEINHARD. in: Applications of Pfasma Emission Spectrochemistry (Edited by R. M. BARNES) p.
1. Heyden, London/Philadelphia (1979). [6l] P. J. MCKINNON. Paper No. 68. Znt. Winter Conf. 1980: Developments in Plasma Spectrochemical
Analyses, San Juan, Puerto Rico (1980). [621 Popular Science, May, p. 102 (1973) and R. S. BABINGTON. U.S. Patents 3.421.692; 3421.699;
3.425.058; 3.425,059; 3.504.859. [63] J. F. WOLCO~ and C. C. BUTLER-S• BEL, Appl. Spectrosc. 32,591 (1978). [64] P. A. M. RIPSON and L. DE GALAN, Spectrochim. Acta. 36B, 71 (1981). [65] R. C. FRY and M. B. DENTON. Appl. Spectrosc. 33, 393 (1979). [66] R. F. SUDDENWRF and K. W. BOYER. Anal. Chem. 50, 1769 (1978). [67] C. T. APEL. T. M. BIENEWSKY. L. E. Cox and D. W. STEINHAUS, ZCP Znform. New&t. 3, 1 (1977).
104 P. W. J. M. BOUMANS and M. CH. LUX-STEINER
In previous work in this laboratory an ultrasonic nebulizer [7,151 had been used, but for various reasons this was replaced [8,9] by a laboratory-built version of the KNISELEY cross-flow pneumatic nebulizer with glass capillaries in stainless steel jacketsi481. This nebulizer was not considered entirely satisfactory because it lacked
short- and long-term stability, was liable to salt deposits and clogging if operated with salt solutions containing more than about 5 mg ml-’ salt, was susceptible to corrosion by hydrofluoric acid solutions, suffered from difficulties in adjusting the fragile glass capillaries without breakage and, in general, because of the overall complexity of the construction. Therefore we designed a new nebulizer that met the various objections to a substantial extent. We did not put special emphasis on “efficiency”, but strove to achieve the “few percent efficiency level” commonly associated with these types of nebulizer.
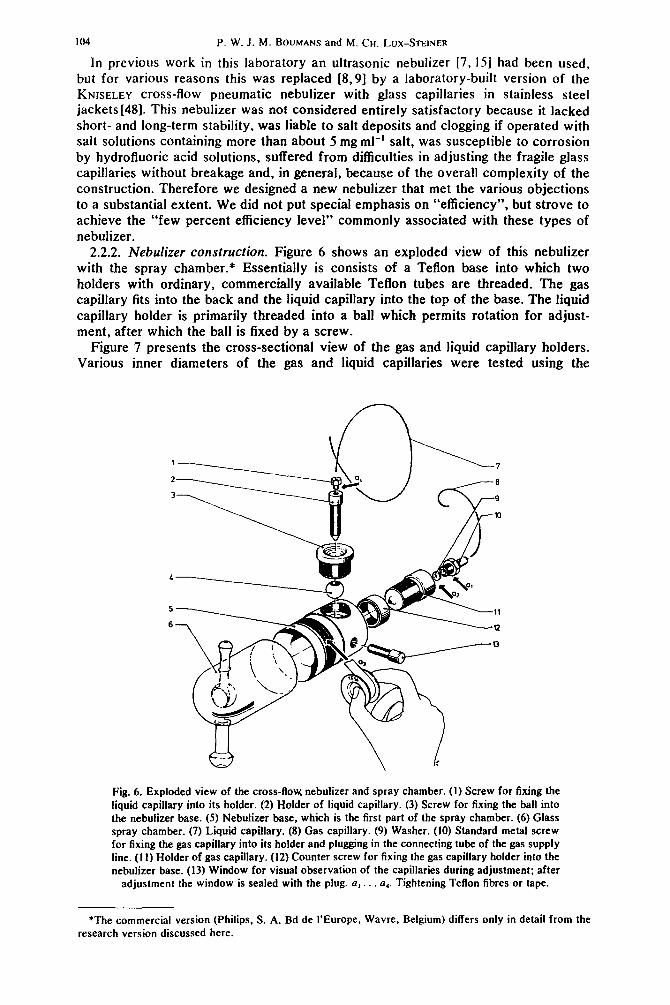
2.2.2. Nebulizer construction. Figure 6 shows an exploded view of this nebulizer with the spray chamber.* Essentially is consists of a Teflon base into which two holders with ordinary, commercially available Teflon tubes are threaded. The gas capillary fits into the back and the liquid capillary into the top of the base. The liquid capillary holder is primarily threaded into a ball which permits rotation for adjust- ment, after which the ball is fixed by a screw.
Figure 7 presents the cross-sectional view of the gas and liquid capillary holders. Various inner diameters of the gas and liquid capillaries were tested using the
Fig. 6. Exploded view of the cross-flow nebulizer and spray chamber. (1) Screw for fixing the liquid capillary into its holder. (2) Holder of liquid capillary. (3) Screw for fixing the ball into the nebulizer base. (5) Nebulizer base. which is the first part of the spray chamber. (6) Glass spray chamber. (7) Liquid capillary. (8) Gas capillary. (9) Washer. (10) Standard metal screw for fixing the gas capillary into its holder and plugging in the connecting tube of the gas supply line. (I 1) Holder of gas capillary. (12) Counter screw for fixing the gas capillary holder into the nebulizer base. (13) Window for visual observation of the capillaries during adjustment; after
adjustment the window is sealed with the plug. ~1,. .a,. Tightening Teflon fibres or tape.
*The commercial version (Philips, S. A. Bd de I’Europe. Wavre, Belgium) differs only in detail from the research version discussed here.
Modification and optimization of a SO MHZ inductively coupled argon plasma
+
105
7 1 a; 2
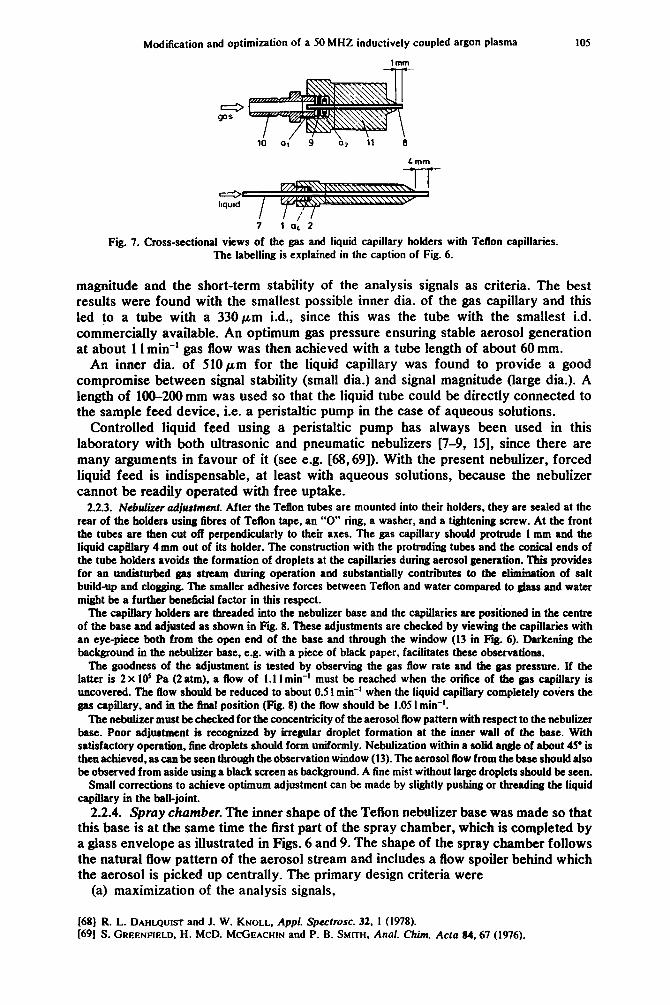
Fig. 7. Cross-sectional views of the gas and liquid capillary holders with Teflon capillaries. The labelling is explained in the caption of Fii. 6.
magnitude and the short-term stability of the analysis signals as criteria. The best results were found with the smallest possible inner dia. of the gas capillary and this led to a tube with a 330 pm i.d., since this was the tube with the smallest i.d. commercially available. An optimum gas pressure ensuring stable aerosol generation at about 1 I min-’ gas flow was then achieved with a tube length of about 60 mm.
An inner dia. of 510pm for the liquid capillary was found to provide a good compromise between signal stability (small dia.) and signal magnitude (large dia.). A length of MO-200 mm was used so that the liquid tube could be directly connected to the sample feed device, i.e. a peristaltic pump in the case of aqueous solutions.
Controlled liquid feed using a peristaltic pump has always been used in this laboratory with both ultrasonic and pneumatic nebulizers [7-9, 151, since there are many arguments in favour of it (see e.g. [68,69]). With the present nebulizer, forced liquid feed is indispensable, at least with aqueous solutions, because the nebulizer cannot be readily operated with free uptake.
2.2.3. Nebdizer adjustment. After the Teflon tubes are mounted into their holders, they are sealed at the rear of the holders using fibres of Teflon tape, an “0” ring, a washer, and a tightening screw. At the front the tubes are then cut off perpendicularly to their axes. The gas capillary should protrude 1 mm and the liquid capillary 4 mm out of its holder. The construction with the protruding tubes and the conical ends of the tube holders avoids the formation of droplets at the capillaries during aerosol generation. This provides for an undisturbed gas stream during operation and substantially contributes to the elimination of salt build-up and clogging. The smaller adhesive forces between Teflon and water compared to glass and water might be a further beneficial factor in this respect.
The capillary holders are threaded into the nebulizer base and the capillaries are posi&oned in the centre of the base and adjusted as shown in Fig. 8. These adjustments are checked by viewing the capillaries with an eye-piece both from the open end of the base and through the window (13 in Pi. 6). Darkening the background in the nebuliir base, e.g. with a piece of black paper, facilitates these observations.
The goodness of the adjustment is tested by observing the gas flow rate and the gas pressure. If the latter is 2 x lo’ Pa (2atm). a flow of 1.1 I min-’ must be reached when the otice of the gas capillary is uncovered. The flow should be reduced to about 0.5 I min-’ when the liquid capillary completely co\iers the gas capillary, and in the final position (pi. 8) the flow should be 1.05 I min-‘.
The nebulizer must be checked for the concentricity of the aerosol flow pattern with respect to the nebuliir base. Poor adjustment is rccow by irregular droplet formation at the inner wall of tbe base. With satisfactory operation, fine droplets should form uniformly. Nebulization within a solid angle of about 45’ is then achieved, as can be seen through the observation window (13). The aerosol flow from the base should also be observed from aside using a black screen as background. A fine mist without large droplets should be seen.
Small corrections to achieve optimum adjustment can be made by slightly pushing or threading the liquid capillary in the ball-joint.
2.2.4. Spray chamber. The inner shape of the Teflon nebulizer base was made so that this base is at the same time the first part of the spray chamber, which is completed by a glass envelope as illustrated in Figs. 6 and 9. The shape of the spray chamber follows the natural flow pattern of the aerosol stream and includes a flow spoiler behind which the aerosol is picked up centrally. The primary design criteria were
(a) maximization of the analysis signals,
168) R. L. DAHLQUIST and .I. W. KNOLL, Appl. Specfrosc. 32. I (1978). [69] S. GREENFIELD. H. McD. MCGEACHIN and P. B. SMITH, Anal. Chim. Acta 84.67 (1976).

106 P. W. J. M. BOUMANS and M. CH. LUX-STEINER
a a
llquld ltqud
la) I b)
Fig. 8. Definitive positions of the liquid and gas capillaries: (a) seen through the observation window, (b) seen from the open end of the nebulizer. The labelling~is explained in the caption
of Fig. 6.
II ICP
Fig. 9. Schematic drawing of the complete nebulizer system encompassing nebulixer. spray chamber, and “u” tube..
(b) minimization of signal fluctuations, and (c) minimization of memory effects. Since criteria (a) and (c) lead to a small volume, and criterion (b) to a large volume,
a compromise was found. The spray chamber incorporates the following features that contributed to in-
creased short-term signal stability and reduced drift and memory effects (i) a small “appendix” at the bottom of the flow spoiler smoothes the removal of
condensed liquid to the drain; (ii) nebulizer and spray chamber are set up in an inclined position to ease the
removal of liquid condensed on the wall; (iii) the “U” tube, required to maintain a constant over-pressure in the spray
chamber, has a wide and a narrow leg; this ensures a smooth liquid flow to the drain and avoids pressure oscillations in the spray chamber when droplets fall from the “appendix” into the “U” tube. When both legs are equally wide, oscillations in the liquid level caused by falling droplets produce pressure variations and consequently signal fluctuations.
Much of the experience gained in spray chamber design in this work coincides with that communicated in detail by SCHUTYSER and JAN~~ENS [70], who made their study independently and were unaware of the description of one of the experimental versions of this spray chamber in a conference paper [71 I.
2.2.5. Performance tests. The nebulizer performance was primarily tested by observing the magnitude of analyte signals and signal-to-background ratios, and the
1701 P. SCHU~SER and E. JANSSENS, Spectrochim. Acta 34B. 443 (1979). [71] P. W. J. M. BOUMANS. Invited lecture, 25th Canadian Spectroscopy Symposium, Mont Gabriel 1978.
Cf. ICP Information Newslett. 4, 305 (1978).

Modification and optimization of a 50 MHZ inductively coupled argon plasma 107
stability of analyte and background signals in the ICP. Results for aqueous solutions
with and without salt matrices. detailed in [l], have documented the satisfactory performance as to both the magnitude of analyte signals and SBRs and the short-term stability of background and anaiyte signals, which was found to be OS-l% expressed as a relative standard deviation for consecutive 10 s integrations. Similar results were obtained with organic solvents.
The efficiency of the nebulizer plus spray chamber was occasionaily determined for aqueous solutions using differential measurements and was found to be about 3%. a figure that has to be considered with caution [39].
Experience over various years indicates that the long-term stability is most satisfactory, but this has not been quantified since measurements aimed at this quantification interfered with the work in the research department, involving frequent modifications in the spectrometric and electronic equipment. Clogging was not obser- ved during experiments with organic solvents oi aqueous solutions with 10% (w/v) glucose or albumin. The clogging effect of salts was tested for up to 8% (w/v) solutions of KzS04, Li2SOI, NaCl, MgC&, NaBr and KI. This test implied feeding alternately the salt solution and a 0.05 M HCI solution at 2 min intervals to the nebulizer over a total time of 40 min. An analysis signal (Mn I 403.08 nm) from the ICP was measured during the injection of each salt solution and the absence of drift in this signal was taken as a criterion for the absence of clogging effects. After each 40min cycle the nebulizer was cleaned by feeding in a detergent solution for a few minutes, followed by flushing with 0.05 M HCI. Under these conditions no clogging effects were observed.
Since clogging effects may be related to the solubility of the salt, we mention here the ratios of the concentrations used and the solubilities (20°C) for the above salts, viz. 0.67 (K#O,), 0.31 (L&SO,), 0.22 (NaCI), 0.1 (MgCl,), 0.09 (NaBr) and 0.06 (KI). We further found that with NaF (solubility 45 mg ml-‘) no problems occurred with a 20 mg ml-’ but that 40 mg ml could not be accommodated.
2.3. Sample feed device It is well known from flame spectrometry [72-781 that the nebulization process may give rise to unspecific
“physical” interferences due to the difference in physical properties (density. viscosity. and surface tension) between analysis and reference samples. Therefore controlled or forced sample feed is generally preferable, the more so since it also makes the sample flow to the nebulizeF independent of the liquid head in the sample beaker. The advantages of controlled sample feed have been extensively documented in ICP-AES by GREENPIELD et al. [69] and by DAHLQIJIST and KNOLL [68]. These advantages have always been exploited in this laboratory by feeding aqueous solutions to the nebulizer with a peristaltic pump. With organic solvents. however, problems may arise, because tubes that have the flexibility for use in a peristaltic pump do not withstand organic solvents such as MIBK. On the other hand controlled sample feed for organic liquids may be. even far more stringent than for aqueous solutions. This is so because the nebuliition efficiency may differ widely among organic solvents. A recent study published by BOORN et al. [79] indicates that such nebulization efficiency differences are primarily due to evaporation effects when groups of organic solvents are compared, whereas surface tension effects are likely to dominate when aqueous and organic solvents are compared.
Given the ICP configuration and the power input, the rate at which an aerosol can be introduced has a limit above which the plasma cannot be stably operated. Since this rate is dictated by the sample feed rate and the nebulization efficiency, controlled sample feed is desirable here to accommodate organic solvents
[72] J. A. DEAN, FTamc Photometry. McGraw-Hill, New York (1960). [73] R. HERRMANN, Nebulisers and Burners, Flame Emission and Atomic Absorption Spectrometry
(Edited by J. A. DEAN and T. C. RAINS). vol. 2, Chap. 3. p. 57. Marcel Dckker, New York (1971). [74] R. HERRMANN and C. TH. J. ALKEMADE, Chemical Analysis by Flame Photometry. Wiley, New York
(1%3). [75] C. TH. J. ALKEMADE and R. HERRMANN. Fundamentals of Flame Spectroscopy. Hilger, Bristol (1979). [76] R. MAVRODINEANU and H. BOITEUX, Flame Spectroscopy. John Wiley, New York (1%5). [77] E. PUNGOR, Flame Photometry Theory. Van Nostrand, New York (1967). 1781 S. R. KOIRTYOHANN, Physical Interferences in Flame Emission and Absorption Methods, Flame
Emission and Afomic Absorption Spectrometry, (edited by J. A. DEAN and T. C. RAINS), vol. 1, chap. 16. p. 295. Marcel Dekker, New York (1969).
1791 A. W. BOORN, M. S. CRESSER and R. F. BROWNER, Spectrochim. Acta 35B, 823 (1980).
SAB Vol 37. No. Z-B

lo8 P. W. J. M. BOUMANS and M. CH. LUX-STEINER
whose nebulization characteristics differ widely from those of water. By way of illustration we point to the results of BOORN et of. [79]. who determined the maximum tolerable aspiration rates for the series benzene, toluene, xylene and nitrobenzene to be 0.05.0.4, 2.5 and < 6.5 mot min-‘. respectively.
For the above reasons we developed a sample feed device that permits the use of a peristaltic pump with organic solvents but circumvents the problem of the corrosion of the tube in the pump. The principle is to suck up the liquid from the sample beaker into a reservoir by the action of the pump and to force the liquid subsequently out of the reservoir to the ICP using the same pump but after switching the connecting tubes between sample beaker, reservoir, ICP and pump. Using a combination of pumps, reservoirs and switching valves, we constructed a device that enables it to feed a series of samples (e.g. analysis, blank and reference samples) successively to the nebulizer without any interruption in the liquid flow to the nebulizer, so as to maintain constant conditions in the nebulizer, spray chamber and ICP during the complete sequence of measurements, and with a minimum risk of cross-contamination and a minimum cycling time. Details of this sample feed device will be given in a separate note [80].
2.4. Other apparatus The RF generator, work coil, gas flow control unit and peristaltic pumps were
similar to those stated in Table la of [l]. The characteristics of the spectrometer, detectors, and measuring electronics used
in this work are summarized in Table 1. The entrance optics projected a 5 mm high ICP zone including the axis on the
entrance slit using a combination of three Suprasil (Hereaus) silica lenses. A spherical lens (L,) imaged the ICP on an intermediate diaphragm and this image was focused with a second spherical lens (LJ onto the slit. A cylindrical lens (L,) with horizontal axis at the slit imaged lens Lz on the grating to ensure that the radiation entering the slit also passed through the limiting aperture of the monochromator. To allow for the chromatic aberration of the lenses the optical components were arranged in two different ways for measurements below or above 3OOnm, so that a maximum radiant flux was achieved where this was the most stringent, in particular in the low ultraviolet region.
The measurements for the optimization of the “organic ICP” with MIBK solvent (Section 3.3), including the measurements of the background equivalent concen- trations under optimum conditions (Section 3.4), were performed using the com- bination of grating (a) and PMT (i) for A C 300 nm (first order) and the combination of
Table 1. Specification of spectroscopic and electronic equipment
Honochrometor
Gratings*
Slits
Photomultipliers* (PMT)
High voltage supply
Electronics
Strip chart recorder
Integrator
0.5 m Jarrell-Ash Ebert monochromator
(a) 2400 grooves/mm, blaze 300 nm (of recent date)
(bl ;~;;~grooves/mm, blaze 500 "m
20 or 25 pm wide and 10 or 8.5 mm high
(i) Hamamatsu R395 (solar blind) (ii) Hamamatsu R955
Both PMTs operated at 1000 V
Philips PE 1533
Ortec Brookdeal model 9503 lock-in amplifier tuned to 280 Hz in conjunction with a variable speed chopper lFalrlight model 7501) placed at the positlon of the intermediate diaphragm
Phlllps PM 8221
Kelthley model 720 (A"al.Chem. 49, 1869 (1977)) in conjunction with a laboratory-built converter from binary to digital display
*The wavelength regions in which these gratings and PMTs were used are specified in Section 2.4.
[SO] M. CH. LUX-STEINER and P. W. J. M. BOUMANS, Spectrochim. Acta B (in preparation).

Modification and optimization of a 50 MHZ inductively coupled argon plasma 109
grating (b) and PMT (ii) for A > 300 nm (second order with appropriate filters). The
practical resolution under these conditions was about 0.03 nm.
2.5. Chemicals Reagent grade chemicals were used throughout. In the experiments with MIBK as
solvent, the metals were added as organo-metallo compounds using Conostan reference samples and Conostan dilution oil.
3. RESULTS AND DLSCUSSION
3. I. Compromise conditions for simultaneous multielement analysis and the choice of representative spectral lines and measurement criteria for establishing them
In the following sections we shall deal with the re-optimization of the parameter setting of the modified ICP for aqueous solutions and the optimization of this setting for organic solvents. These studies were based on earlier experience with argon ICPs in this laboratory [7, 9, 81, 821, which will be summarized in a broader context elsewhere [83]. A crucial point is that such optimizations can be carried out with a minimum number of measurements if the spectral lines used in the optimization are chosen in a rational way and one recognizes that the margins in the parameter setting, for which an argon ICP shows its amply-documented excellent analytical per- formance, are extremely small. We shall discuss this point at some length prior to embarking upon the optimization experiments themselves. This is the more interesting since investigations of vertical spatial emission profiles in the ICP by the groups of HORLICK [lO-121 and KAWAGUCHI [13,14] have led to a far better understanding of the relationships upon which our empirical approach is based, and have indicated that this approach is sound, although the interpretation of several of the arguments in favour of it does require some revisions in the light of the recently published results of the two groups mentioned [ll, 12, 141.
Summarizing the basis of this approach appears useful also because some recent publications (84,851 seem to indicate that single-element optimixations using a simplex approach may open entirely new perspectives for finding essentially better analysis conditions than can be achieved under judiciously chosen compromise conditions such as have been firmly established for argon ICPs (e.g. f7.9. 16. 17,86.87]) and which can be rc-established for these ICPs even after fairly drastic changes in the ICP system. It is true that one cannot maximize the signal-to-background ratios of ull possible spectral lines simultaneously, but it is also true that one only needs the best lines of the elements for analysis and that the “maximum SBR criterion” is not the only ground on which opesating conditions should be chosen. Our view on this point and the underlying arguments have been given in a previous paper [l].
First we must recall that in this laboratory we define compromise conditions for aqueous solutions as that parameter setting which yields good detection limits for the great majority of the elements normally covered by ICP-AES and at the same time provides a good balance between the overall detection power and multiplicative interferences, the latter being assessed in particular, on the basis of influences from alkalis.
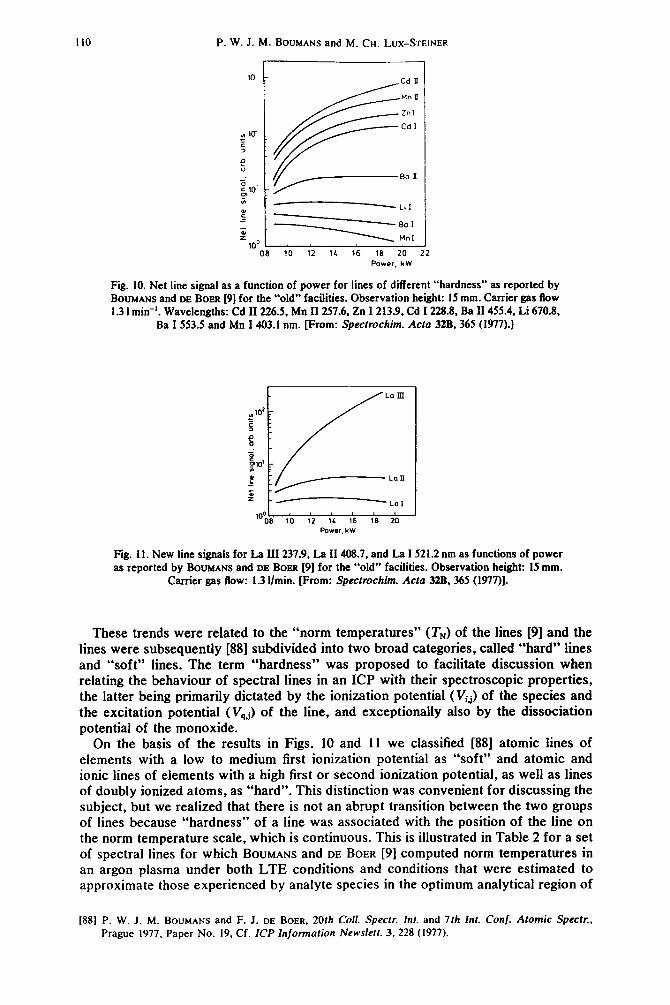
We then recall the trends of the net line signals of a set of spectral lines as functions of power in an argon ICP for a fixed observation zone located between 12.5 and 17.5 mm above the coil and a fixed carrier gas flow of 1.3 I mitt-‘* (Figs. 2 and 3 in [9]). For convenience, these figures are reproduced here as Figs. 10 and 11.
*This high numerical value of the carrier gas flow rate should not be misunderstood: it pertains to our former, cylindrical torch, for which the optitnutn was about 1.45 I min-‘. We shall see in this work that the latter value is equivalent to about 1.0 min-’ in the new streamlined torch with tulip-shaped intermediate tube.
(811 P. W. J. hf. BOUMANS and F. J. DEBOER. Proc. Anal. I%. Chem. SC. If, 140 (1~5).
1821 P. W. J. M. BOUMANS, L. C. BASTINGS. F. J. DE BOER and L. W. I. VAN KOLLFJNBURG, FRSC~~US Z. AMI. Chem. 291. 10 (1978).
1831 P. W. J. hf. BOUMANS (Editor) Analysis by Inductively Coupled Plasma Atomic Emission spec- tromctry, Chemical Analysis Series. John Wiley, New York (1981).
[84] S. GREENFIELD and D. THORNBURN BURNS, Anal. Mm. Acta 113,205 (1980). 1851 L. EBDON. M. R. CAVE and D. J. MOWTHORPE, Anal. C/rim. Acta 115, 179 (1980). 1861 S. S. BERMAN and I. W. MCLAREN. Appl. Spectrosc. 32,372 (1978). [871 G. DUBE and M. I. BOULOS, Can. 1. Spcctrosc. 22,68 (1977).
110 P. W. J. M. BOUMANS and M. Cu. LUX-STEINER
08 10 12 1L 16 16 20 22
Power, kW
Fii. 10. Net line signal as a function of power for lines of different “hardness” as reported by BOUMANS and DE BOER [9] for the “old” facilities. Observation height: IS mm. Carrier gas flow 1.3 1 mitt-‘. Wavelengths: Cd II 226.5, Mn II 257.6. Zn 1213.9. Cd I 228.8, Ba II 455.4, Li 670.8,
Ba 1553.5 and Mn 1403.1 nm. [From: Spectrochim. Acta 32B, 365 (1977).]
1°oL-lW Power. kW
Fig. 11. New line signals for La III 237.9, La II 408.7, and La I 521.2 nm as functions of power as reported by BOIJMANS and DE BOER [9] for the “old” facilities. Observation height: 15 mm.
Carrier gas flow: 1.3 l/min. [From: Spectrochim. Actn 32B. 365 (1977)].
These trends were related to the “norm temperatures” (TN) of the lines [9] and the lines were subsequently [88] subdivided into two broad categories, called “hard” lines and “soft” lines. The term “hardness” was proposed to facilitate discussion when relating the behaviour of spectral lines in an ICP with their spectroscopic properties, the latter being primarily dictated by the ionization potential (Vi> of the species and the excitation potential (V,J of the line, and exceptionally also by the dissociation potential of the monoxide.
On the basis of the results in Figs. 10 and 11 we classified [88] atomic lines of elements with a low to medium first ionization potential as “soft” and atomic and ionic lines of elements with a high first or second ionization potential, as well as lines of doubly ionized atoms, as “hard”. This distinction was convenient for discussing the subject, but we realized that there is not an abrupt transition between the two groups of lines because “hardness” of a line was associated with the position of the line on the norm temperature scale, which is continuous. This is illustrated in Table 2 for a set of spectral lines for which BOUMANS and DE BOER [9] computed norm temperatures in an argon plasma under both LTE conditions and conditions that were estimated to approximate those experienced by analyte species in the optimum analytical region of
[88] P. W. J. M. BOUMANS and F. J. DE BOER, 20th Co/l. Speck Int. and 7th Jnl. Conf. Atomic Spectr., Prague 1977, Paper No. 19. Cf. ICP Information Newslett. 3,228 (1977).

hfodification and optimization of a 50 MHZ inductively coupled argon plasma 111
Table 2. Estimated norm temperatures (T.) of some spectral lines under the conditions prevailing in an argon ICP (see 191 for basic data and the assumptions underlying the calculations)
w* t Spectral line V V v l v
q.j i.J TN
i.J 9.j
(nm) (v) iml i.2 1.3 (Kl (VI
Ba I 553.5 2.24 5.21 - 2650 - 4500 7.45 Li I 6’70.8 1.85 5.39 - 2850 - 4900 7.24 La I 521.2 2.89 5.58 - 2900 - 5100 8.47 Mn I 403.1 3.08 1.43 - 3100 - 6300 10.51 Ba II 455.4 2.72 10.00 6600 - 8000 12.72 La II 408.7 3.03 11.06 8000 - 8800 13.09 ca II 396.8 3.12 11.87 - 9600 14.99 Cd I 228.8 5.42 El.;9 - 11000 14.41 Zn I 213.9 5.80 9.39 - 11500 15.19 Mg II 280.3 4.42 15.03 - 13700 19.45 Mn II 257.6 4.81 15.64 - 14000 20.45 Cd II 226.5 5.41 16.91 - 15600 22.38 La III 237.9 5.19 19.17 17200 24.36
*i refers to the stage of ionization. When a range is stated, the lower value is based on the LTE electron density and the upper
one on an electron density of 10i6cm-‘. In a low-power ICP the norm temperature will be somewhere in between these extreme values. At norm temperatures above IOOOOK, the difference is no longer relevant.
an ICP, i.e. conditions with a suprathermal electron number density, taken to be 1016 cm-‘t
We inferred from the curves of net line signal vs power (Figs. 10 and 11) that the Ba II and La II lines constituted the upper layer of the “soft” group and we thus lixed the transition at TN - 9000 K. This point requires revision, however, in the light of the results of BLADES and HORUCK [Ill, who show that the Ba II and La II lines must be reckoned among the hard lines. This revision does not invalidate our arguments used in choosing representative lines for ICP optimization, but rather reinforces them, as will become evident from the following considerations.
(i) All observations of net line intensity as a function of the principal ICP parameters (power, carrier gas flow, observation height) in this laboratory showed that hard lines behave very similarly within certain ranges of these parameters, i.e. above a critical observation height and below a critical carrier gas flow rate [7, 9, 81-831. This essentially agrees with the results reported by BERMAN and MCLAREN [86] and DUBE and Bouu>s [87], and, as will be discussed more extensively below, with the recent results of BLADES and HORLICK [ 1 l] and KAWAGUCHI et al. [ 141.
(ii) The similarity in the behaviour of hard lines not only applies to the net line signals but also to the matrix effect produced by easily ionizable elements, This is illustrated in Fig. 1 in [82], which is reproduced here as Fig. 12.
(iii) The behaviour of soft lines differed essentially from that of hard lines in both respects (i) and (ii) and the behaviour also varied widely among the soft lines (see Figs. 12 and 13), which show the dependence of the matrix effect of KC1 and the net line signal, respectively, on the carrier gas flow.
(iv) The behaviour of the background signal as a function of the principal ICP parameters varied slightly with wavelength but was in principle the same at all wavelengths, so that the distinctions in the behaviour of signal-to-background ratios of different spectral lines could be essentially reduced to the distinctions in the behaviour of the net line signals.
(v) Accordingly we concluded the following: if one finds the operating conditions that yield a maximum SBR for one hard line, these conditions are likely to be close to
tAs Table 2 shows, the difference between the two extreme values of TN decreases with increasing TN and disappears above 9000K. This is so since the LTE value of the electron density at the norm temperature then coincides with or exceeds 10” cm-‘. The upper values of TN in Table 2 correlate well with the sum (Vii + Vqj). Thus one computes from these data the relationship T,., = 750 (Vi, + Vqj) - 940, which may be used for roughly estimating T,, instead of performing rigorous and more time-consuming cai- culations.

II2 P. W. J. M. BOUMANS and hf. Cu. LUX-STEINER
I I I , , ,I 1 1 1 41
i ICI- I
06 I I I I I , , , 130 140 150 1M)
Carrier gas flow rate. llmin
Fig. 12. Matrix effect produced by IOmgmll’ KC1 on the net signals of various spectral lines as reported by BOUMANS et of. [82] for the “old” facilities. Power: 1.15 kW. Observation height: 15 mm. Wavelengths: Li I 670.8, Mg I 285.2, Mn I 483.1, Ba I 553.5. Cu I 327.4, Y II 371.0, V II 308.3, Sr II 407.8, and Mn II 257.6. [From: Fresenius Z. And. Chem. 291, 10
(1978).]
Corner gos flow, l/mm
Fig. 13. Net line signal as a function of carrier gas flow for spectral lines of different “hardness”. Power: 1.15 kW. Observation height: I5 mm. The lines are arranged in order of increasing hardness from top to bottom. The wavelengths are those stated in the captions of
Fig. 12. The results are for the “old” facilities.
the optimum conditions for all the hard lines. As found from several years of experience with Mn II 257.6 nm, as the representative “hard line”, this deduction was true: we could never improve an SBR of any other hard line by, say, more than a factor of 2, by deviating from the optimum for Mn II 257.6 nm.
(vi) An optimization involving the maximization of the SBRs of hard lines might

Modification and optimization of a 50 MHZ inductively coupled argon plasma 113
seem to yield an unfair compromise with respect to the soft lines. This is SO, but there are good arguments for accepting it.
First, and most important, is that the majority of the elements accessible with an ICP have hard lines as their most prominent lines [2,7,9,41].* Since these lines primarily dictate the detection limits of the elements, an optimization should rationally refer to these lines and not to those of secondary importance.
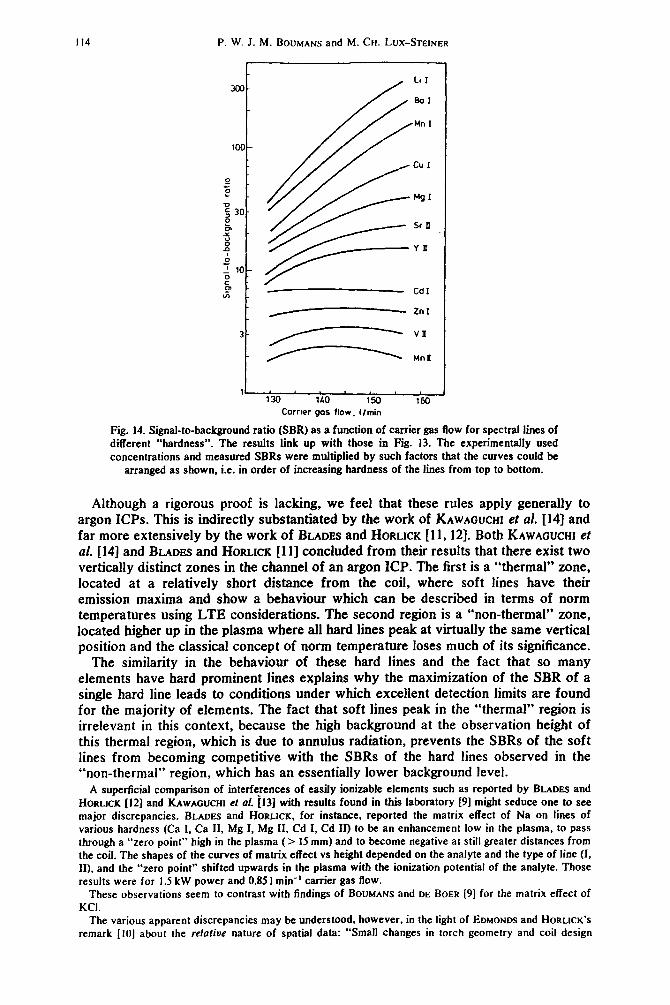
Second, if one were to bias the compromise conditions more in favour of the soft lines, another difficulty would appear. This is illustrated in Fig. 14 for the optimization with respect to carrier gas flow at an observation height close to the eventual optimum. This figure is the SBR picture that links up with the picture of the net line signals in Fig. 13. Note again that both figures are for the old torch, for which a 1.45 I m-’ carrier gas flow was optimum. We see that only for the very soft lines (Li I, Ba I, and Mn I) can the SBRs be improved by more than a factor of two, by increasing the carrier gas flow above 1.45 1 min-‘. However, doing this brings us rapidly into the region where matrix affects become catastrophic, as is illustrated in Fig. 12.
(vii) A further vital feature we recognized was the dependence of the interference effect of alkalis on observation height. For hard lines, this effect depended far less critically on observation height than for soft lines (see, in particular, Fig. 6 in [7] and Fig. 5 in [9]). For the last group of lines the effect could be easily shifted from a severe suppression when measured relatively low in the plasma to a severe enhance- ment when observed at a relatively large distance from the coil, and a point could be found where it was essentially absent (see results for Li I in Fig. 6 in [7] and Fig. 5 in [9]). The height at which this “zero point” was found differed from line to line, but it was possible to find such a height that the matrix effect for all lines remained within acceptable margins, for example, between f 15% for 10 mg ml-’ KCl.
The results taken as a whole, and the above considerations, led us to the following rules for the re-optimization of our argon ICP when modifications in the system, in particular the torch or the nebulizer, had been effected.
(1) Power: Choose the lowest possible power compatible with stable operation of the generator. This rule always led us to a power level of about 1 kW, since the generator has been designed for a power range between about 0.8 and 2 kW. In this range, the SBRs of all spectral links decrease with increasing power, at least at carrier gas flows and observation heights in the vicinity of the ultimate optimum values.
(2) Carrier gas flow: Having fixed the power, select an observation zone of approx. 5 mm in height, the centre of which is located at 15 mm above the work coil. Vary the carrier gas flow rate while observing the SBR of Mn II 257.6 nm. Fix the carrier gas flow at the point of maximum SBR.
(3) Observation height: Observe the matrix effect of 10 mg ml-’ KC1 on the net signals of lines such as Li I 670.8, Ba I 553.5, Mn II 257.6 and Zn I 213.9 nm, for observation heights within a range of 2 2 or 3 mm from the starting-point of 15 mm, and adapt the observation height, if the matrix effect departs appreciably from the + 15% level.
(4) Final adjustment: Check whether the matrix effect of KC1 on the lines men- tioned in (3) may be further reduced by slight adaptations of the carrier gas flow and choose this flow accordingly.
The application of these rules after modifications in the system always led us rapidly to new compromise conditions under which, again, excellent analytical per- formance was achieved (cf. Section 3.2 and [l]).
*The only serious exceptions are the alkalis, but these elements require a separate treatment anyhow if their detection limits should be optimixed [89,90], and it would be irrational to let them carry too much weight in the choice of compromise conditions for all other elements.
[89] P. W. J. M. BOUMANS. Paper NO. 50. Int. Winter C~nf. 1980: Developments in Atomic Plasma Spectrochemical Analyses. San. Juan, Puerto Rico (1980).
[!20] P. W. J. M. BOUMANS. Spectrochim. Aclo B (in preparation).
114 P. W. J. M. BOUMANS and M. CH. LUX-STEINER
Corner gas flow, llmin
Fig. 14. Signal-to-background ratio (SBR) as a function of carrier gas flow for spectral lines of different “hardness”. The results link up with those in Fig. 13. The experimentally used concentrations and measured SBRs were multiplied by such factors that the curves could be
arranged as shown, i.e. in order of increasing hardness of the lines from top to bottom.
Although a rigorous proof is lacking, we feel that these rules apply generally to argon ICPs. This is indirectly substantiated by the work of KAWAGUCHI et al. [14] and far more extensively by the work of BLADES and HORLICK [ll, 121. Both KAWAGUCHI et al. [14] and BLADES and HORLICK [l I] concluded from their results that there exist two vertically distinct zones in the channel of an argon ICP. The first is a “thermal” zone, located at a relatively short distance from the coil, where soft lines have their emission maxima and show a behaviour which can be described in terms of norm temperatures using LTE considerations. The second region is a “non-thermal” zone, located higher up in the plasma where all hard lines peak at virtually the same vertical position and the classical concept of norm temperature loses much of its significance.
The similarity in the behaviour of these hard lines and the fact that so many elements have hard prominent lines explains why the maximization of the SBR of a single hard line leads to conditions under which excellent detection limits are found for the majority of elements. The fact that soft lines peak in the “thermal” region is irrelevant in this context, because the high background at the observation height of this thermal region, which is due to annulus radiation, prevents the SBRs of the soft lines from becoming competitive with the SBRs of the hard lines observed in the “non-thermal” region, which has an essentially lower background level.
A superficial comparison of interferences of easily ionizable elements such as reported by BLADES and HORLICK (121 and KAWAGUCHI cl al. [13] with results found in this laboratory [9] might seduce one to see major discrepancies. BLADES and HORLICK, for instance, reported the matrix effect of Na on lines of various hardness (Ca 1. Ca II. Mg I, Mg II, Cd I, Cd II) to be an enhancement low in the plasma, to pass through a “zero point” high in the plasma (> I5 mm) and to become negative at still greater distances from the coil. The shapes of the curves of matrix effect vs height depended on the analyte and the type of line (I, II), and the “zero point” shifted upwards in the plasma with the ionization potential of the analyte. Those results were for I.5 kW power and 0.85 1 min-’ carrier gas flow.
These observations seem to contrast with findings of BOUMANS and DE BOER [9] for the matrix effect of KCI.
The various apparent discrepancies may be understood, however, in the light of EDMONDS and HORLICK’S remark [IO] about the rehliue nature of spatial data: “Small changes in torch geometry and coil design

Modification and optimization of a 50 MHZ inductively coupled argon plasma 115
certainly alter the absolute position and intensity axes of these plots. However, even Over six different torches and one major change in coil geometry (a three-turn coil rather than a two-turn coil) the basic nature of these plots has been very consistent and reproducible.” Thus a difference between the experimental conditions (torch contiguration. coil, frequency etc.) used by BLADES and HORLICK and those used in this laboratory may have given rise to different spatial emission characteristics when projected on an absolute scale. but which are essentially similar in nature if judged on a relalioc scale. Our analytical working point at I5 mm observation height, yielding slight to medium suppressions of hard line intensitres by alkalis, would then correspond to a working point at 20 mm in the ICP studied by BLADES and HORLICK. If this is considered. the results are seen to coincide rather than to contrast.
3,2. Re-optimization of the ICP operating conditions for the new torch and nebulizer: aqueous solutions with inorganic matter
We found no reason to depart from the previously chosen power level of 1.1 kW [9] and confirmed the early experience of Scorr et al. [16] with tulip-shaped intermediate tubes that a lower outer gas flow (14 instead of 19 1 min-‘) could be safely used.
Following rule 2 of Section 3.1 we observed that the interesting trajectory of the carrier gas flow had drastically changed from 1.3-1.6 I min-’ for the previous facilities to 0.8-1.1 I min-’ for the present ones (Fig. IS). We attribute this to the modified gas flow pattern produced by the tulip-shaped intermediate tube and not, for instance, to a change in the cold gas velocity, since the orifice dia. in the inner tube was the same as formerly (1.80 mm). The discrepancy between the relatively high carrier gas flow of 1.3-1.45 1 min-’ found optimum in our earlier work [9,82] and the - 1.0 1 min-’ level recommended by other workers, e.g. [16,86,87,913, thus seems to be primarily due to the difference in intermediate tubes, cylindrical vs tulip-shaped.
Fiie 15 further indicates that the precise choice of carrier gas flow and obser- vation height within the ranges of 0.8-1.11 min-’ and 12-16 mm, respectively, is uncritical for the Mn II line, which.agrees with our earlier experience for hard lines in general.
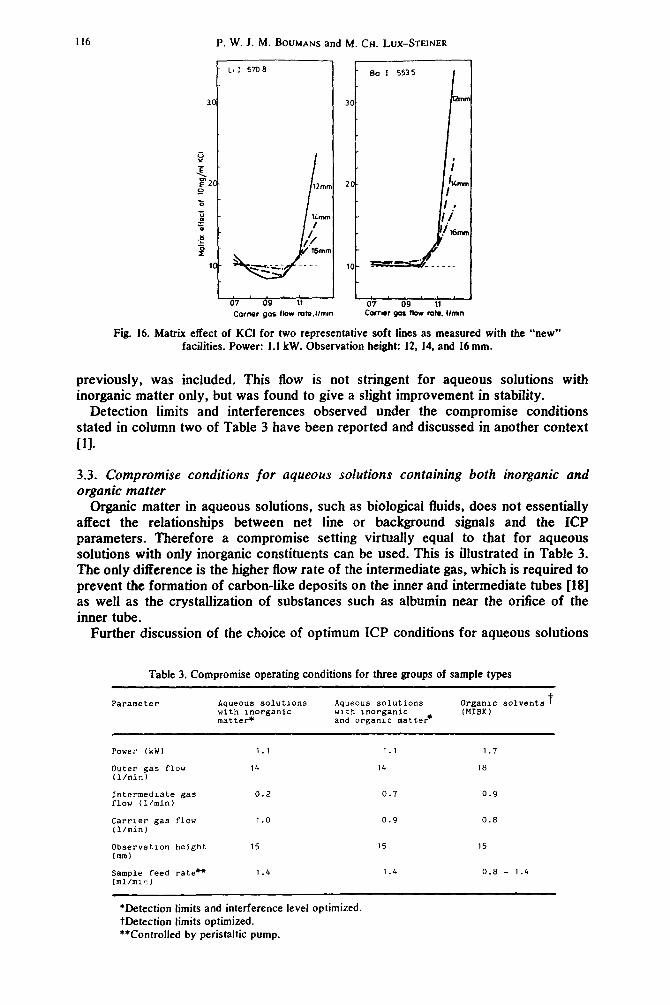
By considering the matrix effect of alkalis (rules 3 and 4 in Section 3.1) we eventually decided on a 1.0 1 min-’ carrier gas flow and a 15 mm observation height for the compromise setting. The reason is clarified by the results in Fii. 16, which links up with Pi. 12 for the “old” facilities. The carrier gas flow at which the “catastrophe*’ occurs (- 1.11 min-‘) has shifted downwards by about 0.4 1 min-’ with respect to the corresponding point obtained with the “old” facilities ( - 1.5 1 min-‘) [Fig. 121. This agrees well with the shit in the carrier gas flow at which the optimum SBR of hard lines is found, as exemplified by the results for Mn II 257.6 mm in Fig. 15.
Table 3 summarizes the compromise values with a view to the comparison with those for other sample types below. A small intermediate gas flow, not discussed
I I I ( I * 4 I 07 09 11
Garner gas fbw mte.Umm
Fii. 15. Signal-to-background ratio as a function of carrier gas flow for Mn II 257.6nm as found with the “new” facilities, Power: I.1 kW. Observation height: 12, 14, and 16 mm. Note
the shift in the range of the carrier gas flow with respect to that for the “old” facilities.
[91) D. J. KALNICKY, V. A. FASSEL and R. N. KNISELEY, Appl. Spectrosc. 31. 137 (1977).
116 P. W. J. M. BOIJMANS and M. CH. LUX-STEINER
LII 6708 Ba I 5535
30- 30-
07 09 11 07 09 I1 corner 90s flow m*.llmm cuT*r gas flow mte. l/mm
Fig. 16. Matrix effect of KC1 for two representative soft lines as measured with the “new” facilities. Power: 1.1 kW. Observation height: 12, 14, and 16 mm.
previously, was included. This flow is not stringent for aqueous solutions with inorganic matter only, but was found to give a slight improvement in stability.
Detection limits and interferences observed under the compromise conditions stated in column two of Table 3 have been reported and discussed in another context
HI.
3.3. Compromise conditions for aqueous solutions containing both inorganic and organic matter
Organic matter in aqueous solutions, such as biological fluids, does not essentially affect the relationships between net line or background signals and the ICP parameters. Therefore a compromise setting virtually equal to that for aqueous solutions with only inorganic constituents can be used. This is illustrated in Table 3. The only difference is the higher flow rate of the intermediate gas, which is required to prevent the formation of carbon-like deposits on the inner and intermediate tubes [18] as well as the crystallization of substances such as albumin near the orifice of the inner tube.
Further discussion of the choice of optimum ICP conditions for aqueous solutions
Table 3. Compromise operating conditions for three groups of sample types
Parameter Aqueous solutrons Aqueous solutions t with inorganic ulth inorganic matter* and organic matter*
Power (kW) 1.1 1.1 1.7
outer flow gas 14 14 18 (l/minJ
Intermedlate gas 0.2 0.7 0.9 flow (l/mini
carrier gas flow 1.0 0.9 0.8 il/min)
Observation height 15 15 15 (mm)
Sample feed rate- 1.4 1.4 0.8 - 1.4 (ml/ml?1
*Detection limits and interference level optimized. tDetection limits optimized. **Controlled by peristaltic pump.

Modification and optimization of a 50 MHZ inductively coupled argon plasma 117
with organic constituents is superfluous, because other factors, such as sample pre-treatment, nebulizer performance, stray light elimination and background cor- rection deserve chief consideration for samples of this type. These points have been adequately discussed [68,92,93].
3.4. Optimization for organic solvents Methyl isobutyl ketone (MIBK), ChH’20, was chosen as test solvent because it is a
good diluent in oil analyses [18] and a widely used solvent in extraction procedures for pre-concentration of trace elements.
We defined “compromise conditions” here as the parameter setting that would yield an adequate balance of the detection limits among the elements. Thus a compromise with respect to the minimization of interferences was not iacluded.
3.4.1. Preliminary measurements. Using Mn II 257.6 and Li I 670.8 nm we established tentatively: (i) in which respects the trends of background and net line signals with the six ICP parameters (power; outer, intermediate, and carrier gas flow rate; observation height; sample feed rate) differed from those for aqueous solutions, and (ii) over which ranges the parameters could be and had to be varied to embrace optimum conditions.
This reconnaissance led to the following conclusions. (a) Power. In agreement with general experience with organic solvents (e.g. [18]), a
power level higher than for aqueous solutions is required, the minimum value for our facilities being 1.4 kW. This left us drange between 1.4 and 1.9 kW to be explored, since the generator dictated an upper limit of 1.9 kW.
The tests further indicated that the trend of the background signal with power differed essentially from that found for aqueous solutions, so that it would be of interest to investigate this point elaborately at the very beginning of the definitive optimization experiments.
(b) Outer gas flow rate. We found that for stable plasma operation a minimum value of 15 1 min-’ was required and that a range between 15 and 20 1 min-‘, in combination with power variation, would be of interest for further exploration.
(c) Intermediate gas flow rate. In our studies of aqueous solutions with organic constituents we had observed that the best SBRs are achieved with the lowest possible intermediate gas flow. However, the more carbonaceous matter is introduced into the ICP, the higher the required flow rate. We found in addition that the higher the power, the higher the required intermediate gas flow.
A minimum of 0.7 1 min-’ was established for a power of 1.4 kW, while 0.9 1 min-’ was found necessary for power levels above 1.6 kW. Since an increase of the intermediate gas flow from 0.7 to 0.9 1 min-’ had only a marginal effect on the SBRs and 0.9 I min-’ provided for ICP operation over the entire power range without suffering from carbon deposits, we fixed the intermediate gas flow in all further experiments at 0.9 1 min-‘.
(d) Carrier gas flow rate. As with aqueous solutions, the carrier gas flow rate again turned out to be a crucial parameter, whose influence on net line signals, background signals and SBRs would have to be examined in detail over a range between 0.7 and 1.1 1 min-‘.
(e) Observation height. The tests indicated that the best approach would be to study the effect of observation height in connection with that of carrier gas flow, and that a range between 14 and 18 mm would be the most interesting to cover.
1921
[931
W. J. HAM. JR., V. A. FASSEL. F. GRABAU IV, R. N. KNISELEY and W. L. SUTHERLAND, Ultratrace Metal Analysis in Science and Environment. Simultaneous Detcmdnation of Trace Elements in Urine by Inductively Coupled Plasma Atomic Emission Spectrometry, chap. 8. p. 91. American Chemical Society, Washington, DC (1979). W. J. HAAS and V. A. FASSEL, Elemental Analysis of Biological Materials, inductively Coupled Plasma Atomic Emission Spectrometry, chap. 9. p. 167. Int. Atomic Energy Agency, Tech. Rept Series No. 197.
118 P. W. J. M. BOWMANS and M. CH. LUX-STEINER
(f) Sample feed rate. Variation of this parameter was of no interest for aqueous solutions, but was considered of potentially crucial interest for organic solvents (cf. section 2.3). With MIBK, however, we found that this rate had only a small effect,
depending on the power level, and this induced us to consider two values of the sample feed rate in the definitive experiments, 0.8 and 1.4 I min-‘.
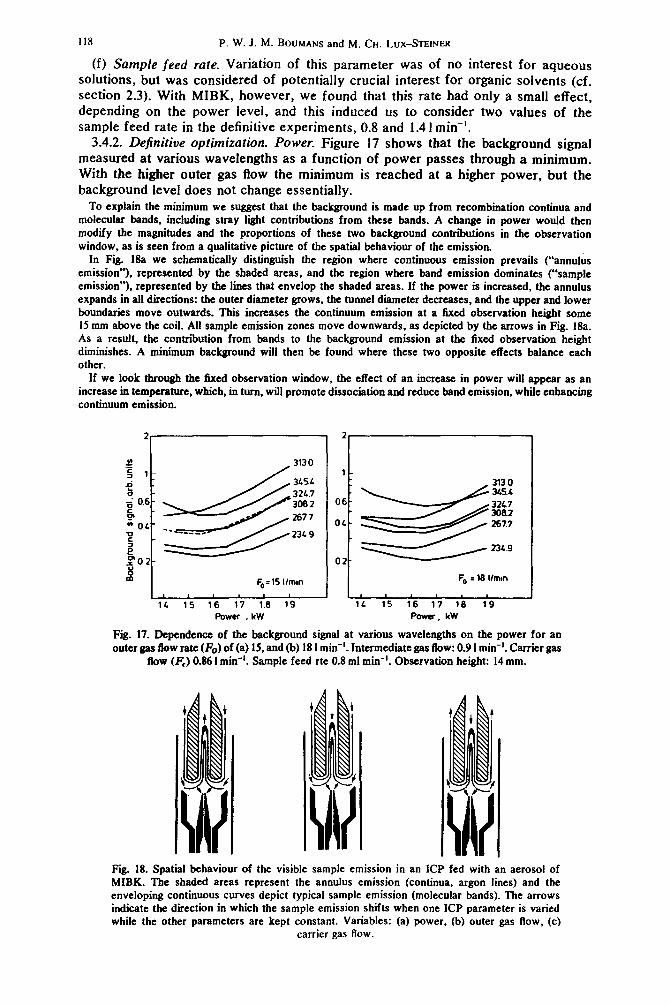
3.4.2. Definitive optimization. Power. Figure 17 shows that the background signal measured at various wavelengths as a function of power passes through a minimum. With the higher outer gas flow the minimum is reached at a higher power, but the background level does not change essentially.
To explain the minimum we suggest that the background is made up from recombination continua and molecular bands, including stray light contributions from these bands. A change in power would then modify the magnitudes and the proportions of these two background contributions in the observation window, as is seen from a qualitative picture of the spatial behaviour of the emission.
In Fig. Ha we schematically distinguish the region where continuous emission prevails (“annul& emission”), represented by the shaded areas, and the region where band emission dominates (“sample emission”), represented by the lines that envelop the shaded areas. If the power is increased, the annulus expands in all directions: the outer diameter grows, the tunnel diameter decreases, and the upper and lower boundaries move outwards. This increases the continuum emission at a fixed observation height some 15 mm above the coil. AU sample emission zones move downwards, as depicted by the arrows in Fig. Ha. As a result, the contribution from bands to the background emission at the fixed observation height diminishes. A minimum background will then be found where these two opposite effects balance each other.
If we look through tire fixed observation window, the effect of an increase in power will appear as an increase in temperature, which, in turn, will promote dissociation and reduce band emission, while enhancing continuum emission.
2 2
3130 l-
! .“: s,g
02- v 23L.g :: m F, = 15 l/mm F, = 10 l/mm
1 I I I 1 1 I , I 1 lb 15 16 17 1.6 19 11 15 16 17 16 19
Power , kW Power, kW
Fig. 17. Dependence of the background signal at various wavelengths on the power for an outer gas flow rate (Fo) of (a) 15. and (b) 18 1 min-‘. Intermediate gas fIow: 0.9 I min-‘. Carrier gas
flow (F,) 0.86 I min-‘. Sample feed rte 0.8 ml min-‘. Observation height: 14 mm.
Fig. 18. Spatial behaviour of the visible sample emission in an ICP fed with an aerosol of MIBK. The shaded areas represent the annulus emission (continua, argon lines) and the enveloping continuous curves depict typical sample emission (molecular bands). The arrows indicate the direction in which the sample emission shifts when one ICP parameter is varied while the other parameters are kept constant. Variables: (a) power, (b) outer gas flow, (c)
carrier gas flow.
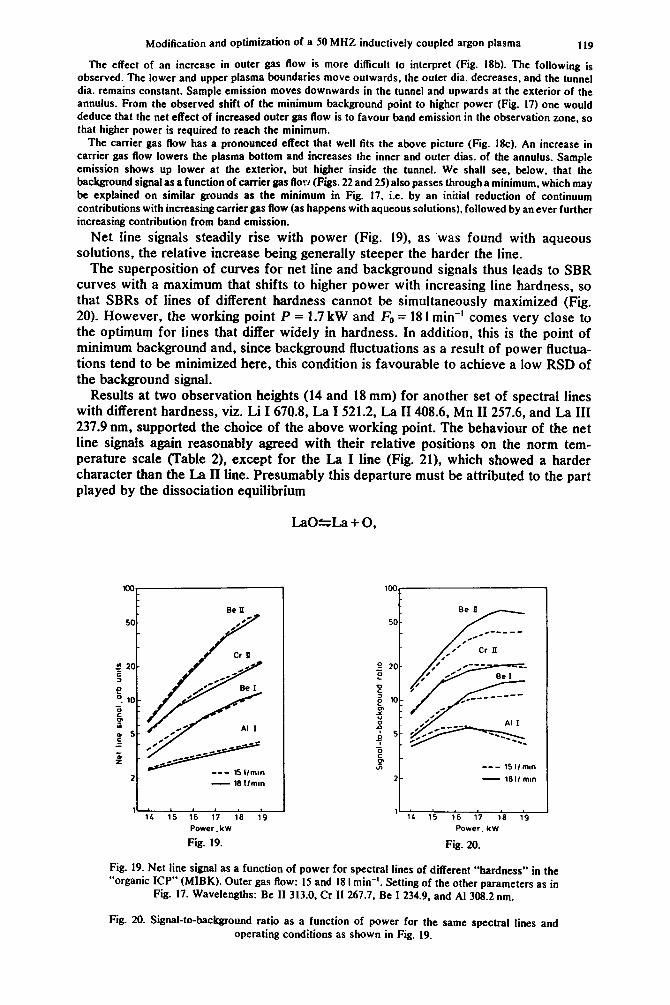
Modification and optimization of a 50 MHZ inductively coupled argon plasma 119
The effect of an increase in outer gas flow is more difficult to interpret (Fig. lgb). The following is observed. The lower and upper plasma boundaries move outwards, the outer dia. decreases, and the tunnel dia. remains constant. Sample emission moves downwards in the tunnel and upwards at the exterior of the annulus. From the observed shift of the minimum background point to higher power (Fig. 17) one would deduce that the net effect of increased outer gas flow is to favour band emission in the observation zone, so that higher power is required to reach the minimum.
The carrier gas flow has a pronounced effect that well fits the above picture (Fig. 18~). An increase in carrier gas flow lowers the plasma bottom and increases the inner and outer dias. of the annulus. Sample emission shows up lower at the exterior, but higher inside the tunnel. We shall see, below, that the background signal as a function of carrier gas flop (Figs. 22 and 25) also passes through a minimum, which may be explained on similar grounds as the minimum in Fig. 17. i.e. by an initial reduction of continuum contributions with increasing carrier gas flow (as happens with aqueous solutions), followed by an ever further increasing contribution from band emission.
Net line signals steadily rise with power (Fig. 19), as -was found with aqueous solutions, the relative increase being generally steeper the harder the line.
The superposition of curves for net line and background signals thus leads to SBR curves with a maximum that shifts to higher power with increasing line hardness, so that SBRs of lines of different hardness cannot be simultaneously maximized (Fig. 20). However, the working point P = 1.7 kW and F0 = 18 I min-’ comes very close to the optimum for lines that differ widely in hardness. In addition, this is the point of minimum background and, since background fluctuations as a result of power fluctua- tions tend to be minimized here, this condition is favourable to achieve a low RSD of the background signal.
Results at two observation heights (14 and 18 mm) for another set of spectral lines with different hardness, viz. Li I 670.8, La I 521.2, La II 408.6, Mn II 257.6, and La III 237.9 nm, supported the choice of the above working point. The behaviour of the net line signals again reasonably agreed with their relative positions on the norm tem- perature scale (Table 2), except for the La I line (Fig. 21), which showed a harder character than the La II line. Presumably this departure must be attributed to the part played by the dissociation equilibrium
l1L Power, kW
Fig. 19.
Lao*La + 0,
1L' ’ ’ ’ ’ - 14 15 16 17 16 19
--- 15 I/ mm
Power. kW
Fig. 20.
Fig. 19. Net line signal as a function of power for spectral lines of different “hardness” in the “organic ICP” (MIBK). Outer gas flow: I5 and 18 I min-‘. Setting of the other parameters as in
Fig. 17. Wavelengths: Be II 313.0. Cr 11 267.7, Be I 234.9, and Al 308.2 nm.
Fig. 20. Signal-to-background ratio as a function of power for the same spectral lines and operating conditions as shown in Fig. 19.
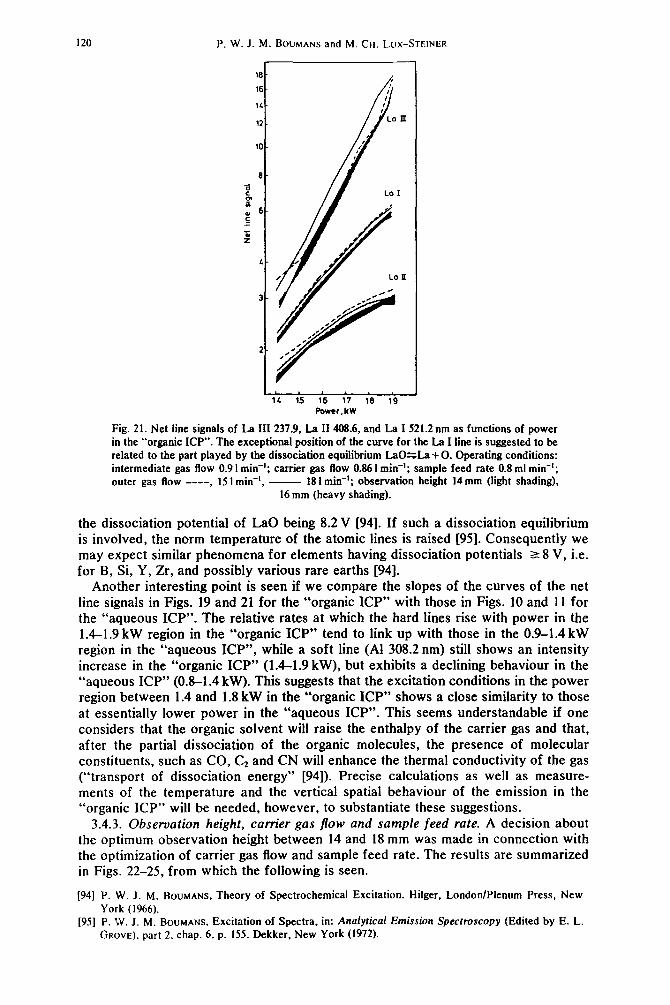
120 P. W. J. M. BOUMANS and M. CH. LUX-STEINER
18
16.
1.t.
12 -
J n 8 - 8 * IL 15 16 17 16 19
Power, kW
Fig. 21. Net line signals of La III 237.9, La II 408.6, and La I 521.2 nm as functions of power in the “organic ICP”. The exceptional position of the curve for the La I line is suggested to be related to the part played by the dissociation equilibrium LaO%La + 0. Operating conditions: intermediate gas flow 0.9 1 mitt-‘; carrier gas flow 0.86 I min-‘; sample feed rate 0.8 ml min-‘; outer gas flow ----, 15 I min-‘, - 18 1 min-‘; observation height 14 mm (light shading),
16 mm (heavy shading).
the dissociation potential of La0 being 8.2 V [94]. If such a dissociation equilibrium is involved, the norm temperature of the atomic lines is raised [95]. Consequently we may expect similar phenomena for elements having dissociation potentials > 8 V, i.e. for B, Si, Y, Zr, and possibly various rare earths [94].
Another interesting point is seen if we compare the slopes of the curves of the net line signals in Figs. 19 and 21 for the “organic ICP” with those in Figs. 10 and 11 for the “aqueous ICP”. The relative rates at which the hard lines rise with power in the 1.4-1.9 kW region in the “organic ICP” tend to link up with those in the 0.9-1.4 kW region in the “aqueous ICP”, while a soft line (Al 308.2 nm) still shows an intensity increase in the “organic ICP” (1.4-1.9 kW), but exhibits a declining behaviour in the “aqueous ICP” (0.8-1.4 kW). This suggests that the excitation conditions in the power region between 1.4 and 1.8 kW in the “organic ICP” shows a close similarity to those at essentially lower power in the “aqueous ICP”. This seems understandable if one considers that the organic solvent will raise the enthalpy of the carrier gas and that, after the partial dissociation of the organic molecules, the presence of molecular constituents, such as CO, Cz and CN will enhance the thermal conductivity of the gas (“transport of dissociation energy” [94]). Precise calculations as well as measure- ments of the temperature and the vertical spatial behaviour of the emission in the “organic ICP” will be needed, however, to substantiate these suggestions.
3.4.3. Observation height, carrier gas flow and sample feed rate. A decision about the optimum observation height between 14 and 18 mm was made in connection with the optimization of carrier gas flow and sample feed rate. The results are summarized in Figs. 22-25, from which the following is seen.
1941 P. W. J. M. BOUMANS, Theory of Spectrochemical Excitation. Hilger, London/Plenum Press, New York (1966).
[95] P. W. J. M. BOUMANS, Excitation of Spectra, in: Analytical Emission Spectroscopy (Edited by E. L. GROVE). part 2. chap. 6. p. 155. Dekker, New York (1972).

Modification and optimization of a 50 MHZ inductively coupled argon plasma 121
LI I 670 8
1 I
7 08 0.9 10
Carrier gas flow rate. l/mm
*‘-.----.--- ,I *___---
: *.._
’ I* ,’ .-
,’ a’ c ’ I’ ‘s I’ .
I” Fig. 22. Net line signal, background signal, and signal-to-background ratio as a function of carrier gas flow for Li I 670.8nm in the “organic ICP”. Power: 1.7 kW. Outer gas flow: 18 I mitt-‘. Intermediate gas flow: 0.9 I min-I. Observation heiit: 14. 16 and 18 mm. Sample feed rate: - 0.8 ml min-‘. ---- 1.4 ml min- ‘. The length of the arrows corresponds to a
factor of two on the ordinate scales.
(i) The net line signals behave in agreement with the varying hardness of the lines.
(ii) The background signal has a minimum in the vicinity of F’ = 0.8 1 min-’ under all conditions, which may be understood in the light of the discussion above.
(iii) If the carrier gas flow associated with the minimum background is chosen as “optimum”, the SBRs are not essentially different from the maximum values attain- able.
(iv) The best SBRs are achieved at the lowest observation height considered (14 mm), but the differences between the 14 and 16 mm heights are marginal. We choose 15 mm to have the same value for all sample types (Table 3).
(v) The sample feed rate has an insignilicant effect when MIBK is used, but will be more important for other organic solvents (cf. Section 2.3).
9 AI I 3062
31 07 0.5 09 10
Corner 90s Ilow rote fIm”
0;
01
Of
z k SO -z a b :: 2 0
0
t I I
I
/ ,
I7 08 09 10
Corner gas ‘bvl rote. I lrn0-l
I
07 0.9 09 10
Comer p0s HOW rate, llm,”
Fig. 23. Results for Al I 308.2 nm corresponding to those for Li I 670.8 nm in Fig. 22.

122 P. W. J. M. BOUMANS and M. CH. LUX-STEINER
Fig. 24. Results for Be I 234.9 nm corresponding to those for Li I 670.8 run in Fii. 22.
3.4.4. Compromise parameter setting. Considering the above results we adopted for parameter setting shown in the last column of Table 3 as compromise conditions for analysing solutions of metals in MIBK.
3.5. Background equivalent concentrations and defection limits in MIBK To check the adequacy of the chosen compromise conditions we determined the
background equivalent concentrations (BEC) for some 40 spectral lines of 21 representative elements. The results are listed in Table 4 along with the BEC values derived from the results of WINGE et al. [2] for pure aqueous solutions obtained with a spectral resolution approximately similar to that used in this work (0.02 nm). The
B Mnll 2576
07 08 09 10
Carrier gas flow rate. llmln
Fig. 25. Results for Mn 11 257.6 nm corresponding to those for Li I 670.8 nm in Fig. 22.

Modification and optimization of a 50 MHZ inductively coupled argon plasma 123
Table 4. Background equivalent concentrations and detection limits attained in this work for MIBK solvent and background equivalent concentrations reported for pure water by WINCE d 01.
[21 .
Spectral line (nm) Background equivalent Detection concentration (ng/ml) limit (ng/ml)
MIBK water MIBK
This work Ref. r2-J This work
Al Al Al
B B
Ba
Be Be Be
Ca
Cd Cd Cd
co co
cu cu cu
Fe Fe
Mg Mg
Mn Mn
MO MO
Ni Ni Ni
P
Pb Pb
Sb Sb
Si
Sn Sn
V
Zn Zn
I 328.0 68
I 237.3 24 I 226.9 16 I 308.2 15
I 249.7 73 I 208.9 59
II 233.5 27
II 313.0 42 I 234.8 61 I 249.4 73
II 315.8 87
II 214.4 38 I 228.8 02 II 226.5 02
II 238.8 92 II 228.6 16
I 324.7 54 II 224.7 00 I 223.0 08
II 238.2 04 II 259.9 40
II 279.5 53 II 280.2 70
II 257.6 10 II 259.3 73
II 202.0 30 II 281.6 15
II 221.6 47 I 232.0 03 II 231.6 04
I 214.9 14
II 220.3 53 I 216.9 99
I 206.8 33 I 217.5 81
I 251.6 11
I 235.4 84 I 242.9 49
II 268.7 96
I 213.8 56 120 60 4 II 202.5 48 640 130 20
80 260
1100 1000 2000 1100 600 1500
2
6': 20
180 160 850 330
5 30
90 130
9 10
120
3
z 550
0.15 0.25
20
1100
210 80 140 90 170 110
230 200 300 230
30
6
:
8
6:: 680
180 260 430
20 20
140 100
f
150 210
5 10
4 3
0.06 0.15
10 45 18 50
1000 260 30 280 480 8
460 340 1100 500 630 530
2600 2600
2300 1400 2900 3000
2600 1100 1500 1500
350 400
2000 3200 2000 3200
200 350
:z 20
80
%i
80 50
50
z
6
SAB Vol 37. No. 2-C
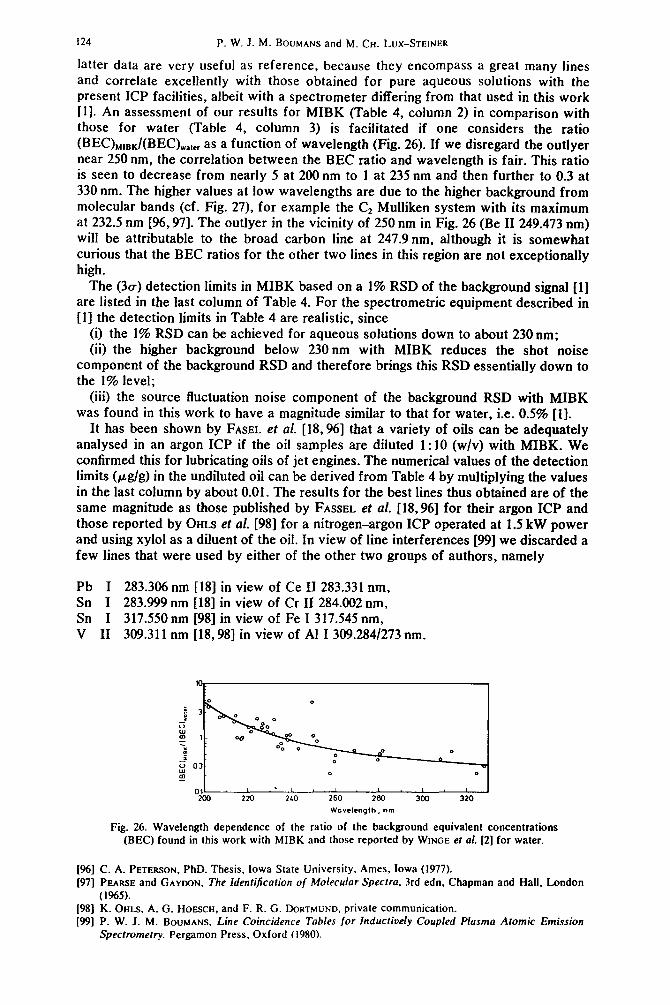
124 P. W. J. M. BOUMANS and M. CH. LUX-STEINER
latter data are very useful as reference, because they encompass a great many lines and correlate excellently with those obtained for pure aqueous solutions with the present ICP facilities, albeit with a spectrometer differing from that used in this work [I]. An assessment of our results for MIBK (Table 4, column 2) in comparison with those for water (Table 4, column 3) is facilitated if one considers the ratio
(BEC)MIBKI(BECL,~~ as a function of wavelength (Fig. 26). If we disregard the outlyer near 250 nm, the correlation between the BEC ratio and wavelength is fair. This ratio is seen to decrease from nearly 5 at 200 nm to 1 at 235 nm and then further to 0.3 at 330 nm. The higher values at low wavelengths are due to the higher background from molecular bands (cf. Fig. 27), for example the Cz Mulliken system with its maximum at 232.5 nm [96,97]. The outlyer in the vicinity of 250 nm in Fig. 26 (Be II 249.473 nm) will be attributable to the broad carbon line at 247.9nm, although it is somewhat curious that the BEC ratios for the other two lines in this region are not exceptionally high.
The (3~) detection limits in MIBK based on a 1% RSD of the background signal [l] are listed in the last column of Table 4. For the spectrometric equipment described in [I] the detection limits in Table 4 are realistic, since
(i) the 1% RSD can be achieved for aqueous solutions down to about 230 nm; (ii) the higher background below 230 nm with MIBK reduces the shot noise
component of the background RSD and therefore brings this RSD essentially down to the 1% level;
(iii) the source fluctuation noise component of the background RSD with MIBK was found in this work to have a magnitude similar to that for water, i.e. 0.5% [l].
It has been shown by FASEL et al. [18,96] that a variety of oils can be adequately analysed in an argon ICP if the oil samples are diluted 1: 10 (w/v) with MIBK. We confirmed this for lubricating oils of jet engines. The numerical values of the detection limits &g/g) in the undiluted oil can be derived from Table 4 by multiplying the values in the last column by about 0.01. The results for the best lines thus obtained are of the same magnitude as those published by FASSEL et al. [18,96] for their argon ICP and those reported by OHLS et al. [98] for a nitrogen-argon ICP operated at 1.5 kW power and using xylol as a diluent of the oil. In view of line interferences [99] we discarded a few lines that were used by either of the other two groups of authors, namely
Pb I 283.306nm [18] in view of Ce II 283.331 nm, Sn I 283.999 nm [18] in view of Cr II 284.002 nm, Sn I 3 17.550 nm [98] in view of Fe I 317.545 nm, V II 309.311 nm [18,98] in view of Al I 309.284/273 nm.
260 280 Wovelength. nm
300 320
Fig. 26. Wavelength dependence of the ratio of the background equivalent concentrations (BEC) found in this work with MIBK and those reported by WINCE et ol. [2] for water.
I%1 I971
C. A. PETERSON, PhD. Thesis, Iowa State University, Ames, Iowa (1977). PEARSE and GAYDON. The Identification u/ Molecular Specfra, 3rd edn, Chapman and Hall, London (1965).
1981 [*I
K. OHLS, A. G. HOE.SCH, and F. R. G. DORTMUND, private communication. P. W. J. M. BOUMANS, Line Coincidence Tables for Inductively Coupled Plosmo Atomic Emission
Specfrometry. Pergamon Press, Oxford (1980).
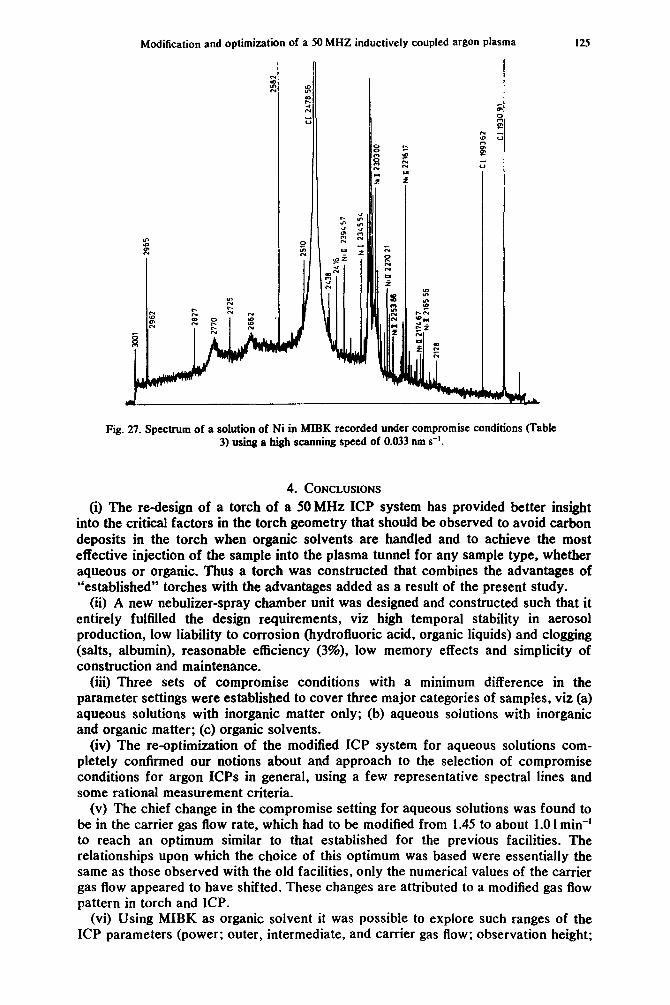
Modification and optimization of a 50 MHZ inductively coupled argon plasma 125
Fig. 27. Spectrum of a solution of Ni in MIBK recorded under compromise conditions (Table 3) using a high scanning speed of 0.033 nm s-‘.
4. CONCLUSIONS
(i) The redesign of a torch of a 50 MHz ICP system has provided better insight into the critical factors in the torch geometry that should be observed to avoid carbon deposits in the torch when organic solvents are handled and to achieve the most effective injection of the sample into the plasma tunnel for any sample type, whether aqueous or organic. Thus a torch was constructed that combines the advantages of “established” torches with the advantages added as a result of the present study.
(ii) A new nebulizer-spray chamber unit was designed and constructed such that it entirely fulfilled the design requirements, viz high temporal stability in aerosol production, low liability to corrosion (hydrofluoric acid, organic liquids) and clogging (salts, albumin), reasonable efficiency (30/o), low memory effects and simplicity of construction and maintenance.
(iii) Three sets of compromise conditions with a minimum difference in the parameter settings were established to cover three major categories of samples, viz (a) aqueous solutions with inorganic matter only; (b) aqueous solutions with inorganic and organic matter; (c) organic solvents.
(iv) The re-optimization of the modified ICP system for aqueous solutions com- pletely confirmed our notions about and approach to the selection of compromise conditions for argon ICPs in general, using a few representative spectral lines and some rational measurement criteria.
(v) The chief change in the compromise setting for aqueous solutions was found to be in the carrier gas flow rate, which had to be modified from 1.45 to about 1.0 1 min-’ to reach an optimum similar to that established for the previous facilities. The relationships upon which the choice of this optimum was based were essentially the same as those observed with the old facilities, only the numerical values of the carrier gas flow appeared to have shifted. These changes are attributed to a modified gas flow pattern in torch and ICP.
(vi) Using MIBK as organic solvent it was possible to explore such ranges of the ICP parameters (power; outer, intermediate, and carrier gas flow: observation height;

I26 P. W. J. M. B~UMANS and M. CH. LUX-STEINER
liquid feed rate) that an optimum defined by approximately maximum signal-to- background ratios for the majority of the prominent lines of the elements was embraced. Therefore we were able to measure in a rational way a series of empirical relationships from which arguments in favour of the eventually recommended com- promise conditions for analysis of organics were derived. In this study, both the similarities and differences in the emission behaviour between “aqueous” and “organic” ICPs were clearly revealed and this led to better insight into the ways in which changes of the ICP affect the background and net line signals in general.
(vii) The excellent analytical capabilities of the modified facilities, which were demonstrated for aqueous solutions in a previous paper [ 11, have been documented in this work for an organic solvent (MIBK).
(viii) It should be investigated whether the compromise conditions established for MIBK apply to other organic solvents as well. If so, it is likely that the liquid flow to the nebulizer, which turned out to be of secondary importance with MIBK, will be a critical parameter [793. The device for controlled liquid feed, designed and used in the presence work, but described in detail elsewhere [3,803, will make it possible to maintain a constant aerosol flow to the ICP (e.g. equal to that for MIBK) irrespective of the evaporation behaviour of the aerosol in the spray chamber. It might be expected then that, apart from differences in the liquid flow depending on the solvent, essentially the same compromise conditions will hold for other organic liquids.
(ix) It was confirmed in this work that organic samples can be analysed with a low-power argon ICP as conveniently [IS] as with a high-power nitrogen-argon ICP [lOO]; the torch configuration, however, may be more critical in the low-power argon ICP, unless 5-15% oxygen is added to the coolant gas [loll. This was not considered in this work, but will certainly deserve further attention in the scope of future work with the system described here.
Ac~~w~edge~~rs-~e authors are indebted to Mr 0. ELZENMR and Mr J. VAN W~OV~ of the mechanical and gIass workshops of this laboratory for their invafuable technical help with the design and construction of the torch and nebuIizer.
The care and patience exercised in the preparation of reliable solutions by Mr F. J. DE BOER and Mr B. E. M. M. VAN DEN BROW of the wet chemical department and Mrs M. BOSVELD of the spectrochemical department are gratefully acknowledged.
[IOO] S. GREENFIELD, H. McD. MCGEACHIN and P. B. SMITH. ICP Informarion Newsleft. 2. 167 (1976). [lOI j CL HORLICK, private communication.