Modellus: Automated Modeling of Complex Internet Data...
29
8 Modellus: Automated Modeling of Complex Internet Data Center Applications PETER DESNOYERS, Northeastern University TIMOTHY WOOD, PRASHANT SHENOY, and RAHUL SINGH, University of Massachusetts Amherst SANGAMESHWAR PATIL and HARRICK VIN, Tata Research Development and Design Centre The rising complexity of distributed server applications in Internet data centers has made the tasks of modeling and analyzing their behavior increasingly difficult. This article presents Modellus, a novel system for automated modeling of complex web-based data center applications using methods from queuing theory, data mining, and machine learning. Modellus uses queuing theory and statistical methods to automatically derive models to predict the resource usage of an application and the workload it triggers; these models can be composed to capture multiple dependencies between interacting applications. Model accuracy is maintained by fast, distributed testing, automated relearning of models when they change, and methods to bound prediction errors in composite models. We have implemented a prototype of Modellus, deployed it on a data center testbed, and evaluated its efficacy for modeling and analysis of several distributed multitier web applications. Our results show that this feature-based modeling technique is able to make predictions across several data center tiers, and maintain predictive accuracy (typically 95% or better) in the face of significant shifts in workload composition; we also demonstrate practical applications of the Modellus system to prediction and provisioning of real-world data center applications. Categories and Subject Descriptors: C.4 [Computer Systems Organization]: Performance of Systems— Modeling techniques; C.2.4 [Computer-Communication Networks]: Distributed Systems General Terms: Design, Performance Additional Key Words and Phrases: Workload and performance modeling, internet applications ACM Reference Format: Desnoyers, P., Wood, T., Shenoy, P., Singh, R., Patil, S., and Vin, H. 2012. Modellus: Automated modeling of complex internet data center applications. ACM Trans. Web 6, 2, Article 8 (May 2012), 29 pages. DOI = 10.1145/2180861.2180865 http://doi.acm.org/10.1145/2180861.2180865 1. INTRODUCTION Distributed server applications have become commonplace in today’s Internet and business environments. The data centers hosting these applications—large clusters of networked servers and storage—have in turn become increasingly complex. Some of this is due to complexity of the applications themselves, which may have multiple tiers and share resources across applications. Another factor contributing to data center complexity, however, is evolution and change as hardware and software components are added or replaced, often resulting in unknown or unforeseen system interactions. This work is supported by the National Science Foundation, under grants CNS-0720616, CNS-0916972, and OCI-1032765. T. Wood is currently affiliated with the George Washington University. Author’s e-mail address: Timothy Wood, [email protected]. Permission to make digital or hard copies of part or all of this work for personal or classroom use is granted without fee provided that copies are not made or distributed for profit or commercial advantage and that copies show this notice on the first page or initial screen of a display along with the full citation. Copyrights for components of this work owned by others than ACM must be honored. Abstracting with credit is permitted. To copy otherwise, to republish, to post on servers, to redistribute to lists, or to use any component of this work in other works requires prior specific permission and/or a fee. Permissions may be requested from Publications Dept., ACM, Inc., 2 Penn Plaza, Suite 701, New York, NY 10121-0701 USA, fax +1 (212) 869-0481, or [email protected]. c 2012 ACM 1559-1131/2012/05-ART8 $10.00 DOI 10.1145/2180861.2180865 http://doi.acm.org/10.1145/2180861.2180865 ACM Transactions on the Web, Vol. 6, No. 2, Article 8, Publication date: May 2012.
Transcript of Modellus: Automated Modeling of Complex Internet Data...

8
Modellus: Automated Modeling of Complex Internet DataCenter Applications
PETER DESNOYERS, Northeastern UniversityTIMOTHY WOOD, PRASHANT SHENOY, and RAHUL SINGH,University of Massachusetts AmherstSANGAMESHWAR PATIL and HARRICK VIN, Tata Research Development and Design Centre
The rising complexity of distributed server applications in Internet data centers has made the tasks ofmodeling and analyzing their behavior increasingly difficult. This article presents Modellus, a novel systemfor automated modeling of complex web-based data center applications using methods from queuing theory,data mining, and machine learning. Modellus uses queuing theory and statistical methods to automaticallyderive models to predict the resource usage of an application and the workload it triggers; these models canbe composed to capture multiple dependencies between interacting applications.
Model accuracy is maintained by fast, distributed testing, automated relearning of models when theychange, and methods to bound prediction errors in composite models. We have implemented a prototype ofModellus, deployed it on a data center testbed, and evaluated its efficacy for modeling and analysis of severaldistributed multitier web applications. Our results show that this feature-based modeling technique is ableto make predictions across several data center tiers, and maintain predictive accuracy (typically 95% orbetter) in the face of significant shifts in workload composition; we also demonstrate practical applicationsof the Modellus system to prediction and provisioning of real-world data center applications.
Categories and Subject Descriptors: C.4 [Computer Systems Organization]: Performance of Systems—Modeling techniques; C.2.4 [Computer-Communication Networks]: Distributed Systems
General Terms: Design, Performance
Additional Key Words and Phrases: Workload and performance modeling, internet applications
ACM Reference Format:Desnoyers, P., Wood, T., Shenoy, P., Singh, R., Patil, S., and Vin, H. 2012. Modellus: Automated modeling ofcomplex internet data center applications. ACM Trans. Web 6, 2, Article 8 (May 2012), 29 pages.DOI = 10.1145/2180861.2180865 http://doi.acm.org/10.1145/2180861.2180865
1. INTRODUCTION
Distributed server applications have become commonplace in today’s Internet andbusiness environments. The data centers hosting these applications—large clusters ofnetworked servers and storage—have in turn become increasingly complex. Some ofthis is due to complexity of the applications themselves, which may have multiple tiersand share resources across applications. Another factor contributing to data centercomplexity, however, is evolution and change as hardware and software componentsare added or replaced, often resulting in unknown or unforeseen system interactions.
This work is supported by the National Science Foundation, under grants CNS-0720616, CNS-0916972, andOCI-1032765.T. Wood is currently affiliated with the George Washington University.Author’s e-mail address: Timothy Wood, [email protected] to make digital or hard copies of part or all of this work for personal or classroom use is grantedwithout fee provided that copies are not made or distributed for profit or commercial advantage and thatcopies show this notice on the first page or initial screen of a display along with the full citation. Copyrights forcomponents of this work owned by others than ACM must be honored. Abstracting with credit is permitted.To copy otherwise, to republish, to post on servers, to redistribute to lists, or to use any component of thiswork in other works requires prior specific permission and/or a fee. Permissions may be requested fromPublications Dept., ACM, Inc., 2 Penn Plaza, Suite 701, New York, NY 10121-0701 USA, fax +1 (212)869-0481, or [email protected]© 2012 ACM 1559-1131/2012/05-ART8 $10.00
DOI 10.1145/2180861.2180865 http://doi.acm.org/10.1145/2180861.2180865
ACM Transactions on the Web, Vol. 6, No. 2, Article 8, Publication date: May 2012.
8:2 P. Desnoyers et al.
Such systems, which must be managed to meet service-level agreements (SLAs) andto minimize operating and capital costs, have become too complex to be comprehendedby a single human. This article proposes a new approach for conquering this complex-ity, using queuing theory combined with statistical methods from data mining andmachine learning. Collectively, these methods create predictive models that captureinteractions within a system, allowing the user to relate input (i.e., user) behavior tointeractions and resource usage. Data from existing sources (log files, resource uti-lization) is collected and used to train a model derived from queuing theory, so thatapplication models can be created “on the fly” from a running system. From this train-ing data we then infer queuing network models that relate events or input at differenttiers of a data center application to resource usage at that tier, and to correspondingrequests sent to tiers further within the data center. By composing these models, weare able to examine relationships across multiple tiers of an application, and to iso-late these relationships from the effects of other applications that may share the samecomponents.
The models produced by our system can then be used by system administratorsto better understand the behavior and resource requirements of their applications.System administrators can use these models to perform “as-is state analysis” to studythe health of and dependencies between running applications, or to perform “headroomanalysis” to determine the current resource usage and the remaining capacity in thedata center to handle workload growth or new applications. Such models can also beused for “what-if analysis” studies that ask questions about how resource needs maychange depending on anticipated variations in application workloads. Currently, suchanalysis is done using rules of thumb or manually developed models. The complexityand scale of these manual approaches becomes a challenge as the size of applicationsand data centers continues to grow, pointing to the need for automated methods.
The nature of modern web-based applications makes this analysis and modeling par-ticularly difficult. These applications are typically composed of multiple components, somodels must account for the relationships between them. Further, the input workloadsseen by each component are comprised of many different request types and each typemay place a very different load on the server. To create models of inputs and responses,we must classify them; yet request classes are typically unique to each applicationcomponent, and system administrators are unlikely to have the application-specificknowledge required to differentiate them. Even with expert knowledge, classifying in-puts by hand will not scale in practice due to the huge number of unique componentsin a data center and their rate of change. Instead, if we are to use modeling as a tool indata center management, we must automatically learn not only system responses butinput classifications themselves.
The benefits of an automated modeling method are several. It relieves humans fromthe tedious task of tracking and modeling complex application dependencies in largesystems. The models created may be used for higher-level tasks such as analyzing datacenter capacity (“headroom analysis”) or predicting the impact of workload variations(“what-if analysis”). Finally, automated modeling can keep these models up-to-date asthe system changes via periodic testing and repetition of the learning process.
We have designed and implemented Modellus,1 a system that implements our auto-mated modeling approach. Modellus combines classical results from queuing networktheory [Denning and Buzen 1978; Jackson 1957; Lazowska et al. 1984] with noveltechniques that “mine” the incoming web workload for features that best predict theobserved resource usage or workload at a downstream component. Specifically, modelinference in Modellus is based on stepwise regression—a technique used in statistical
1Latin. Root of “model”.
ACM Transactions on the Web, Vol. 6, No. 2, Article 8, Publication date: May 2012.

Modellus: Automated Modeling of Complex Internet Data Center Applications 8:3
data mining—for determining features that best correlate with empirical observationstaken from monitoring of application request logs and OS-level resource usage mea-surements. These features are used to parameterize network queuing models, whichcan then be composed to capture dependencies between interacting applications. Mod-ellus also implements automated model testing to verify that derived models remainvalid, and triggers relearning of a new model upon model failure.
We implement a host of optimizations to ensure that our queuing and statisticalmethods are practical in large distributed systems. A fast, distributed model testingalgorithm performs frequent coarse-grain testing at local nodes, triggering full modeltesting only when these tests fail. This improves scalability while reducing the latencyof detecting model failures. Techniques for estimating prediction errors are used toprevent excessive errors due to the composition of a large number of models. Finally,Modellus implements back-off heuristics to avoid scenarios where transient phasechanges in the workload or inherently “noisy” workloads cause frequent model failures,triggering wasteful relearning.
We have implemented a prototype of Modellus, consisting of both a nucleus runningat the monitored systems and a control plane for model generation and testing. Weconducted detailed experiments on a prototype data center running a mix of realisticweb-based applications. Our results show that in many cases we predict server utiliza-tion within 5% or less, based on measurements of the input to either that server orupstream servers. In addition, we demonstrated the utility of our modeling techniquesin predicting responses to future traffic loads and patterns for use in capacity planning.
Overall, our contributions lie in the design of a system that combines queuing net-work theory with statistical methods to automate the task of modeling distributedapplication behavior, while being scalable and practical for deployment in large datacenters. Specific contributions include the following:
(1) automated data mining techniques that classify application requests into differenttypes;
(2) use of queuing network results in conjunction with statistical techniques to relateincoming requests to resource utilization or workloads at downstream components;
(3) model composition rules that allow workloads at one application component to berelated to behavior at another;
(4) an automated model testing and revalidation component that ensures models arekept up to date in an efficient manner;
(5) a thorough evaluation of the prediction accuracy of Modellus, as well as practicaluse cases that describe how it can be used to answer questions in a real data center.
The remainder of this article is structured as follows. We present background andformulate the modeling problem in Section 2, and describe our automated modelingapproach in Sections 3 to 5. Section 6 presents the Modellus implementation, whileSections 7 and 8 present our experimental results. Finally, we survey related work inSection 9, and conclude in Section 10.
2. BACKGROUND AND PROBLEM FORMULATION
Consider an Internet data center consisting of a large collection of computers, run-ning a variety of applications and accessed remotely by clients via the Internet. Thedata center will have resources for computation (i.e., the servers themselves), stor-age, local communication (typically a high-speed LAN), and remote communicationwith end-users. We define an application as a collection of components that are dis-tributed across multiple servers. Each component typically resides on a separate serverand implements a portion of the application functionality. The various components
ACM Transactions on the Web, Vol. 6, No. 2, Article 8, Publication date: May 2012.

8:4 P. Desnoyers et al.
collectively implement the functionality of the distributed application and are assumedto be structured as a directed acyclic graph from a request processing standpoint.
As an example, a web-based student course registration application might be com-posed of three separate components: a frontend J2EE server, a legacy client-serverprocessing tier, and an enterprise database. Some of these components may be sharedbetween applications; for instance, our example backend database is likely to be sharedwith other applications (e.g., tuition billing) that need access to course registrationdata. In addition, in many cases, physical resources may be shared between differentcomponents and applications, either by direct colocation or through the use of virtualmachines.
For our analysis, we can characterize these applications at various tiers in the datacenter by their requests and the responses to them. In addition, we are interestedin both the computational and I/O load incurred by a component when it handles arequest, as well as any additional requests it may make to other tier components inprocessing the request (e.g., database queries issued while responding to a request fora dynamic web page). We note that a single component may receive intercomponentrequests from multiple sources, and may generate requests to several componentsin turn. Thus, the example database server receives queries from components thatare part of multiple applications. Likewise, a single application component may makerequests to multiple databases or other components.
In this work we seek to model the overall operation of applications based on data gath-ered at each of their components. Thus, we require data on the operations performed ateach component as well as their impact. We obtain request or event information fromapplication logs, which typically provide event timestamps, client identity, and infor-mation identifying the specific request. Resource usage measurements are gatheredfrom the server OS, and primarily consist of CPU usage and disk operations over someuniform sampling interval.
Problem Formulation. The automated modeling problem may be formulated as fol-lows. In a system as described above, given the request and resource informationprovided, we wish to automatically derive the following information.
(1) Request classifications that allow input request streams to be classified by type.These request classes must be generated automatically by the system due to the largenumber of applications in a modern data center. The classification is then combinedwith workload information for the following models.
(2) A workload-to-utilization model that uses queuing theory to model the resourceusage of an application component as a function of its incoming workload. For instance,the CPU utilization and disk I/O operations due to an application μcpu, μiop can becaptured as a function of its workload λ:
μcpu = fcpu(λ), μiop = fiop(λ).
(3) A workload-to-workload model that uses queuing networks to model the outgoingworkload of an application component as a function of its incoming workload. Since theoutgoing workload of an application component becomes the incoming workload of oneor more downstream components, our model derives the workload at one componentas a function of another:
λ j = g(λi).
We also seek techniques to compose these basic models to represent complex systemsystems. Such model composition should capture transitive behavior, where pairwisemodels between components i and j and j and k are composed to model the relationshipbetween i and k. Further, model composition should allow pairwise dependence to be
ACM Transactions on the Web, Vol. 6, No. 2, Article 8, Publication date: May 2012.

Modellus: Automated Modeling of Complex Internet Data Center Applications 8:5
extended to n-way dependence, where a component’s workload is derived as a functionof the workloads seen by all its n upstream components.
3. DATA CENTER MODELING: BASICS
In this section, we present the intuition behind our basic models, followed by a discus-sion on constructing composite models of complex data center applications. Our basicmodels are based on results from queuing theory and queuing network theory. How-ever, since each application is somewhat different, in a real system, the parameters ofthese models, as well as system artifacts such as configuration parameters and caching,govern how the application behaves in response to a particular request workload. Con-sequently the challenge lies in automating the tasks of derving the paramaters ofour queuing and queuing network models to capture the behavior of the distributedapplication.
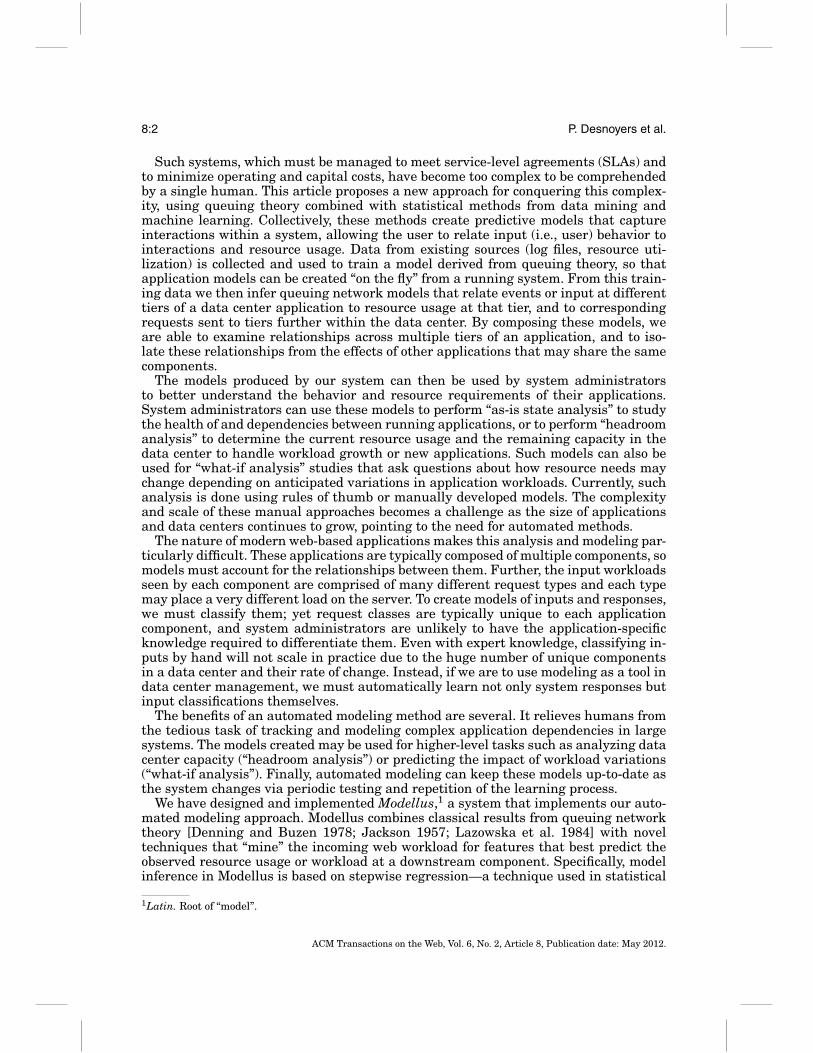
3.1. Workload-to-Utilization Model
Consider an application comprising of multiple components. We model each componentas a M/G/1/PS queue, that is, the service times are assumed to have an arbitrarydistribution; the service discipline is asssumed to be processor sharing, and the requestinterarrivals are assumed to have a Poisson distribution. Let us suppose that the inputstream consists of k distinct classes of requests, where requests in each class havesimilar service times. For example, a web server might receive requests for small staticfiles and computationally-intensive scripts.
We model the entire application as an open network of queues [Jackson 1957; Den-ning and Buzen 1978; Lazowska et al. 1984]. We can now apply the BCMP theorem[Baskett et al. 1975] to analyze this network of queues by considering each queue in thenetwork independently. According to the utilization law [Denning and Buzen 1978], theaggregate CPU utilization of an application component over the interval τ is a linearsum of the usage due to each request type:
μ = λ1 · s1 + λ2 · s2 + · · · + λk · sk + ε, (1)
where λ1, λ2, . . . λk denote the observed rates for each request class over the interval τ ;s1, s2, . . . sk denote the corresponding mean service times and ε is a error term assumedrandom and independent.
If the request classes are well chosen, then we can sample the arrival rate of eachclass empirically, derive the above linear model from these measurements, and use itto yield an estimate μ of the CPU utilization due to the incoming workload. Thus, inour example above, λ1 and λ2 might represent requests for small static files and scripts;and s2 would be greater than s1, representing the increased cost of script processing.The value of this model is that it retains its accuracy when the request mix changes.Thus, if the overall arrival rate in our example remained constant but the proportionof script requests increased, the model would account for the workload change andpredict an increase in CPU load.
3.2. Workload-to-Workload Model
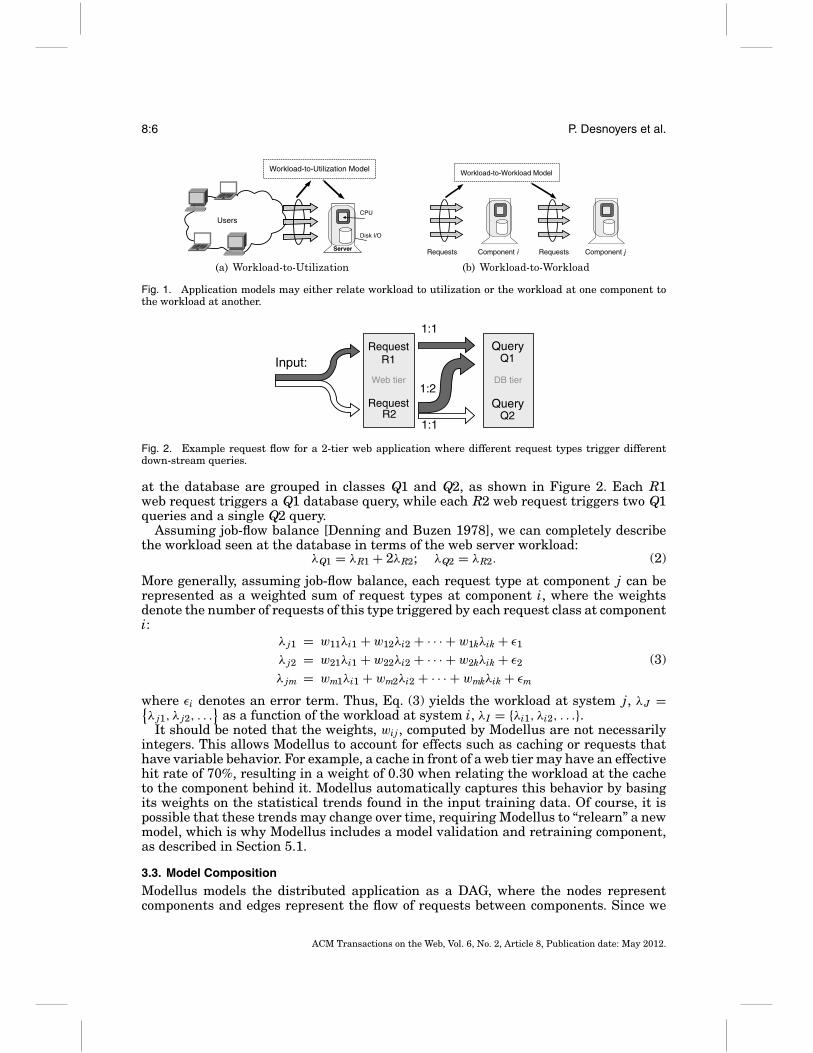
In addition to examining requests at a single component, we next consider two interact-ing components, as shown in Figure 1(b), where incoming requests at i trigger requeststo component j. For simplicity, we assume that i is the source of all requests to j; theextension to multiple upstream components is straightforward. Let there be k requestclasses at components i and m classes in the workload seen by j. Let λI = {λi1, λi2, . . .}and λJ = {λ j1, λ j2, . . .} denote the class-specific arrival rates at the two components.
To illustrate, suppose that i is a front-end web server and j is a back-end database,and web requests at i may be grouped in classes R1 and R2. Similarly, SQL queries
ACM Transactions on the Web, Vol. 6, No. 2, Article 8, Publication date: May 2012.
8:6 P. Desnoyers et al.
Workload-to-Utilization Model
CPU
Disk I/O
Users
Server
(a) Workload-to-Utilization
Component i Component jRequests Requests
Workload-to-Workload Model
(b) Workload-to-Workload
Fig. 1. Application models may either relate workload to utilization or the workload at one component tothe workload at another.
DB tier
1:1
1:2
1:1
Input:Query
Q1
QueryQ2
Web tier
RequestR1
RequestR2
Fig. 2. Example request flow for a 2-tier web application where different request types trigger differentdown-stream queries.
at the database are grouped in classes Q1 and Q2, as shown in Figure 2. Each R1web request triggers a Q1 database query, while each R2 web request triggers two Q1queries and a single Q2 query.
Assuming job-flow balance [Denning and Buzen 1978], we can completely describethe workload seen at the database in terms of the web server workload:
λQ1 = λR1 + 2λR2; λQ2 = λR2. (2)
More generally, assuming job-flow balance, each request type at component j can berepresented as a weighted sum of request types at component i, where the weightsdenote the number of requests of this type triggered by each request class at componenti:
λ j1 = w11λi1 + w12λi2 + · · · + w1kλik + ε1
λ j2 = w21λi1 + w22λi2 + · · · + w2kλik + ε2 (3)λ jm = wm1λi1 + wm2λi2 + · · · + wmkλik + εm
where εi denotes an error term. Thus, Eq. (3) yields the workload at system j, λJ ={λ j1, λ j2, . . .
}as a function of the workload at system i, λI = {λi1, λi2, . . .}.
It should be noted that the weights, wi j , computed by Modellus are not necessarilyintegers. This allows Modellus to account for effects such as caching or requests thathave variable behavior. For example, a cache in front of a web tier may have an effectivehit rate of 70%, resulting in a weight of 0.30 when relating the workload at the cacheto the component behind it. Modellus automatically captures this behavior by basingits weights on the statistical trends found in the input training data. Of course, it ispossible that these trends may change over time, requiring Modellus to “relearn” a newmodel, which is why Modellus includes a model validation and retraining component,as described in Section 5.1.
3.3. Model Composition
Modellus models the distributed application as a DAG, where the nodes representcomponents and edges represent the flow of requests between components. Since we
ACM Transactions on the Web, Vol. 6, No. 2, Article 8, Publication date: May 2012.

Modellus: Automated Modeling of Complex Internet Data Center Applications 8:7
i j
(a) Transitivity
i
j
h(b) Splitting
i
j
h(c) Joining
Fig. 3. Models may be composed transitively (e.g., for sequentially linked components), by splitting (e.g.,from a load balancer to worker nodes), or by joining (e.g., from multiple processing nodes to a backenddatabase).
modeled each component as a queuing system, the DAG is essentially a network ofqueuing. Given our workload-to-utilization and workload-to-workload models, for anindividual component, we can compose these models in our queuing network to de-rive the workload and utilization at some component i as a function of one or moreupstream components (see Figure 3). Specifically, our workload-to-utilization (W2U)model yields the utilization due to an application j as a function of its workload:μ j = f (λJ); our workload-to-workload (W2W) model yields the workload at applicationj as a function of the workload at application i: λJ = g(λI). Assuming flow balance,substituting allows us to determine the utilization at j directly as a function of theworkload at i: μ j = f (g(λI)). Since f and g are both linear equations, the compos-ite function, obtained by substituting Eq. (3) into Eq. (1), is also a linear equation.This composition process is transitive: given cascaded components i, j, and k, it canyield the workload and the utilization of the downstream application k as a functionof the workload at i. In a three-tier application, for instance, this lets us predict be-havior at the database back-end as a function of user requests at the front-end webserver.
Our discussion has implicitly assumed a linear chain topology, where each appli-cation sees requests from only one upstream component, illustrated schematically inFigure 3(a). This is a simplification; in a complex data center, applications may bothreceive requests from multiple upstream components, and in turn issues requests tomore than one downstream component. Thus an employee database may see requestsfrom multiple applications (e.g., payroll, directory), while an online retail store maymake requests to both a catalog database and a payment processing system. We musttherefore be able to model both: (i) “splitting”—triggering requests to multiple down-stream components, and (ii) “merging,” where one component receives request streamsfrom multiple others. (see Figure 3(b) and (c)).
To model splits, consider a component i that makes requests to downstream compo-nents j and h. Given the incoming request stream at i, λI , we consider the subset ofthe outgoing workload from i that is sent to j, namely λJ. We can derive a model ofthe inputs at i that trigger this subset of outgoing requests using Eq. (3): λJ = g1(λI).Similarly, by considering only the subset of the outgoing requests that are sent to h,we can derive a second model relating λH to λI : λH = g2(λI).
For joins, consider a component j that receives requests from upstream component iand h. We first split the incoming request stream by source: λJ = {λJ|src = i}+{λJ|src =h}. The workload contributions at j of i and h are then related to the input workloadsat the respective applications using Eq. (3): {λJ|src = i} = f1(λI) and {λJ|src = h} =f2(λH), and the total workload at j is described in terms of inputs at i and h: λJ =f1(λI) + f2(λH). Since f1 and f2 are linear equations, the composite function, which isthe summation of the two, f1 + f2, is also linear.
ACM Transactions on the Web, Vol. 6, No. 2, Article 8, Publication date: May 2012.

8:8 P. Desnoyers et al.
By modeling these three basic interactions—cascading, splitting, and joining—we areable to compose single step workload-to-workload and workload-to-utilization modelsto model any arbitrary application graph. Such a composite model allows workload orutilization at each node to be calculated as a linear function of data from other pointsin the system.
4. AUTOMATED MODEL GENERATION
We next present techniques for automatically learning models of the form describedabove. In particular, these models require specification of the following parameters:(i) request classes for each component; (ii) arrival rates in each class, λi; (iii) meanservice times si for each class i; and (iv) rates wi j at which type i requests triggertype j requests. In order to apply the model, we must measure λi, and estimate siand wi j .
If the set of classes and mapping from requests to classes was given, then mea-surement of λi would be straightforward. In general, however, request classes for acomponent are not known a priori. Manual determination of classes is impractical, asit would require detailed knowledge of application behavior, which may change withevery modification or extension. Thus, our techniques must automatically determinean appropriate classification of requests for each component, as part of the model gen-eration process.
Once the request classes have been determined, we estimate the coefficients si andwi j . Given measured arrival rates λi in each class i and the utilization μ within ameasurement interval, Eqs. (1) and (3) yield a set of linear equations with unknowncoefficients si and wi j . Measurements in subsequent intervals yield additional setsof such equations; these equations can be solved using linear regression to yield theunknown coefficients si and wi j that minimize the error term ε.
A key contribution of our automated model generation is to combine determination ofrequest classes with parameter estimation, in a single step. We do this by mechanicallyenumerating possible request classes, and then using statistical techniques to selectthe classes that are predictive of utilization or downstream workload. In essence, theprocess may be viewed as “mining” the observed request stream to determine features(classes) that are the best predictors of the resource usage and triggered workloads; werely on stepwise regression—a technique also used in data mining—for our automatedmodel generation.
In particular, for each request we first enumerate a set of possible features, primarilydrawn from the captured request string itself. Each of these features implies a classifi-cation of requests into those that have this feature and those that do not. By repeatingthis over all requests observed in an interval, we obtain a list of candidate classes. Wealso measure arrival rates within each candidate class and resource usage over time.Stepwise regression of feature rates against utilization is then used to select only thosefeatures that are significant predictors of utilization and to estimate their weights,giving us the workload-to-utilization model.
Derivation of W2W models is an extension of this. First we create a W2U model atapplication j in order to determine the significant workload features. Then, we modelthe arrival rate of these features, again by using stepwise regression. We model eachfeature as a function of the input features at i; when we are done we have a model thattakes input features at i and predicts a vector of features λJ at j.
4.1. Feature Enumeration
For this approach to be effective, classes with stable behavior (mean resource require-ments and request generation) must exist. In addition, information in the request logmust be sufficient to determine this classification. We present an intuitive argument for
ACM Transactions on the Web, Vol. 6, No. 2, Article 8, Publication date: May 2012.

Modellus: Automated Modeling of Complex Internet Data Center Applications 8:9
the existence of such classes and features and a description of the feature enumerationtechniques used in Modellus.
We first assert that this classification is possible, within certain limits: in particularthat, in most cases, system responses to identical requests are similar across a broadrange of operating conditions. Consider, for example, two identical requests to a webserver for the same simple dynamic page—regardless of other factors, identical requestswill typically trigger the same queries to the back-end database. In triggering thesequeries, the requests are likely to invoke the same code paths and operations, resultingin (on average) similar resource demands.2
Assuming these request classes exist, we need an automated technique to derivethem from application logs, that is, we need to find requests that perform similar oridentical operations, on similar or identical data and group them into a class. The largerand more general the groups produced by our classification, the more useful they willbe for actual model generation. At the same time, we cannot blindly try all possiblegroupings, as each unrelated classification tested adds a small increment of noise toour estimates and predictions.
In the cases we are interested in, for example, HTTP, SQL, or XML-encoded requests,much or all of the information needed to determine request similarity is encoded byconvention or by syntax in the request itself. Thus, we would expect the query ’SELECT *
from cust WHERE cust.id=105’ to behave similarly to the same query with “cust.id=210”, while anHTTP request for a URL ending in “images/map.gif” is unlikely to be similar to one endingin “browse.php?category=5”.
Our enumeration strategy consists of extracting and listing features from requeststrings, where each feature identifies a potential candidate request class. Each enu-meration strategy is based on the formal or informal3 syntax of the request, and itenumerates the portions of the request that identify the class of operation, the databeing operated on, and the operation itself, which are later tested for significance. Wenote that the rules that define the feature enumeration strategy must be manuallyspecified for each application type, but that there are a relatively small number of suchtypes, and once these rules are specified for one request syntax it is applicable to anyapplication sharing that request syntax.
Modellus includes predefined feature enumeration rules for Apache HTTP serverlogs and for MySQL database logs. The manual process of creating rules for additionalapplications is a straightforward task of writing a simple parser that splits a loggedrequest string into a set of possible features. This process only needs to be performedonce per application type (e.g., just once for Apache, not once for each web applicationthat runs in the data center). The task is further simplified because Modellus willautomatically select which features are most effective for producing a model—thus,the system administrator creating the feature rules does not need to worry aboutenumerating the features that might be the most relevant.
The Modellus feature enumeration rules for HTTP requests are shown in Figure 4(a),with features generated from an example URL. The aim of the feature enumerationrules is to identify request elements that may identify common processing paths; thusfeatures include file extensions, URL prefixes, and query skeletons (i.e., a query witharguments removed), each of which may identify common processing paths. In Fig-ure 4(b) we see the feature enumeration rules for SQL database queries, which use
2Caching will violate this linearity assumption; however, we argue that in this case behavior will fall intotwo domains—one dominated by caching, and the other not—and that a linear approximation is appropriatewithin each domain.3For example, HTTP, where hierarchy, suffixes, and query arguments are defined by convention rather thanstandard.
ACM Transactions on the Web, Vol. 6, No. 2, Article 8, Publication date: May 2012.

8:10 P. Desnoyers et al.
Fig. 4. Example feature enumeration rules for SQL and HTTP.
Fig. 5. Feature enumeration algorithm.
table names, database names, query skeletons, and SQL phrases (which may be entirequeries in themselves) to generate a list of features. Feature enumeration is performedon all requests present in an application’s log file over a measurement window, onerequest at a time, to generate a list of candidate features. Figure 5 shows the featureenumeration algorithm that generates the list of candidate features.
Note that the Modellus approach of having each request potentially match manyfeatures is different from traditional request classification schemes that attempt tomatch each request to a single class. The limited set of classes used by traditionalapproaches are typically only effective if expert knowledge can be used to define theclasses. Modellus requires no such knowledge, and instead maps each request to manydifferent potentially useful features. The modeling component described in the nextsection then determines which of these features are most useful for predicting eitherutilization or downstream workloads.
4.2. Feature Selection Using Stepwise Linear Regression
Once the enumeration algorithm generates a list of candidate features, the next step isto use training data to learn a model by choosing only those features whose coefficientssi and wi j minimize the error terms in Eqs. (1) and (3). In a theoretical investigation, wemight be able to compose benchmarks consisting only of particular requests, and thusmeasure the exact system response to these particular requests. In practical systems,however, we can only observe aggregate resource usage, given an input stream ofrequests that we do not control. Consequently, the model coefficients si and wi j mustalso be determined as part of the model generation process.
One naıveapproach is to use all candidate classes enumerated in the previous stepand to employ least squares regression on the inputs (here, arrival rates within eachcandidate class) and outputs (utilization or downstream request rates) to determine aset of coefficients that best fit the training data. However, this will generate spuriousfeatures with no relationship to the behavior being modeled; if included in the model,
ACM Transactions on the Web, Vol. 6, No. 2, Article 8, Publication date: May 2012.

Modellus: Automated Modeling of Complex Internet Data Center Applications 8:11
Fig. 6. Stepwise linear regression algorithm.
Feature Rule Specifications
Workload to Workload Models
Modellus Automation
Data CollectionFeature
EnumerationStepwise
Regression
Model Validation
Model Composition
Application Structure
Manual Inputs Outputs
Workload to Utilization Models
Fig. 7. After system administrators define application structure and feature enumeration rules, Modellusautomates data collection, request classification, model creation, and periodic validation.
they will degrade its accuracy, in a phenomena known as overfitting in the machine-learning literature. In particular, some will be chosen due to random correlation withthe measured data, and will contribute noise to future predictions.
This results in a data mining problem: out of a large number of candidate classes andmeasurements of arrival rates within each class, determining those that are predictiveof the output of interest and discarding the remainder. In statistics this is termed avariable selection problem [Draper and Smith 1998], and may be solved by various tech-niques that in effect determine the odds of whether each input variable influences theoutput or not. Of these methods, we use stepwise linear regression [Efroymson 1960]due in part to its scalability, along with a modern extension: the Foster and George’srisk inflation criteria [Foster and George 1994]. We chose stepwise linear regressionover other variable selection methods because it offers a good balance between scal-ability, robustness, and practicality from a computational standpoint, allowing us todeploy it for modeling real data center applications.
A simplified version of this algorithm is shown in Figure 6, with input variables λiand output variable μ. We begin with an empty model; as this predicts nothing, itserror is exactly μ. In the first step, the variable that explains the largest fraction of μ isadded to the model. At each successive step, the variable explaining the largest fractionof the remaining error is chosen; in addition, a check is made to see if any variablesin the model have been made redundant by those added at a later step. The processcompletes when no remaining variable explains a statistically significant fraction ofthe response.
Figure 7 summarizes the various steps in Modellus to build application models. Asnoted in the figure, a few steps such as specifying the application structure and fea-ture enumeration rules are manual; Modellus automates the majority of the remain-ing process, including steps that typically require significant application or statistical
ACM Transactions on the Web, Vol. 6, No. 2, Article 8, Publication date: May 2012.

8:12 P. Desnoyers et al.
knowledge such as request classification and model creation. Over time, models maybecome obsolete, so Modellus also automates model testing and retraining, as describedin the following section.
5. ACCURACY, EFFICIENCY, AND STABILITY
We have presented techniques for automatic inference of our basic models and theircomposition. However, several practical issues arise when implementing these tech-niques into a system.
—Workload changes. Although our goal is to derive models that are resilient to shiftsin workload composition as well as volume, some workload changes will cause modelaccuracy to decrease—for instance, the workload may become dominated by requestsnot seen in the training data, or caching behavior may change over time. When thisoccurs, prediction errors will persist until the relevant models are re-trained.
—Effective model validation and retraining. In order to quickly detect shifts in systembehavior, which may invalidate an existing model without unnecessarily retrainingother models that remain accurate, it is desirable to periodically test each model forvalidity. The lower the overhead of this testing, the more frequently it may be done,and thus the quicker the models may adjust to shifts in behavior.
—Cascading errors. Models may be composed to make predictions across multiple tiersin a system; however, uncertainty in the prediction increases in doing so. Methodsare needed to estimate this uncertainty to avoid making unreliable predictions.
—Stability. Some systems will be difficult to predict with significant accuracy. Ratherthan spending resources repeatedly deriving models of limited utility, we shoulddetect these systems and limit the resources expended on them.
In the following section we discuss these issues and the mechanisms in Modellus thataddress them.
5.1. Model Validation and Adaptation
A trained model makes predictions by extrapolating from its training data, and theaccuracy of these predictions will degrade in the face of behavior not found in thetraining data. Another source of errors can occur if the system response changes fromthat recorded during the training window; for instance, a server might become sloweror faster due to failures or upgrades.
In order to maintain model accuracy, we must retrain models when this degradationoccurs. Rather than always relearning models, we instead test predictions againstactual measured data; if accuracy declines below a threshold, then new data is used torelearn the model.
In particular, we sample arrival rates in each class (λi) and measure resource uti-lization μ. Given the model coefficients si and wi j , we substitute λi and μ into Eqs. (1)and (3), yielding the prediction error ε. If this exceeds a threshold εT in k out of nconsecutive tests, the model is flagged for relearning.
A simple approach is to test all models at a central node; data from each systemis collected over a testing window and verified. Such continuous testing of tens orhundreds of models could be computationally expensive. We instead propose a fast,distributed model-testing algorithm based on the observation that although modelderivation is expensive in both computation and memory, model checking is cheap.Hence model validation can be distributed to the systems being monitored themselves,allowing nearly continuous checking.
In this approach, the model—the request classes and coefficients—is provided toeach server or node and can be tested locally. To test workload-to-usage models, anode samples arrival rates and usages over a short window and compares the usage
ACM Transactions on the Web, Vol. 6, No. 2, Article 8, Publication date: May 2012.

Modellus: Automated Modeling of Complex Internet Data Center Applications 8:13
predictions against observations. Workload-to-workload models are tested similarly,except that communication with the downstream node is required to obtain observeddata. If the local tests fail in k out of n consecutive instances, then a full test is triggeredat the central node; full testing involves a larger test window and the computation ofconfidence intervals of the prediction error. Distributed testing over short windows isfast and imposes minimal overheads on server applications; due to this low overhead,tests can be frequent to detect failures quickly.
5.2. Limiting Cascading Errors
In the absence of errors, we could monitor only the external inputs to a system andthen predict all internal behavior from models. In practice, models have uncertaintiesand errors, which grow as multiple models are composed.
Since our models are linear, errors also grow linearly with model composition. Thismay be seen by substituting Eq. (3) into Eq. (1), yielding a composite model with errorterm
∑si · εi + ε, a linear combination of individual errors. Similarly, a “join” again
yields an error term summing individual errors.Given this linear error growth, there is a limit on the number of models that may
be composed before the total error exceeds any particular threshold. Hence, we can nolonger predict all internal workloads and resource usages solely by measuring externalinputs. In order to scale our techniques to arbitrary system sizes, we must measureadditional inputs inside the system, and use these measurement to drive further down-stream predictions.
To illustrate how this may be done, consider a linear cascade of dependencies andsuppose εmax is the maximum tolerable prediction error. The first node in this chainsees an external workload that is known and measured; we can compute the expectedprediction error at successive nodes in the chain until the error exceeds εmax. Sincefurther predictions will exceed this threshold, a new measurement point must be in-serted here to measure, rather than predict, its workload; these measurements drivepredictions at subsequent downstream nodes.
This process may be repeated for the remaining nodes in the chain, yielding a setof measurement points that are sufficient to predict responses at all other nodes inthe chain. This technique easily extends to an arbitrary graph; we begin by measuringall external inputs and traverse the graph in a breadth-first manner, computing theexpected error at each node. A measurement point is inserted if a node’s error exceedsεmax, and these measurements are then used to drive downstream predictions.
5.3. Stability Considerations
Under certain conditions, however, it will not be possible to derive a useful modelfor predicting future behavior. If the system behavior is dominated by truly randomfactors, for instance, model-based predictions will be inaccurate. A similar effect willbe seen in cases where there is insufficient information available. Even if the systemresponse is deterministically related to some attribute of the input, as described below,the log data may not provide that attribute. In this case, models learned from randomdata will result in random predictions.
In order to avoid spending a large fraction of system resources on the creation ofuseless models, Modellus incorporates backoff heuristics to detect applications thatfail model validation more than k times within a period T (e.g., two times within thelast hour). These “misbehaving” applications are not modeled, and are only occasionallyexamined to see whether their behavior has changed and modeling should be attemptedagain.
ACM Transactions on the Web, Vol. 6, No. 2, Article 8, Publication date: May 2012.

8:14 P. Desnoyers et al.
Monitoring &Scheduling Engine
Server
application OS
plugin
testing
plugin
Nucleus
reporting
Control Plane
(MSE)
MVE MVE MVE. . .
Model generation&
validation tasks
Fig. 8. The Modellus nucleus runs on each server to gather resource information and perform periodic modeltesting. The Modellus control plane runs on a cluster of servers dedicated to aggregating component dataand generating models.
6. MODELLUS DESIGN
Our Modellus system implements the statistical and learning methods described inthe previous sections. Figure 8 depicts the Modellus architecture. As shown, Modellusimplements a nucleus on each node to monitor the workload and resource usage andto perform distributed testing. The Modellus control plane resides on one or morededicated nodes and comprises (i) a monitoring and scheduling engine (MSE) thatcoordinates the gathering of monitoring data and scheduling of model generation andvalidation tasks when needed; and (ii) one or more modeling and validation engines(MVE) which implement the core numerical computations for model derivation andtesting. The Modellus control plane exposes a front-end, allowing derived models tobe applied to data center analysis tasks; the current front-end exports models andsampled statistics to a Matlab engine for interactive analysis.
The Modellus nucleus and control plane are implemented in a combination of C++,Python, and Numerical Python [Ascher et al. 2001], providing an efficient yet dynam-ically extensible system. The remainder of this section discusses our implementationof these components in detail.
6.1. Modellus Nucleus
The nucleus is deployed on each target system, and is responsible for both data collec-tion and simple processing tasks. It monitors resource usage, tracks application events,and translates events into rates. The nucleus reports these usages and rates to the con-trol plane, and can also test a control plane-provided model against this data. A simpleHTTP-based interface is provided to the control plane, with commands falling into thefollowing groups: (i) monitoring configuration; (ii) data retrieval; and (iii) local modelvalidation.
Monitoring. The nucleus performs adaptive monitoring under the direction of thecontrol plane—it is instructed which variables to sample and at what rate. The nu-clues implements a uniform naming model for data sources and an extensible pluginarchitecture allowing support for new applications to be easily implemented.
Resource usage is monitored via standard OS interfaces, and collected as countsor utilizations over fixed measurement intervals. Event monitoring is performed byplugins that process event streams (i.e., logs) received from applications. These pluginsprocess logs in real time and generate a stream of request arrivals; class-specific arrivalrates are then measured by mapping each event using application-specific featureenumeration rules and model-specified classes.
The Modellus nucleus is designed to be deployed on production servers, and thusmust require minimal resources. By representing feature strings by hash values, we areable to implement feature enumeration and rate monitoring with minimal overhead,as shown experimentally in Section 7.5. We have implemented plugins for HTTP and
ACM Transactions on the Web, Vol. 6, No. 2, Article 8, Publication date: May 2012.

Modellus: Automated Modeling of Complex Internet Data Center Applications 8:15
waiting ready trained
revalid-ating
unstable
prerequisitesready
collecting done /compute model
done /recompute model
model validationfails
timeout
too many failures
(collect data)
(collect data)
(validate model)
Fig. 9. Modellus uses a state machine to monitor the status of each application model. This allows Modellusto track applications that require system administrator inputs or need to be retrained.
SQL, with particular adaptations for Apache, MySQL, Tomcat, and XML-based webservices.
Data retrieval. A monitoring agent such as the Modellus nucleus may either reportdata asynchronously (push), or buffer it for the receiver to retrieve (pull). In Modellusdata is buffered for retrieval, with appropriate limits on buffer size if data is notretrieved in a timely fashion. Data is serialized using Python’s pickle framework, andthen compressed to reduce demand on both bandwidth and buffering at the monitoredsystem.
Validation and reporting. The nucleus receives model validation requests fromthe control plane, specifying input classes, model coefficients, output parameter, anderror thresholds. It periodically measures inputs, predicts outputs, and calculatesthe error; if out of bounds k out of n times, the control plane is notified. Testing ofworkload-to-workload models is similar, except that data from two systems (upstreamand downstream) is required; the systems share this information without controlplane involvement.
6.2. Monitoring and Scheduling Engine
The main goal of the Modellus control plane is to to generate up-to-date models andmaintain confidence in them by testing. Towards this end, the monitoring and schedul-ing engine (MSE) is responsible for (i) initiating data collection from the nuclei formodel testing or generation; and (ii) scheduling testing or model regeneration tasks onthe modeling and validation engines (MVEs).
The monitoring engine issues data collection requests to remote nuclei, requestingsampled rates for each request class when testing models, and the entire event streamfor model generation. For workload-to-workload models, multiple nuclei are involvedin order to gather upstream and downstream information. Once data collection isinitiated, the monitoring engine periodically polls for monitored data, and disablesdata collection when a full training or testing window has been received.
The control plane has access to a list of workload-to-utilization and workload-to-workload models to be inferred and maintained; this list may be provided by configu-ration or discovery. These models pass through a number of states, which may be seenin Figure 9: waiting for prerequisites, ready to train, trained, revalidating, and unsta-ble. Each W2W model begins in the waiting state, with the downstream W2U modelas a prerequisite, as the feature list from this W2U model is needed to infer the W2Wmodel. Each W2U model begins directly in the ready state. The scheduler selects modelsfrom the ready pool and schedules training data collection; when this is complete, themodel parameters may be calculated. Once parameters have been calculated, the model
ACM Transactions on the Web, Vol. 6, No. 2, Article 8, Publication date: May 2012.
8:16 P. Desnoyers et al.
enters the trained state; if the model is a prerequisite for another, the waiting modelis notified and enters the ready state.
Model validation as described above is performed in the trained state, and if atany point the model fails, it enters the revalidating state, and training data collectionbegins. Too many validation failures within an interval cause a model to enter theunstable state, and training ceases, while from time to time the scheduler selects amodel in the unstable state and attempts to model it again. Finally, the scheduler is re-sponsible for distributing computation load within the MVE, by assigning computationtasks to appropriate systems.
6.3. Modeling and Validation Engine
The modeling and validation engine (MVE) is responsible for the numeric computationsat the core of the Modellus system. Since this task is computationally demanding, adedicated system or cluster is used, avoiding overhead on the data center serversthemselves. By implementing the MVE on multiple systems and testing and/or gener-ating multiple models in parallel, Modellus will scale to large data centers, which mayexperience multiple concurrent model failures or high testing load.
The following functions are implemented in the MVE:
Model generation. W2U models are derived directly; W2W models are derived usingrequest classes computed for the downstream node’s W2U model. In each case step-wise regression is used to derive coefficients relating input variables (feature rates) tooutput resource utilization (W2U models) or feature rates (W2W models).
Model validation. Full testing of the model at the control plane is similar but moresophisticated than the fast testing implemented at the nucleus. To test an W2U model,the sampled arrival rates within each class and measured utilization are substitutedinto Eq. (1) to compute the prediction error. Given a series of prediction errors oversuccessive measurement intervals in a test window, we compute the 95% one-sidedconfidence interval for the mean error. If the confidence bound exceeds the tolerancethreshold, the model is discarded.
The procedure for testing an W2W model is similar. The output feature rates areestimated and compared with measured rates to determine prediction error and aconfidence bound; if the bound exceeds a threshold, the model is invalidated again.Since absolute values of the different output rates in a W2W model may vary widely,we normalize the error values before performing this test by using the downstreammodel coefficients as weights, allowing us to calculate a scaled error magnitude.
6.4. Scaling to Large Data Centers
Modern data centers may have hundreds or thousands of servers running a largenumber of applications. Our design of Modellus incorporates a number of decisionsthat enables our system to scale to these sizes. First, Modellus models each applicationcomponent independently and then composes models to create an aggregate modelof the distributed application. Consequently, each component model can be computedindependently, and we can employ a cluster of servers to parallelize this process; modelcomposition does introduce dependencies (i.e., all component models must be computedbefore they can be composed), and Figure 9 shows how these dependencies are handledusing the notion of prerequisites; various model compositions can also be parallelizedin a similar fashion.
Further, the sever cluster running the Modellus engine can be expanded as thenumber of applications grows. Since there are no dependencies between models ofindependent applications, the larger the cluster, the greater the parallelism andscalability of Modellus’ modeling and validation engine. The Modellus scheduler
ACM Transactions on the Web, Vol. 6, No. 2, Article 8, Publication date: May 2012.

Modellus: Automated Modeling of Complex Internet Data Center Applications 8:17
Web Services
OFBiz / TPC-W
RUBiS
Apache Tomcat MySQL
Apache / PHP
Apache / PHP Apache / PHP Apache / PHP
MySQL Cluster
Apache / PHP
CPU 1 x Pentium 4, 2.4 GHz, 512KB cacheDisk ATA 100, 2MB cache, 7200 RPM
Memory 1, 1.2, or 2GBOS CentOS 4.4 (Linux kernel 2.6.9-42)
Servers Apache 2.0.52MySQL 5.1.11 (cluster), 4.1.20 (single)Tomcat 5.0.30, Sun Java 1.5.0
Applications RUBiS, TPC-W, OFBiz
Fig. 10. Data center testbed and system specifications.
described in Section 6.2 can distribute model creation tasks across the modelingcluster as needed. Model verification is performed at each individual component,further reducing the load on the modeling cluster.
In practice, the number and types of models produced by Modellus is based on thesystem administrator’s needs. For each application of interest, Modellus will create aW2W or a W2U model for each component, which can then be composed to producethe overall application model. The computation cost of creating each component modeldepends primarily on the number of features to be considered and is independent ofthe number of other components in the application or data center. Thus, Modellus canefficiently scale to large data centers and its model computation infrastructure caneasily be spread across a cluster of machines.
7. EXPERIMENTAL RESULTS
In this section we present experiments examining various performance aspects of theproposed methods and system. To test feature-based regression modeling, we performmodeling and prediction on multiple test scenarios and compare measured resultswith predictions to determine accuracy. Additional experiments examine errors undershifting load conditions and for multiple stages of prediction. Finally, we present mea-surements and benchmarks of the system implementation in order to determine theoverhead, which may be placed on monitoring systems and the scaling limits of therest of the system.
7.1. Experimental Setup
The purpose of the Modellus system is to model and predict performance of real-worldweb applications, and it was thus tested on results from a realistic data center testbedand applications. The testbed is shown in Figure 10, with a brief synopsis of thehardware and software specifications. Four web applications were tested:
(1) TPC-W [Smith ; Cain et al. 2001]: an e-commerce benchmark, implemented asa 3-tier Java servlet-based application, consisting of a front-end server (Apache)handling static content, a servlet container (Tomcat), and a back-end database(MySQL);
(2) Apache Open For Business (OFBiz) [openforbiz 2007]: an ERP (Enterprise ResourcePlanning) system in commercial use. Uses the same Apache, Tomcat, MySQL setupas TPC-W;
(3) RUBiS [Cecchet et al. 2003]: a simulated auction site running as a 2-tier LAMP4
application; application logic written in PHP runs in an Apache front-end server,while data is stored in a MySQL database cluster; and
4Linux/Apache/MySQL/PHP.
ACM Transactions on the Web, Vol. 6, No. 2, Article 8, Publication date: May 2012.

8:18 P. Desnoyers et al.
(4) Web Services Benchmark: a custom set of Apache/PHP-based components that canbe connected in arbitrary topologies through a RESTful web API.
Both RUBiS and TPC-W have associated workload generators, which simulate vary-ing numbers of clients; the number of clients as well as their activity mix and thinktimes were varied over time to generate nonstationary workloads. A load generator forOFBiz was created using JWebUnit [jwebunit 2007], which simulated multiple usersperforming shopping tasks from browsing through checkout and payment informationentry. The httperf [Mosberger and Jin 1998] tool was used as a load generator for theWeb Services Benchmark.
Apache, Tomcat, and MySQL were configured to generate request logs, and systemresource usage was sampled using the sadc(8) utility with a 1-second collection inter-val. Traces were collected and prediction was performed offline, in order to allow reuseof the same data for validation. Cross-validation was used to measure prediction error:each trace was divided into training windows of a particular length (e.g., 30 minutes),and a model was constructed for each window. Each model was then used to predictall data points outside of the window on which it was trained; deviations betweenpredicted and actual values were then measured.
7.2. Model Generation Accuracy
To test W2U model accuracy, we use the OFBiz, TPC-W and RUBiS applications andmodel each of the tiers individually. Using traces from each application we computemodels over 30-minute training windows, and then use these models to predict utiliza-tion μ, using cross-validation as described above. We report the root mean square (RMS)error of prediction, and the 90th percentile absolute error (|μ − μ|). For comparison wealso show the standard deviation of the measured data itself, σ (y).
We use 30-second training and prediction intervals as that was the measurementinterval in the trace data. In general, the predictions should be made over similarintervals as the training data for the best accuracy. Testing the model on a differentinterval length than the one on which it was trained on might lead to lower accuracy(e.g., predictions over 1-second intervals when the training is done over 30-secondintervals will not yield good results). Further, since the model is able to accuratelypredict the utilization at even 30-second intervals, we believe that the accuracy will besimilar when the interval is longer, because the small scale variations and oscillationsthat are hard to predict will be smoothed out while averaging over longer intervals. Theinterval should be long enough to remove the momentary fluctuations and oscillationsthat can make it difficult to fit an accurate model on data. The length of the trainingwindow should be long enough to capture all the different characteristics of data. Forthis experiment we found that a 30-minute duration was long enough to capture theentire range of characteristics. For a different scenario, a longer duration might berequired to train an accurate model.
In Figure 11 we see results from these tests. Both RMS and 90th percentile predic-tion error are shown for each server except the OFBiz Apache front-end, which wastoo lightly loaded (< 3%) for accurate prediction. In addition, we plot the standarddeviation of the variable being predicted (CPU utilization), in order to indicate the de-gree of error reduction provided by the model. In each case we are able to predict CPUutilization to a high degree of accuracy—less than 5% except for the TPC-W Tomcatserver, and in all cases a significant reduction relative to the variance of the data beingpredicted.
We examine the distribution of prediction errors more closely in Figures 12 and13, using the RUBiS application. For each data point predicted by each model wecalculate the prediction error (|y − y|), and display a cumulative histogram or CDF of
ACM Transactions on the Web, Vol. 6, No. 2, Article 8, Publication date: May 2012.

Modellus: Automated Modeling of Complex Internet Data Center Applications 8:19
Apache
Tomcat
MySQL
Tomcat
MySQL
0% 5% 10% 15% 20% 25% 30%
TP
C-W
O
FB
iz
Error - Percent CPU Utilization
90th percentile errorRMS ErrorData std. dev.
Fig. 11. Workload-to-utilization prediction errors.
0%
20%
40%
60%
80%
100%
0 5 10 15 20
Cum
ulat
ive
Per
cent
Absolute Error (in percent CPU)
HTTP feature-basedHTTP rate only
Fig. 12. Error CDF : RUBiS Apache.
0%
20%
40%
60%
80%
100%
0 5 10 15 20
Cum
ulat
ive
Per
cent
Absolute Error (in percent CPU)
SQL feature-basedSQL rate-based
Fig. 13. Error CDF: RUBiS MySQL.
these errors. From these graphs we see that about 90% of the Apache data points arepredicted within 2.5%, and 90% of the MySQL data points within 5%.
In addition, in this figure we compare the performance of modeling and predict-ing based on workload features vs. predictions made from the aggregate request ratealone. Here we see that CPU on the RUBiS Apache server was predicted about twiceas accurately using feature-based prediction, while the difference between naıveandfeature-based prediction on the MySQL server was even greater.
ACM Transactions on the Web, Vol. 6, No. 2, Article 8, Publication date: May 2012.

8:20 P. Desnoyers et al.
0
2
4
6
8
10
12
14
0 5 10 15 20 25 30 35
RM
S p
redi
ctio
n er
ror
(per
cent
CP
U)
Training Window (minutes)
HTTP -> DB CPUHTTP -> SQL -> DB CPUSQLHTTP
Fig. 14. Composed vs. direct prediction: learning curves for error of MySQL CPU from RUBiS HTTP.
7.3. Model Composition
The results presented examine performance of single workload-to-utilization (W2U)models. We next examine prediction performance when composing workload-to-workload (W2W) and W2U models. We show results from the multitier experimentsdescribed above, but we focus on cross-tier modeling and prediction.
As described earlier, the composition of two models is done in two steps. First, wetrain a W2U model for the downstream system (e.g., the database server) and itsinputs. Next, we take the list of significant features identified in this model, and foreach feature we train a separate upstream model to predict it. For prediction, the W2Wmodel is used to predict input features to the W2U model, yielding the final result.Prediction when multiple systems share a single back-end resource is similar, exceptthat the outputs of the two W2W models must be summed before input to the W2Umodel.
In Figure 14 we compare learning curves for both composed and direct W2U modelsof the RUBiS application. In the composed model (HTTP→SQL→DB CPU), the W2Wmodel translates from HTTP features to SQL features, then the W2U model is in turnused to predict the CPU utilization of the database; the model achieves less than 10%RMS error for training windows over eight minutes. Alternatively, the HTTP featuresfrom the front tier can be used for a single W2U model that predicts CPU usage of thedatabase tier (HTTP→DB CPU), which has comparable error and requires a similartraining period.
In addition we validate our model composition approach by comparing its results totwo direct models made by training the HTTP or SQL server CPU utilization directlyfrom their own inputs. While the direct models have lower error, it may not always bepossible to observe all input features at every tier. Using model composition can lowermonitoring overhead by allowing measurements from one tier to predict resource needsat downstream tiers.
7.4. Cascading Errors
We measured prediction performance of the Web Services application in order to in-vestigate the relationship between model composition and errors. This benchmarkallows application components to be defined and connected in arbitrary topologies.Three separate topologies were measured, corresponding to the model operations inFigure 3—cascade, split, and join—and prediction errors were measured between each
ACM Transactions on the Web, Vol. 6, No. 2, Article 8, Publication date: May 2012.

Modellus: Automated Modeling of Complex Internet Data Center Applications 8:21
i j h k
Prediction targetI J H K
I 0.47% 4.28% 3.45% 4.12%J 0.82% 0.97% 1.21%H 0.50% 0.70%K 0.64%
Fig. 15. Cascade errors. Entry (x,y) gives RMS error predicting at y given inputs to x.
k
j
h
i +
Prediction targetI J H K
I 0.35% 0.47% 0.43% 0.57%J 0.47% 0.43% 0.57%H 0.39%K 0.53%
Fig. 16. Split errors; composition with multiple downstream servers.
i
j
h
k
Prediction targetKJHI
I 0.55%H 0.48%I+H 0.59%J 0.59%K 0.82%
Fig. 17. Join error: composition by summing multiple upstream models.
pair of upstream and downstream nodes. In Figure 15 we see results for the cascadetopology, giving prediction errors for model composition across multiple tiers; errorsgrow modestly, reaching at most about 4%.
In Figure 16 we see results for the split topology, and the join case in Figure 17.In each case prediction, errors are negligible. Note that in the join case, downstreampredictions must be made using both of the upstream sources. This does not appearto affect accuracy; although the final prediction contains errors from two upstreammodels, they are each weighted proportionally.
7.5. System Overheads
We have benchmarked both the Modellus nucleus and the computationally intensiveportions of the control plane. The nucleus was benchmarked on the testbed machinesto determine both CPU utilization and volume of data produced. HTTP and SQL pro-cessing overheads were measured on log data from the TPC-W benchmark; in addition,HTTP measurements were performed for logfiles from the 1998 World Cup web site[Arlitt and Jin 1999].
ACM Transactions on the Web, Vol. 6, No. 2, Article 8, Publication date: May 2012.

8:22 P. Desnoyers et al.
Table I. Overhead for Modellus Log Processing on Trace Workloads
CPU / Equiv.event overhead Output data
HTTP (TPC-W) 16.5μs 2.7% 9.00 bytes/sHTTP (World Cup) 11.8μs n/a 9.05 bytes/sSQL 23.8μs 2.6%
Table II. Training Times for Workload-to-Utilization Models
W2U model features consideredTraining window 500 1000 2000
short (8 min) 0.06s 0.12 0.24medium (15 min) 0.10 0.20 0.42long (30 min) 0.16 0.33 0.72
Table III. Training Times for Workload-to-Workload Models
W2W model features consideredTraining window 500 1000 2000
short (8 min) 0.4s 0.3 0.3medium (15 min) 0.8 0.7 0.8long (30 min) 1.1 1.0 1.1
Based on the request rate in the trace logs and the CPU utilization while they werebeing generated, we report the estimated overhead due to Modellus event processingif the server were running at 100% CPU utilization. Figures include overhead forcompressing the data; in addition, we report the rate at which compressed data isgenerated, as it must be buffered and then transmitted over the network. Results maybe seen in Table I; in each case Modellus incurs less than 3% overhead.
We measure the computationally intensive tasks of the modeling and validationengine to determine the scalability of the system. Tests were run using two systems: a2.8GHz Pentium 4 with 512K cache, and a 2.3GHz Xeon 5140 with 4M cache. Resultsare reported in the following for the Xeon system only, which was approximately threetimes faster on this task than the Pentium 4. Each test measured the time to train amodel; the length of the training window and the number of features considered wasvaried, and multiple replications across different data sets were performed for eachcombination.
Results for training W2U models are seen in Table II. For 30-minute training win-dows and 1000 features considered, a single CPU core was able to compute three modelsper second. Assuming that at most we would want to recompute models every 15 min-utes that is, overlapping half of the previous training window a single CPU wouldhandle model computation for over 2500 monitored systems. W2W model training iscomputationally more complex; results for the same range of model sizes are shown inTable III. These measurements showed a very high data-dependent variation in com-putation time, as complexity of computing the first-tier model is directly affected by thenumber of significant features identified at the second tier. We see that computationtime was primarily determined by the training window length. For 30-minute windowsour system took about a second per model computation; calculating as above, it couldhandle training data from nearly 1000 monitored systems.
Unlike model generation, model testing is computationally simple. Validation of aW2U model across a window of 30 minutes of data, for example, required between 3and 6 milliseconds on the system used.
ACM Transactions on the Web, Vol. 6, No. 2, Article 8, Publication date: May 2012.

Modellus: Automated Modeling of Complex Internet Data Center Applications 8:23
0%
2%
4%
6%
8%
10%
0 0.5 1 1.5 2
Err
or (
% u
tili
zati
on)
Relative service time variability( Coefficient of Variation )
Fig. 18. Prediction error vs. scaled data variability.
7.6. Limitations of our Approach
Our approach to modeling system performance based on input features has a numberof limitations, which we explore in this section. As with any statistical process, thelarger the random component of a given amount of measured data, the higher theresulting error will be. In Modellus, such errors may be due to almost purely randomfactors (e.g., scheduling and queuing delays) or to “hidden variables”—factors that maydeterministically affect system response, but which we are unable to measure. In thissection we demonstrate the effects of such errors via modification of testbed traces.
Simulated CPU traces were created from actual TPC-W data traces by assigningweights to each of the TPC-W operations and then adding a lognormal-distributedrandom component to each processing time. Workload-to-utilization models were thentrained on the original input stream and the resulting utilization data and predictionresults are reported. These may be seen in Figure 18, where prediction error for a fixedtraining window size may be seen to grow roughly linearly with the variability of thedata. From this we see that increases in variability will result in either longer trainingwindows, lower accuracy, or some combination of the two.
The approach used in Modellus of relating request logs to application behavior alsolimits its use to request-response systems. In practice, we believe that these types ofapplications are the ones most likely to see varying workloads for which predictionmodels are useful. Other modeling techniques would be required for batch processingapplications.
A final limitation of Modellus is that it is currently restricted to building linearmodels due to its use of stepwise regression. While this is effective for building resourceutilization and workload models, linear models are generally not effective for modelingperformance metrics such as response time that exhibit nonlinear behavior. We note,however, that Modellus can be easily extended to support piecewise linear models,allowing it to be applied to a broader range of metrics. Our future work will investigatehow to utilize the Modellus framework to build nonlinear models of metrics such asresponse time.
8. DATA CENTER ANALYSIS
In this section we apply the Modellus methodology to actual and simulated real-worlddata center applications. As noted in Section 1, the models computed by Modelluscan be used by system administrators for a variety of management tasks such as theanalysis of as-is state and available headroom, answering what-if questions, and theimpact of system changes. We illustrate these tasks using two case studies.
ACM Transactions on the Web, Vol. 6, No. 2, Article 8, Publication date: May 2012.

8:24 P. Desnoyers et al.
Table IV. Case Study: Predicted Impact of Workload Changes
Application Mix Web reqs/sec Predicted Measured ErrorApache Browsing 90 32.00% 20.00% +12.00%
Browsing 114 40.53% 31.40% +9.13%Ordering 90 43.00% 41.00% +2.00%
Tomcat Browsing 90 37.00% 32.00% +5.00%Browsing 114 46.87% 45.00% +1.87%Ordering 90 56.00% 51.00% +5.00%
MySQL Browsing 90 25.00% 17.30% +7.70%Browsing 114 31.67% 26.00% +5.67%Ordering 90 66.00% 69.00% −3.00%
8.1. Online Retail Scenario
First, we demonstrate the utility of our models for “what-if” analysis of data centerperformance.
Consider an online retailer who is preparing for the busy annual holiday shoppingseason. We assume that the retail application is represented by TPC-W, which is afull-fledged implementation of an 3-tier online store and a workload generator thathas three traffic mixes: browsing, shopping, and ordering, each differing in the relativefractions of requests related to browsing and buying activities. We assume that theshopping mix represents the typical workload seen by the application. Suppose thatthe retailer wishes to analyze the impact of changes in the workload mix and requestvolume in order to plan for future capacity increases. For instance, during the holidayseason it is expected that the rate of buying will increase and so will the overall trafficvolume. We employ Modellus to learn models based on the typical shopping mix anduse it to predict system performance for various what-if scenarios where the workloadmix as well as the volume change.
We simulate this scenario on our data center testbed, as described in Section 7.1.Model training was performed over a two-hour interval with varying TPC-W and RU-BiS load, using the TPC-W “shopping” mixture. We then used this model to expressutilization of each system in terms of the different TPC-W requests, allowing us toderive utilization as a function of requests per second for each of the TPC-W transac-tion mixes. The system was then measured with several workloads consisting of eitherTPC-W “browsing” or “ordering” mixtures.
Predictions are shown in Table IV for the three traffic mixes on the three servers inthe system: Apache, which only forwards traffic; Tomcat, which implements the logic;and MySQL. Measurements are shown as well for two test runs with the browsingmixture and one with ordering. Measured results correspond fairly accurately to pre-dictions, capturing both the significant increase in database utilization with increasedbuying traffic as well as the relative independence of the front-end Apache server torequest mix.
Model Revalidation. In the previous example, Modellus was able to make accuratepredictions about both the “ordering” and “browsing” workloads because it had beentrained on a “shopping” mix which included all of the request types used in both of theother two scenarios. It is also possible that Modellus could be trained on a workload thatdoes not contain the full request set. For example, if Modellus only had access to trainingdata from the browsing workload, it would not be able to make accurate predictions ofthe ordering scenario because the model would not recognize the computation-intensivebuying servlets and database updates. In this case, Modellus would be able to reportthat the what-if workload contained many features not included in the model, alertingsystem administrators that its predictions may not be accurate. Modellus’ automated
ACM Transactions on the Web, Vol. 6, No. 2, Article 8, Publication date: May 2012.

Modellus: Automated Modeling of Complex Internet Data Center Applications 8:25
Table V. Trading System Traces
cpu preads reads (·1000)Pre- Naive 38.95 6748 1151upgrade Feature-based 47.46 10654 1794
Measured 47.20 8733 1448Post- Measured 31.03 6856 2061upgrade Outdated Model 71.18 4392 1369
Recomputed Model 24.34 4819 1471
Feature-based and naıverate-based estimation vs. measured values. The modelmust be retrained after the hardware upgrade.
model revalidation component is able to detect this kind of behavior in the onlinescenario where workload shifts or application modifications cause new request typesto appear. This causes the old model to be discarded and automatically retrained. Inpractice, we expect these transitions to be infrequent, since entirely new features areonly rarely added to an application.
8.2. Financial Application Analysis
The second case study examines the utility of our methods on a large stock tradingapplication at a real financial firm, using traces of stock trading transactions executedat a financial exchange. Resource usage logs were captured over two 72-hour periods inearly May, 2006; in the two-day period between these intervals a hardware upgrade wasperformed. The event logs captured 240,000 events pre-upgrade and 100,000 eventsafter the upgrade occurred. We present the accuracy of Modellus modeling both CPUutilization and disk I/O rates before and after the upgrade; this demonstrates the im-portance of continuously validating models and adapting them to changes in hardware.
In contrast to the other experiments in this article, only a limited amount of informa-tion is available in these traces. CPU utilization and disk traffic were averaged over 60sintervals, and, for privacy reasons, the transaction log contained only a database tablename and status (success/failure) for each event. This results in a much smaller num-ber of features to be used as inputs to the model. In Table V, we see predicted values forthree variables—CPU utilization, physical reads, and logical reads—compared to mea-sured values and a naıverate-based model. The poor performance of the naıvemodelindicates that Modellus can get significant accuracy gains, even from the coarse-grainfeatures available in this scenario.
After the upgrade is performed, the prediction accuracy of the model falls signifi-cantly because it does not know that the underlying CPU and disk hardware has beenchanged. However, the Modellus validation engine is able to detect that the predictedCPU and disk utilizations have a high level of error, causing the system to recalculatethe model. After the model has been retrained, the accuracy returns to the level seenprior to the upgrade.
8.3. Modellus Use Cases
The models provided by Modellus can be used for both “what-if” analysis that predictshow an application will behave in the future and for “as-is” analysis that tries to betterunderstand an application’s current behavior. The previous sections demonstrated howModellus can be used for prediction analysis when workload mixes or volumes areexpected to change in the future. In these cases, Modellus is able to accurately predictresource utilization across multiple components, making it an important tool for datacenter capacity planning. This allows administrators to forecast the resource needsof applications which are seeing workload growth and plan when to add additionalservers to the data center.
ACM Transactions on the Web, Vol. 6, No. 2, Article 8, Publication date: May 2012.

8:26 P. Desnoyers et al.
Headroom analysis tries to discover the amount of free capacity in a data center andhow much workloads can increase before servers will become overloaded. Modelluscan assist in this process by providing models that report utilization across multiplecomponents. System administrators can use the current workload as a starting inputto the model and then gradually increase the load. The model outputs can then beexamined to see when individual components in the application will become saturated,allowing administrators to add capacity to precisely the components that will needit. Traditionally, this process was done based on naıverate models that, for example,predict that a 20% increase in workload results in a 20% increase in load. Modellus’sfeature-based models are significantly more accurate (as shown in Section 7.2) becausethey account for workload mix specifics, and by using model composition can be appliedacross multiple components in an application.
9. RELATED WORK
Application modeling. Server application models can be classified as either black-boxor white-box models. Black-box models describe externally visible performance charac-teristics of a system, with minimal assumptions about the internal operations; white-box models, in contrast, are based on knowledge of these internals. Black-box modelsare used in a number of approaches to data center control via feedback mechanisms.MUSE [Chase et al. 2001] uses a market bidding mechanism to optimize utility, whileModel-Driven Resource Provisioning (MDRP) [Doyle et al. 2003] uses dynamic resourceallocation to optimize SLA satisfaction. Several control theory-based systems use ad-mission control instead, reducing the input to fit the resources available [Kamra et al.2004; Parekh et al. 2002].
While black-box models concern themselves only with the inputs (requests) and out-puts (measured response and resource usage), white-box models are based on causallinks between actions. Magpie [Barham et al. 2004] and Project5 [Aguilera et al. 2003]use temporal correlation on OS and packet traces, respectively, to find event relation-ships. In a variant of these methods, Jiang et al. [2006] use an alternate approach;viewing events of a certain type as a flow, sampled over time, they find invariant ra-tios between event flow rates, which are typically indicative of causal links. Likewise,Menasce et al. [2000] characterized workloads using hierarchical models over multipletime scales.
Queuing models. A popular technique for analyzing the behavior of an applicationis to model its the components as a network of queues [Denning and Buzen 1978;Jackson 1957]. Queuing theory results have been used to relate workloads betweentiers and predict resource utilization or response times [Lazowska et al. 1984; Baskettet al. 1975; Menasce and Almeida 2000; Menasce et al. 2004]. However, these queu-ing models typically assume knowledge of request classifications and service times.In practice, classifying requests and measuring service times requires substantial ap-plication knowledge and instrumentation, which may not be available in large-scaledata centers. To deal with this challenge, Modellus uses the resource utilization andworkload model formulations from queuing theory and combines them with automatedrequest classification and parameter estimation techniques. Our contributions lie inautomating this process and dealing with the practical systems issues of building ascalable model generation and validation system.
These approaches have been applied for analysis of multitier applications. Givenknowledge of a system’s internal structure, a queuing model may be created, whichcan then be calibrated against measured data and then used for analysis and pre-diction. Stewart and Shen [2005] uses this approach to analyze multicomponent webapplications with a simple queuing model. Urgaonkar et al. [2005] uses more sophis-ticated product-form queuing network models to predict application performance for
ACM Transactions on the Web, Vol. 6, No. 2, Article 8, Publication date: May 2012.

Modellus: Automated Modeling of Complex Internet Data Center Applications 8:27
dynamic provisioning and capacity planning. The work by Liu et al. [2006] uses aquadratic programming technique to calculate the service times which are then usedin a queuing theory model of application performance. While this solves part of theproblem, determining how to classify requests, particularly in a large data center withthousands of different applications, remains a challenge. Modellus automates the re-quest classification process using feature enumeration data mining techniques. It thenbuilds statistical workload or utilization models across tiers that are based on queuingtheoretic formulations.
Learning-based approaches. Other systems are predictive: NIMO [Shivam et al. 2006]uses statistical learning with active sampling to model resource usage and predictcompletion time for varying resource assignments. NIMO focuses on the completiontime of long-running applications, and does not address model composition, such asdone by Modellus.
The work of Zhang et al. [2007b] is closely related to ours; they use regressionto derive service times for queuing models of web applications, but require manualclassification of events and do not compose models over multiple systems. Other worklearns classifiers from monitored data: in Cohen et al. [2004] tree-augmented Bayesiannetworks are used to predict SLA violations, and similarly in Chen et al. [2006] aK-nearest-neighbor algorithm is used to for provisioning to meet SLAs. IndependentComponent Analysis (ICA) has also been used to categorize request types based onservice demand by Sharma et al. [2008]. Modellus uses stepwise linear regression overICA or Bayesian methods, since it is a robust method that is computationally efficientenough to be deployed for modeling real data center applications.
Application models have been employed for a variety of reasons. Performance mod-els can be used to guide provisioning engines that determine how many resources toallocate to an application [Bennani and Menasce 2005]. The R-Cappricio system usesregression-based models for capacity planning as well as anomaly detection [Zhanget al. 2007]. SelfTalk/Dena [Ghanbari et al. 2010] is a query language and runtimesystem capable of describing interconnected application components and then evalu-ating queries about expected system behavior. In Modellus, we automate the processof building and updating application performance models, and demonstrate how thesecan be used to answer “what if” questions about resource consumption under differentworkloads and hardware configurations.
10. CONCLUSIONS
This article argue that the rising complexity of Internet data centers has made manualmodeling of application behavior difficult and proposed Modellus, a system to auto-matically model the resource usage and workload dependencies between web applica-tions using statistical methods from data mining and machine learning. We proposed anumber of enhancements to ensure that these statistical methods are practical in largedistributed systems. Modellus automates request classification, model generation, andreevaluation, eliminating many manual steps that typically require significant appli-cation knowledge or statistical expertise. This allows system administrators to focus onusing models for tasks such as capacity planning or “what if” analysis, so that they canbetter understand the current and predicted behavior of their data center applications.
We implemented a prototype of Modellus and deployed it on a Linux data centertestbed. Our experimental results show the ability of this system to learn models andmake predictions across multiple systems in a data center, with accuracies in predictionof CPU utilization on the order of 95% in many cases; in addition, benchmarks showthe overhead of our monitoring system to be low enough to allow deployment on heavilyloaded servers. We further demonstrated the usefulness of Modellus in two case studiesthat illustrate the importance of adapting models after hardware upgrades and using
ACM Transactions on the Web, Vol. 6, No. 2, Article 8, Publication date: May 2012.

8:28 P. Desnoyers et al.
model predictions to answer “what if” questions about changing workload conditions.As part of ongoing and future work, we are enhancing the Modellus framework tocapture nonlinear workload to response time relationships in data center applications,and are building a query interface to enable rich interactive model-driven analysis ofdata center applications.
ACKNOWLEDGMENTS
We would like to thank our reviewers and the TWEB editors for their help improving this article.
REFERENCES
AGUILERA, M. K., MOGUL, J. C., WIENER, J. L., REYNOLDS, P., AND MUTHITACHAROEN, A. 2003. Performance debug-ging for distributed systems of black boxes. In Proceedings of the 19th ACM Symposium on OperatingSystems Principles (SOSP ’03). ACM, New York.
ARLITT, M. AND JIN, T. 1999. Workload characterization. Tech. rep. HPL-1999-35R1. 1998 World Cup Web Site,HP Labs.
ASCHER, D., DUBOIS, P., HINSEN, K., HUGUNIN, J., OLIPHANT, T., ET AL. 2001. Numerical Python. http: //www.numpy.org.
BARHAM, P., DONNELLY, A., ISAACS, R., AND MORTIER, R. 2004. Using Magpie for request extraction and workloadmodeling. In Proceedings of the OSDI. 259–272.
BASKETT, F., CHANDY, K. M., MUNTZ, R. R., AND PALACIOS, F. G. 1975. Open, closed, and mixed networks ofqueues with different classes of customers. J. ACM 22, 248–260.
BENNANI, M. N. AND MENASCE, D. A. 2005. Resource allocation for autonomic data centers using analyticperformance models. In Proceedings of the 2nd International Conference on Automatic Computing (ICAC’05). IEEE, Los Alamitos, CA, 229–240.
CAIN, H. W., RAJWAR, R., MARDEN, M., AND LIPASTI, M. H. 2001. An architectural evaluation of Java TPC-W.In Proceedings of the 7th International Symposium on High Performance Computer Architecture (HPCA’01).
CECCHET, E., CHANDA, A., ELNIKETY, S., MARGUERITE, J., AND ZWAENEPOEL, W. 2003. In Proceedings of theACM/IFIP/USENIX International Conference on Middleware (Middleware ’03).
CHASE, J., ANDERSON, D., THAKAR, P., VAHDAT, A., AND DOYLE, R. 2001. Managing energy and server resourcesin hosting centers. Oper. Syst. Rev. 35, 5, 103–116.
CHEN, J., SOUNDARARAJAN, G., AND AMZA, C. 2006. Autonomic provisioning of backend databases in dynamiccontent web servers. In Proceedings of the IEEE International Conference on Autonomic Computing(ICAC ’06), IEEE, Los Alamitos, CA, 231–242.
COHEN, I., CHASE, J. S., AND GOLDSZMIDT, M., ET AL. 2004. Correlating instrumentation data to system states: Abuilding block for automated diagnosis and control. In Proceedings of the OSDI. 231–244.
DENNING, P. J. AND BUZEN, J. P. 1978. The operational analysis of queuing network models. ACM Comput.Surv. 10, 225–261.
DOYLE, R. P., CHASE, J. S., AND ASAD, O. M., ET AL. 2003. Model-based resource provisioning in a web serviceutility. In Proceedings of the 4th USENIX Symposium on Internet Technologies and Systems (USITS’03).USENIX Association, Berkeley, CA.
DRAPER, N. R. AND SMITH, H. 1998. Applied Regression Analysis. Wiley, New York.Efroymson, M.A. 1960. Mathematical Methods for Digital Computers. Wiley, New York.FOSTER, D. P. AND GEORGE, E. I. 1994. The risk inflation criterion for multiple regression. Ann. Stat. 22, 4,
1947–1975.GHANBARI, S., SOUNDARARAJAN, G., AND AMZA, C. 2010. A query language and runtime tool for evaluating
behavior of multi-tier servers. In Proceedings of the ACM SIGMETRICS International Conference onMeasurement and Modeling of Computer Systems (SIGMETRICS ’10). 131–142.
JACKSON, J. R. 1957. Networks of waiting lines. Oper. Res. 5, 518–521.JIANG, G., CHEN, H., AND YOSHIHIRA, K. 2006. Discovering likely invariants of distributed transaction systems
for autonomic system management. In Cluster Computing, Springer, Berlin, 199–208.jwebunit 2007. JWebUnit. http://jwebunit.sourceforge.net.KAMRA, A., MISRA, V., AND NAHUM, E. 2004. Yaksha: A controller for managing the performance of 3-tiered
websites. In Proceedings of the 12th IEEE International Workshop on Quality of Service (IWQOS’04).
ACM Transactions on the Web, Vol. 6, No. 2, Article 8, Publication date: May 2012.

Modellus: Automated Modeling of Complex Internet Data Center Applications 8:29
LAZOWSKA, E. D., ZAHORJAN, J., GRAHAM, G. S., AND SEVCIK, K. C. 1984. Quantitative System Performance:Computer System Analysis Using Queueing Network Models. Prentice-Hall, Upper Saddle River, NJ.
LIU, Z., WYNTER, L., XIA, C. H., AND ZHANG, F. 2006. Parameter inference of queueing models for it systemsusing end-to-end measurements. Perform. Eval. 63, 1, 36–60.
MENASCE, D., ALMEIDA, V., RIEDI, R., RIBEIRO, F., FONSECA, R., AND MEIRA, W., JR. 2000. In search of invariantsfor e-business workloads. In Proceedings of the 2nd ACM Conference on Electronic Commerce (EC ’00).ACM, New York, 56–65.
MENASCE, D. A. AND ALMEIDA, V. 2000. Scaling for E-Business: Technologies, Models, Performance, and CapacityPlanning 1st Ed., Prentice Hall, Upper Saddle River, NJ.
MENASCE, D. A., ALMEIDA, V., AND DOWDY, L. W. 2004. Performance by Design. Prentice Hall, Upper SaddleRiver, NJ.
MOSBERGER, D. AND JIN, T. 1998. httperf – A tool for measuring web server performance. In Proceedings of theSIGMETRICS Workshop on Internet Server Performance. ACM, New York.
OPENFORBIZ. 2007. The Apache “open for business” project. http://ofbiz.apache.org.PAREKH, S., GANDHI, N., HELLERSTEIN, J., TILBURY, D., JAYRAM, T. S., AND BIGUS, J. 2002. Using control theory to
achieve service level objectives in performance management. Real-Time Syst. 23, 1, 127–141.SHARMA, A. B., BHAGWAN, R., CHOUDHURY, M., GOLUBCHIK, L., GOVINDAN, R., AND VOELKER, G. M. 2008. Automatic
request categorization in internet services. SIGMETRICS Perform. Eval. Rev. 36, 2,16–25.SHIVAM, P., BABU, S., AND CHASE, J. 2006. Learning application models for utility resource planning. In Pro-
ceedings of the IEEE International Conference on Autonomic Computing (ICAC ’06). IEEE, Los Alamitos,CA, 255–264.
SMITH, W. TPC-W: Benchmarking an ecommerce solution. http://www.tpc.org/information/other/techarticles.asp.
STEWART, C. AND SHEN, K. 2005. Performance modeling and system management for multi-component on-line services. In Proceedings of the 2nd conference on Symposium on Networked Systems Design andImplementation (NSDI ’05). Vol. 2, USENIX Associations, Berkeley, CA.
URGAONKAR, B., PACIFICI, G., SHENOY, P., SPREITZER, M., AND TANTAWI, A. 2005. An analytical model for multi-tierinternet services and its applications. In Proceedings of the ACM SIGMETRICS International Conferenceon Measurement and Modeling of Computer Systems (SIGMETRICS ’05). ACM, New York.
ZHANG, Q., CHERKASOVA, L., MATHEWS, G., GREENE, W., AND SMIRNI, E. 2007a. R-capriccio: A capacity plan-ning and anomaly detection tool for enterprise services with live workloads. In Proceedings of theACM/IFIP/USENIX 2007 International Conference on Middleware (Middleware ’07). Springer, Berlin,244–265.
ZHANG, Q., CHERKASOVA, L., AND SMIRNI, E. 2007b. A regression-based analytic model for dynamic resourceprovisioning of multi-tier applications. ACM Trans. Comput. Syst. 27, 3(Nov).
Received July 2010; revised March 2011; accepted October 2011
ACM Transactions on the Web, Vol. 6, No. 2, Article 8, Publication date: May 2012.