MODELLING THE PEDESTRIAN SPEED AT SIGNALISED INTERSECTION …
12
ABSTRACT Pedestrian crossing speed is the key element in the de- sign of pedestrian facilities. It depends on various attributes related to road, traffic and pedestrians. In this paper, an at- tempt has been made to explore the variation, examine the influencing factors and formulate a model for the pedestrian crossing speed at signalised intersection crosswalks. The data have been collected using video graphic technique at 16 signalised crosswalks of the Chandigarh city. The find- ings reveal that a 15th percentile crossing speed (1.11-1.31 m/s) exceeds the design crossing speed of 0.95 m/s. It is also higher than the crossing speed of 1.2 m/s, usually be- ing prescribed and adopted in the developed countries. The statistical analysis indicates no significant difference in the percentile crossing speeds between males and females. However, the variation exists among different age groups, group sizes, and crossing patterns. The correlation analysis depicts that the pedestrian crossing speed has significant negative correlation with the crosswalk width, the crosswalk length, the width of the pedestrian island, the classification of road, average traffic flow and average pedestrian delay, whereas the availability of separate bicycle paths at inter- sections is positively correlated. Furthermore, the stepwise regression model with 70.1 percent accuracy reveals that the crosswalk width, the width of the pedestrian island and the average pedestrian delay play a predominant role in de- termining the pedestrian crossing speed. The authors pro- pose the usage of the developed model for setting out the standards for the appropriate design crossing speed for dif- ferent crosswalks having similar geometric and traffic condi- tions as that of the study area. KEY WORDS pedestrians; crossing speed; crosswalk; intersection; percentile; 1. INTRODUCTION Pedestrian safety is the key concern while crossing at signalised intersections in the developing nations. The pedestrians face a number of conflicts with the vehicular traffic and experience maximum delays at the intersections [1]. This leads to the pedestrians’ erratic crossing behaviour which results in the rise in the number of accidents. With the increase in the number of pedestrian accidents the concern of pedes- trian safety has become essential [2]. Therefore, there is need for proper designing of signalised intersection crosswalks. The pedestrian crossing speed is a vital factor for the effective implementation of safety mea- sures and designing of the crosswalks at intersections. Hence, it is essential to have adequate knowledge of the pedestrian crossing speed under heterogeneous crossing conditions. The design manuals such as the Traffic Engineering Handbook [3] propose a speed of 0.91–0.98 m/s and the Highway Capacity Manual [4] suggests 1.2 m/s as the appropriate speed for the design of pedestrian facilities (if the population of el- derly people accounts for less than 20 percent of the total population). The Manual of Uniform Traffic Con- trol Devices for Streets and Highways (MUTCD) [5] also advises a standard value of 1.21 m/s for kerb-to-kerb crossing. The average crossing speed ranges between 0.75-1.21 m/s on the basis of heterogeneous mix of pedestrians (age and gender). The Indian Roads Con- gress (IRC) suggests a crossing speed of 0.98 m/s for educational and recreational areas. The 15 th percen- tile speed of 0.95 m/s should be used for the design Promet – Traffic & Transportation, Vol. 31, 2019, No. 6, 681-692 681 Traffic Engineering Preliminary Communication Submitted: 20 June 2019 Accepted: 4 Oct. 2019 Bansal A, Goyal T, Sharma U. Modelling the Pedestrian Speed at Signalised Intersection Crosswalks for Heterogeneous Traffic Conditions MODELLING THE PEDESTRIAN SPEED AT SIGNALISED INTERSECTION CROSSWALKS FOR HETEROGENEOUS TRAFFIC CONDITIONS ANKIT BANSAL, Ph.D. Candidate 1 (Corresponding author) E-mail: [email protected] TRIPTA GOYAL, Ph.D. 1 E-mail: [email protected] UMESH SHARMA, Ph.D. 1 E-mail: [email protected] 1 Civil Engineering Department Punjab Engineering College Chandigarh, 160012, India
Transcript of MODELLING THE PEDESTRIAN SPEED AT SIGNALISED INTERSECTION …
ABSTRACT
Pedestrian crossing speed is the key element in the de-sign of pedestrian facilities. It depends on various attributes related to road, traffic and pedestrians. In this paper, an at-tempt has been made to explore the variation, examine the influencing factors and formulate a model for the pedestrian crossing speed at signalised intersection crosswalks. The data have been collected using video graphic technique at 16 signalised crosswalks of the Chandigarh city. The find-ings reveal that a 15th percentile crossing speed (1.11-1.31 m/s) exceeds the design crossing speed of 0.95 m/s. It is also higher than the crossing speed of 1.2 m/s, usually be-ing prescribed and adopted in the developed countries. The statistical analysis indicates no significant difference in the percentile crossing speeds between males and females. However, the variation exists among different age groups, group sizes, and crossing patterns. The correlation analysis depicts that the pedestrian crossing speed has significant negative correlation with the crosswalk width, the crosswalk length, the width of the pedestrian island, the classification of road, average traffic flow and average pedestrian delay, whereas the availability of separate bicycle paths at inter-sections is positively correlated. Furthermore, the stepwise regression model with 70.1 percent accuracy reveals that the crosswalk width, the width of the pedestrian island and the average pedestrian delay play a predominant role in de-termining the pedestrian crossing speed. The authors pro-pose the usage of the developed model for setting out the standards for the appropriate design crossing speed for dif-ferent crosswalks having similar geometric and traffic condi-tions as that of the study area.
KEY WORDS
pedestrians; crossing speed; crosswalk; intersection; percentile;
1. INTRODUCTION Pedestrian safety is the key concern while crossing
at signalised intersections in the developing nations. The pedestrians face a number of conflicts with the vehicular traffic and experience maximum delays at the intersections [1]. This leads to the pedestrians’ erratic crossing behaviour which results in the rise in the number of accidents. With the increase in the number of pedestrian accidents the concern of pedes-trian safety has become essential [2]. Therefore, there is need for proper designing of signalised intersection crosswalks. The pedestrian crossing speed is a vital factor for the effective implementation of safety mea-sures and designing of the crosswalks at intersections. Hence, it is essential to have adequate knowledge of the pedestrian crossing speed under heterogeneous crossing conditions. The design manuals such as the Traffic Engineering Handbook [3] propose a speed of 0.91–0.98 m/s and the Highway Capacity Manual [4] suggests 1.2 m/s as the appropriate speed for the design of pedestrian facilities (if the population of el-derly people accounts for less than 20 percent of the total population). The Manual of Uniform Traffic Con-trol Devices for Streets and Highways (MUTCD) [5] also advises a standard value of 1.21 m/s for kerb-to-kerb crossing. The average crossing speed ranges between 0.75-1.21 m/s on the basis of heterogeneous mix of pedestrians (age and gender). The Indian Roads Con-gress (IRC) suggests a crossing speed of 0.98 m/s for educational and recreational areas. The 15th percen-tile speed of 0.95 m/s should be used for the design
Promet – Traffic & Transportation, Vol. 31, 2019, No. 6, 681-692 681
Traffic EngineeringPreliminary Communication
Submitted: 20 June 2019Accepted: 4 Oct. 2019
Bansal A, Goyal T, Sharma U. Modelling the Pedestrian Speed at Signalised Intersection Crosswalks for Heterogeneous Traffic Conditions
MODELLING THE PEDESTRIAN SPEED AT SIGNALISED INTERSECTION CROSSWALKS FOR HETEROGENEOUS
TRAFFIC CONDITIONS
ANKIT BANSAL, Ph.D. Candidate1
(Corresponding author)E-mail: [email protected] GOYAL, Ph.D.1E-mail: [email protected] SHARMA, Ph.D.1E-mail: [email protected] Civil Engineering Department Punjab Engineering College Chandigarh, 160012, India
Bansal A, Goyal T, Sharma U. Modelling the Pedestrian Speed at Signalised Intersection Crosswalks for Heterogeneous Traffic Conditions
682 Promet – Traffic & Transportation, Vol. 31, 2019, No. 6, 681-692
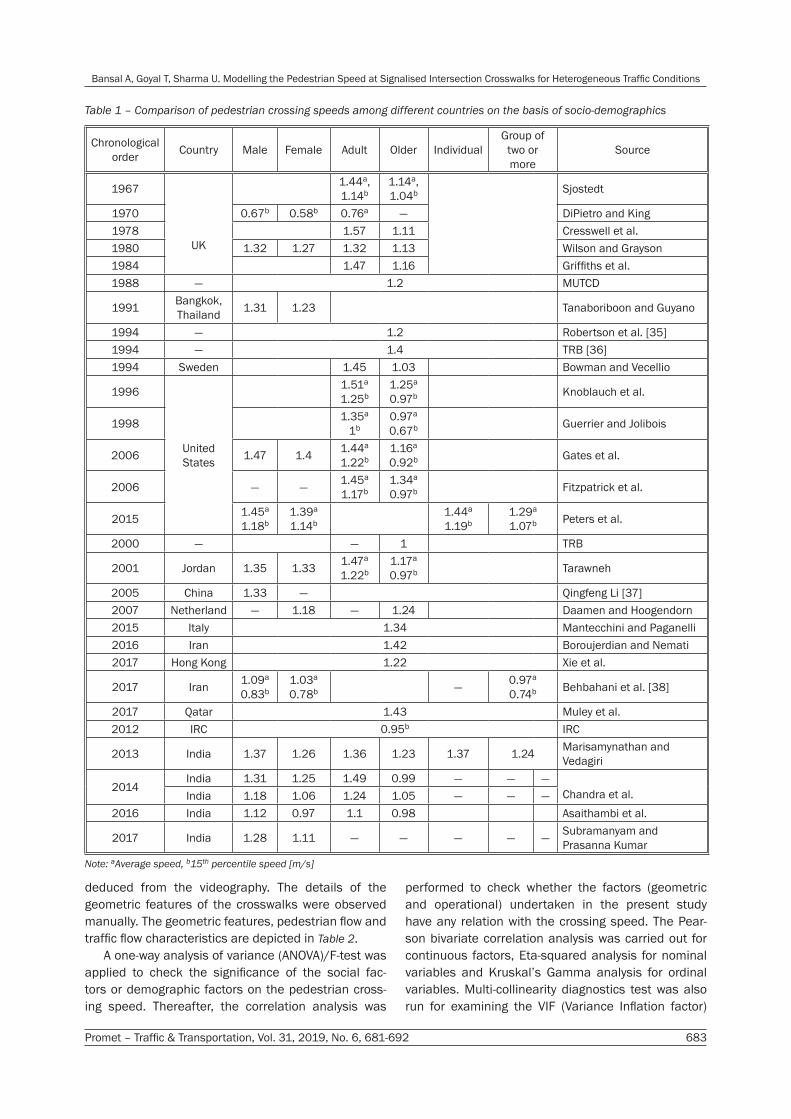
Goh and Lam [30] pointed out that the pedestrians crossing in oblique fashion with two-stage crossing have lower speed as compared to one-stage cross-ing. Moreover, Rastogi et al. [31] deduced that traffic volume, width of road and urban area size have pos-itive influence on the crossing speed. The preceding discussion reveals that the socio-demographic factors (such as gender, age group size), geometric charac-teristics (such as road width, road classification) and flow conditions are the significant factors influencing the crossing speed of pedestrians at signalised cross-walks. It is evident from Table 1 that over a period of time, the average pedestrian crossing speed has in-creased (1.24-1.43 m/s) due to the improvement in traffic conditions and infrastructure facilities [32-34]. Therefore, the present study aims to determine the factors that affect the crossing speed and to model the pedestrian crossing speed for the selected signalised intersection crosswalks in the Chandigarh city under heterogeneous traffic conditions.
2. METHODOLOGYThe present study was carried out in one of the
well-planned cities of India – Chandigarh. The select-ed sites varied in terms of traffic volume, numbers of lanes, nature of land-use and other geometric fea-tures. The crosswalks were either four/six-lane divid-ed or three-lane undivided carriageways. The Chan-digarh city has the best urban planning and modern architecture. It also has the largest number of vehicles per capita in India, due to which non-motorised users face inconvenience in manoeuvrability on the roads especially at the time of crossing at intersections. The statistics show that during the past five years, road ac-cidents claimed 664 lives of which 213 were pedes-trians, which accounts for 32.07 percent of the total deaths [39]. This indicates a severe mistake of ignor-ing the non-motorised traffic in the city road designs. Hence, the data were collected at 16 signalised cross-walks (C1-C16) in Chandigarh city.
Videographic technique was used to gather the pedestrian flow data during the morning peak hour, i.e. between 9:00 a.m. to 10:00 a.m. A total of 994 samples were collected at signalised crosswalks which were further classified into different genders and age groups (less than 18, 19 to 29, 30 to 44, 45 to 59, equal to and above 60). The crossing speed of the pedestrians was computed based on the time taken by a pedestrian to cross the road between the kerb and the median. From the observed data, the average crossing speed was estimated under varying pedestri-an flow conditions. The cumulative S-shaped frequen-cy curves were used to find the percentile speeds at different crosswalks among the various genders, age groups and group sizes. The pedestrian flow, crossing time and delay, vehicular flow and speed were also
of pedestrian crossing facilities. If elder pedestrians account for a greater proportion, the crossing speed of 0.79 m/s should be used [6].
The literature indicates that the variation in the pedestrian crossing speed limits (as prescribed by dif-ferent manuals) is mainly a consequence of the differ-ence in location, geometric site conditions and pedes-trian behavioural characteristics. Numerous factors for instance, type of crosswalk, pedestrian socio-de-mographics (age, gender and group size) and flow characteristics (flow and conflicting flow) significantly affect the crossing speed [7-10]. Lam and Cheung [11] investigated the pedestrian flow behaviour at several crosswalks in Hong Kong and found that the pedestri-ans usually walk faster at crosswalks without a mid-block. Similarly, the study conducted at signalised and non-signalised crosswalks in Malaysia by Goh et al. [12] inferred that pedestrians at non-signalised cross-walks have considerably faster crossing speed than at signalised crosswalks. Studies carried out at different locations reveal a variation in the crossing speed of the adults and elder pedestrians. The studies undertaken in the UK stated an average crossing speed between 1.32-1.72 m/s for younger pedestrians and between 1.11-1.16 m/s for elderly pedestrians [13-16]. In the United States, the variation in the crossing speeds of the elderly people ranges between 0.97–1.34 m/s with the margin of +0.5 percent [17-19]. In Sweden, elder pedestrians usually walk at speeds lower than 0.7 m/s [20]. The crossing speed in the Netherlands is found to be 1.24 m/s for elder pedestrians and 1.5 m/s for the younger ones [21]. Studies undertaken in India also reveal that young pedestrians cross the street at a faster pace (1.24-1.42 m/s) in comparison to middle-aged (1.15-1.24 m/s) and elder pedestrians (0.98-1.23 m/s) [22-24].
Likewise, the effect of gender on the crossing speed has been also explored by various authors. Tanaboriboon and Guyano [25] observed that men walk faster than women by 0.6 m/s at signalised inter-sections in Bangkok. Similarly, Tarawneh [26] conduct-ed a study in Jordan and found that the male crossing speed (1.35 m/s) is on the higher side as compared to the female counterpart (1.33 m/s) and the speed also depends on the crosswalk width. Subramanyam and Prasanna [27] also found similar results in India and revealed that male crossing speed exceeds the female crossing speed by 0.17 m/s. Further, DiPietro and King [28] observed that the 15th percentile speed is 0.76 m/s for a single pedestrian, 0.67 m/s for pedestrians in a pair and 0.61 m/s for more than two pedestrians. Gates et al. [19] also found that the pedestrian speed for crossing in groups is lower than crossing individu-ally (1.32 m/s as opposed to 1.44 m/s). Hatfield and Murphy [29] revealed that the mobile phones do not affect the crossing speed of pedestrians but increase the tendency of hazardous road crossing behaviour.
Bansal A, Goyal T, Sharma U. Modelling the Pedestrian Speed at Signalised Intersection Crosswalks for Heterogeneous Traffic Conditions
Promet – Traffic & Transportation, Vol. 31, 2019, No. 6, 681-692 683
Table 1 – Comparison of pedestrian crossing speeds among different countries on the basis of socio-demographics
Chronological order Country Male Female Adult Older Individual
Group of two or more
Source
1967
UK
1.44a, 1.14b
1.14a, 1.04b Sjostedt
1970 0.67b 0.58b 0.76a — DiPietro and King1978 1.57 1.11 Cresswell et al.1980 1.32 1.27 1.32 1.13 Wilson and Grayson1984 1.47 1.16 Griffiths et al.1988 — 1.2 MUTCD
1991 Bangkok, Thailand 1.31 1.23 Tanaboriboon and Guyano
1994 — 1.2 Robertson et al. [35]1994 — 1.4 TRB [36]1994 Sweden 1.45 1.03 Bowman and Vecellio
1996
United States
1.51a 1.25b
1.25a 0.97b Knoblauch et al.
1998 1.35a
1b0.97a 0.67b Guerrier and Jolibois
2006 1.47 1.4 1.44a 1.22b
1.16a 0.92b Gates et al.
2006 — — 1.45a
1.17b1.34a 0.97b Fitzpatrick et al.
2015 1.45a 1.18b
1.39a 1.14b
1.44a 1.19b
1.29a 1.07b Peters et al.
2000 — — 1 TRB
2001 Jordan 1.35 1.33 1.47a 1.22b
1.17a 0.97b Tarawneh
2005 China 1.33 — Qingfeng Li [37]2007 Netherland — 1.18 — 1.24 Daamen and Hoogendorn2015 Italy 1.34 Mantecchini and Paganelli2016 Iran 1.42 Boroujerdian and Nemati2017 Hong Kong 1.22 Xie et al.
2017 Iran 1.09a 0.83b
1.03a
0.78b — 0.97a
0.74b Behbahani et al. [38]
2017 Qatar 1.43 Muley et al.2012 IRC 0.95b IRC
2013 India 1.37 1.26 1.36 1.23 1.37 1.24 Marisamynathan and Vedagiri
2014India 1.31 1.25 1.49 0.99 — — —
Chandra et al.India 1.18 1.06 1.24 1.05 — — —2016 India 1.12 0.97 1.1 0.98 Asaithambi et al.
2017 India 1.28 1.11 — — — — — Subramanyam and Prasanna Kumar
Note: aAverage speed, b15th percentile speed [m/s]
performed to check whether the factors (geometric and operational) undertaken in the present study have any relation with the crossing speed. The Pear-son bivariate correlation analysis was carried out for continuous factors, Eta-squared analysis for nominal variables and Kruskal’s Gamma analysis for ordinal variables. Multi-collinearity diagnostics test was also run for examining the VIF (Variance Inflation factor)
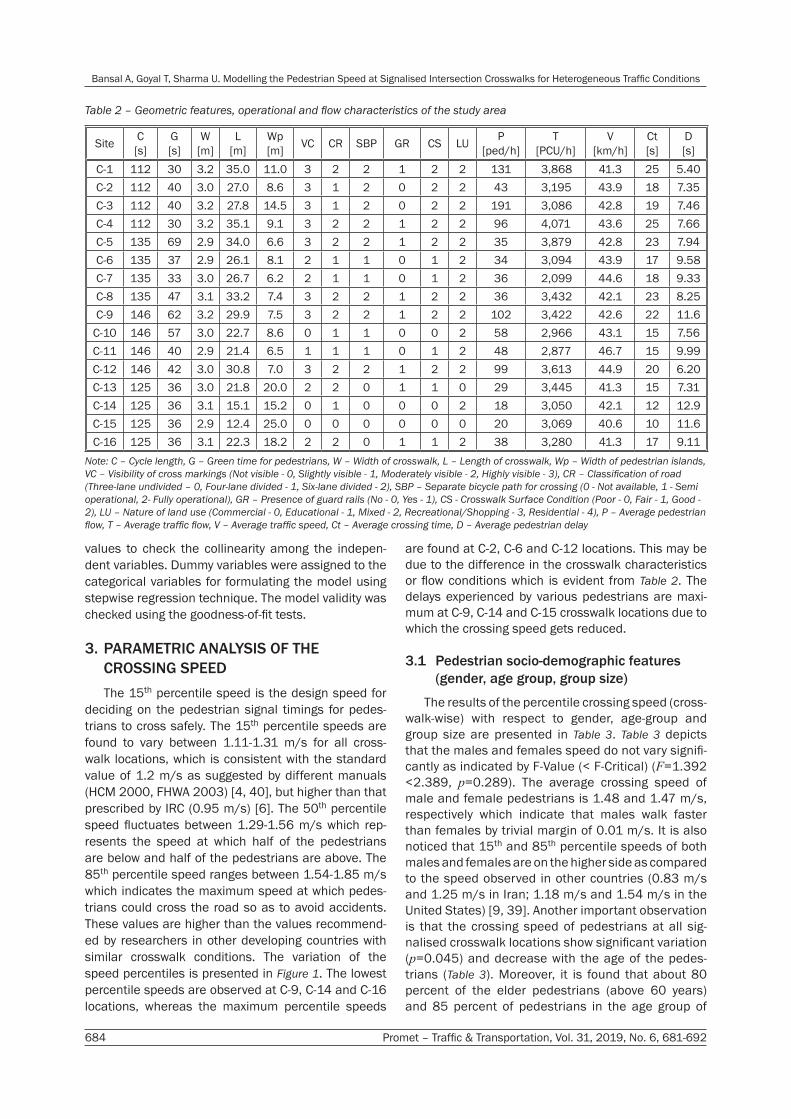
deduced from the videography. The details of the geometric features of the crosswalks were observed manually. The geometric features, pedestrian flow and traffic flow characteristics are depicted in Table 2.
A one-way analysis of variance (ANOVA)/F-test was applied to check the significance of the social fac-tors or demographic factors on the pedestrian cross-ing speed. Thereafter, the correlation analysis was
Bansal A, Goyal T, Sharma U. Modelling the Pedestrian Speed at Signalised Intersection Crosswalks for Heterogeneous Traffic Conditions
684 Promet – Traffic & Transportation, Vol. 31, 2019, No. 6, 681-692
are found at C-2, C-6 and C-12 locations. This may be due to the difference in the crosswalk characteristics or flow conditions which is evident from Table 2. The delays experienced by various pedestrians are maxi-mum at C-9, C-14 and C-15 crosswalk locations due to which the crossing speed gets reduced.
3.1 Pedestrian socio-demographic features (gender, age group, group size)
The results of the percentile crossing speed (cross-walk-wise) with respect to gender, age-group and group size are presented in Table 3. Table 3 depicts that the males and females speed do not vary signifi-cantly as indicated by F-Value (< F-Critical) (F=1.392 <2.389, p=0.289). The average crossing speed of male and female pedestrians is 1.48 and 1.47 m/s, respectively which indicate that males walk faster than females by trivial margin of 0.01 m/s. It is also noticed that 15th and 85th percentile speeds of both males and females are on the higher side as compared to the speed observed in other countries (0.83 m/s and 1.25 m/s in Iran; 1.18 m/s and 1.54 m/s in the United States) [9, 39]. Another important observation is that the crossing speed of pedestrians at all sig-nalised crosswalk locations show significant variation (p=0.045) and decrease with the age of the pedes-trians (Table 3). Moreover, it is found that about 80 percent of the elder pedestrians (above 60 years) and 85 percent of pedestrians in the age group of
values to check the collinearity among the indepen-dent variables. Dummy variables were assigned to the categorical variables for formulating the model using stepwise regression technique. The model validity was checked using the goodness-of-fit tests.
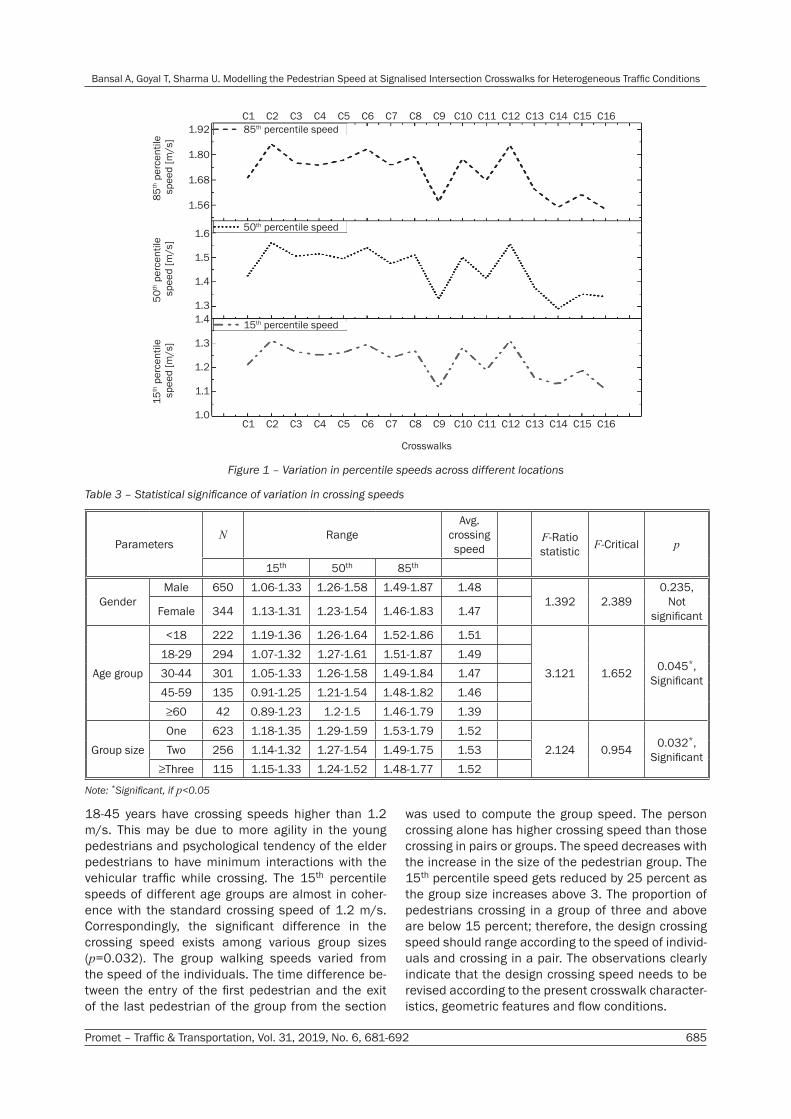
3. PARAMETRIC ANALYSIS OF THE CROSSING SPEEDThe 15th percentile speed is the design speed for
deciding on the pedestrian signal timings for pedes-trians to cross safely. The 15th percentile speeds are found to vary between 1.11-1.31 m/s for all cross-walk locations, which is consistent with the standard value of 1.2 m/s as suggested by different manuals (HCM 2000, FHWA 2003) [4, 40], but higher than that prescribed by IRC (0.95 m/s) [6]. The 50th percentile speed fluctuates between 1.29-1.56 m/s which rep-resents the speed at which half of the pedestrians are below and half of the pedestrians are above. The 85th percentile speed ranges between 1.54-1.85 m/s which indicates the maximum speed at which pedes-trians could cross the road so as to avoid accidents. These values are higher than the values recommend-ed by researchers in other developing countries with similar crosswalk conditions. The variation of the speed percentiles is presented in Figure 1. The lowest percentile speeds are observed at C-9, C-14 and C-16 locations, whereas the maximum percentile speeds
Table 2 – Geometric features, operational and flow characteristics of the study area
Site C[s]
G[s]
W[m]
L[m]
Wp[m] VC CR SBP GR CS LU P
[ped/h]T
[PCU/h]V
[km/h]Ct[s]
D[s]
C-1 112 30 3.2 35.0 11.0 3 2 2 1 2 2 131 3,868 41.3 25 5.40C-2 112 40 3.0 27.0 8.6 3 1 2 0 2 2 43 3,195 43.9 18 7.35C-3 112 40 3.2 27.8 14.5 3 1 2 0 2 2 191 3,086 42.8 19 7.46C-4 112 30 3.2 35.1 9.1 3 2 2 1 2 2 96 4,071 43.6 25 7.66C-5 135 69 2.9 34.0 6.6 3 2 2 1 2 2 35 3,879 42.8 23 7.94C-6 135 37 2.9 26.1 8.1 2 1 1 0 1 2 34 3,094 43.9 17 9.58C-7 135 33 3.0 26.7 6.2 2 1 1 0 1 2 36 2,099 44.6 18 9.33C-8 135 47 3.1 33.2 7.4 3 2 2 1 2 2 36 3,432 42.1 23 8.25C-9 146 62 3.2 29.9 7.5 3 2 2 1 2 2 102 3,422 42.6 22 11.6
C-10 146 57 3.0 22.7 8.6 0 1 1 0 0 2 58 2,966 43.1 15 7.56C-11 146 40 2.9 21.4 6.5 1 1 1 0 1 2 48 2,877 46.7 15 9.99C-12 146 42 3.0 30.8 7.0 3 2 2 1 2 2 99 3,613 44.9 20 6.20C-13 125 36 3.0 21.8 20.0 2 2 0 1 1 0 29 3,445 41.3 15 7.31C-14 125 36 3.1 15.1 15.2 0 1 0 0 0 2 18 3,050 42.1 12 12.9C-15 125 36 2.9 12.4 25.0 0 0 0 0 0 0 20 3,069 40.6 10 11.6C-16 125 36 3.1 22.3 18.2 2 2 0 1 1 2 38 3,280 41.3 17 9.11
Note: C – Cycle length, G – Green time for pedestrians, W – Width of crosswalk, L – Length of crosswalk, Wp – Width of pedestrian islands, VC – Visibility of cross markings (Not visible - 0, Slightly visible - 1, Moderately visible - 2, Highly visible - 3), CR – Classification of road (Three-lane undivided – 0, Four-lane divided - 1, Six-lane divided - 2), SBP – Separate bicycle path for crossing (0 - Not available, 1 - Semi operational, 2- Fully operational), GR – Presence of guard rails (No - 0, Yes - 1), CS - Crosswalk Surface Condition (Poor - 0, Fair - 1, Good - 2), LU – Nature of land use (Commercial - 0, Educational - 1, Mixed - 2, Recreational/Shopping - 3, Residential - 4), P – Average pedestrian flow, T – Average traffic flow, V – Average traffic speed, Ct – Average crossing time, D – Average pedestrian delay
Bansal A, Goyal T, Sharma U. Modelling the Pedestrian Speed at Signalised Intersection Crosswalks for Heterogeneous Traffic Conditions
Promet – Traffic & Transportation, Vol. 31, 2019, No. 6, 681-692 685
was used to compute the group speed. The person crossing alone has higher crossing speed than those crossing in pairs or groups. The speed decreases with the increase in the size of the pedestrian group. The 15th percentile speed gets reduced by 25 percent as the group size increases above 3. The proportion of pedestrians crossing in a group of three and above are below 15 percent; therefore, the design crossing speed should range according to the speed of individ-uals and crossing in a pair. The observations clearly indicate that the design crossing speed needs to be revised according to the present crosswalk character-istics, geometric features and flow conditions.
18-45 years have crossing speeds higher than 1.2 m/s. This may be due to more agility in the young pedestrians and psychological tendency of the elder pedestrians to have minimum interactions with the vehicular traffic while crossing. The 15th percentile speeds of different age groups are almost in coher-ence with the standard crossing speed of 1.2 m/s. Correspondingly, the significant difference in the crossing speed exists among various group sizes (p=0.032). The group walking speeds varied from the speed of the individuals. The time difference be-tween the entry of the first pedestrian and the exit of the last pedestrian of the group from the section
Table 3 – Statistical significance of variation in crossing speeds
ParametersN Range
Avg. crossing speed
F-Ratio statistic F-Critical p
15th 50th 85th
GenderMale 650 1.06-1.33 1.26-1.58 1.49-1.87 1.48
1.392 2.3890.235,
Not significantFemale 344 1.13-1.31 1.23-1.54 1.46-1.83 1.47
Age group
<18 222 1.19-1.36 1.26-1.64 1.52-1.86 1.51
3.121 1.652 0.045*, Significant
18-29 294 1.07-1.32 1.27-1.61 1.51-1.87 1.4930-44 301 1.05-1.33 1.26-1.58 1.49-1.84 1.4745-59 135 0.91-1.25 1.21-1.54 1.48-1.82 1.46≥60 42 0.89-1.23 1.2-1.5 1.46-1.79 1.39
Group sizeOne 623 1.18-1.35 1.29-1.59 1.53-1.79 1.52
2.124 0.954 0.032*, SignificantTwo 256 1.14-1.32 1.27-1.54 1.49-1.75 1.53
≥Three 115 1.15-1.33 1.24-1.52 1.48-1.77 1.52
Note: *Significant, if p<0.05
85th percentile speed
50th percentile speed
15th percentile speed
Crosswalks
C1 C2 C3 C4 C5 C6 C7 C8 C9 C10 C11 C12 C13 C14 C15 C16
C1 C2 C3 C4 C5 C6 C7 C8 C9 C10 C11 C12 C13 C14 C15 C16
85th p
erce
ntile
sp
eed
[m/s
]50
th p
erce
ntile
sp
eed
[m/s
]15
th p
erce
ntile
sp
eed
[m/s
]
1.92
1.80
1.68
1.56
1.6
1.5
1.4
1.31.4
1.3
1.2
1.1
1.0
Figure 1 – Variation in percentile speeds across different locations
Bansal A, Goyal T, Sharma U. Modelling the Pedestrian Speed at Signalised Intersection Crosswalks for Heterogeneous Traffic Conditions
686 Promet – Traffic & Transportation, Vol. 31, 2019, No. 6, 681-692
3.3 Geometric features, operational and flow characteristics
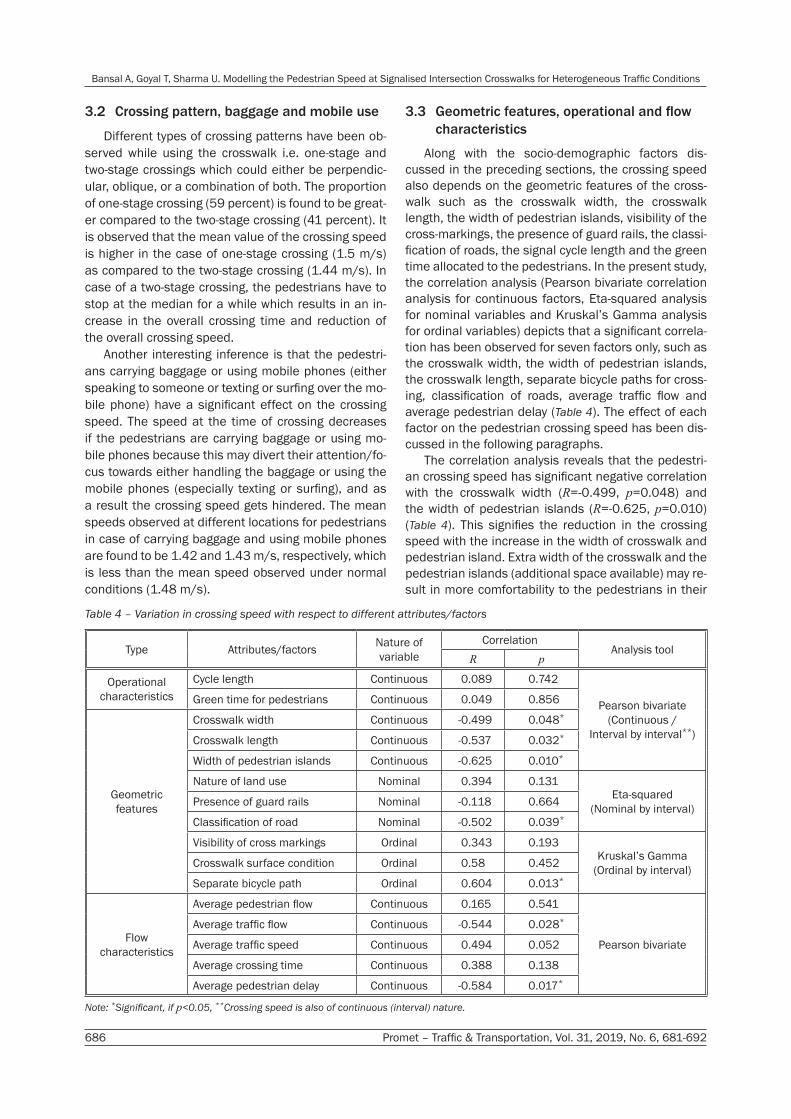
Along with the socio-demographic factors dis-cussed in the preceding sections, the crossing speed also depends on the geometric features of the cross-walk such as the crosswalk width, the crosswalk length, the width of pedestrian islands, visibility of the cross-markings, the presence of guard rails, the classi-fication of roads, the signal cycle length and the green time allocated to the pedestrians. In the present study, the correlation analysis (Pearson bivariate correlation analysis for continuous factors, Eta-squared analysis for nominal variables and Kruskal’s Gamma analysis for ordinal variables) depicts that a significant correla-tion has been observed for seven factors only, such as the crosswalk width, the width of pedestrian islands, the crosswalk length, separate bicycle paths for cross-ing, classification of roads, average traffic flow and average pedestrian delay (Table 4). The effect of each factor on the pedestrian crossing speed has been dis-cussed in the following paragraphs.
The correlation analysis reveals that the pedestri-an crossing speed has significant negative correlation with the crosswalk width (R=-0.499, p=0.048) and the width of pedestrian islands (R=-0.625, p=0.010) (Table 4). This signifies the reduction in the crossing speed with the increase in the width of crosswalk and pedestrian island. Extra width of the crosswalk and the pedestrian islands (additional space available) may re-sult in more comfortability to the pedestrians in their
3.2 Crossing pattern, baggage and mobile use
Different types of crossing patterns have been ob-served while using the crosswalk i.e. one-stage and two-stage crossings which could either be perpendic-ular, oblique, or a combination of both. The proportion of one-stage crossing (59 percent) is found to be great-er compared to the two-stage crossing (41 percent). It is observed that the mean value of the crossing speed is higher in the case of one-stage crossing (1.5 m/s) as compared to the two-stage crossing (1.44 m/s). In case of a two-stage crossing, the pedestrians have to stop at the median for a while which results in an in-crease in the overall crossing time and reduction of the overall crossing speed.
Another interesting inference is that the pedestri-ans carrying baggage or using mobile phones (either speaking to someone or texting or surfing over the mo-bile phone) have a significant effect on the crossing speed. The speed at the time of crossing decreases if the pedestrians are carrying baggage or using mo-bile phones because this may divert their attention/fo-cus towards either handling the baggage or using the mobile phones (especially texting or surfing), and as a result the crossing speed gets hindered. The mean speeds observed at different locations for pedestrians in case of carrying baggage and using mobile phones are found to be 1.42 and 1.43 m/s, respectively, which is less than the mean speed observed under normal conditions (1.48 m/s).
Table 4 – Variation in crossing speed with respect to different attributes/factors
Type Attributes/factors Nature of variable
CorrelationAnalysis tool
R p
Operational characteristics
Cycle length Continuous 0.089 0.742
Pearson bivariate (Continuous /
Interval by interval**)
Green time for pedestrians Continuous 0.049 0.856
Geometric features
Crosswalk width Continuous -0.499 0.048*
Crosswalk length Continuous -0.537 0.032*
Width of pedestrian islands Continuous -0.625 0.010*
Nature of land use Nominal 0.394 0.131Eta-squared
(Nominal by interval)Presence of guard rails Nominal -0.118 0.664
Classification of road Nominal -0.502 0.039*
Visibility of cross markings Ordinal 0.343 0.193Kruskal’s Gamma
(Ordinal by interval)Crosswalk surface condition Ordinal 0.58 0.452
Separate bicycle path Ordinal 0.604 0.013*
Flow characteristics
Average pedestrian flow Continuous 0.165 0.541
Pearson bivariate
Average traffic flow Continuous -0.544 0.028*
Average traffic speed Continuous 0.494 0.052
Average crossing time Continuous 0.388 0.138
Average pedestrian delay Continuous -0.584 0.017*
Note: *Significant, if p<0.05, **Crossing speed is also of continuous (interval) nature.
Bansal A, Goyal T, Sharma U. Modelling the Pedestrian Speed at Signalised Intersection Crosswalks for Heterogeneous Traffic Conditions
Promet – Traffic & Transportation, Vol. 31, 2019, No. 6, 681-692 687
the six-lane divided carriageways. The distance to be covered is more in the latter case which results in in-crease in time for kerb to kerb crossing. It also increas-es the probability of pedestrian-vehicular interaction in case of signal non-compliance either by vehicle or pedestrian. However, these results are contradictory to the results obtained by Rastogi et al. while conducting a study at midblock crosswalks in India [31]. There-fore, this also confirms that the crossing speed is also a function of the crosswalk type (signalised, unsignal-ised or mid-block).
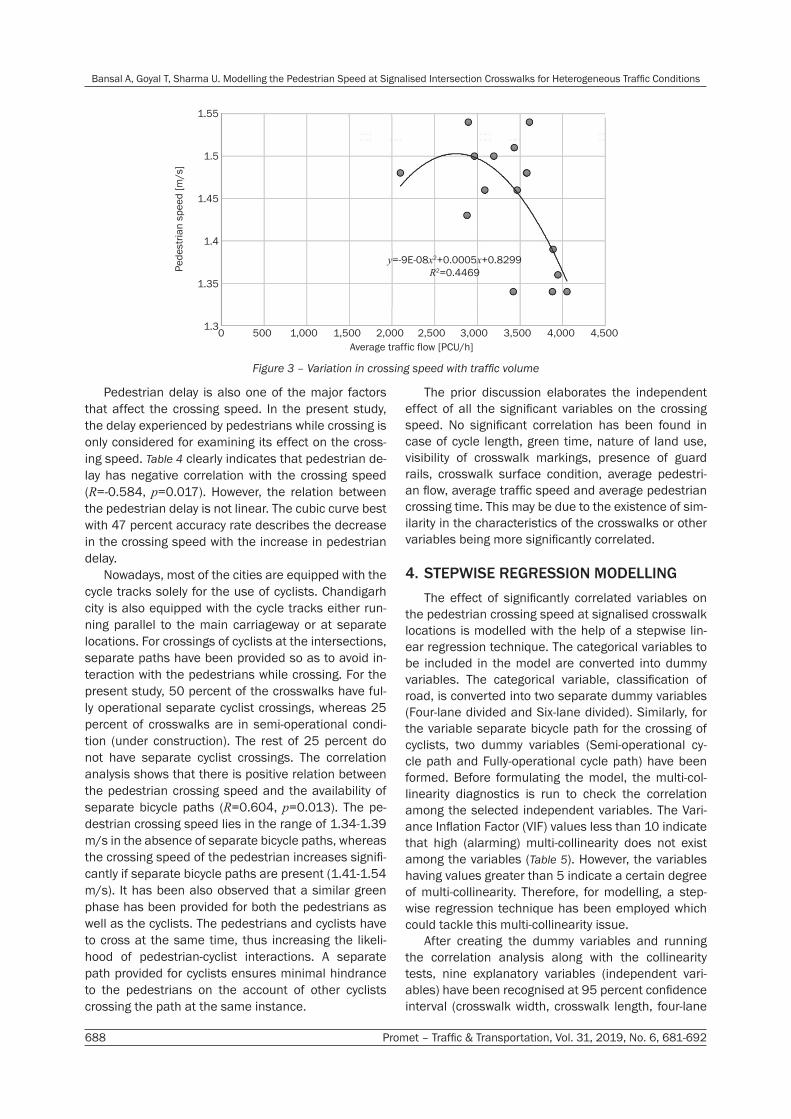
Figure 3 shows the effect of traffic flow on the cross-ing speed of the pedestrians. The traffic flow (bi-direc-tional) ranges between 2,099-4,071 PCU/hour with the average traffic speed of 42 km/h. Table 4 indicates that the traffic flow has negative correlation with the crossing speed (R=0.544, p=0.028). However, accord-ing to the best fitted curve with R-square value 0.4469 predicts that the crossing speed initially increases when the traffic flow is lower (<2,750 PCU/hour), and as it increases further, the corresponding crossing speed decreases. The dip in the crossing speed with increase in traffic volume is due to the increase in the number of pedestrian-vehicular interactions while crossing, thus increasing the overall pedestrian cross-ing time.
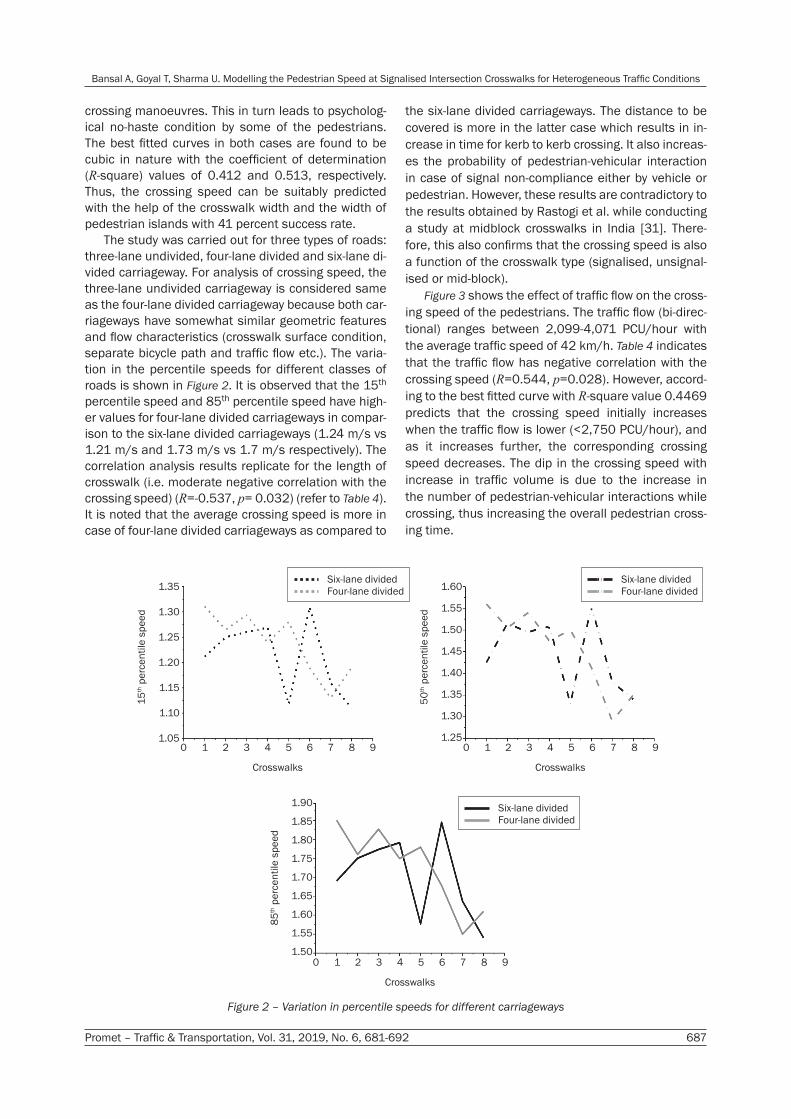
crossing manoeuvres. This in turn leads to psycholog-ical no-haste condition by some of the pedestrians. The best fitted curves in both cases are found to be cubic in nature with the coefficient of determination (R-square) values of 0.412 and 0.513, respectively. Thus, the crossing speed can be suitably predicted with the help of the crosswalk width and the width of pedestrian islands with 41 percent success rate.
The study was carried out for three types of roads: three-lane undivided, four-lane divided and six-lane di-vided carriageway. For analysis of crossing speed, the three-lane undivided carriageway is considered same as the four-lane divided carriageway because both car-riageways have somewhat similar geometric features and flow characteristics (crosswalk surface condition, separate bicycle path and traffic flow etc.). The varia-tion in the percentile speeds for different classes of roads is shown in Figure 2. It is observed that the 15th percentile speed and 85th percentile speed have high-er values for four-lane divided carriageways in compar-ison to the six-lane divided carriageways (1.24 m/s vs 1.21 m/s and 1.73 m/s vs 1.7 m/s respectively). The correlation analysis results replicate for the length of crosswalk (i.e. moderate negative correlation with the crossing speed) (R=-0.537, p= 0.032) (refer to Table 4). It is noted that the average crossing speed is more in case of four-lane divided carriageways as compared to
1.35
1.30
1.25
1.20
1.15
1.10
1.05
1.90
1.85
1.80
1.75
1.70
1.65
1.60
1.55
1.50
1.60
1.55
1.50
1.45
1.40
1.35
1.30
1.250 1 2 3 4 5 6 7 8 9
Crosswalks
0 1 2 3 4 5 6 7 8 9
Crosswalks
0 1 2 3 4 5 6 7 8 9
Crosswalks
50th p
erce
ntile
spe
ed
85th p
erce
ntile
spe
ed
15th p
erce
ntile
spe
ed
Six-lane dividedFour-lane divided
Six-lane dividedFour-lane divided
Six-lane dividedFour-lane divided
Figure 2 – Variation in percentile speeds for different carriageways
Bansal A, Goyal T, Sharma U. Modelling the Pedestrian Speed at Signalised Intersection Crosswalks for Heterogeneous Traffic Conditions
688 Promet – Traffic & Transportation, Vol. 31, 2019, No. 6, 681-692
The prior discussion elaborates the independent effect of all the significant variables on the crossing speed. No significant correlation has been found in case of cycle length, green time, nature of land use, visibility of crosswalk markings, presence of guard rails, crosswalk surface condition, average pedestri-an flow, average traffic speed and average pedestrian crossing time. This may be due to the existence of sim-ilarity in the characteristics of the crosswalks or other variables being more significantly correlated.
4. STEPWISE REGRESSION MODELLING The effect of significantly correlated variables on
the pedestrian crossing speed at signalised crosswalk locations is modelled with the help of a stepwise lin-ear regression technique. The categorical variables to be included in the model are converted into dummy variables. The categorical variable, classification of road, is converted into two separate dummy variables (Four-lane divided and Six-lane divided). Similarly, for the variable separate bicycle path for the crossing of cyclists, two dummy variables (Semi-operational cy-cle path and Fully-operational cycle path) have been formed. Before formulating the model, the multi-col-linearity diagnostics is run to check the correlation among the selected independent variables. The Vari-ance Inflation Factor (VIF) values less than 10 indicate that high (alarming) multi-collinearity does not exist among the variables (Table 5). However, the variables having values greater than 5 indicate a certain degree of multi-collinearity. Therefore, for modelling, a step-wise regression technique has been employed which could tackle this multi-collinearity issue.
After creating the dummy variables and running the correlation analysis along with the collinearity tests, nine explanatory variables (independent vari-ables) have been recognised at 95 percent confidence interval (crosswalk width, crosswalk length, four-lane
Pedestrian delay is also one of the major factors that affect the crossing speed. In the present study, the delay experienced by pedestrians while crossing is only considered for examining its effect on the cross-ing speed. Table 4 clearly indicates that pedestrian de-lay has negative correlation with the crossing speed (R=-0.584, p=0.017). However, the relation between the pedestrian delay is not linear. The cubic curve best with 47 percent accuracy rate describes the decrease in the crossing speed with the increase in pedestrian delay.
Nowadays, most of the cities are equipped with the cycle tracks solely for the use of cyclists. Chandigarh city is also equipped with the cycle tracks either run-ning parallel to the main carriageway or at separate locations. For crossings of cyclists at the intersections, separate paths have been provided so as to avoid in-teraction with the pedestrians while crossing. For the present study, 50 percent of the crosswalks have ful-ly operational separate cyclist crossings, whereas 25 percent of crosswalks are in semi-operational condi-tion (under construction). The rest of 25 percent do not have separate cyclist crossings. The correlation analysis shows that there is positive relation between the pedestrian crossing speed and the availability of separate bicycle paths (R=0.604, p=0.013). The pe-destrian crossing speed lies in the range of 1.34-1.39 m/s in the absence of separate bicycle paths, whereas the crossing speed of the pedestrian increases signifi-cantly if separate bicycle paths are present (1.41-1.54 m/s). It has been also observed that a similar green phase has been provided for both the pedestrians as well as the cyclists. The pedestrians and cyclists have to cross at the same time, thus increasing the likeli-hood of pedestrian-cyclist interactions. A separate path provided for cyclists ensures minimal hindrance to the pedestrians on the account of other cyclists crossing the path at the same instance.
Pede
stria
n sp
eed
[m/s
]
Average traffic flow [PCU/h]0 500 1,000 1,500 2,000 2,500 3,000 3,500 4,000 4,500
1.55
1.5
1.45
1.4
1.35
1.3
y=-9E-08x2+0.0005x+0.8299R2=0.4469
Figure 3 – Variation in crossing speed with traffic volume
Bansal A, Goyal T, Sharma U. Modelling the Pedestrian Speed at Signalised Intersection Crosswalks for Heterogeneous Traffic Conditions
Promet – Traffic & Transportation, Vol. 31, 2019, No. 6, 681-692 689
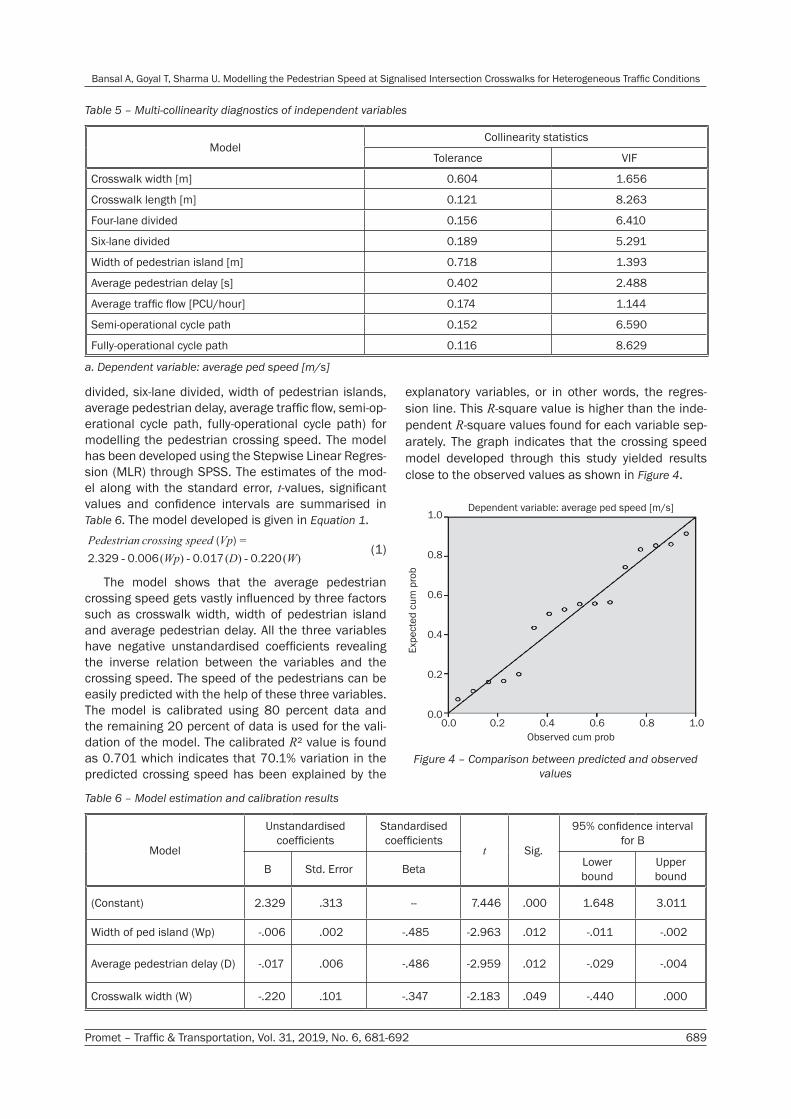
explanatory variables, or in other words, the regres-sion line. This R-square value is higher than the inde-pendent R-square values found for each variable sep-arately. The graph indicates that the crossing speed model developed through this study yielded results close to the observed values as shown in Figure 4.
divided, six-lane divided, width of pedestrian islands, average pedestrian delay, average traffic flow, semi-op-erational cycle path, fully-operational cycle path) for modelling the pedestrian crossing speed. The model has been developed using the Stepwise Linear Regres-sion (MLR) through SPSS. The estimates of the mod-el along with the standard error, t-values, significant values and confidence intervals are summarised in Table 6. The model developed is given in Equation 1.
. . ( ) . ( ) . ( )Pedestrian crossing speed Vp
Wp D W2 329 0 006 0 017 0 220( ) =
- - - (1)
The model shows that the average pedestrian crossing speed gets vastly influenced by three factors such as crosswalk width, width of pedestrian island and average pedestrian delay. All the three variables have negative unstandardised coefficients revealing the inverse relation between the variables and the crossing speed. The speed of the pedestrians can be easily predicted with the help of these three variables. The model is calibrated using 80 percent data and the remaining 20 percent of data is used for the vali-dation of the model. The calibrated R² value is found as 0.701 which indicates that 70.1% variation in the predicted crossing speed has been explained by the
Table 5 – Multi-collinearity diagnostics of independent variables
ModelCollinearity statistics
Tolerance VIF
Crosswalk width [m] 0.604 1.656
Crosswalk length [m] 0.121 8.263
Four-lane divided 0.156 6.410
Six-lane divided 0.189 5.291
Width of pedestrian island [m] 0.718 1.393
Average pedestrian delay [s] 0.402 2.488
Average traffic flow [PCU/hour] 0.174 1.144
Semi-operational cycle path 0.152 6.590
Fully-operational cycle path 0.116 8.629
a. Dependent variable: average ped speed [m/s]
Table 6 – Model estimation and calibration results
Model
Unstandardised coefficients
Standardised coefficients
t Sig.
95% confidence interval for B
B Std. Error Beta Lowerbound
Upper bound
(Constant) 2.329 .313 -- 7.446 .000 1.648 3.011
Width of ped island (Wp) -.006 .002 -.485 -2.963 .012 -.011 -.002
Average pedestrian delay (D) -.017 .006 -.486 -2.959 .012 -.029 -.004
Crosswalk width (W) -.220 .101 -.347 -2.183 .049 -.440 .000
Dependent variable: average ped speed [m/s]
Expe
cted
cum
pro
b
Observed cum prob
1.0
0.8
0.6
0.4
0.2
0.00.0 0.2 0.4 0.6 0.8 1.0
Figure 4 – Comparison between predicted and observed values
Bansal A, Goyal T, Sharma U. Modelling the Pedestrian Speed at Signalised Intersection Crosswalks for Heterogeneous Traffic Conditions
690 Promet – Traffic & Transportation, Vol. 31, 2019, No. 6, 681-692
Further, the pedestrian crossing speed was mod-elled using the stepwise regression technique. The model concluded that only three factors i.e. crosswalk width, width of pedestrian islands and average pedes-trian delay contribute a lot in predicting the crossing speed. The coefficient of determination (R-square) was found to be 0.701 indicating 70.1 percent accurate prediction rate.
6. CONCLUSION The present study concludes that the pedestrian
crossing speed at signalised intersections has tre-mendously increased over the past decade due to the improvement in infrastructure, thus demanding the need for revising the prescribed speed limits. Pedes-trian characteristics, Traffic factors, Geometric condi-tions and Operability characteristics exhibit significant effect on the crossing speed. Therefore, it has been suggested to incorporate all the factors while deciding on the pedestrian design crossing speed at signalised crosswalks. The model formulated in this paper should also be applicable to other countries of Southeast Asia where similar traffic conditions prevail.
REFERENCES
[1] Tiwari G, Bangdiwala S, Saraswat A, Gaurav, S. Sur-vival Analysis: Pedestrian Risk Exposure at Signalized Intersections. Transportation Research Part F: Traffic Psychology and Behaviour. 2007;10: 77-89. Available from: doi:10.1016/j.trf.2006.06.002
[2] Mohan D, Tiwari G, Bhalla K. Road Safety in India. Transportation Research and Injury Prevention Pro-gramme (TRIPP), New Delhi, India; 2015. Available from: https://www.worldcat.org/title/road-safety-in-in-dia-status-report/oclc/934705592
[3] Dewar RE. Driver and pedestrian characteristics. In: J. Pline, ed. Traffic engineering handbook. 4th Ed. Engle-wood Cliffs, New Jersey: Prentice Hall; 1992.
[4] Transportation Research Board. Highway capacity manual. National Research Council, Washington, D.C. Special Rep. No. 209, 2000. Available from: http://www.trb.org/Publications/Blurbs/153893.aspx
[5] FHWA. Manual on Uniform Traffic Control Devices (MUTCD). Washington, D.C.: Federal Highway Administra-tion; 1988. Available from: https://mutcd.fhwa.dot.gov/
[6] IRC (Indian Road Congress): 103. Guidelines for Pe-destrian Facilities. New Delhi, India; 1988.
[7] Holland C, Hill R. The effect of age, gender and driv-er status on pedestrians’ intentions to cross the road in risky situations. Accident Analysis & Prevention. 2007;39(2): 224-237. Available from: doi:10.1016/ j.aap.2006.07.003
[8] Guerrier JH, Jolibois JSC. The safety of elderly pedes-trians at five urban intersections in Miami. Proc., HFES 42nd Annual Meeting, Human Factors and Ergonomics Society, Santa Monica, CA; 1998. p. 35-42.
[9] Peters D, Kim L, Zaman R, Haas G, Cheng J, Ahmed S. Pedestrian Crossing Behavior at Signalized Intersec-tions in New York City. Transportation Research Record:
5. DISCUSSIONA comprehensive literature survey construed that
there are significant variations in pedestrian crossing speeds at different crosswalks between the develop-ing countries (India, Thailand, etc.) and the developed countries (USA, UK, etc.). It was also noted that over the course of time, the crossing speed of the pedestri-ans in the developing countries (especially the Indian cities) have increased tremendously and surpassed the design standard speed limits approved by different manuals. Therefore, the factors influencing the cross-ing speed were studied and the modelling was carried out to predict the crossing speed at signalised inter-sections for heterogeneous traffic conditions.
The present study was undertaken at the selected 16 signalised intersection crosswalks in Chandigarh city (India). The 15th percentile speed was found vary-ing between 1.11-1.31 m/s across different study lo-cations. The statistical tests i.e. F-tests exhibited no substantial difference in the percentile speeds for different genders but varied for different age groups and group sizes. The overall 15th percentile speeds found for different genders across the studied cross-walk locations (68 percent) were much higher than the prescribed standard value of 1.2 m/s. It was also ob-served that the crossing speed decreases with an in-crease in age and group size. The pedestrians exhibit-ing different crossing patterns also affect the crossing speed. One-stage crossing speed was higher as com-pared to the two-stage crossing. Moreover, the pedes-trians carrying baggage or using mobile phones had a significant effect on the crossing speed. The crossing time gets increased and the speed gets decreased if the pedestrian is carrying luggage. Based on other significant influencing factors (geometric, operational and flow characteristics) the correlation analysis found that the factors like crosswalk width, crosswalk length, width of pedestrian island, classification of road, av-erage traffic flow and average pedestrian delay had negative correlation with the crossing speed, whereas separate bicycle path for crossing positively correlated with the crossing speed. The 15th and 85th percentile speeds were found to have higher values for the four-lane divided carriageways in comparison to the six-lane divided carriageways (1.24 m/s vs. 1.21 m/s and 1.73 m/s vs. 1.7 m/s, respectively). Reducing the number of lanes resulted in fewer interferences to the pedes-trians, hence shorter crossing time and higher cross-ing speed. The crossing speed was found to increase till the traffic flow is less than <2,750 PCU/hour, but with further increase in the traffic flow, the crossing speed is reduced and showed a declining trend. The crosswalk locations with separate bicycle paths re-corded higher pedestrian crossing speed (1.41-1.54 m/s) than the locations with no separate bicycle path (1.34-1.39 m/s).
Bansal A, Goyal T, Sharma U. Modelling the Pedestrian Speed at Signalised Intersection Crosswalks for Heterogeneous Traffic Conditions
Promet – Traffic & Transportation, Vol. 31, 2019, No. 6, 681-692 691
Mixed Traffic Condition. Procedia - Social and Behav-ioral Sciences. 2016;104(1): 708-717. Available from: doi:10.1016/j.sbspro.2013.11.165
[24] Chandra S, Rastogi R, Das VR, Ilango T. Pedestrian behaviour under varied traffic and spatial conditions. European Transport. 2014;56(1): 52-64.
[25] Tanaboriboon Y, Guyano JA. Analysis of Pedestrian Movement in Bangkok. Transportation Research Record: Journal of Transportation Research Board. 1991;1294: 52-56.
[26] Tarawneh MS. Evaluation of pedestrian speed in Jor-dan with investigation of some contributing factors. Journal of Safety Research. 2001;32: 229–236. Avail-able from: doi:10.1016/S0022-4375(01)00046-9
[27] Subramanyam B, Prasanna Kumar R. Improving pe-destrian facilities in congested urban areas: a case study of Chennai city. IOP Conf. Series: Earth and En-vironmental Science. 2017; paper no. 80. Available from: doi:10.1088/1755-1315/80/1/012059
[28] DiPietro CM, King LE. Pedestrian gap-acceptance. Highway Research Record: Highway Research Board. 1970;308: 80-91.
[29] Hatfield J, Murphy S. The effects of mobile phone use on pedestrian crossing behaviour at signalized and un-signalized intersections. Accident Analysis & Preven-tion. 2007;39: 197-205. Available from: doi:10.1016/ j.aap.2006.07.001
[30] Goh PK, Lam WHK. Pedestrian Flows and Walking Speed: A Problem at Signalized Crosswalks. Institute of Transportation Engineers Journal. 2004;74(1): 28-33. Available from: http://worldcat.org/oclc/614107147
[31] Rastogi R, Chandra S, Vamsheedhar J, Das VR. Para-metric Study of Pedestrian Speeds at Midblock Cross-ings. Journal of Urban Planning & Development. 2011;137: 381-389. Available from: doi:10.1061/(ASCE)UP.1943-5444.0000083
[32] Mantecchini L, Paganelli F. Empirical Analysis of Pe-destrian Delay Models at Urban Intersections. Contem-porary Engineering Services. 2015;8(21): 981-990. Available from: doi:10.12988/ces.2015.57202
[33] Muleya D, Kharbechea M, Alhajyaseena W, Al-Salem M. Pedestrians’ Crossing Behavior at Marked Crosswalks on Channelized Right-Turn Lanes at Intersections. Pro-cedia Computer Science. 2017;109: 233-240. Avail-able from: doi:10.1016/j.procs.2017.05.339
[34] Boroujerdian A, Nemati S. Pedestrian Gap Acceptance Logit Model in Unsignalized Crosswalks Conflict Zone. International Journal of Transportation Engineering. 2016:4(2).
[35] Robertson HD, Hummer J, Nelson D. Manual of Traf-fic Engineering Studies. Washington, D.C.: Institute of Transportation Engineers; 1994.
[36] Transportation Research Board. Highway capacity manual. National Research Council, Washington, D.C. Special Rep. No. 209, 1994. Available from: http://www.trb.org/Publications/Blurbs/153893.aspx
[37] Li Q, Wang Z, Yang J, Wang J. Pedestrian Delay Esti-mation at Signalized Intersection in Developing Cities. Transportation Research Part A: Policy and Practice. 2005:39(1): 61-73. Available from: doi:10.1016/ j.tra.2004.11.002
[38] Behbahani H, Gilani VNM, Samet MJ, Salehfard R. Analysis of Crossing Speed of the Pedestrians in
Journal of Transportation Research Board. 2015;2519: 179-188. Available from: doi:10.3141/2519-20
[10] Xie SQ, Wong SC, Nga TM, Lam HK. Pedestrian Crossing Behavior at Signalized Crosswalks. Journal of Trans-portation Engineering Part A: Systems. 2017;143(8): 17-26. Available from: doi:10.1061/JTEPBS.0000055
[11] Lam WHK, Cheung, CY. Pedestrian speed/flow rela-tionships for walking facilities in Hong Kong. Jour-nal of Transportation Engineering Part A: Systems. 2000;126: 343-349. Available from: doi:10.1061/(ASCE)0733-947X(2000)126:4(343)
[12] Goh BH, Subramaniam K, Wai YT, Ali A. Pedestrian Crossing Speed: The Case of Malaysia. Internation-al Journal of Traffic and Transportation Engineer-ing. 2012;2: 323-332. Available from: doi:10.7708/ij_e.2012.2(4).03
[13] Griffiths JD, Hunt JG, Marlow M. Delays at Pedestrian Crossings: Site Observation and the Interpretation of Data. Traffic Engineering & Control. 1984;25: 365-371. Available from: http://worldcat.org/issn/00410683
[14] Sjostedt L. Behaviour of pedestrians at pedestrian crossings. Stockholm, Sweden: National Swedish Road Research Institute; 1967.
[15] Cresswell C, Griffiths JD, Hunt JG. Site evaluation of a pelican crossing simulation model. Traffic Engineering & Control. 1978;19: 546-549.
[16] Wilson DG, Grayson GB. Age–Related Differences in the Road Crossing Behavior of Adult Pedestrians. Transport Research Laboratory, TRB, NCHRP, Wash-ington, D.C. Report No. LR 933, 1980. Available from: https://trid.trb.org/view/168876
[17] Knoblauch RL, Pietrucha MT, Nitzburg M. Field Studies of Pedestrian Walking Speed and Start-Up Time. Trans-portation Research Record: Journal of Transportation Research Board. 1996;1538: 27-38. Available from: doi:10.3141/1538-04
[18] Fitzpatrick K, Brewer MA, Turner S. Another look at pedes-trian walking speed. Transportation Research Record: Journal of Transportation Research Board. 2006;1981: 21-29. Available from: doi:10.3141/1982-05
[19] Gates TJ, Noyce DA, Bill AR, Van ER. Recommend-ed walking speeds for pedestrian clearance timing based on pedestrian characteristics. Transporta-tion Research Record: Journal of Transportation Re-search Board. 2006;1982: 38-47. Available from: doi:10.1177/0361198106198200106
[20] Bowman BL, Vecellio RL. Pedestrian Walking Speeds and Conflicts at Urban Median Locations. Transpor-tation Research Record: Journal of Transportation Research Board. 1994;1438: 67-76. Available from: http://worldcat.org/isbn/0309055199
[21] Daamen W, Hoogendorn, SP. Pedestrian free speed behaviour in crossing flows. Traffic and Granular Flow. 2007;05: 299-304. Available from: https://link.spring-er.com/chapter/10.1007/978-3-540-47641-2_25
[22] Asaithambi G, Kuttan MO, Chandra S. Pedestrian Road Crossing Behavior Under Mixed Traffic Conditions: A Comparative Study of an Intersection Before and Af-ter Implementing Control Measures. Transportation in Developing Economies. 2016;2. Available from: doi:10.1007/s40890-016-0018-5
[23] Marisamynathan S, Vedagiri P. Modeling Pedestrian Delay at Signalized Intersection Crosswalks under
Bansal A, Goyal T, Sharma U. Modelling the Pedestrian Speed at Signalised Intersection Crosswalks for Heterogeneous Traffic Conditions
692 Promet – Traffic & Transportation, Vol. 31, 2019, No. 6, 681-692
news/chandigarh/community/pedestrian-deaths-ring-alarm-bells/346580.html
[40] FHWA. Manual on Uniform Traffic Control Devices for Streets and Highways. Washington, D.C.: Federal High-way Administration; 2003. Available from: https://mutcd.fhwa.dot.gov/
Marked and Unmarked Crosswalks in the Signalized and Un-Signalized Intersections (Case Study: Rasht city). IOP Conf. Series: Materials Science and Engi-neering. 2017; paper no. 245.
[39] The Tribune. Pedestrian Deaths Ring Alarm Bells; 2017. Available from: https://www.tribuneindia.com/