Modelling short-distance residential moves using the Northern Ireland Longitudinal Study (NILS) Ian...
21
Modelling short-distance residential moves using the Northern Ireland Longitudinal Study (NILS) Ian Shuttleworth (QUB), Myles Gould (UoL) & Paul Barr (QUB)
-
Upload
daniela-hart -
Category
Documents
-
view
215 -
download
0
Transcript of Modelling short-distance residential moves using the Northern Ireland Longitudinal Study (NILS) Ian...
Modelling short-distanceresidential moves using the
Northern Ireland LongitudinalStudy (NILS)
Ian Shuttleworth (QUB),Myles Gould (UoL) & Paul Barr (QUB)

Outline• The project
– Scope and rationale• Research questions• The data
– Northern Ireland Longitudinal Study (NILS)• Analytical strategy (ML models)• Model Results
– answers to 3 questions about residential moves through sectarian space
• Conclusion

The Project & Research Questions
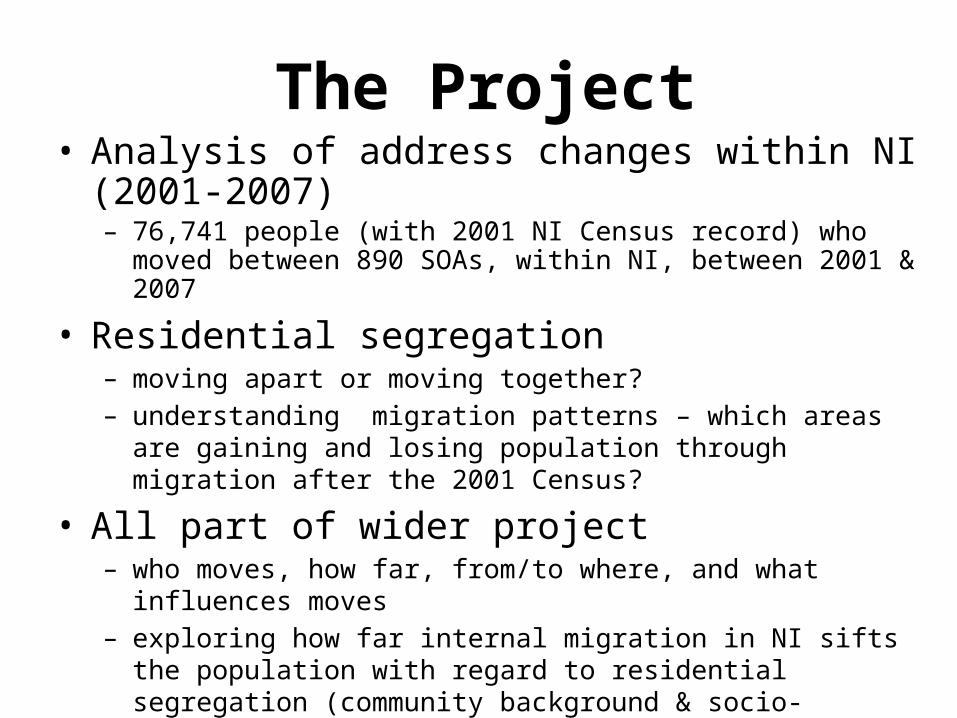
• Analysis of address changes within NI (2001-2007)– 76,741 people (with 2001 NI Census record) who moved between 890
SOAs, within NI, between 2001 & 2007
• Residential segregation– moving apart or moving together?– understanding migration patterns – which areas are gaining and losing
population through migration after the 2001 Census?
• All part of wider project– who moves, how far, from/to where, and what influences moves– exploring how far internal migration in NI sifts the population with
regard to residential segregation (community background & socio-economic deprivation)
• Today’s focus: residential moves through sectarian space (with particular focus community background)
The Project
Research Questions
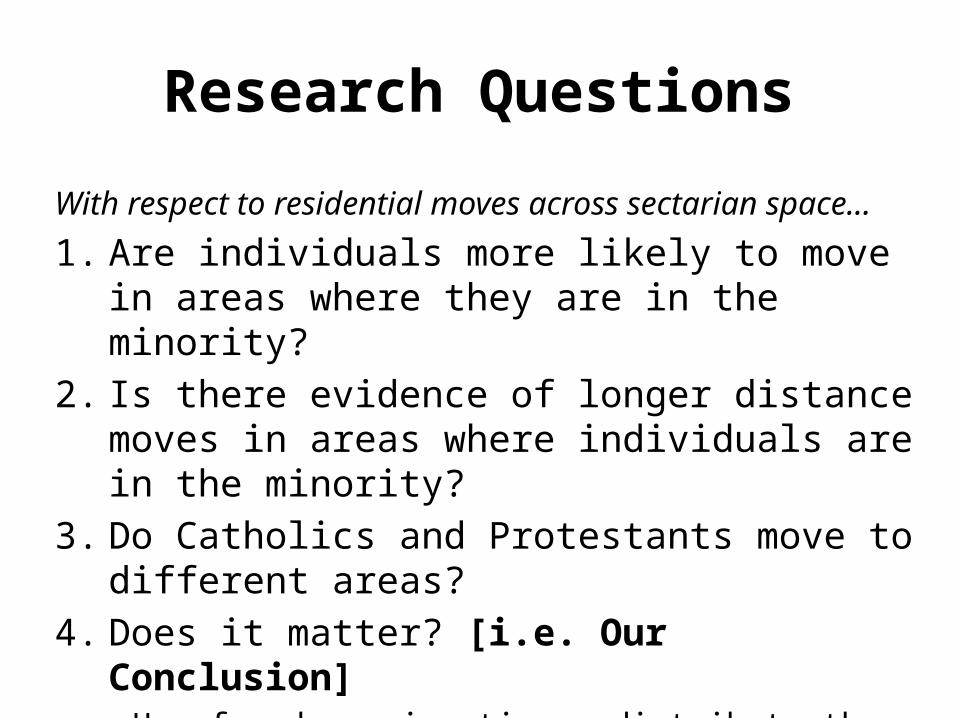
With respect to residential moves across sectarian space...
1. Are individuals more likely to move in areas where they are in the minority?
2. Is there evidence of longer distance moves in areas where individuals are in the minority?
3. Do Catholics and Protestants move to different areas?
4. Does it matter? [i.e. Our Conclusion]– How far does migration redistribute the population and
does it lead to greater residential segregation?

The Data & Analytical Strategy
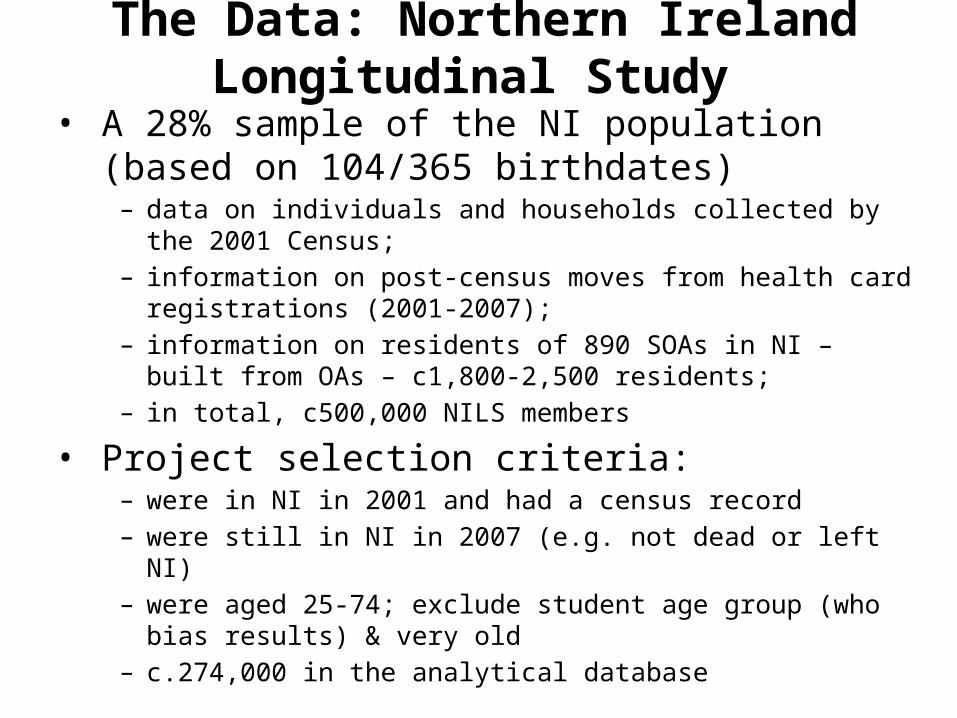
• A 28% sample of the NI population (based on 104/365 birthdates)
– data on individuals and households collected by the 2001 Census; – information on post-census moves from health card registrations
(2001-2007); – information on residents of 890 SOAs in NI – built from OAs – c1,800-
2,500 residents; – in total, c500,000 NILS members
• Project selection criteria:– were in NI in 2001 and had a census record– were still in NI in 2007 (e.g. not dead or left NI)– were aged 25-74; exclude student age group (who bias results) & very
old– c.274,000 in the analytical database
The Data: Northern Ireland Longitudinal Study
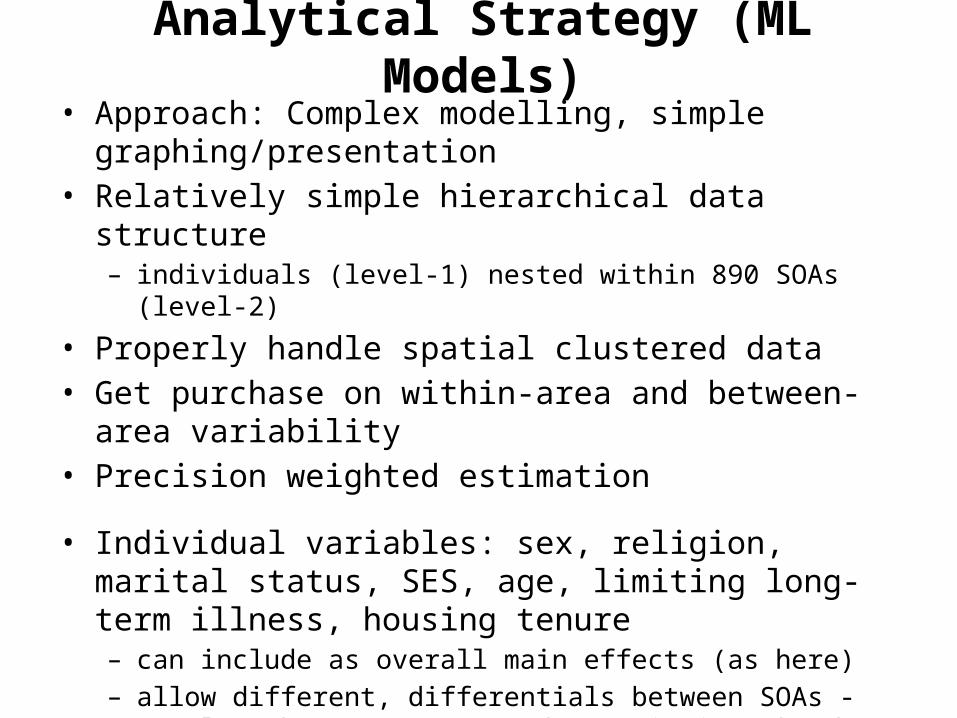
Analytical Strategy (ML Models)• Approach: Complex modelling, simple graphing/presentation• Relatively simple hierarchical data structure
– individuals (level-1) nested within 890 SOAs (level-2)
• Properly handle spatial clustered data• Get purchase on within-area and between-area variability• Precision weighted estimation
• Individual variables: sex, religion, marital status, SES, age, limiting long-term illness, housing tenure– can include as overall main effects (as here)– allow different, differentials between SOAs - complex between-area
random variation (done but not presented here today)
• Ecological level-2 variables: %Catholic, deprivation score• Can also model cross-level interaction between individual &
ecological variables (presenting today)
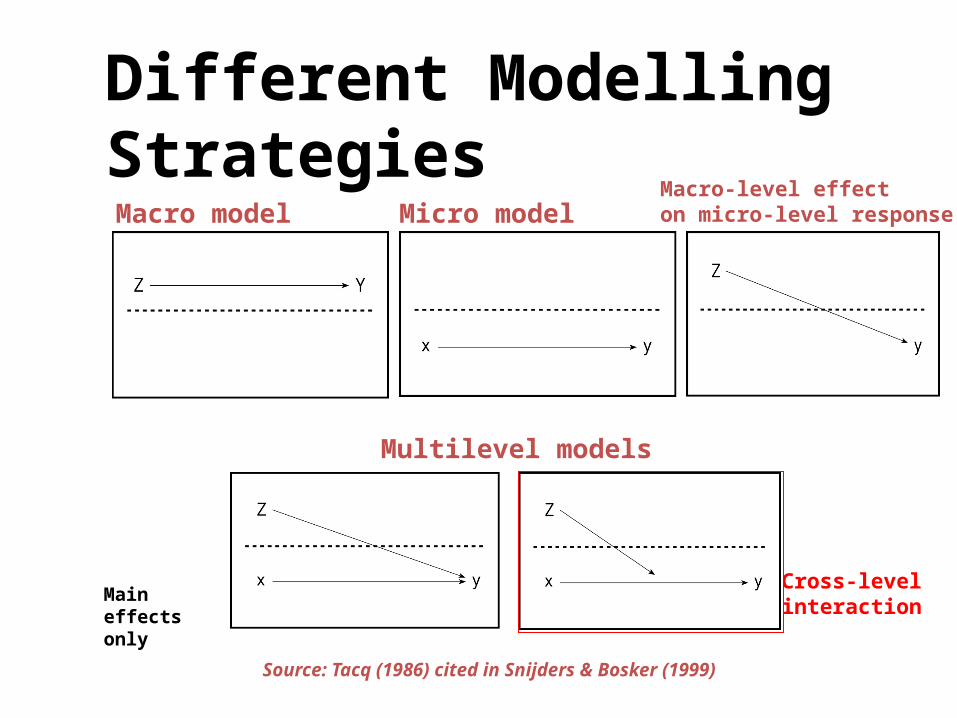
Different Modelling Strategies
Source: Tacq (1986) cited in Snijders & Bosker (1999)
Multilevel models
Macro model Micro model
Cross-level interaction
Macro-level effect on micro-level response
Main effectsonly

Results
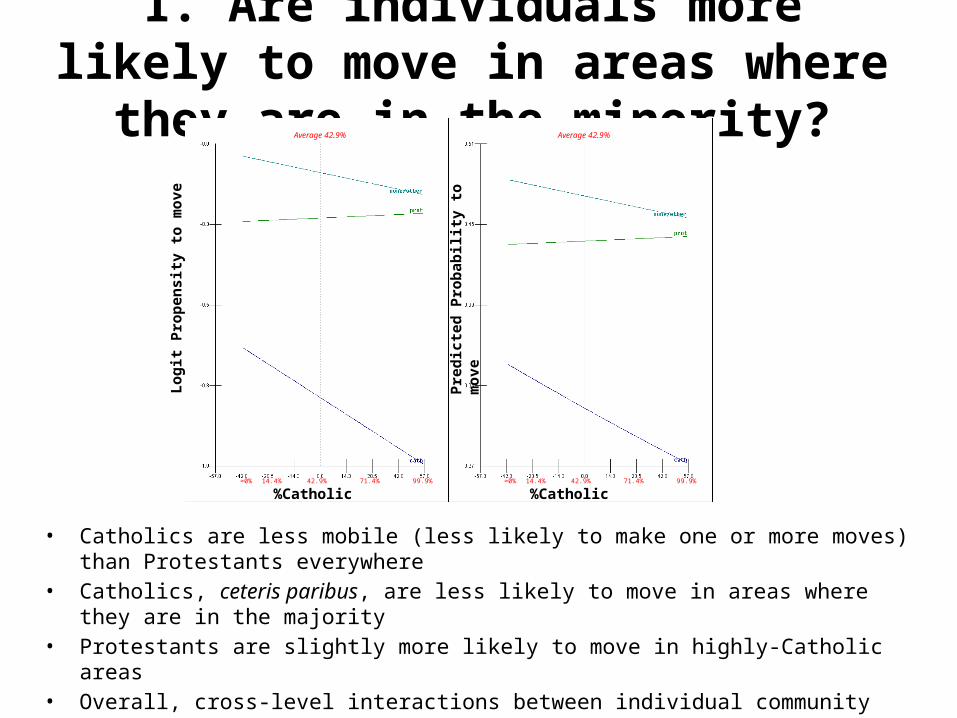
1. Are individuals more likely to move in areas where they are in the minority?
• Catholics are less mobile (less likely to make one or more moves) than Protestants everywhere
• Catholics, ceteris paribus, are less likely to move in areas where they are in the majority• Protestants are slightly more likely to move in highly-Catholic areas• Overall, cross-level interactions between individual community background and
ecological religion are small but highly statistically significant
Lo
git
Pro
pen
sity
to
mo
ve
Pre
dic
ted
Rat
io %
Cat
h O
rig
in/D
esti
nat
ion
%Catholic %Catholic
Pre
dic
ted
Pro
bab
ilit
y to
mo
ve
Average 42.9%
42.9%≈0% 99.9%
Average 42.9%
42.9%≈0% 99.9%71.4%14.4% 14.4% 71.4%
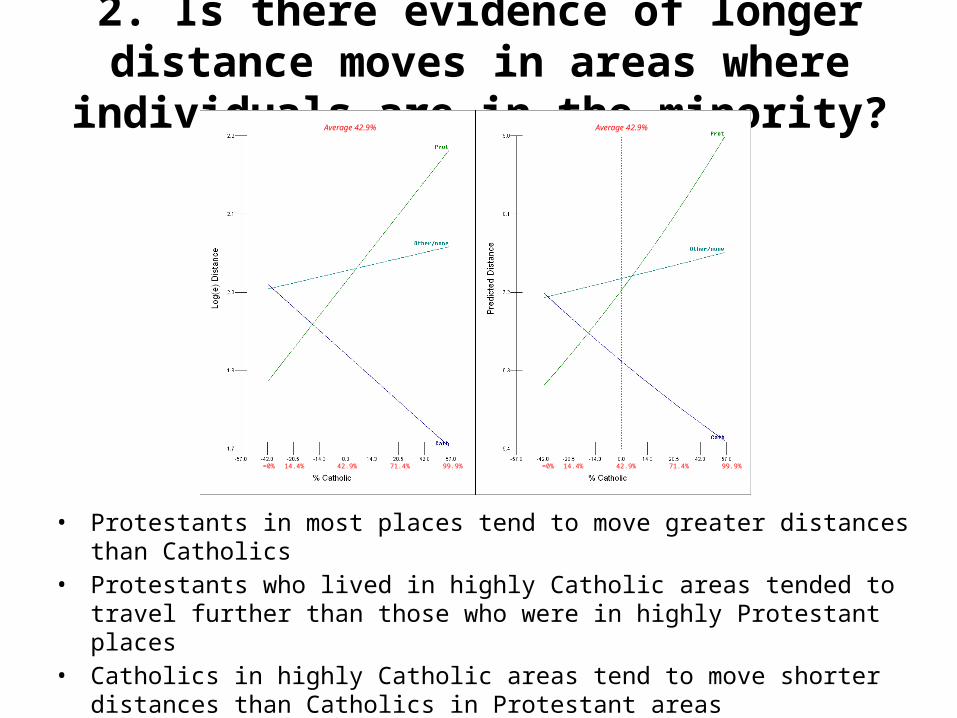
2. Is there evidence of longer distance moves in areas where individuals are in the minority?
• Protestants in most places tend to move greater distances than Catholics• Protestants who lived in highly Catholic areas tended to travel further than those
who were in highly Protestant places• Catholics in highly Catholic areas tend to move shorter distances than Catholics in
Protestant areas• Cross-level interactions are large and statistically significant
Average 42.9% Average 42.9%
42.9%≈0% 99.9%71.4%14.4% 42.9%≈0% 99.9%71.4%14.4%
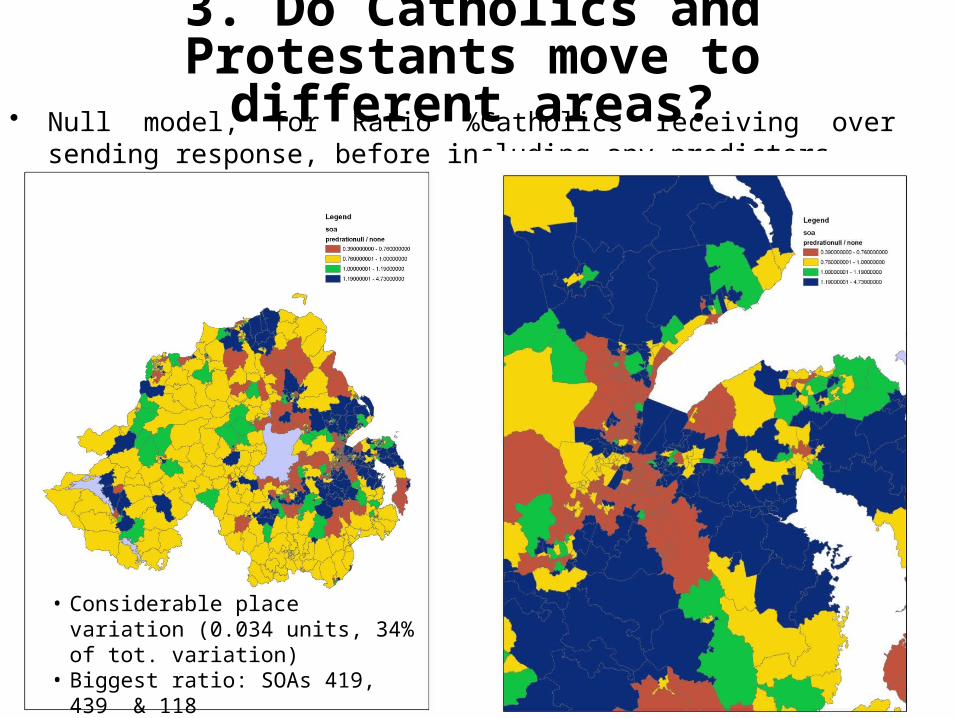
• Null model, for Ratio %Catholics receiving over sending response, before including any predictors
3. Do Catholics and Protestants move to different areas?
• Considerable place variation (0.034 units, 34% of tot. variation)
• Biggest ratio: SOAs 419, 439 & 118• Smallest ratio SOAs: 201, 822, & 782
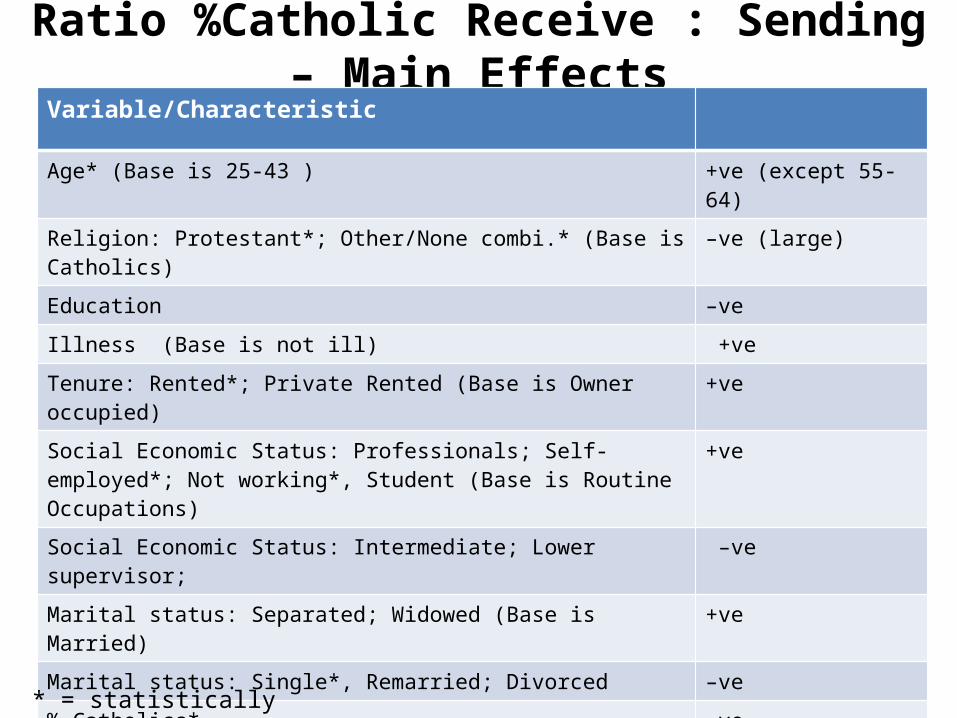
Ratio %Catholic Receive : Sending – Main EffectsVariable/Characteristic
Age* (Base is 25-43 ) +ve (except 55-64)
Religion: Protestant*; Other/None combi.* (Base is Catholics) –ve (large)
Education –ve
Illness (Base is not ill) +ve
Tenure: Rented*; Private Rented (Base is Owner occupied) +ve
Social Economic Status: Professionals; Self-employed*; Not working*, Student (Base is Routine Occupations)
+ve
Social Economic Status: Intermediate; Lower supervisor; –ve
Marital status: Separated; Widowed (Base is Married) +ve
Marital status: Single*, Remarried; Divorced –ve
% Catholics* -ve
Long distance move* (Base is short move) +ve
Log MDM* (social deprivation) +ve (v. large)
Log Density* -ve
* = statistically significant
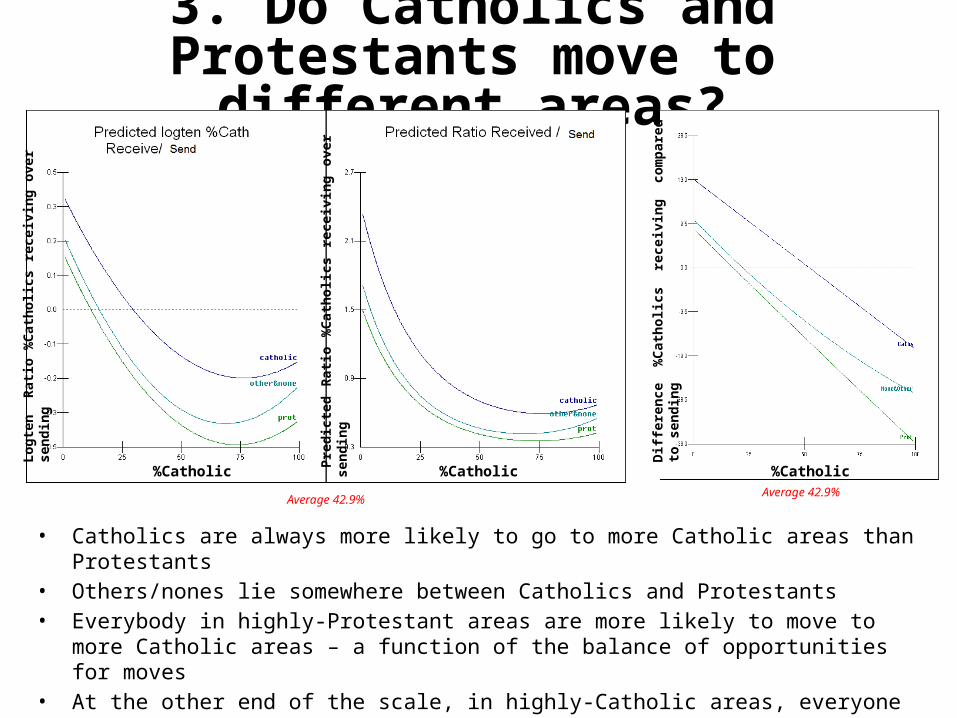
3. Do Catholics and Protestants move to different areas?
• Catholics are always more likely to go to more Catholic areas than Protestants• Others/nones lie somewhere between Catholics and Protestants• Everybody in highly-Protestant areas are more likely to move to more Catholic areas – a function of
the balance of opportunities for moves• At the other end of the scale, in highly-Catholic areas, everyone moves to more Protestant (e.g. less
Catholic) areas but Protestants are more likely to move to less Catholic areas than Protestants
Lo
gte
n R
atio
%C
ath
olic
s re
ceiv
ing
ove
r se
nd
ing
Pre
dic
ted
Rat
io %
Cat
ho
lics
rece
ivin
g o
ver
sen
din
g
%Catholic
Lo
gte
n R
atio
%C
ath
olic
s re
ceiv
ing
ove
r se
nd
ing
Pre
dic
ted
Rat
io %
Cat
ho
lics
rece
ivin
g o
ver
sen
din
g
%Catholic %Catholic
Dif
fere
nce
%C
ath
olic
s re
ceiv
ing
co
mp
ared
to
sen
din
g
%CatholicAverage 42.9%
Average 42.9%
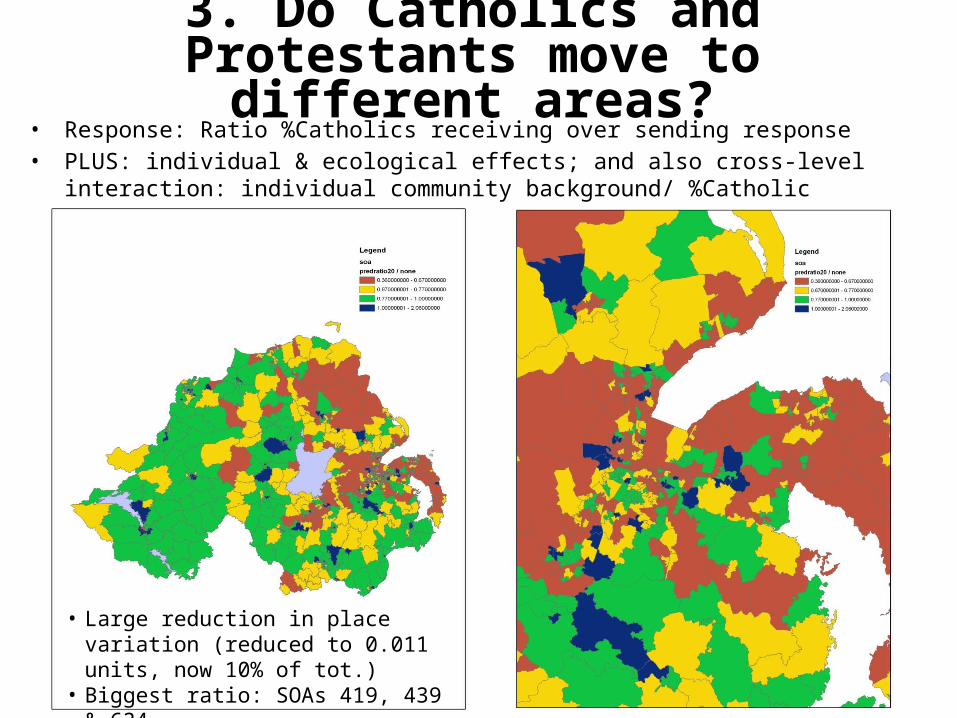
• Response: Ratio %Catholics receiving over sending response• PLUS: individual & ecological effects; and also cross-level interaction: individual
community background/ %Catholic
3. Do Catholics and Protestants move to different areas?
• Large reduction in place variation (reduced to 0.011 units, now 10% of tot.)
• Biggest ratio: SOAs 419, 439 & 634• Smallest ratio SOAs: 235, 110, & 61
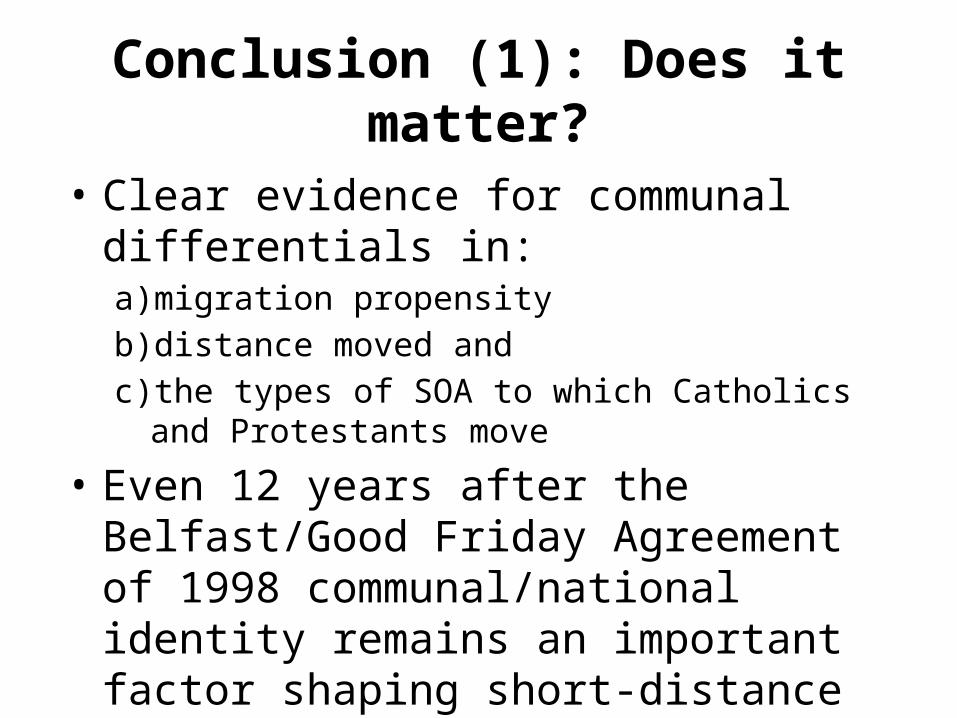
Conclusion (1): Does it matter?
• Clear evidence for communal differentials in:a) migration propensityb) distance moved andc) the types of SOA to which Catholics and Protestants
move
• Even 12 years after the Belfast/Good Friday Agreement of 1998 communal/national identity remains an important factor shaping short-distance migratory moves in NI
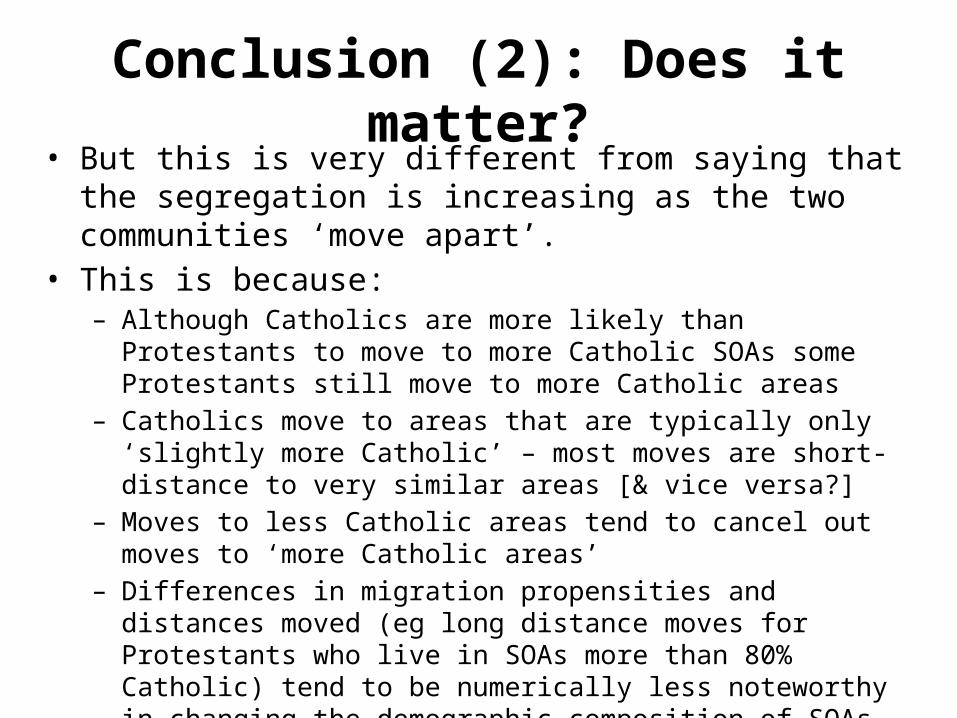
Conclusion (2): Does it matter?• But this is very different from saying that the segregation is
increasing as the two communities ‘move apart’. • This is because:
– Although Catholics are more likely than Protestants to move to more Catholic SOAs some Protestants still move to more Catholic areas
– Catholics move to areas that are typically only ‘slightly more Catholic’ – most moves are short-distance to very similar areas [& vice versa?]
– Moves to less Catholic areas tend to cancel out moves to ‘more Catholic areas’
– Differences in migration propensities and distances moved (eg long distance moves for Protestants who live in SOAs more than 80% Catholic) tend to be numerically less noteworthy in changing the demographic composition of SOAs because of the relatively small numbers living at the ends of the distribution (eg Catholics living in Protestant areas and vice versa)
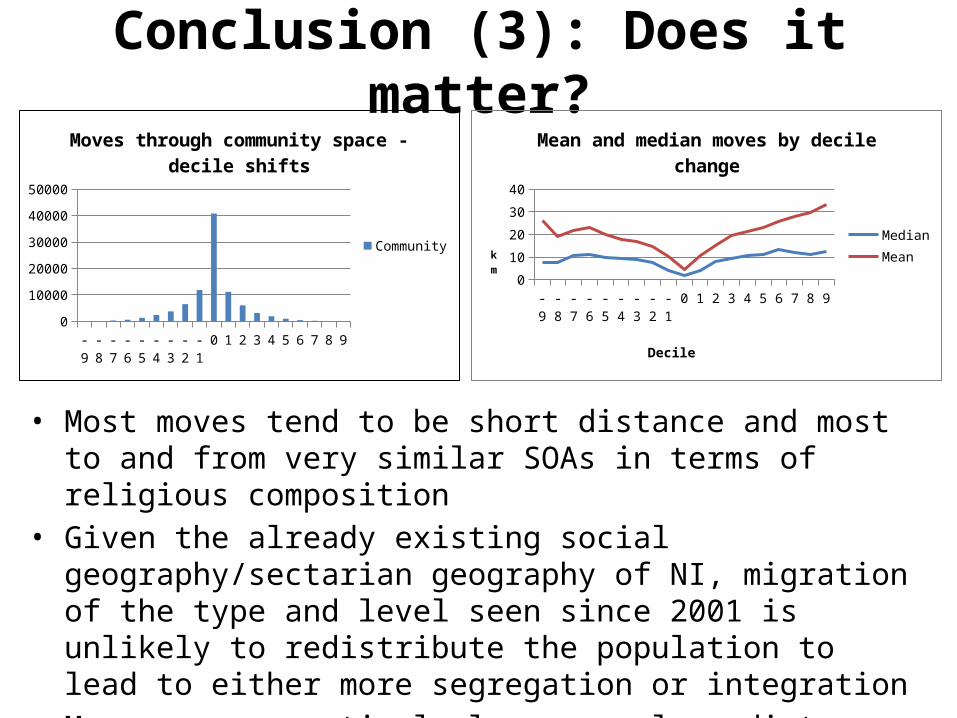
Conclusion (3): Does it matter?
• Most moves tend to be short distance and most to and from very similar SOAs in terms of religious composition
• Given the already existing social geography/sectarian geography of NI, migration of the type and level seen since 2001 is unlikely to redistribute the population to lead to either more segregation or integration
• More moves, particularly over a long distance, are needed to lead to either of these two outcomes
-9 -8 -7 -6 -5 -4 -3 -2 -1 0 1 2 3 4 5 6 7 8 905
10152025303540
Mean and median moves by decile change
MedianMean
Decile
km
-9 -8 -7 -6 -5 -4 -3 -2 -1 0 1 2 3 4 5 6 7 8 90
50001000015000200002500030000350004000045000
Moves through community space - decile shifts
Community
Conclusion
• With regard to community background, migration 2001-2007 did not redistribute the population fundamentally
• This suggests that ‘normal’ migration will on its not desegregate the NI population
• The other implication is that to increase/decrease segregation more individuals need to move and to move further
• Was the population system much more dynamic 1971-1991 when biggest increases in residential segregation seen?
The help provided by the staff of the Northern Ireland Longitudinal Study (NILS) and NILS Research Support Unit is acknowledged. NILS is funded by the HSC R&D function of the Public Health Agency. The NILS-RSU is funded by the ESRC and the Northern Ireland Government. The authors alone are responsible for the interpretation of the data.
Acknowledgements