Modeling of Urban Expansion of Greater Hyderabad Metropolitan Region in India – Scenarios for 2030

Modeling sanitation scenarios in developing countries. A case study in Kumasi, Ghana
Kristina Dahlman
Arbetsgruppen för Tropisk Ekologi Minor Field Study 141 Committee of Tropical Ecology ISSN 1653-5634 Uppsala University, Sweden
September 2009 Uppsala

Modeling sanitation scenarios in developing countries. A case study in Kumasi, Ghana
Kristina Dahlman
Master thesis in Aquatic and Environmental Engineering Department of Energy and Technology Swedish University of Agricultural Sciences Supervisors: Cecilia Sundberg and Elias Aklaku


I
ABSTRACT
Modeling sanitation scenarios in developing countries. A case study in Kumasi, Ghana Kristina Dahlman
2.6 billion people in the world lack access to satisfying sanitation. In addition to the indignity and uncleanliness in their situation, untreated excrements pollute ground and surface waters, with both health and environmental hazards as consequences. The extreme urbanization rate in many developing countries have worsened the situation and complicated the implementation of sustainable solutions. At the same time, the soils in sub-Saharan Africa are generally poor and the use of fertilizers much lower than on all other continents. The recent trend of heavily increasing food prices has made the urgent matter of securing food-supply even more pressing. Hence, sanitation systems that secure health and environment condition, and that also enable reuse of the nutrients in human excrements as fertilizers have the potential of being beneficial for many reasons. Three scenarios for systems handling liquid household waste (urine, faeces and greywater) in Kumasi were defined: the Urine diversion, the Biogas, and the
Waterborne scenario. A model based on material flow analysis (MFA) and life cycle assessment (LCA) was constructed to evaluate the environmental performance of the scenarios. The main model variables were nitrogen, phosphorus and organic carbon, and the evaluation focused on eutrophication and potential reuse of nutrients in urban and peri-urban agriculture. The results showed that a local nutrient reuse approach did not appear applicable to dense, urban areas, since the production of fertilizers was much larger than the need. It seemed however, to be a feasible option in more spatial areas, where farms and back yard cultivation are more common. The future city development was concluded to be an important factor in the choice of sanitation system. Continued practice of urban and peri-urban agriculture give reason for at least partly local-reuse-oriented systems, while decrease of agriculture within the city area may speak in favor of more centralized solutions. The existing use of cheap poultry manure from farms in the peri-urban area may weaken the arguments for reuse-oriented local sanitation systems in Kumasi. The waterborne and the biogas scenarios made reuse of treated wastewater possible (e.g. for irrigation). Eutrophying effect depended highly on the amount of water that was assumed to be reused: Full reuse made the waterborne scenario the least eutrophying and the urine diversion the most, whereas no reuse resulted in the lowest eutrophying effect for the urine diversion scenario and the highest for the biogas scenario. The waterborne scenario was associated with much higher water consumption than the other two scenarios, a problem in a city with already deficient water providing systems. It required less truck transports than the other scenarios, but its construction and operation are likely much more energy demanding. Keywords: Ghana, ecological sanitation, MFA, urine diversion, biogas, waste stabilization ponds
Department of Energy and Technology, Swedish University of Agricultural Sciences, Box 7032, SE-750 07
Uppsala, Sweden

II
REFERAT
Modellering av scenarier för avloppshanteringssystem i utvecklingsländer. En fallstudie i Kumasi, Ghana. Kristina Dahlman
Idag saknar 2,6 miljarder människor i världen tillgång till grundläggande sanitet. Förutom konsekvenser för den personliga hygienen bidrar obehandlat urin och fekalier till smittspridning och förorening av yt- och grundvatten. Många städer i syd växer idag med extremt hög hastighet, vilket förvärrar situationen ytterligare i länder där både finanser och institutioner för infrastrukturutbyggnad ofta är bristfälliga. Generellt sett tillförs avsevärt mycket mindre näringsämnen jordarna i Afrika söder om Sahara än i resten av världen. Med stigande spannmålspriser har tillgången på mat blivit ett allt mer pressande problem, och vikten av inhemsk matproduktion har ökat. Avloppshanteringssystem som möjliggör återföring av näringsämnen i urin och fekalier till åkermark kan tänkas vara fördelaktiga ur detta perspektiv. Tre scenarier för avloppshanteringssystem i Kumasi, Ghana definierades: det urinsorterande, det vattenburna, och biogasscenariot. För att utvärdera scenariernas miljömässiga prestanda konstruerades en modell byggd på materialflödesanalys (MFA) och livscykelanalys (LCA). Huvudvariablerna var fosfor, kväve och organiskt kol, och utvärderingen fokuserade på övergödningseffekt och potential för återförande av näringsämnen till jordbruksmark. Enligt resultaten visade sig system för lokal återvinning av näringsämnen mindre lämpliga i stadens centrala, tätbevuxna delar, eftersom den genererade mängden näringsämnen här var mycket större än behovet. Däremot verkade de ha potential i stadens glesare områden där jordbruk och trädgårdsodlingar är mer förekommande. Utveckling mot mer/mindre stads- och stadsnära jordbruk samt befintlig tillgång på alternativa gödselmedel ansågs vara viktiga faktorer att ta hänsyn till vid val av avloppshanteringssystem. Övergödningseffekten var till hög grad beroende av hur mycket av det renade vattnet som återanvändes för bevattning respektive släpptes ut i ytvatten i de olika systemen. Det vattenburna scenariot var förknippat med hög vattenanvändning, vilket talar till dess nackdel i en stad där det redan idag råder problem med vattenförsörjningen. Detta scenario var också det som krävde minst transporter, men det diskuterades att uppförande och drift förmodligen var mycket mer energikrävande än för de andra två scenarierna.
Nyckelord: Ghana, ecological sanitation, MFA, urinsortering, biogas, waste stabilization ponds
Institutionen för energi och teknik, Sveriges lantbruksuniversitet, box 7032, 750 07 Uppsala.

III
PREFACE
This Master Thesis has been performed within the Environmental and Aquatic Engineering program at Uppsala University, Sweden. It is part of a larger project: “Assessing sustainability of sanitation options - Case study in Kumasi, Ghana”, initiated by Dr Cecilia Sundberg at the Swedish University of Agricultural Sciences, Department of Energy and Technology. Sundberg’s project is funded by Formas and Sida/SAREC. Funding for this thesis was obtained from Sida through the scholarship Minor Field
Study, administered by the Committee of Tropical Ecology at Uppsala University.
The work has been supervised by Dr Cecilia Sundberg, whose commitment and knowledge have been essential throughout the whole project. I would like to thank her for all her help, and for being a great source of inspiration. Dr Elias Aklaku at Kwame Nkrumah University of Science and Technology (KNUST) supervised the work in Ghana, Alfredo de Toro at the Department of Energy and Technology, Swedish University of Agricultural Sciences was the subject reviewer, and Allan Rodhe, at the Department of Earth Sciences, Uppsala University was the examiner.
I would like to thank all the hospitable and friendly people I had the privilege to meet during my stay in Ghana. The IWMI-staff in Kumasi: Ben, Richard, Lesley, Maxwell and Augustin, for helping me with as well study related as practical matters, and for offering me place at their office. Joseph, Emmanuel, Frederick and Edwin for their collaboration and friendship. I would also like to thank all friends made in Kumasi and Tamale for just being great friends, and for opening their homes, sharing their habits, and offering interesting conversations. Shak, Eugene, George, Harriet, Michael, and in particular, Kasim Insuah for his great friendship and help during the project.
Lastly, I would like to thank my dear friend and travel partner Emma Wikner, for support and discussions through all possible and impossible working situations and hours. I could never imagine better company.
Copyright © Kristina Dahlman and the Department of Energy and Technology, Swedish University of Agricultural Science UPTEC W 09 018, ISSN 1401-5765 Printed at the Department of Earth Sciences, Geotryckeriet, Uppsala University, Uppsala, 2009

IV
POPULÄRVETENSKAPLIG SAMMANFATTNING
Modellering av scenarier för avloppshanteringssystem i utvecklingsländer. En fallstudie i Kumasi, Ghana. Kristina Dahlman
Bristfälliga avloppslösningar är idag ett stort hälso- och miljöproblem i många utvecklingsländer. Fekalier och urin som inte tas om hand riskerar att hamna i vattendrag och grundvatten, och när detta vatten sedan används för t ex bevattning, tvätt/disk eller som dricksvatten sprids bakterier, virus och inälvsmaskar med ursprung framför allt i fekalier. Kolera och andra diarrésjukdomar är de vanligaste problemen, och de som drabbas hårdast är barn: Varje år dör c:a 1,5 miljoner barn av diarré. Sammanlagt uppskattas 5 miljoner människor dö av förorenat vatten varje år. I många utvecklingsländer sker idag en mycket stor inflyttning från landsbygd till stad, och denna utveckling har skett/sker i ett tempo som gör det svårt för många städer att svara med den infrastrukturutbyggnad som krävs för att tillgodose behovet av rent vatten, avloppshantering, elektricitet etc. Kumasi är Ghanas näst största stad efter huvudstaden Accra. Här bor ungefär 1,9 miljoner människor, och tillväxthastigheten är hög: c:a 5,5 % / år (jämför med Stockholmsregionen som 2008 växte med 0,7 %). Många människor saknar tillgång till egen toalett, och merparten av de offentliga toaletter som finns är i dåligt skick. Utsläpp av orenat avlopp till stadens floder har resulterat i ett mycket förorenat vatten som bl a används för bevattning. Jordbruk förekommer såväl inne i staden som i dess utkanter: Hela 66 % av matbehovet tillgodoses av stadsnära jordbruk, och motsvarande 11 % och 4 % av stads- respektive trädgårdsodling. Bevattning med förorenat vatten på denna jordbruksmark är en stor hälsorisk för alla som äter av de grödor som odlats här. Urin och fekalier innehåller höga halter av bl a kväve och fosfor, två näringsämnen som är mycket viktiga för växter, och som tillsammans med kalium är de huvudsakliga beståndsdelarna i konstgödsel. Hamnar kväve och fosfor från toalettavfall på åkern kan de således vara till stor nytta, medan de i vattendrag bidrar till övergödning. ”Ekologisk sanitet” är ett begrepp som beskriver avloppshanteringssystem som inte bara tar hand om och renar avlopp, utan som också möjliggör återförande av näringsämnen till jordbruksmark. Syftet med examensarbetet var att konstruera en modell, samt att med hjälp av denna jämföra tre olika scenarier för avloppshanteringssystem i Kumasi. Två scenarier baserade på ekologisk sanitet med ingen/låg vattenåtgång valdes: urinseparering och biogas. Det tredje systemet var vattenburet, med vattentoaletter och avloppssystem. Jämförelsen fokuserade på övergödningseffekt hos de olika scenarierna, samt möjlighet till återanvändning av näringsämnen på jordbruksmark. Den konstruerade modellen baserades på metodik från material- och livscykelanalys (MFA och LCA). Materialflödesanalys är en metod för att följa olika ämnens väg genom ett system, medan livscykelanalys används för att utvärdera utsläppta ämnens miljöpåverkan. Enligt resultaten genererade det urinsorterande scenariot och biogasscenariot ett överflöd av näringsämnen i de centrala, tätbevuxna områdena av Kumasi, vilket medförde att stora mängder material skulle behövas transporteras ut ur staden. I de glesare bostadsområdena däremot, var genereringen av näringsämnen lägre än behovet.

V
Nyttan av system som möjliggör lokal återvinning av näringsämnen beror på hur mycket jordbruksmark som finns i staden och dess närhet. Hur staden kommer att växa framöver är alltså en viktig faktor att beakta vid val av system. Övergödningseffekten hos scenarierna berodde till stor del på hur systemen användes. Det vattenburna scenariot och biogasscenariot möjliggjorde återanvändning av renat vatten, t ex för bevattning, och mängden vatten som tillvaratogs visade sig ha stor påverkan på övergödningseffekten. I fallet där allt vatten antogs släppas ut till vattendrag var biogasscenariot det mest övergödande, och det urinseparerande scenariot det med minst utsläpp. När i stället allt vatten antogs återanvändas var det vattenburna scenariot det bästa, medan det urinseparerande var det sämsta. Det vattenburna scenariot var förknippat med hög vattenanvändning, vilket är en nackdel i en stad som Kumasi, där vattenförsörjningen redan idag är otillräcklig. Scenariot visade sig kräva mindre transporter än de två andra, men uppförande och drift skulle förmodligen vara mycket mer energikrävande än för de andra två scenarierna.

VI
ABBREVIATONS
EPA – Environmental Protection Agency IWMI – International Water and Management Institute KMA – Kumasi Metropolitan Assembly KNUST – Kwame Nkrumah University of Science and Technology KVIP – Kumasi Ventilated Improved Pit Latrine LCA – Life Cycle Assessment MFA – Material Flow Analysis SSP – Strategic Sanitation Plan WB – The World Bank WHO – World Health Organisation WMD – Waste Management Department

VII
TABLE OF CONTENTS
ABSTRACT .................................................................................................................. I
REFERAT .................................................................................................................... II
PREFACE ................................................................................................................... III
POPULÄRVETENSKAPLIG SAMMANFATTNING ................................................ IV
ABBREVIATONS ...................................................................................................... VI
TABLE OF CONTENTS ........................................................................................... VII
1 INTRODUCTION ..................................................................................................... 1
1.1 THE SANITARY CRISIS .................................................................................... 1
1.2 THE STUDY SITE – A TYPICAL EXAMPLE ................................................... 1
1.3 OBJECTIVES ..................................................................................................... 2
2 BACKGROUND ....................................................................................................... 2
2.1 KUMASI ............................................................................................................ 2
2.1.1 Sanitation ..................................................................................................... 3
2.1.2 Urban and peri-urban agriculture .................................................................. 6
2.1.3 Sanitation planning ....................................................................................... 8
2.2 SANITATION ..................................................................................................... 8
2.2.1 Urine Diversion ............................................................................................ 9
2.2.2 Anaerobic digestion .................................................................................... 11
2.2.3 Simplified sewerage and wastewater treatment ........................................... 12
2.2.4 Greywater treatment ................................................................................... 13
2.3 MODELLING WASTE FLOWS ....................................................................... 13
3 METHODS .............................................................................................................. 14
3.1 DEFINING SCENARIOS ................................................................................. 14
3.1.1 System boundaries and time horizons ......................................................... 14
3.1.2 Literature studies ........................................................................................ 14
3.1.3 Visiting the study site .................................................................................. 14
3.2 CONSTRUCTING THE MODEL ..................................................................... 14
3.2.1 MFA ........................................................................................................... 14
3.2.2 LCA ........................................................................................................... 15
3.2.3 The developed model .................................................................................. 15
4 RESULTS ................................................................................................................ 16
4.1 DEFINING SCENARIOS ................................................................................. 16
4.1.1 System boundaries ...................................................................................... 16
4.1.2 Defining residential categories .................................................................... 17

VIII
4.1.3 The urine diverting scenario........................................................................ 21
4.1.4 The biogas scenario .................................................................................... 22
4.1.5 The waterborne scenario ............................................................................. 23
4.1.6 Time horizons ............................................................................................. 24
4.2 CONSTRUCTING THE MODEL ..................................................................... 26
4.2.1 MFA ........................................................................................................... 26
4.2.2 LCA ........................................................................................................... 27
4.2.3 Simplifications ........................................................................................... 27
4.3 SIMULATIONS ................................................................................................ 27
4.3.1 Model results .............................................................................................. 27
4.3.2 Sensitivity analysis ..................................................................................... 39
5 DISCUSSION AND CONCLUSIONS ..................................................................... 41
5.1 SIMULATION RESULTS ................................................................................. 41
5.1.1 Comparing scenarios .................................................................................. 41
5.1.2 Comparing time horizons ............................................................................ 43
5.1.3 Alternative systems ..................................................................................... 43
5.1.4 Conclusions ................................................................................................ 44
5.2 UNCERTAINTIES ............................................................................................ 44
5.2.1 Ingoing data and model parameters ............................................................. 44
5.2.2 System maintenance ................................................................................... 45
5.3 HEALTH SECURITY ....................................................................................... 45
5.4 FEASABILITY OF THE SCENARIOS ............................................................ 45
6 REFERENCES ........................................................................................................ 47
APPENDIX 1 ............................................................................................................... 1
APPENDIX 2 ............................................................................................................... 4
APPENDIX 3 ............................................................................................................. 11
APPENDIX 4 ............................................................................................................. 12
APPENDIX 5 ............................................................................................................. 14
APPENDIX 6 ............................................................................................................. 16
APPENDIX 7 ............................................................................................................. 19
APPENDIX 8 ............................................................................................................. 20

1
1 INTRODUCTION
1.1 THE SANITARY CRISIS
It is estimated that over one billion people in the world lack access to clean water, and 2.6 billion lack satisfying sanitation (Sida, 2008). The majority of these people still live in rural areas in developing countries, but the urban problems are rapidly increasing. Firstly, the urban situation is of a different nature. Extreme crowding increases the exposure to pathogens, and the often prevailing lack of city planning obstructs interventions. Secondly, the urbanization rate is rapid. It is estimated that, already today half of the world's population lives in cities, and it is believed that 95% of the population growth during the next 30 years will occur in urban areas in developing countries (Sida, 2008). For many cities it has been, and will continue to be, extremely difficult to keep pace with the population growth when it comes to developing infrastructure. Huge problems are seen in providing citizens with clean water and sanitation facilities.
The problems of clean water supply have throughout history been more focused on than those of sanitation. This is a natural priority, but also, addressing the problems of sanitation does not seem attractive on any level, amongst neither politicians nor people (UN Water, 2008). In the last few years however, attention has been drawn to the area. On a UN top meeting in 2000 the Millennium Declaration was formed, and shortly after the Millennium Development Goals were signed. Added in 2002, alongside the already existing target for water, was sanitation: “Halve, by 2015, the proportion of people
without sustainable access to safe drinking water and basic sanitation”. In addition to this, year 2008 was named to be “The year of sanitation” by the UN. Apart from obvious reasons of dignity and cleanliness, proper sanitation is of importance for health, poverty reduction and environment (ibid). SuSanA (2008) state that diseases caused by lacking sanitation are one of the most critical barriers to economic development in developing countries. By preventing the spreading of bacteria, viruses and parasites sanitation can prevent illness (most common are diarrheal diseases, including cholera) and death. Every year, more than five million people die from polluted water. Children are especially sensitive; 1.5 million children under the age of five die from diarrhea yearly.
1.2 THE STUDY SITE – A TYPICAL EXAMPLE
Ghana is a low-income, developing country and the city of Kumasi well exemplifies the typical problems with water and sanitation facing many cities in the developing world (The World Bank, 2008). Water supply is limited (in this region more depending on insufficient providing systems than water scarcity) and health and environmental problems are severe (Erni, 2007).
Also typical is a high annual population growth (>5% (KMA, 2008a)) that characteristically occurs in the city outskirts (Simon et al., 2001). These newly developing areas with both urban and rural characteristics are often referred to as peri-urban. There is risk that infrastructure planning in these areas is not recognized by the municipality as their responsibility, either because they grow to exceed the city administrative boundary (which is the case of Kumasi) or because they are illegal (rarer in Kumasi than in many other cities).

2
In Kumasi, as well as in many other cities in the developing world, agriculture within the city boundaries is of large importance for food security.
1.3 OBJECTIVES
The objective of this master thesis was to construct and apply a software tool for modeling waste flows in Kumasi, Ghana. Three future scenarios for sanitation systems were defined, and the environmental performance of these evaluated. The study was limited to household liquid waste (toilet waste and greywater). The aim was to compare two ecological sanitation systems (biogas and urine diversion) with one waterborne. The quantitative assessment was strictly environmental, focusing on emissions of nutrients (N, P) and organic carbon to receiving waters (eutrophication), as well as the potential of their reuse in agriculture in the city and its vicinity. The software model was constructed in MATLAB Simulink, and was based on the principles of MFA (Material Flow Analysis) and LCA (Life Cycle Assessment).
2 BACKGROUND
2.1 KUMASI
Ghana is situated by the bay of Guinea in West Africa (Figure 1). Following the capital Accra, Kumasi is Ghana's second largest city with a population of 1.9 million people (KMA, 2008a). It is the capital of the Ashanti region, remnants of the Ashanti kingdom, whose cultural habits still have strong influence on people and city development (KMA, 2008b). The climate is tropical and the natural vegetation is rainforest, even though decades of extensive deforestation have left the landscape fundamentally altered. The terrain is undulating and heights vary between 250 and 300 meters above sea level. Temperatures vary between 21.5 ºC (mean low) and 30.7 ºC (mean high) with little variation over the year, and corresponding figures for relative humidity are 59% and 94%. The annual rainfall of 1350mm is distributed over the year in a slightly bimodal manner with one peak in April-June and one in September-October.
Figure 1 Ghana, Accra and Kumasi (author’s map).

2.1.1 Sanitation
Sanitation systems in Kumasi are insufficient in keeping human surroundings clean and healthy, as well as in protecting the environment. facilities and are left to use one of tPrice and standard of these vary, but most are crowded and unclean (author’s observation; Keraita et al., 2003that about 6% fully lack access to It is assumed that this habit is widespread also amongst people with access to toilets, avoiding the uncleanliness and/or costs of the public facilities. facilities are dry (bucket latrines, pit latrines, KVIP’s (Kumasi ventlatrines)), but around 26% of the population use WC’s.tanks, but approximately 4% of the population are connected to simplifisystems with waste stabilization ponds (WSP’s) or trickling filter (ibid). All the three existing WSP’s are overloaded due to Figure 3), and the effluents are (KMA, 2007b). The fourth waterborne system, at KNUST University of Science and Technology) treatment plant. The plant, which is running again since 2007 after many years of nonservice, is one of the best treatment facilities in Ghana, yet lacking tertiary treatment (Kuffor, personal communication)
Figure 2 Toilet facilities in Kumasi. Source: KMA 2008b.
WC, septic tank
22%
WC, simplified
sewerage 4%
Bucket latrine
12%
Pit latrine, KVIP
18%
No access 6%
3
Sanitation systems in Kumasi are insufficient in keeping human surroundings clean and healthy, as well as in protecting the environment. 38% of the population lack their own facilities and are left to use one of the many public toilets (Figure 2) (KMA, 2008b)Price and standard of these vary, but most are crowded and unclean (author’s
, 2003). KMA (Kumasi Metropolitan Assembly) has estimated access to toilet and are forced to open urination and defecation.
It is assumed that this habit is widespread also amongst people with access to toilets, avoiding the uncleanliness and/or costs of the public facilities. The majority of
(bucket latrines, pit latrines, KVIP’s (Kumasi ventilated improved pit latrines)), but around 26% of the population use WC’s. Most are connected to septic
% of the population are connected to simplified sewerage ems with waste stabilization ponds (WSP’s) or trickling filter (ibid). All the three
existing WSP’s are overloaded due to improper management (author’s observationsare way below both national and international
fourth waterborne system, at KNUST (Kwame Nkrumah University of Science and Technology) campus, is connected to a trickling filter
plant, which is running again since 2007 after many years of nonis one of the best treatment facilities in Ghana, yet lacking tertiary treatment personal communication).
Toilet facilities in Kumasi. Source: KMA 2008b.
Public toilets
38%
WC, septic tank
Sanitation systems in Kumasi are insufficient in keeping human surroundings clean and 38% of the population lack their own
(KMA, 2008b). Price and standard of these vary, but most are crowded and unclean (author’s
has estimated toilet and are forced to open urination and defecation.
It is assumed that this habit is widespread also amongst people with access to toilets, The majority of the
ilated improved pit Most are connected to septic
d sewerage ems with waste stabilization ponds (WSP’s) or trickling filter (ibid). All the three
management (author’s observations, nal and international standards
(Kwame Nkrumah campus, is connected to a trickling filter
plant, which is running again since 2007 after many years of non-is one of the best treatment facilities in Ghana, yet lacking tertiary treatment
4
Figure 3 Top: overloaded anaerobic pond at Ahinsan, Kumasi. Bottom: city stream (author’s photos). According to the KMA, 90% of faecal sludge from public toilets and septic tanks are collected and brought off site by truck, while the rest is dumped within the city posing risk of pollution of ground and surface water (Frimpong, personal communication). Overloaded dumping/treatment sites have for long polluted rivers and streams in the city (Keraita et al., 2003). In 2004 the KMA let build a series of waste stabilization ponds for faecal sludge treatment at Dompoase in the south of Kumasi. Due to improper management though, treatment is inefficient and effluents still pollute surface waters (Buama Ackon, 2006).

5
Figure 4 Water reservoirs, rivers and faecal sludge treatment plant (author’s map). In addition to this pollution most septic tanks lack properly functioning drain fields, causing risk for pollution of ground- and surface water by infiltration and/or flooding (Owusu-Addo, 2006; Gadogbe, 2006). The situation is the same for pit latrines, and the two can be especially harmful in areas with high groundwater table or dense habitations where groundwater wells are located close to latrines. Piped water from two reservoirs outside Kumasi (Figure 4) supplies mainly the older central areas, while groundwater, surface water and rainwater are used in all other areas. Both public and private urinals are abundant, and most drain together with grey- and stormwater into the open gutter drainage system (Figure 5), eventually ending up in one of the city streams Subin, Aboabo or Sisa (Figure 4). Kumasi is located on a water divide, with 72% of the area draining to the Oda River system in the south, and 28% to the Offin River system in west. Most of the streams forming the Oda River originate within the Kumasi urban area, why the pollution here affects downstream areas. Faecal coliform values measured 32km south of Kumasi were 1000 times higher than WHO’s guidelines for irrigation water (Keraita et al., 2003).

6
Figure 5 Public toilets vary in standard and price. Top left: public pit latrine. Top right: public WC, with a fee approximately 10 times higher than for the pit latrine. Bottom left: school KVIP. Bottom right: The open gutter system does not reach all areas. Here, the gutter ends in a residential area (author’s photos).
Alongside the health related issues of poor sanitation are environmental concerns. Nitrogen, phosphorus and organic material from faeces, urine and greywater released into surface waters contribute to eutrophication. Erni (2007) showed that the total amount of nitrogen and phosphorus leaving Kumasi with waterways was 10 times higher than in entering waters, an increase by large caused by urine and faeces (90 % of N and 50 % of P, the other big source of P being detergents). Leakage of nitrogen into groundwater also poses as a health risk if wells are located too close to discharge points.
2.1.2 Urban and peri-urban agriculture
In Kumasi, as well as in many other cities in the developing world, agriculture within the city boundaries is of great importance for food security. Food consumption in Kumasi depends to 5% on back yard farming, 14% on urban farming and 66% on peri-urban farming (Leitzinger, 2000). Much of the cultivation occurs in one of the stream or river valleys (Figure 6, Figure 7), and irrigation water is often taken from the polluted surface waters, why high levels of faecal coliforms have been recorded also on vegetables on the Kumasi market (Keraita et al., 2003). Belevi et al. (2000) state that the pollution causing environmental and health problems in Kumasi predominantly originates from household waste, mainly from faecal sludge. Only a few industries exist in Kumasi, and some of them have their own treatment facilities, why interventions at the household level might result in significant improvement (ibid).

7
Figure 6 Vegetable producing sites in urban Kumasi (2004, IWMI unpublished).
Most African soils are strongly weathered and hence nutrient poor, why the success of cultivation to great extent relies on the quality of the top soil layer. Increased land pressure has led to more intensive cultivation and shorter periods of fallow within the Kumasi urban and peri-urban area, why the top soil at many places is deficient in nutrients and organic matter (Adu, 1992). Informal irrigation secures food supply by adding water and nutrients (from urine, faeces and greywater) on to the field, but does this in an unsafe manner. A sanitation system that could achieve the same without spreading diseases and causing pollution might be beneficial for health, environment and food security.
Figure 7 Urban agriculture in Ghana. Source: Obuobie et al. (2006).

8
2.1.3 Sanitation planning
In 1999 the Environmental Sanitation Policy for Ghana was published by the Ministry of Local Government and Rural Development (Buama Ackon, 2006). A new sanitation policy has long been requested by many professionals, and finally, work started a few years ago. A revised version from 2007 has been available for this project, but the policy has not yet become valid. The Policy from 1999 stated that the KMA alone is responsible for providing sanitation by own regime or by engaging contractors. In 1999 a Strategic Sanitation Plan (SSP) for Kumasi was made under the World Bank (WB) – UNDP Water and Sanitation Program (ibid). This first SSP was valid for the period 1999-2000 and was later updated for 1996-2005. In the SSP’s is concluded that no one solution is reasonable for the whole city, but rather different sanitation systems for different kind of habitation. The categories presented by Tipple (1982) (see section 4.1.2) were used, and the recommendations for each category have not changed much since the first SSP. Simplified sewerage was recommended for high density areas (tenement sector), KVIP’s for medium density areas (indigenous sector) and WC’s with septic systems for low density areas (government, high cost sector). Stated in the SSPs is also the aim to phase out the unhygienic bucket latrines. Early mentioned (and implemented) in the sanitation planning for Kumasi was the involvement of private actors in the management of public toilets. Today, it is the city’s aim to involve private actors in all parts of sanitation operations (Adjei-Boateng, personal communication). Today, lack of means limits the KMA’s possibilities to work in the direction of any plan or policy (Adjei-Boateng, personal communication). All efforts are being laid on operation and maintenance of existing systems.
2.2 SANITATION
Definitions of the word sanitation vary with context. In the North it often refers to handling of wastewater from different sources, while in the South the expression is often extended to include handling of all sorts of wastes, liquid as well as solid. This section gives a brief introduction to sanitation and a description of the techniques of interest for the thesis.
A complete sanitation system contains toilets, collection and transport of excreta, treatment facilities and discharge/reuse in the nature. Important aspects to consider for planners are health related, economical, environmental, and cultural. An attempt to set a lowest standard for facilities defined on health criteria has resulted in the expression improved sanitation. According to WHO’s definition WC’s, pour-flush latrines, ventilated pit latrines (VIP’s) and simple pit latrines are improved sanitation facilities (EcoSanRes, 2008b). Pit latrines however, are in many cases of great inconvenience and health concern for the user, while pathogen containing leakage into groundwater and/or surface waters can occur from pit latrines as well as septic systems or sewerage.
Sanitation systems can be centralized, semi-centralized or decentralized. Different solutions may be suitable for different locations. Decentralized systems are often promoted because they minimize transports and have lower demands on institutional strength. Centralized systems might be more efficient and more appropriate in denser areas. Techniques can be dry or wet, separating or mixing, and depending on which do waste flows differ. On the one extreme the system separates all flows: faeces, urine, flush water (if a wet system) and anal cleansing materials. On the other everything is

9
mixed into so called blackwater.
Not only toilet design is important in preventing disease spreading. Pathogens can be spread to humans either by hands, flies, water, soil, or food that has been contaminated by one of the before mentioned, why blocking of all of these pathways are important (Winblad and Simpson-Herbért, 2004).
Conventional waterborne sewerage systems are expensive to construct, operate and maintain and have often proven to fail in function when implemented in developing countries. The scarcity of water occurring in many cities of developing countries also tells against such solutions. The unplanned manner of many of these cities, especially in the rapidly growing outskirts (many of which are slums), makes construction of networked solutions difficult or even impossible. In addition, most cities lack institutions for planning and operating such systems. Also when functioning, conventional waterborne systems fail to perform in a sustainable manner: Potential for reuse of nutrients is limited and energy and water consumption is high.
From insights of former failure different ideas of alternative sanitation planning have arisen. Among these is the concept of ecological sanitation, often shortened EcoSan. EcoSan systems are those that not only keep the environment clean and sanitary, but also make the return of nutrients to soils possible (Winblad and Simpson-Hébert, 2004). Instead of considering the nutrient rich human faeces and urine as waste they are seen as assets, with the potential of replacing considerable amounts of chemical fertilizers. Reuse should occur at a scale as local as possible to minimize transports and need for central management in countries with low institutional strength (ibid).
It must be emphasized though, that the strategies on how to solve the immense sanitation problems in the South expressed in literature, as well as in this thesis, are predominantly those of professionals in the North, often lacking the insight and experience of local conditions of experts in the developing world.
2.2.1 Urine Diversion
If urine and faeces are separated at source, treatment of each can be suited to its features, hence be more energy efficient. Human faeces contain high concentrations of pathogens, while urine from a healthy human being is clean before it leaves the body (Winblad and Simpson-Herbért, 2004). This, together with the fact that heavy metals mainly are excreted with faeces, means that urine diversion essentially lowers the amount of high-risk waste to treat. Urine diverting toilets exist in numerous versions designed to fit different cultural habits and the availability of materials: sitting toilets, squatting toilets, toilets adapted for cleansing water etc. As soon as urine comes in contact with faeces, the demand for its treatment increases, why a proper toilet design is of importance. Urinals as a complement to toilets can help improve separation. Urine Urine can be directly used as fertilizer on a family-scale, while larger scales demand for treatment. Storage is the only treatment method that has been applied in large scale, and is so far the recommended choice (Winblad and Simpson-Herbért, 2004). Storage times vary with temperature, pH, ammonia concentration and the kind of crop to be fertilized (Tettey-Lowor, 2008). Higher pH and ammonia concentration make the environment

10
unfriendly for most pathogens, why undiluted urine and a covered storage tank (preventing ammonia vaporization) make required storage times shorter. For temperatures around 20°C, one month is enough for fodder crops and crops that are to be processed. After six months urine is safe to use for all kinds of crops, even though application for vegetables to be eaten raw should occur one month before harvest (Winblad and Simpson-Herbért, 2004). Nitrogen, potassium and phosphorus in urine exist in water soluble form, hence they are plant available. It has been shown that nitrogen and phosphorus in urine has the corresponding effect on plant growth as respective nutrient in chemical fertilizers (Tettey-Lowor, 2008). Urine is especially rich in nitrogen, and K/N and P/N ratios are lower than in chemical fertilizers. Faeces Faeces can be directly taken off-site for treatment or be stored/treated on site. Parameters affecting pathogen reduction in faeces are temperature, pH, ammonia, moisture content, solar radiation, presence of competing micro organisms, nutrients and oxygen (Winblad and Simpson-Hebért, 2004). In dehydration toilets faeces are stored and dried under the toilet for a longer period (6-12 months is often recommended) (Schönning and Stenström, 2004). Double vaults or removable buckets make it possible to alternate, so that when one is used as toilet, the other is left to dehydrate. Dehydrating materials such as sawdust, ash and lime should be added after every defecation occasion. Decreased moisture content and storage time (and increased pH if lime and/or ash/urea are added) enables pathogen die off, resulting in an end product safer to handle than that of fresh faeces. The resemblance to faeces decreases over time and a well managed dehydration toilet is odor and fly free, making both usage and handling of resulting products safer and more pleasant. The dehydrated faeces are not fully safe, why secondary treatment (e.g. composting) is required to lower the pathogen count. Nutrients in faeces are mainly bound to organic material and will not be plant available until the organic matter has been decomposed by soil microorganisms. Potassium and phosphorus levels are comparable to those in chemical fertilizers, while nitrogen concentrations are lower. The high organic content in faeces makes it an excellent soil improver. Most of the nutrients and organic matter in faeces are preserved through the dehydration process (Jönsson et al., 2004). Some nitrogen might be lost as ammonia and some organic matter can be degraded, losses that are minimized with faster dehydration.
In composting toilets faeces are mixed with bulking agents such as dry grass, twigs, coconut fiber and wood shavings to make the pile more aerated (Winblad and Simpson-Herbért, 2004). The aeration decreases odor, dries the pile and provides microorganisms with oxygen. It is important to keep moisture content in a given range; the most common reason for failure is too high moisture content. The C/N ratio in faeces is lower than optimal for composting why organic matter such as kitchen and garden refuse can make the process more effective. After 6-8 months the faeces can be removed to be further treated in the garden compost or in secondary treatment. Nutrients in compost are more readily plant available than those in dehydrated faeces. Negative though, is that significant amounts of nitrogen can be lost through ammonia vaporization during composting. Composting toilets demand more maintenance from the user than

11
dehydrating toilets. Both compost and dehydration toilets can be located outdoors as well as indoors, and have even been used in multi-storey buildings (ibid).
2.2.2 Anaerobic digestion
Anaerobic digestion has been used in rural areas in China and India since the 1950ies, and is presently experiencing an upswing in Europe, with municipal and agricultural wastes as feedstock (Kossmann et al., 2004). Numerous designs exist all over the world, adjusted to local conditions and feedstock. When organic material is digested under anaerobic conditions, carbon is transformed into biogas (mainly methane and carbon dioxide), while most nutrients leave the process with the effluent sludge, making it an excellent fertilizer (Kossman et al., 2004). A large content of the organic nitrogen is transformed into ammonia, which increases the fertilizing value of the sludge. On a smaller scale, the gas can be used for cooking or lighting, while on larger it can also be used as vehicle fuel or to produce electricity. There are three different kinds of digestion: psychrophilic (below 20°C) mesophilic (20°C - 40°C) and thermophilic (above 40°C) (Kossman et al., 2004). All processes decrease pathogen count, but only thermophilic digestion can produce a sludge that is pathogen free. If the digester is unheated, thermophilic temperatures are rarely obtained, why secondary treatment is necessary. The biogas plant presents an option for sewage treatment without the necessity of direct handling of human excreta. Faeces, urine and cleansing water can be directly led into the reactor from the toilet, preventing bad odor and safeguarding hygiene (Figure 8). Only small amounts of flush water can be used if excreta are to be digested alone (Jha, 2005). Human excreta has a C/N ratio lower than optimal for gas production, why adding material richer in carbon (e.g. straw, saw dust or cow dung) can increase the biogas yield (FAO, 1996).
Figure 8 Small scale toilet-connected biogas reactor. Source: The environmental and energy blog (2008).
12
Biogas plants can look very different depending on scale, feedstock, local available construction material and climate. In colder climates the reactor must always be heated, while both heated and unheated systems can be used in warmer climates. Small scale plants can be of very simple design, requiring no energy at all, while larger plants can be technically advanced and sometimes demand as much energy as the process yields. The most abundant simple, small-scale plants are the fixed dome and the floating drum reactors, but many other designs exist and are being developed (Kossman et al., 2004).
2.2.3 Simplified sewerage and wastewater treatment
Simplified sewers A simplified sewerage system is designed in a manner making it 50-80% cheaper to construct than conventional gravity sewers (Tilley et al., 2008). Also operational costs are low. The sewers are laid out within property boundaries of the user instead of under public roads as in conventional systems, which allows for a shallower depth due to less pressure. This means less construction costs and fewer and shorter pipes. Sewers are usually of small diameter, making the system sensitive to clogging. Grease traps and interceptor tanks are therefore recommended at each connection point. Septic tanks Septic tanks are watertight, underground tanks consisting of one, or preferably two or more chambers (Tilley et al., 2008). Solids are removed through floatation and sedimentation and organic material digested anaerobically, resulting in an improvement in effluent quality. The treatment is however not sufficient for discharging the water, but quality can be enhanced by following treatment in for example a drain field. Drain fields (also called leach fields) consists of thin, perforated pipes laid out underground to distribute the wastewater over a larger land area (ibid). Hence, land requirements are high, and drain fields only suitable for more spacious habitations. Waste stabilization ponds Waste stabilization ponds (WSP’s) are often mentioned as the most appropriate waste water treatment technology for developing countries (Ramadan and Ponce, 2008; FAO, 1996; IRC, 2004). Treatment efficiency is high and demand for skilled staff, construction parts and energy is low. Land requirements on the other hand, are high, making the technology unsuitable where land is expensive. Ponds of different kind are often constructed in series in various constellations to achieve desired effluent quality. In anaerobic ponds (first in line if in series) much suspended material is removed through sedimentation (Ramadan and Ponce, 2008). Due to the heavy organic load, anaerobic conditions prevail and organic material is digested to form methane and carbon dioxide. Facultative ponds are designed to have a low organic surface load that enables the growth of oxygen producing algae. These, together with aeration caused by wind, make it possible for aerobic bacteria to digest organic material and lower BOD values. Last in line, one or more maturation ponds can be placed to further polish the effluent, especially from pathogens and nutrients (ibid). Maturation ponds are shallower than both anaerobic and facultative ponds to allow for oxygen and sunlight to reach a volume as large as possible.

13
2.2.4 Greywater treatment
Greywater is defined as all water used for household purposes, except that used for sanitation, hence includes water from dishing, cooking, washing, cleaning etc. These water flows are characterized by high content of easy degradable organic material, organic pollutants and at some places phosphorus (depending on habits of using phosphorus containing detergents) (Winblad and Simpson-Herbért, 2004). Compared to toilet waste, health and environment hazards from greywater are low.
The most efficient ways of reducing pollution from greywater are probably economic use of water and minimizing the use of household chemicals. In sewerage systems greywater is most often handled together with water for sanitation. Biogas plants can receive greywater, but additional dry material has to be added to achieve a water content that suits the process. In dry toilet systems, greywater must be handled separately, for example in a vertical flow filter (Ridderstolpe, 2004). The water is filtered through a soil bed, and if aerobic conditions are maintained BOD, pathogen, phosphorus and nitrogen can be removed to different extents.
2.3 MODELLING WASTE FLOWS
Material flow analysis (MFA) has proven to be a suitable method for modelling waste flows in developed countries (Baccini and Brunner, 1991). It has been applied in tools for early recognition of environmental impacts, for analyzing interventions, and for simulation and comparison of future options for sanitation systems. One of these tools, developed in Sweden, is a MATLAB Simulink based model named ORWARE (ORganic WAste REsearch model) (ORWARE, 2000). It has been used to model organic waste flows in several Swedish cities, and has also been modified into a model for urban water flows: URWARE (URban WAter REsearch model) (Jeppsson and Hellström, 2002). These models combine MFA with LCA (Life Cycle Assessment), the latter adding classification into different environmental impact categories (e.g. eutrophication and acidification).
A few studies have been performed to investigate the potential of applying MFA also in developing countries, despite the frequent scarcity and poor quality of data. Binder (1996) concluded from applying MFA in a small municipality in Colombia, that the method was suitable for “setting up monitoring concepts, early recognition of resource demand and environmental impacts, and evaluating the effect of technical measures in mitigating [for the subsystems water, food and durables]“. Montangero and Belevi (2006) states that data needed for MFA is not likely to exist in many developing countries, but also claims that the “eliciting expert judgement technique” (using several experts’ judgement of parameter values and estimation of uncertainty of these) appears as a very promising alternative.
In 2007, Erni used MFA to model water and nutrient flows in Kumasi, Ghana. He comments that his results have low accuracy on a detailed level, but that MFA was sufficient for quantifying the magnitude of, and comparing different flows.

14
3 METHODS
3.1 DEFINING SCENARIOS
3.1.1 System boundaries and time horizons
The three scenarios defined have the same system boundaries. They collect and treat household liquid waste, including greywater, urine, faeces and in some cases flushwater. The physical boundaries of the scenarios were defined after map, satellite image, and literature studies. Two time horizons were defined to be able to examine and discuss factors changing over time.
3.1.2 Literature studies
General information about sanitation technologies’ function and applicability in tropical, developing countries were sought for in international, as well as in Ghanaian literature. Most information was obtained from published sources. For more specific knowledge regarding Ghana and Kumasi however, much grey literature had to be employed. MSc and BSc thesis from KNUST and other Ghanaian universities, unpublished reports from NGO’s, the KMA and Ghana Statistical Service have been applied, when possible combined with each other and/or observations by the author from the field.
3.1.3 Visiting the study site
Three months in Kumasi resulted not only in data being gathered, but also in a sense of understanding for the general prevailing conditions. Although superficial, this has been essential for defining the scenarios.
A general mapping of Kumasi was performed by visiting different areas. Characterization of different kinds of habitation found in literature was used as a basis for this work. The aim of mapping the city was to obtain knowledge about the current sanitary and social situation, type of habitation, crowding etc to get an idea of which sanitation solutions that could be suitable in each part of the city. Personal contact with employees of the Waste Management Department and the Statistical Office of the KMA, managers/operators on treatment facilities, researchers and students at KNUST, staff at the IWMI office and friends gave opportunities for information gathering and discussions about sanitation, as well as country/culture related issues.
3.2 CONSTRUCTING THE MODEL
A software model based on material flow analysis (MFA) and life cycle assessment (LCA) was constructed in MATLAB Simulink. The model enables simulation of different sanitation systems in order to evaluate their environmental performance, and was in this study used to compare three defined scenarios.
3.2.1 MFA
Material flow analysis is a method of analyzing the flows of different elements through a well defined system (Baccini and Brunner, 1991). Chemical elements and compounds are defined as materials, while materials or combinations of materials with a function valued by man are defined as goods. Transports, storage and transformations are processes. Transfer coefficients are used to calculate the amount of elements in goods that undergo certain changes in processes (e.g., the fraction of nitrogen (the material) in

15
urine (the goods) that is lost through ammonia vaporization during storage (the process)). MFA is based on mass balance, why incoming elements (into the defined system) should equal outgoing plus changes in storage. A material flow analysis consists of the following steps (ibid):
• System analysis including system boundaries, goods, processes and time span for the analysis.
• Determination of the goods fluxes and element concentrations.
• Calculation of the goods and element fluxes over the whole system.
• Presentation and interpretation of the results.
3.2.2 LCA
Life cycle assessment is a methodology for determining the total environmental impact of a product or a service throughout its full life cycle (Baumann & Tillmann, 2004). The aim of the thesis was not to perform a complete LCA of the different scenarios, but rather to apply some of the elements of the methodology. The impact category “Eutrophying effect” was used to assess the emissions’ effect on the environment.
3.2.3 The developed model
The developed model was to a large extent influenced by ORWARE (see section 2.3). Both models have been constructed in MATLAB, and to enable compatibility between the two, the vector used to store the quantity of the different elements in ORWARE (Appendix 3) was used also in this study. The model constructed in this study contains processes (sanitation techniques) not existing in ORWARE, and is adapted to local conditions in Kumasi.
The MFA was implemented in MATLAB Simulink, and the LCA calculations in MATLAB program files.
Transfer coefficients and model inputs Understanding of the different processes necessary for the construction of the model was obtained from literature, personal communication, and study visits in Ghana. Most transfer coefficients and model inputs were determined through combination of several literature sources (when available). Own observations and estimations were used in cases where literature values needed adjustment, or when data was nonexistent. Model variables The main model variables were nitrogen, phosphorus, BOD and organic carbon (the latter used as a measure of organic material). Also, volatile solids, dry matter, water content, and a few gases were included to estimate produced weights, air emissions, and biogas production.

16
4 RESULTS
4.1 DEFINING SCENARIOS
Three scenarios for sanitation systems in Kumasi were defined: the Urine diversion
scenario, the Biogas scenario, and the Waterborne scenario. Prevailing conditions in Kumasi (housing, population etc), as well as development trends, were studied in order to suggest suitable systems.
4.1.1 System boundaries
The official boundaries of the Kumasi Metropolitan Assembly (KMA) from 1996 comprise an area of 254km2 (KMA, 2008b). The extensive population growth during the last decades (5.47% /year from 1984 to 2000 (KMA, 2008b)) has caused the urban area to far outgrow the official boundaries (Figure 9). As a consequence of this, the city is increasingly referred to as the Greater Kumasi region, including the KMA and the four neighboring districts Ejisu Juaben, Kwabre, Atwima and Bosomtwe-Atwima-Kwanwoma (Corubolo and Mattingly, 1999).
Figure 9 City growth and some of the former villages incorporated in the urban area (author’s map). The simulations in this study were performed for two time horizons (section 4.1.6). Each time horizon has a system boundary defined by the continuously built up area of Kumasi, hence no consideration was taken to the official boundaries since these poorly reflect the actual urban area.
17
The factors of concern for the modeling that may change over time were projected for each time horizon. These include population (section 4.1.6), cultivated land area (section 4.1.7), city spatial properties and distances (4.1.7).
4.1.2 Defining residential categories
The residential areas in Kumasi were divided into categories, enabling the choice of different sanitation systems for each category, based on the areas’ characteristics.
In comparison to many other African cities, Kumasi has few distinct squatting/slum areas, likely as a result of the traditional land tenure system (Konadu-Agyemang, 1991; Devas and Korboe, 2000) (see discussion). In fact, it is difficult to divide the city into different income categories since high, middle and low income groups are represented in most areas (Korboe and Tipple, 1995). It is not an unusual sight to see expensive villas in the same street as very simple housing. However, some patterns and classification do exist. Five residential categories, mainly based on the work of Tipple (1982) (whose categories have been used by the KMA in their Strategic Sanitation Plan), have been defined and used. To Tipple’s original categories the Indigenous, the Tenement, the
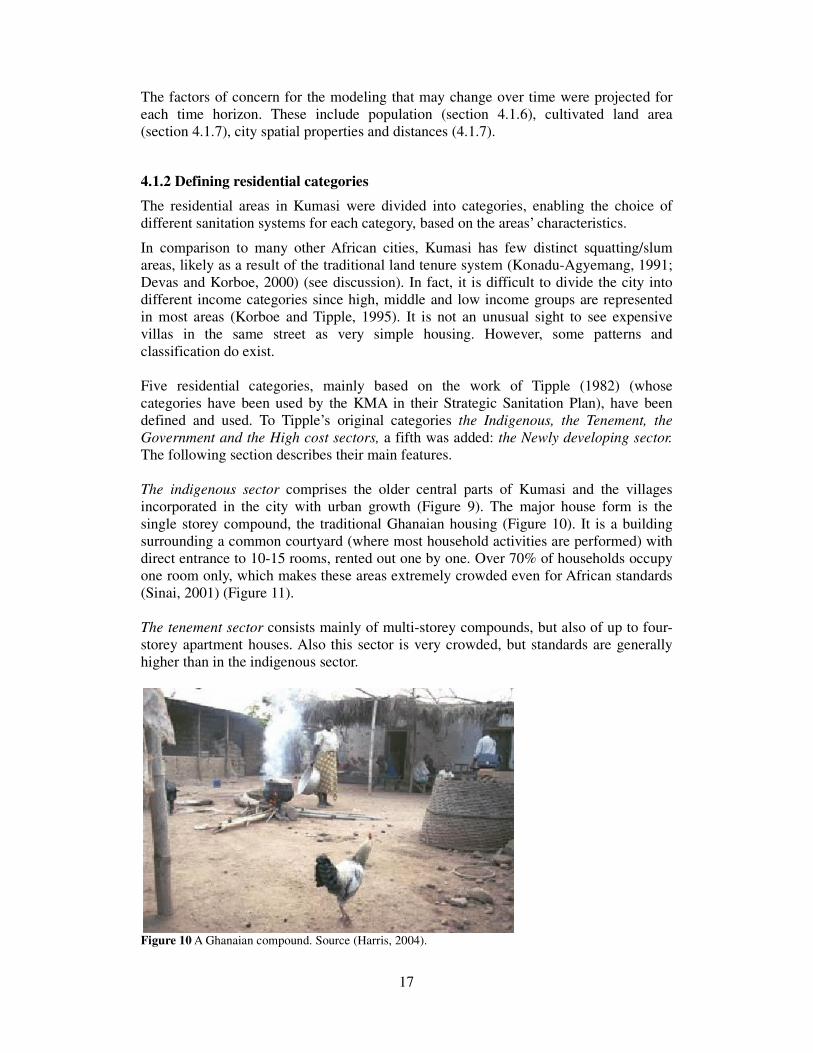
Government and the High cost sectors, a fifth was added: the Newly developing sector. The following section describes their main features. The indigenous sector comprises the older central parts of Kumasi and the villages incorporated in the city with urban growth (Figure 9). The major house form is the single storey compound, the traditional Ghanaian housing (Figure 10). It is a building surrounding a common courtyard (where most household activities are performed) with direct entrance to 10-15 rooms, rented out one by one. Over 70% of households occupy one room only, which makes these areas extremely crowded even for African standards (Sinai, 2001) (Figure 11). The tenement sector consists mainly of multi-storey compounds, but also of up to four-storey apartment houses. Also this sector is very crowded, but standards are generally higher than in the indigenous sector.
Figure 10 A Ghanaian compound. Source (Harris, 2004).

18
The government sector consists of houses built by the government, rented out or bought by the former tenant. The house type is bungalows and tenants usually rent one or two rooms. The high cost sector consists of villas in spacious lots. The residential areas developed as suburbs, initially around the dwellings of the colonial officers, but are today partly integrated in the urban area. The newly developing sector (inspired by Salifu (2008)) was added to account for the changes in the townscape that has occurred since Tipple defined his categories in 1982, as well as for the future development in the studied time horizons. The rapid population growth occurring during the last decades has resulted in extreme crowding in many existing city areas, but also in the development of an unplanned peri-urban area (Simon et al., 2001; studies of maps and satellite images originating from the last 30 years; KMA, 2008a). The newly developing sector was defined in an attempt to classify these fringe developments. Salifu claimed that in 2000, 15% of the population resided in the newly developing areas, typically in detached single family houses on 30x30m plots. Sinai (2001) and Tipple et al. (1998) confirm this new type of settlements, and add that houses are built in a western style, but are usually the home for two or several families. Table 1 Categories used in the model and properties. Source: Salifu (2008) Housing Category Access
Population density
[p/ha]
Water use
[l/p day] Connection Toilets /plumbing SSP*
Indigenous Street in front,
rear alley
80-250 40 25% yard tap, 75% buy from
neighbors
60% public latrine, 25% traditional pit latrine, 5% KVIP,
10% ?
KVIP
Tenement Street in front,
rear alley
300-600 60
90% house connections, of
which 25% have multiple fixtures
45% septic tanks, 40% public latrine,
10% simplified sewers, 5% KVIP
Simplified sewers
Government Street in front,
rear alley
50 80-100
100% septic tanks, partial drain fields
Septic tanks
High cost
10-15 120
100% septic tanks, partial drain fields, all
houses full internal plumbing
Septic tanks
Newly developing
5-10 60-80
100% septic tanks without drain field,
Not in SSP
* Strategic Sanitation Plan by Kumasi Metropolitan Assembly

19
Development trends Tipple et al. (1998) state that compounds still are constructed in Kumasi, even though villas and apartment houses are becoming more common. The government does not encourage the construction of compounds, due to the crowding and the low standard usually associated with this house form, and manifests this in one way by making it easier to obtain building permit for villas than for compounds (Sinai, 2001). However, a change in government policy is recommended by many researchers since the currently private built villas and apartment houses are too expensive for low income groups (Tipple et al., 1998; Sinai, 2001). Compounds are much cheaper to construct, and in addition, it seems that many people still prefer this kind of communal traditional living to the more isolated western-like lifestyle.
Figure 11 Typical dense residential area. Source (Feit, 2004).
Population in each category The KMA has made attempts to classify areas from income levels, the last one from 2007 (KMA, 2007a). The categories are high, medium and low income areas, but the categorization neither comprehensive nor covering all areas. Combined with the latest figures of inhabitants in Tipple’s categories from 2000 (Afrane, personal communication) however, KMA’s work helped to fill out some gaps. Tipple’s categories were mainly based on house type, but when comparing his material with the income, some patterns could be seen. Low income groups were mainly represented in the indigenous sector, which could be confirmed by literature (Tipple et al., 1999). The tenement and the government sector were dominated by medium income groups and high cost housing of high income groups. Neither Tipple’s categorization nor KMA’s were comprehensive when compared with the population census from 2000 (Table 2). Low income areas not represented in Tipple’s data were added to the indigenous sector, while medium income areas were split evenly between the tenement

20
and the developing sector. High income areas showed good compliance with the high cost sector. All areas added, there were still some 100 000 people less than in the census. These were added to the newly developing sector. The calculated population in the developing sector then constituted 11.4% of Kumasi’s total population in 2000, similar to the 15% proposed by Salifu (2008). Table 2 Population in 2000 in the five defined categories Source Indigenous Tenement Government High cost Newly
developing Total
Tipple 602 930 200 107 109 832 60 346 973 215
Low income, not in Tipple
47 991 47 991
Middle income, not in Tipple
15 628 15 628 31 256
∑ 1 052 462
Census 1 170 270
- 1 052 462
Differential
117 808
117 808
∑ 650 921 215 735 109 832 60 346 133 436 1 170 270
Simplifications for the modeling The indigenous and the tenement sector have many similar characteristics. Both areas have high population density, and building types resemble (Table 1). Houses are placed right next to the other, and open spaces within the residential areas are rare. Under these conditions, local reuse of nutrients makes little sense. The two sectors have in the simulations been grouped together as dense areas, and chosen solutions rely to a higher extent on coordination, and have a more centralized character, than those of less dense areas. There are however some important differences between the two sectors. The tenement sector is mainly populated by the middle income group, while the indigenous sector primarily houses people with low income. Existing facilities and service level are higher in the tenement sector, and finally, the KMA has proposed different sanitation solutions for the two (Table 1). To enable future simulations with different sanitation systems for the two categories, calculations and model construction were made for each category separately. Also the government and the high cost sector have been grouped together in spatial
areas due to their resemblance. The newly developing sector consists of already existing settlements described in section 4.1.2. It is though, the sector where most of the future growth will occur (see section 4.1.2), why much of its residential areas are of yet unknown character. It has been divided into the dense and the spatial areas. Also these categories have been modeled separately.

4.1.3 The urine diverting scenario
Dense areas For the denser areas, where reuse chosen (Figure 12). Dehydration toilets demand lresult in a product of less weightUrine is stored under the toilet in a small containerand is collected and brought to secondary stodehydrated faeces and urine are brought to a (on a distance small enough for manual transport)staff that performs the secondary treatment.dehydrated faeces are composted together with organic food waste/other organic material to increase the C/N ratio to a level beneficial for composting.piped collection of urine exists. of the treatment station or by the residents. used by any of the urban farmers in the vicinityperi-urban/rural farmers, or be dispo The already existing open gutter system areas. The system has been repaireddue to digestion of organic material in the guttconnection. A grease trap removes sedimentation (a large part of the organic The extreme population density and the bupossibility of every family having their own toilet. It is likely that many will share in the future, and that public toilets denser areas.
Figure 12 The urine diversion scenario.
21
rine diverting scenario
For the denser areas, where reuse potential is limited, dehydration toilets have been Dehydration toilets demand little commitment from the user and
result in a product of less weight than faeces and compost, which simplifies transport. Urine is stored under the toilet in a small container (if the toilet lacks pipe connection)and is collected and brought to secondary storage when the container is full. Both
ces and urine are brought to a “treatment station” located in the vicinity (on a distance small enough for manual transport). The treatment station has trained
the secondary treatment. Urine is stored for a years’ time, and dehydrated faeces are composted together with organic food waste/other organic material to increase the C/N ratio to a level beneficial for composting. Both manual and piped collection of urine exists. Collection of faeces and urine is either done by the staff
station or by the residents. Compost and treated urine is collected and used by any of the urban farmers in the vicinity. The remains must be transported to
urban/rural farmers, or be disposed of in a different manner.
The already existing open gutter system is used to direct greywater out of the residential repaired and expanded to reach all areas. To prevent odor
due to digestion of organic material in the gutters, a grease trap is installed at every connection. A grease trap removes grease and suspended material through floatation and sedimentation (a large part of the organic matter in greywater originates from oils).
The extreme population density and the building design (see section 4.1.2possibility of every family having their own toilet. It is likely that many will share in the future, and that public toilets will continue to be a common sight in Kumasi’s
The urine diversion scenario.
ilets have been commitment from the user and
simplifies transport. (if the toilet lacks pipe connection),
rage when the container is full. Both in the vicinity
has trained Urine is stored for a years’ time, and
dehydrated faeces are composted together with organic food waste/other organic Both manual and done by the staff
collected and . The remains must be transported to
used to direct greywater out of the residential To prevent odor
installed at every grease and suspended material through floatation and
from oils).
.1.2) limit the possibility of every family having their own toilet. It is likely that many will share also
to be a common sight in Kumasi’s

22
Spatial areas Urine diverting compost toilets have been chosen for the spatial areas, where compost and urine can be utilized as fertilizer locally. Nearly two thirds of households in the urban areas of Kumasi practice backyard farming (Cofie et al., 2003), and urban and peri-urban agriculture together accounts for 60% of the total food consumption in the city (Leitzinger, 2000). Soils are predominantly poor in nutrients and organic matter (see section 1.1.2), why there might be potential for the use of compost and urine within the city area.
Greywater is either discharged into the open gutter system, or locally infiltrated in vertical flow filters (see section 1.2.4). Water that has gone through the filter can either be collected and used for irrigation, or be infiltrated.
4.1.4 The biogas scenario
If human excreta are to be digested anaerobically without any additives, flushwater consumption must be held low, preferably lower than 1.5L/ person and day (Jha, 2005). With such low water content, pipe flow is limited. This presents two options: The reactor can be placed closely to the toilets, requiring no extra flushwater, and can hence be digested without additives. Or, if the distance between toilets and plant is larger, more flushwater (or greywater) can be added to the excreta, with the consequence of having to add more organic matter to the process. Public toilets and densely populated areas make the first option possible. In more spatial areas some kind of sewerage might be necessary, since toilet waste from one family alone is too little feedstock for a digester (Münch, 2008). However, if manure and/or garden/farming waste can be added, the household digester is an alternative.
All simulations have been performed for the case with only excreta being digested, hence with no flushwater or additives. Better gas yield can be assumed if the substrate has been mixed with carbon rich material, since human excreta has a C/N ratio lower than the optimal for anaerobic digestion.
Dense areas Biogas plants are placed at a local level where they are operated by trained staff (Figure 13). The plants are of simple design, without energy demand. Thermophilic temperatures are unlikely to occur in such a plant, why secondary treatment of the sludge is required for hygienic reasons. In India, the organization Sulabh has built several biogas-connected public toilets. After the failure of sun drying the sludge (due to odors, high pathogen counts and psychological taboo) the SET (Sulabh Effluent Treatment) was developed (Jha, personal communication). The SET consists of a settling tank, an active coal filter and UV treatment, and results in an effluent clean enough for release into any surface water (Jha, 2005). Other small scale plants in developing countries have sludge treatment consisting of a settling tank alone, or in combination with a sand filter and final release into a vegetated garden (Aklaku et al., 2006). Other techniques are likely to exist and be developed. For the simulations, a settling tank and a sand filter were chosen. UV light does not affect the simulation variables nitrogen and phosphorus, but is in some cases necessary to obtain a pathogen count low enough, depending on the destination of the effluent (release to surface water/ restricted/unrestricted irrigation, cleaning water etc). Nutrients and organic material in the effluent contribute to eutrophication if released into surface waters, while they add fertilizing value to irrigation water.

Spatial areas A similar system was chosen also for the spatial areas. The difference between the two lies in the local reuse potential and the handling of greywater (the latter the same as in the spatial areas in the urine diversion scenario)
Figure 13 The biogas scenario.
4.1.5 The waterborne scenario
Existing septic tanks In the waterborne scenario, the already high cost, the government and the newly developing sectorsDrain fields have been repaired trap placed after the septic tank prevents clogging Other areas and all new developmentSimplified sewerage and treatment in waste stabilization pochosen for all other areas, as well as for future growth within the high cost, the government and the newly developing sectorssewers and a rock filter following the WSP lowers the amount of sususually associated with WSP effluents.transport in the sewers to a large extent Effluents can be used for irrigation in areas with farming activities. The quality of the effluent must be secured so that pathogen counts are within a safe rangeusing the limits set by WHO in their industrial crops, fodder crops, fruit trees(irrigation of edible crops, sports, fields, and public parks) (Rose, 1999).effluents are discharged into the peri-urban area.
23
system was chosen also for the spatial areas. The difference between the two in the local reuse potential and the handling of greywater (the latter the same as in
the spatial areas in the urine diversion scenario).
aterborne scenario
the already today existing WC-septic tank systemshigh cost, the government and the newly developing sectors will remain (Figure 14).
have been repaired or constructed where not functioning/existing. A grease trap placed after the septic tank prevents clogging in the drain field.
development Simplified sewerage and treatment in waste stabilization ponds (WSP’s) ha
, as well as for future growth within the high cost, the government and the newly developing sectors. A grease trap prevents clogging in the
filter following the WSP lowers the amount of suspended solidsusually associated with WSP effluents. The topography in Kumasi is undulating, why
large extent relies on gravity.
used for irrigation in areas with farming activities. The quality of the nt must be secured so that pathogen counts are within a safe range, for example the limits set by WHO in their recommendations for restricted (irrigation of trees,
crops, fruit trees and pasture) and unrestricted irrigation
irrigation of edible crops, sports, fields, and public parks) (Rose, 1999). surface waters. Sludge is brought to a compost station in
system was chosen also for the spatial areas. The difference between the two in the local reuse potential and the handling of greywater (the latter the same as in
septic tank systems in the Figure 14).
existing. A grease
nds (WSP’s) have been , as well as for future growth within the high cost, the
. A grease trap prevents clogging in the pended solids
The topography in Kumasi is undulating, why
used for irrigation in areas with farming activities. The quality of the , for example
rrigation of trees, unrestricted irrigation
Remaining Sludge is brought to a compost station in
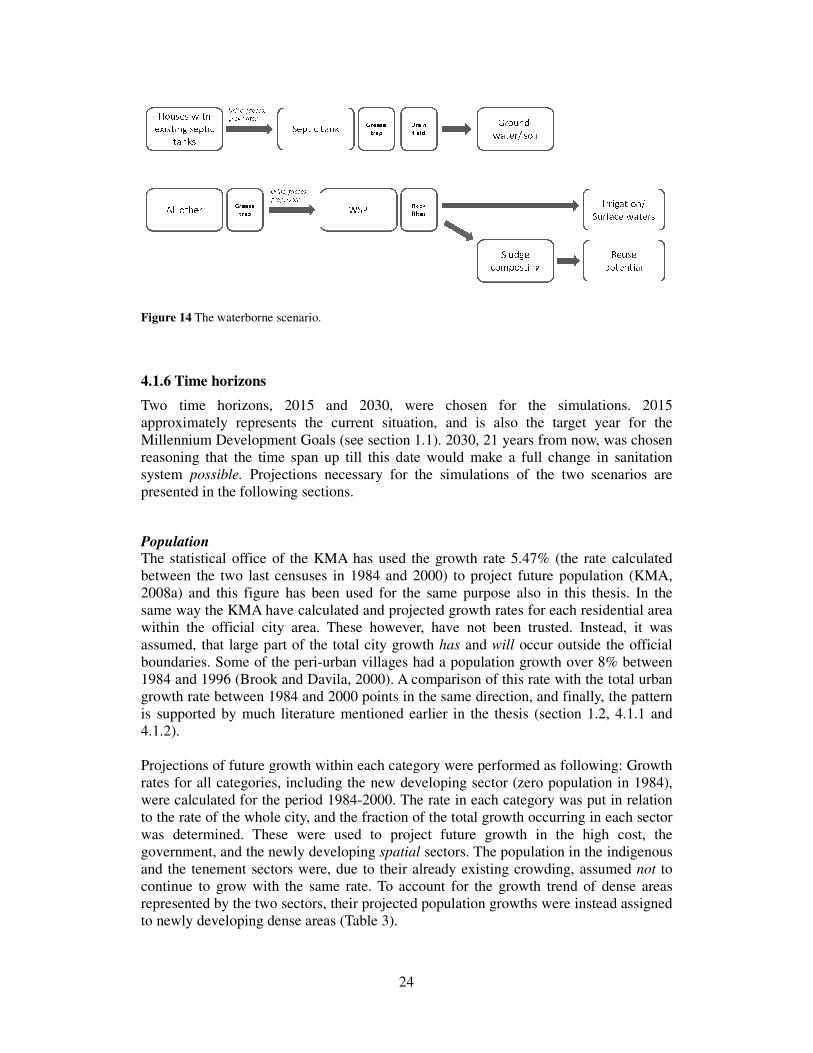
Figure 14 The waterborne scenario.
4.1.6 Time horizons
Two time horizons, 2015 and 2030approximately represents the current situation, and is also the target year for the Millennium Development Goals (see section 1.1). 2030, 21 years from now, was chosen reasoning that the time span up till this date would make a full change in sanitation system possible. Projections necessary for the simulations of the two scenarios are presented in the following sections.
Population The statistical office of the KMA has used the growth rate 5.47% (the rate calculated between the two last censuses in 1984 and 2000) to project future population 2008a) and this figure has been used same way the KMA have calculatewithin the official city area. These however, have not been trusted.assumed, that large part of the totalboundaries. Some of the peri-1984 and 1996 (Brook and Davila, 2000).growth rate between 1984 and 2000 points in is supported by much literature mentioned earlier in the 4.1.2). Projections of future growth within each category were performed as following: Growth rates for all categories, including were calculated for the period 1984to the rate of the whole city, and the fraction of the total growth occurringwas determined. These were usedgovernment, and the newly developing and the tenement sectors were, due to their already existing crowding, assumed continue to grow with the same rate. To account for the growth trend of dense areas represented by the two sectors, their projected population growths were instto newly developing dense are
24
The waterborne scenario.
2015 and 2030, were chosen for the simulations. 2015 approximately represents the current situation, and is also the target year for the
Development Goals (see section 1.1). 2030, 21 years from now, was chosen reasoning that the time span up till this date would make a full change in sanitation
Projections necessary for the simulations of the two scenarios are following sections.
The statistical office of the KMA has used the growth rate 5.47% (the rate calculated between the two last censuses in 1984 and 2000) to project future population
this figure has been used for the same purpose also in this thesis. In thecalculated and projected growth rates for each residential area
. These however, have not been trusted. Instead, it was assumed, that large part of the total city growth has and will occur outside the official
-urban villages had a population growth over 8% between 1984 and 1996 (Brook and Davila, 2000). A comparison of this rate with the total urban growth rate between 1984 and 2000 points in the same direction, and finally, the pattern is supported by much literature mentioned earlier in the thesis (section 1.2,
Projections of future growth within each category were performed as following: Growth rates for all categories, including the new developing sector (zero population in 1984)were calculated for the period 1984-2000. The rate in each category was put in reto the rate of the whole city, and the fraction of the total growth occurring in each sector
. These were used to project future growth in the high cost, and the newly developing spatial sectors. The population in the i
and the tenement sectors were, due to their already existing crowding, assumed continue to grow with the same rate. To account for the growth trend of dense areas
sectors, their projected population growths were instead assigned to newly developing dense areas (Table 3).
were chosen for the simulations. 2015 approximately represents the current situation, and is also the target year for the
Development Goals (see section 1.1). 2030, 21 years from now, was chosen reasoning that the time span up till this date would make a full change in sanitation
Projections necessary for the simulations of the two scenarios are
The statistical office of the KMA has used the growth rate 5.47% (the rate calculated between the two last censuses in 1984 and 2000) to project future population (KMA,
in this thesis. In the growth rates for each residential area
Instead, it was occur outside the official
urban villages had a population growth over 8% between with the total urban
the same direction, and finally, the pattern section 1.2, 4.1.1 and
Projections of future growth within each category were performed as following: Growth (zero population in 1984),
2000. The rate in each category was put in relation in each sector
the high cost, the sectors. The population in the indigenous
and the tenement sectors were, due to their already existing crowding, assumed not to continue to grow with the same rate. To account for the growth trend of dense areas
ead assigned

25
Table 3 Projected population growth in Kumasi Area Population
2000
Population
2015
Population
2030
Fraction of total growth
Indigenous 650 921 680 709 748 406 0.02
Tenement 215 735 245 523 313 220 0.02
Government 109 832 228 982 499 774 0.08
High cost 60 346 253 966 694 001 0.13
Newly developing
- dense 0 268 089 877 369 0.18
- spatial 133 436 982 383 2 911 770 0.57
Kumasi, total 1 170 270 2 659 651 6 044 541 1
Nutrient demand In order to put the amount of fertilizers produced in each scenario in relation to their usefulness within the city, calculations were performed to approximate nutrient demand from urban and peri-urban agriculture (Table 4). Urban farmers cultivate approximately 70ha and the peri-urban cultivate around 12 000ha (Cornish and Lawrence, 2001 in Obuobie et al., 2006). A simplification was used for the calculations: Urban agriculture was assumed to be supplied by fertilizers generated in the dense areas, and peri-urban agriculture by fertilizers from the spatial areas. No transports were calculated for the use of fertilizers generated in respective belonging area. This rough assumption was based on the fact that many of the spatial residential areas are located in the outskirts of the city, and many of the dense areas are located in the central parts. Due to the increasing crowding within Kumasi, urban agriculture area has been assumed not to increase in the future, while peri-urban agriculture has been thought to increase with population and following food demand. Picturing a denser peri-urban area with an increased land pressure compared to the current situation, farming activities were assumed to gradually move to rural locations. For these reasons, future peri-urban agricultural area has been calculated with a growth rate of 2%. Nutrient demand was estimated from figures of present fertilizer use in Kumasi found in Drechsel et al. (2004). Considerable amount of manure is added to cover for the nutrient depletion caused by intensive cultivation. Cabbage is often harvested three times per year, and spring onions and lettuce seven or eight times (ibid). Fallow is rare, especially in urban agriculture, crop residues often removed, and leakage of nutrients prevailing on often sandy soils.

26
Table 4 Nutrient demand for the two time horizons
Nutrient N P
Fertilizer demand [kg/ ha yr]1 1000 280
Fertilizer demand urban agriculture 2015 [kg/yr] 1,2
70 000 19 600
Fertilizer demand peri-urban agriculture 2015 [kg/yr] 1,2
16 200 000 4 550 000
Fertilizer demand urban agriculture 2030 [kg/yr] 1,2
70 000 19 600
Fertilizer demand peri-urban agriculture 2030 [kg/yr] 1,2
21 800 000 6 120 000
1Fertilizer demand, estimated from data in Drechsel et al. (2004) 2Cornish and Lwrence (2001) in Obuobie et al. (2006)
Transports Estimate calculations were performed to quantify transports needed to transfer redundant material out of the city for the different scenarios. The peri-urban zone has a radius of approximately 40km (Obuobie, et al. 2006) and the urban area a radius of just over 10km (Figure 9). From these figures average distances were estimated (Table 5). To calculate road kilometers, a 14 ton truck was assumed to be used for all transports.
Table 5 Transport distances for the two time horizons
Transport route 2015 2030
Urban to rural [km] 50 70
Peri-urban to rural [km] 30 50
4.2 CONSTRUCTING THE MODEL
4.2.1 MFA
The scenarios were modelled one by one in three separate MATLAB Simulink model files (Appendix 4, 5 and 6). Each process was represented by a MATLAB function implemented in an m-file, which was called for from a MATLAB function block in Simulink (Figure 15). The ORWARE-vector is a 43x1 vector containing figures representing masses of different substances (Appendix 3). The MATLAB functions have been programmed to alter the masses of the substances in the incoming ORWARE-vector in accordance to the process in question. The process can have several outputs, and the summarized masses of these must equal the mass of the input to the process, hence following the approach of mass balancing. The subsystem for the anaerobic digestion has been chosen to illustrate the modelling:

27
Figure 15 Anaerobic digester subsystem. The input vector contains masses of the substances in human excreta and flushwater. The process files transform the incoming substances and locate them to one of the outputs: sludge or biogas. Parts of the organic carbon become carbon dioxide and methane, and parts leave the digester with the sludge. Transfer coefficients specify the fraction of each incoming substance to form a new one, or to remain unaffected. A full list of the transfer coefficients used in the three models can be found in Appendix 2, and all ingoing data is placed in Appendix 1. Appendix 8 contains all function equations for the MATLAB Function Digester (Figure 15), represented by the thereto belonging m-file.
4.2.2 LCA
The impact category Eutrophying effect, taken from LCA methodology, has been applied on the outgoing data from the MFA. The eutrophication equivalents used for the calculations is attached in Appendix 7.
4.2.3 Simplifications
The C/N ratio in human excreta is not beneficial for composting, but with addition of organic material with higher C/N ratio, e.g. kitchen/garden waste, the process efficiency increases. To be able to compare the outgoing products stemming from human excreta only, the composting has been modeled as if the C/N ratio had been improved by additives, but actually only including the matter from excreta in the mass balance.
4.3 SIMULATIONS
4.3.1 Model results
System overview: the urine diversion scenario The toilets modeled in the urine diverting scenario are all dry, why greywater is the only contributor of nutrients to surface waters. Nitrogen and organic material are lost, mainly to the atmosphere, during composting, dehydration and urine handling. Groundwater contamination stems mainly from greywater (Table 8).
Biogas
3
AirEm
2
Sludge
1
Utilized
-K-
Leaked
-K-
Digester
MATLAB
FunctionExcreta
1

28
Figure 16 and Figure 17 presents the results from time horizon 2015 and 2030 respectively. Due to population growth, the total emissions for 2030 were larger than for 2015, but the relationship between the different sinks was similar for the two time horizons.
Figure 16 End location for organic carbon, phosphorus and nitrogen in the urine diversion scenario (2015).
Figure 17 End location for organic carbon, phosphorus and nitrogen in the urine diversion scenario (2030).
Organic carbon Phosphorous Nitrogen0
0.5
1
1.5
2
2.5
3
3.5
4
4.5
x 104
Ton
s/ye
ar
Suface waterAirReuseGround waterSoil
Organic carbon Phosphorous Nitrogen0
0.5
1
1.5
2
2.5
3
3.5
4
4.5
x 104
Ton
s/ye
ar
Suface waterAirReuseGround waterSoil

29
System overview: the biogas scenario Much of the organic material ended up in the air category due to the production of carbon dioxide and methane during anaerobic digestion. Surface waters received larger amounts of all substances compared to the urine diversion scenario, to a large extent as a consequence of discharged treated effluents from the biogas reactors. Reuse of nutrients is possible through application of composted sludge from the effluent treatment. Groundwater contamination sources were similar to the urine diversion scenario (Table 8). The results for 2015 are presented in Figure 18 and the results for 2030 in Figure 19. Note that the air category in the two figures contains both collected and leaked gas.
Figure 18 End location for organic carbon, phosphorus and nitrogen in the biogas scenario (2015).
Figure 19 End location for organic carbon, phosphorus and nitrogen in the biogas scenario (2030).
Organic carbon Phosphorous Nitrogen0
1
2
3
4
5
6
7x 10
4
Ton
s/ye
ar
Suface waterAirReuseGround waterSoil
Organic carbon Phosphorous Nitrogen0
1
2
3
4
5
6
7x 10
4
Ton
s/ye
ar
Suface waterAirReuseGround waterSoil

30
System overview: the waterborne scenario The anaerobic digestion occurring in WSP’s caused high amounts of organic carbon in the air category. A comparison of Figure 20 and Figure 21 reveals some changes between 2015 and 2030 for the waterborne scenario. A smaller fraction of the population uses septic tanks in 2030, while a larger fraction is connected to WSP’s. This resulted in smaller relative soil and groundwater sinks, and higher relative surface water sinks.
Figure 20 End location for organic carbon, phosphorus and nitrogen in the waterborne scenario (2015).
Figure 21 End location for organic carbon, phosphorus and nitrogen in the waterborne scenario (2030).
Organic carbon Phosphorous Nitrogen0
0.5
1
1.5
2
2.5
3
3.5
4x 10
4
Ton
s/ye
ar
Suface waterAirReuseGround waterSoil
Organic carbon Phosphorous Nitrogen0
0.5
1
1.5
2
2.5
3
3.5
4x 10
4
Ton
s/ye
ar
Suface waterAirReuseGround waterSoil

31
Eutrophying effect At one extreme, no treated effluent from biogas reactors and WSP’s was assumed to be reused, resulting in the largest eutrophying effect for the biogas scenario. At the other, all wastewater was assumed to be reused in a manner where none of its eutrophying components reached surface waters. In this case, the urine diversion scenario had the highest effect. Only small changes in the relation between the scenarios’ eutrophying effects could be seen between the two time horizons (Figure 22 and Figure 23). The contributing factors for each scenario (for the no-reuse case) for time horizon 2015 have been summarized in Table 6.
Figure 22 Eutrophying effect for all scenarios (2015). The lower stacks represent full reuse of WSP/ treated digester effluent and the higher ones represent no reuse.
Figure 23 Eutrophying effect for all scenarios (2030). The lower stacks represent full reuse of WSP/ treated digester effluent and the higher ones represent no reuse.
Urine diversion Biogas Waterborne0
1
2
3
4
5
6x 10
8
O2
equi
vale
nts
No reuse wastewaterMaximum reuse wastewater
Urine diversion Biogas Waterborne0
1
2
3
4
5
6x 10
8
O2
equi
vale
nts
No reuse wastewaterMaximum reuse wastewater

32
Table 6 Eutrophying effect and sources for all three scenarios (2015) Eutrophying effect [ton O2 eqv/yr]
Contributing factor [%]
Urine diversion scenario 92 700
Organic material, P and N to surface waters 70
NH3 to air 30
Biogas scenario 206 100
Organic material, P and N to surface waters (digester effluent) 61
Organic material, P and N to surface waters (all other) 31
NH3 to air 7
Waterborne scenario 107 110
Organic material, P and N to surface waters (WSP effluent) 56
Organic material, P and N to surface waters (all other) 19
NH3 to air 25
Reuse potential in dense areas The relatively small agricultural areas existing within the urban area showed a demand for nutrients much smaller than the generated. The discrepancy was larger for 2030 than for 2015 (Figure 24 and Figure 25).
Figure 24 Produced nitrogen and phosphorus available for fertilizing and soil nutrient demand within the dense areas (2015).
Nitrogen Phosphorous0
500
1000
1500
2000
2500
3000
Ton
s/ye
ar
Urine diversionBiogasNutrient demand

33
Figure 25 Produced nitrogen and phosphorus available for fertilizing and soil nutrient demand within the dense areas (2030).
Reuse potential in spatial areas In the spatial category the nutrient need exceeded the produced for both nitrogen and phosphorus. Larger part of the need was covered in 2030 than in 2015 (Figure 26 and Figure 27).
Figure 26 Generated nitrogen and phosphorus and soil nutrient demand within the spatial areas. Rear stacks include nutrients in WSP/treated anaerobic digester effluent (2015).
Nitrogen Phosphorous0
500
1000
1500
2000
2500
3000
3500
4000
4500
Ton
s/ye
ar
Urine diversionBiogasNutrient demand
Nitrogen Phosphorous0
0.5
1
1.5
2
x 104
Ton
s/ye
ar
Urine diversionBiogasWaterborneNutrient demand

34
Figure 27 Generated nitrogen and phosphorus and soil nutrient demand within the spatial areas. Rear stacks include nutrients in WSP/treated anaerobic digester effluent (2030).
Reuse potential all areas Looking at the whole city, the total nutrient need was larger than the generated amounts for both nitrogen and phosphorus, with a smaller deficiency in 2030 than in 2015 (Figure 28 and Figure 29).
Figure 28 Generated nitrogen, phosphorus and organic carbon compared to soil nutrient demand for Kumasi (2015).
Nitrogen Phosphorous0
0.5
1
1.5
2
x 104
Ton
s/ye
ar
Urine diversionBiogasWaterborneNutrient demand
Total organic carbon Nitrogen Phosphorous0
0.5
1
1.5
2
2.5
3
3.5
4
4.5
x 104
Ton
s/ye
ar
Urine diversionBiogasWaterborneNutrient demand

35
Figure 29 Generated nitrogen, phosphorus and organic carbon compared to soil nutrient demand for Kumasi (2030).
Transports Transports needed to transfer the redundant material out of the city in each scenario were calculated as kilometers to be driven (turn-return) (Figure 30 and Figure 31). The weight of needed material was calculated from the limiting nutrient, hence giving a surplus amount of the other. Note that transports within each system (e.g. from WSP to compost site) were not included.
Figure 30 Transports needed to transfer redundant material out of the city in the three scenarios (2015).
Total organic carbon Nitrogen Phosphorous0
0.5
1
1.5
2
2.5
3
3.5
4
4.5
x 104
Ton
s/ye
ar
Urine diversionBiogasWaterborneNutrient demand
Urine diversion Biogas Waterborne0
1
2
3
4
5
6
7x 10
6
Km
/yea
r

36
Figure 31 Transports needed to transfer redundant material out of the city in the three scenarios (2030).
To put the calculated increase in transports between 2015 and 3030 in relation to the population growth, transports per capita were calculated for the two time horizons (Table 7). A slight increase in transports per capita could be seen for the urine diversion scenario.
Table 7 Transports per capita 2015 and 2030 Transports
urine diversion scenario [km/person yr]
Transports biogas scenario [km/person yr]
Transports waterborne scenario [km/person yr]
2015 1.16 0.06 0.00
2030 1.19 0.06 0.00
Water use The total amount of water used for household purposes (greywater, blackwater) was compared to the amount of water available for reuse for the three scenarios (Figure 32 and Figure 33). The waterborne scenario demanded most water, but was also the scenario with the highest reuse potential.
Urine diversion Biogas Waterborne0
1
2
3
4
5
6
7x 10
6
Km
/yea
r

37
Figure 32 Water use and reuse potential for the three scenarios (2015).
Figure 33 Water use and reuse potential for the three scenarios (2030).
Groundwater contamination In the urine diversion and the biogas scenarios greywater appeared as the most important contributor to groundwater pollution (Table8). In the waterborne scenario about half of the nitrogen and the phosphorus and about one fifth of the organic carbon originated from septic tanks.
Urine diversion Biogas Waterborne0
2
4
6
8
10
12
14
16x 10
7
Ton
s/ye
ar
Water useReuse potential
Urine diversion Biogas Waterborne0
2
4
6
8
10
12
14
16x 10
7
Ton
s/ye
ar
Water useReuse potential

38
Table 8 Groundwater contamination and sources for the three scenarios (2015)
TOC N P
Urine diversion scenario
To groundwater [ton/yr] 1217 208 92
From greywater [%] 74 93 99
From compost leachate [%] 26 7 1
Biogas scenario
To groundwater [ton/yr] 1016 219 92
From greywater [%] 88 88 98
From compost leachate [%] 12 12 2
Waterborne scenario
To groundwater [ton/yr] 2575 1504 153
From septic tanks (incl drain fields) [%] 23 52 46
Other wastewater streams [%] 77 48 54
Produced biogas The produced and collected amount of biogas, measured in volume methane, was 7.2*106 m3 in the dense areas and 8.8*106 m3 in the spatial areas for 2015, and 11.7*106 m3 in the dense areas and 24.7*106 m3 in the spatial areas for 2030.
Land requirements Anaerobic digesters are constructed underground, and even with the effluent treatment they do not require much space. Composting has larger space demand, but the technique with absolute largest land requirement is waste stabilization ponds. Estimate calculations were performed to approximate the amount of land required if all wastewater treatment would rely on WSP’s (Table 9). A 15km radius of the urban zone was assumed and the projected population in dense areas assigned to it. The projected population in the spatial areas was assigned to a zone with a radius of 40km surrounding the urban area. Table 9 Land requirements for WSP's. (2015)
Land requirement [m2/cap]1
Total land requirement [km2]
% of total area
Inner zone, dense areas, 2015 7 8.4 2.7
Outer zone, spatial areas, 2015 7 10.3 0.2
Inner zone, dense areas, 2030 7 13.6 3.0
Outer zone, spatial areas, 2030 7 28.7 0.6 1 Estimations based on data in Alexiou and Mara (2003).

39
4.3.2 Sensitivity analysis
Sensitivity analysis performed for the three scenarios are presented in Table 10, Table 11, and Table 12. All model parameters and ingoing data were altered +/- 5%, one by one, keeping all other parameters constant. The parameters presented are the ones whose altering gave the largest changes in the chosen evaluation variables. A large change indicates an important parameter, and hence uncertainty in the parameter value contributes much to the total model uncertainty in relation to other parameters.
Table 10 Sensitivity analysis for the urine diversion scenario Altered parameter [+5%/-5%]
Explanation Eutrophying effect [%]
Reuse potential N [%]
Reuse potential P [%]
Reuse potential TOC [%]
Transports [%]
Model
parameters
Urcoll Fraction of urine collected
+3.9/-3.9
LCCtogas Cto gas in compost
-4.5/+4.5
LCNtogas N to gas in compost
Gwfractogut-dense
Fraction of greywater to gutters
+2.0/-2.0
Gwfractogut-filtspat
Fraction of greywater in spatial areas to gutters or flow filter
+1.4/-1.4
Gwfracfilt-spat
Fraction flowfilters
-1.5/+1.5
Gwleakgut Fraction of water leaking from gutters
-0.9/+0.9
Indata
Urine Kg urine/p yr +1.2/-1.2 +4.5/-4.5
Nu Kg N in urine/p yr
+1.2/-1.2 +4.3/-4.3
TOCu TOC in urine/p yr
+1.2/-1.2
Faeces Kg faeces/p yr +3.7/-3.7
Pf Kg P/p yr +1.6/-1.6
Pgw Kg P/p yr +2.7/-2.7

40
Table 11 Sensitivity analysis for the biogas scenario Altered parameter [+5%/-5%]
Explanation Eutrophying effect [%]
Reuse potential N [%]
Reuse potential P [%]
Reuse potential TOC [%]
Transports [%]
Model
parameters
BGETPred -1.4/+1.4 +5.0/-5.0
BGETNred -1.2/+1.2 +5/-5
BGETDMred +6.7/-6.7
BGETTOCred +5.0/-5.0
Gwfracto-gutdense
+1.0/-1.0
LCCtogas -5.0/+5.0
LCNtogas -2.2/+2.2
Indata
Urine +2.3/-2.3
Nu +1.7/-1.7 +4.4/-4.4
Pu +3.2/-3.2
Faeces +4.2/-4.2 +2.5/-2.5
Pf +1.6/-1.6
TOCf +4.2/-4.2
Pgw +1.3/-1.3
Table 12 Sensitivity analysis for the waterborne scenario Altered parameter [+5%/-5%]
Explanation Eutrophying effect [%]
Reuse potential N [%]
Reuse potential P [%]
Reuse potential TOC [%]
Transports [%]
Model
parameters
STTOCred +0.9/-0.9
SEWgwto-sewspat
+1.0/-1.0
WSPNtotred -1.9/+1.9 +4.6/-4.6
WSPPtotred -1.4/+1.4 +1.7/-1.7
RFPtotrem -1.1/+1.1 +1.4/-1.4
LCNtogas -2.2/+2.2
LCCtogas -5.8/+5.8
Indata
Urine
Nu +1.9/-1.9 +3.7/-3.7
Pu +1.9/-1.9
Faeces +3.8/-3.8
TOCf +3.7/-3.7
Pgw +1.4/-1.4 +2.2/-2.2

41
5 DISCUSSION AND CONCLUSIONS
5.1 SIMULATION RESULTS
5.1.1 Comparing scenarios
Eutrophying effect According to the results, the eutrophying effect for the biogas and the waterborne scenarios fluctuate largely with the level of utilization of the effluents. When assuming the release of all effluents into surface waters, the urine diversion system appeared as the least eutrophying system. Today, many of the urban and peri-urban farmers in Kumasi apply polluted stream water for irrigation. If a good effluent quality from WSP’s and digester effluent treatment could be guaranteed, this water might be a favorable option for many farmers. This would reduce the eutrophying effect and increase nutrient reuse. However, if ponds and effluent treatment fail to function, or are not maintained properly, the use of their effluents could be of great health concern. Reuse potential All systems generated considerable amounts of nutrients available as fertilizers. The urine diversion scenario generated most nitrogen, while the waterborne scenario made reuse of the largest amounts of phosphorus possible. In the dense areas, the problem appeared not to be safeguarding nutrient needs, but rather to dispose the redundant material. In the spatial areas however, nutrient generation was lower than what was demanded for. The division based on coupling of spatial residential areas with peri-urban agriculture, and dense residential areas with urban agriculture made for the calculations may be somehow artificial. However, it reflects the limited possibilities of agriculture within dense areas, as well as the possibilities for farming and back yard farming in the spatial areas. The urine diversion scenario created much more redundant mass than the other scenarios, while the waterborne presented the lowest figures. WSP’s are appreciated for their relatively low generation of sludge, but also, the choice to locate the sludge composting in the spatial areas contributed to the low transport needs. Only the transports of the end product out of the city have been accounted for, and not the ones within the city: from ponds to compost site. The urine diversion scenario enables separate use of treated faeces and urine, while the calculations were performed only for an “average” product (50/50). Increased use of urine and decreased use of faeces, piped collection of urine, or partially local urine treatment e.g. in reed beds, are a few examples of alternative solutions that would lower the transport needs. Looking at the whole city, nutrient generation was lower than the demand for all scenarios in both time horizons. Even though the reuse of nutrients in dense areas is limited, fertilizers generated here could be useful in peri-urban agriculture. If this is a favorable option or not must be evaluated taking also other factors into account.
Water use The waterborne system required almost twice as much water as the other two systems. An average flush volume of 30L/cap,day was used in the simulations. This figure represents a nearly 50/50 distribution between old-fashioned and newer low flush
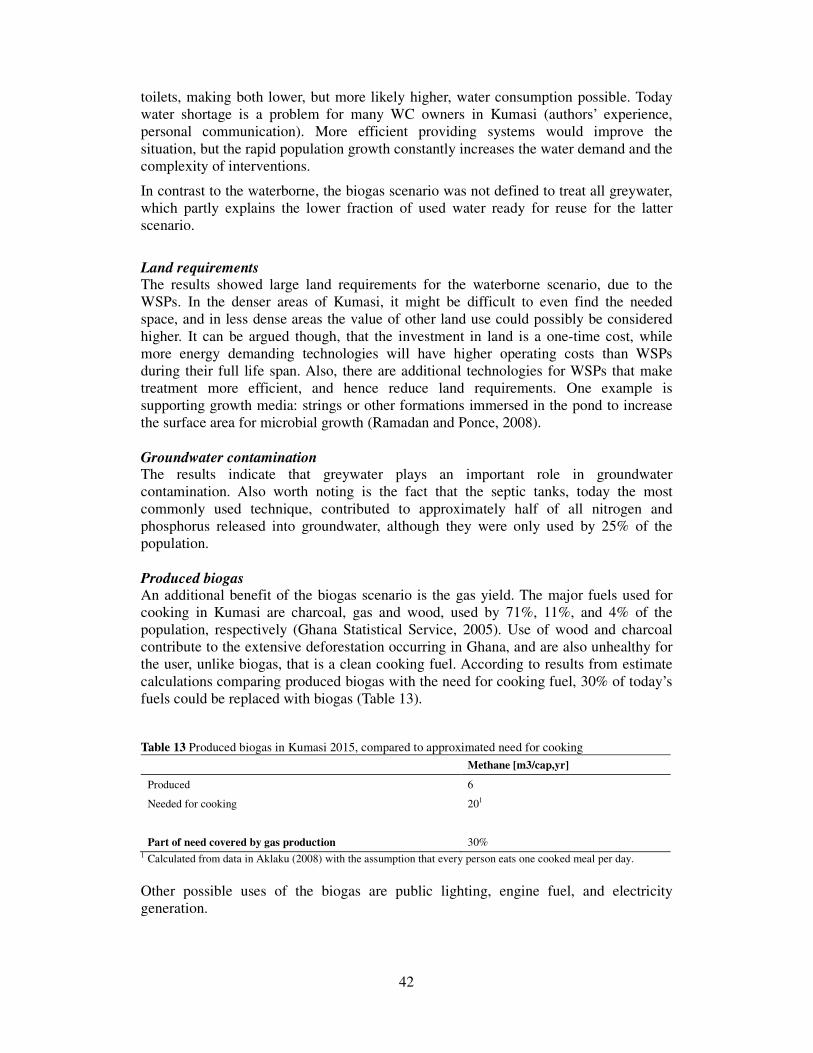
42
toilets, making both lower, but more likely higher, water consumption possible. Today water shortage is a problem for many WC owners in Kumasi (authors’ experience, personal communication). More efficient providing systems would improve the situation, but the rapid population growth constantly increases the water demand and the complexity of interventions.
In contrast to the waterborne, the biogas scenario was not defined to treat all greywater, which partly explains the lower fraction of used water ready for reuse for the latter scenario.
Land requirements The results showed large land requirements for the waterborne scenario, due to the WSPs. In the denser areas of Kumasi, it might be difficult to even find the needed space, and in less dense areas the value of other land use could possibly be considered higher. It can be argued though, that the investment in land is a one-time cost, while more energy demanding technologies will have higher operating costs than WSPs during their full life span. Also, there are additional technologies for WSPs that make treatment more efficient, and hence reduce land requirements. One example is supporting growth media: strings or other formations immersed in the pond to increase the surface area for microbial growth (Ramadan and Ponce, 2008). Groundwater contamination The results indicate that greywater plays an important role in groundwater contamination. Also worth noting is the fact that the septic tanks, today the most commonly used technique, contributed to approximately half of all nitrogen and phosphorus released into groundwater, although they were only used by 25% of the population. Produced biogas An additional benefit of the biogas scenario is the gas yield. The major fuels used for cooking in Kumasi are charcoal, gas and wood, used by 71%, 11%, and 4% of the population, respectively (Ghana Statistical Service, 2005). Use of wood and charcoal contribute to the extensive deforestation occurring in Ghana, and are also unhealthy for the user, unlike biogas, that is a clean cooking fuel. According to results from estimate calculations comparing produced biogas with the need for cooking fuel, 30% of today’s fuels could be replaced with biogas (Table 13). Table 13 Produced biogas in Kumasi 2015, compared to approximated need for cooking
Methane [m3/cap,yr]
Produced 6
Needed for cooking 201
Part of need covered by gas production 30%
1 Calculated from data in Aklaku (2008) with the assumption that every person eats one cooked meal per day.
Other possible uses of the biogas are public lighting, engine fuel, and electricity generation.

43
Other environmental impacts and possible expansion of the model The study did not present a full environmental evaluation of the scenarios. The following section presents two additional impact categories of interest. Global warming potential is another LCA impact category that could be applied to the scenarios. The calculated transports in this thesis pointed out the waterborne scenario as the most favorable choice. However, the construction of the components, as well as laying out the system itself, would likely be much more energy consuming than for the other scenarios. Also, even though transport in sewers could be driven mainly by gravity, pumps are likely to be necessary at places. WSPs release considerable amounts of methane from the anaerobic ponds. The gas can be collected, but if not, it contributes to global warming, and so does leaked gas from anaerobic digesters. Air emissions from transports, anaerobic digesters, WSP’s and composts contribute to acidification. Many of the soils in the region are classified as “slightly” or “extremely” acid by the Soil Research Institute (Adu, 1992), why also this category could be of relevance.
5.1.2 Comparing time horizons
The most important differences between the two time horizons were the amounts of people living in dense/spatial areas, and the relation population-cultivated land. Local reuse showed to be a good option only for the outer parts of the city, while most generated material from the urban areas had to be transported for both time horizons. A decrease in farmland per capita was assumed with continued population growth, making the benefits of locally available fertilizers from excreta less valuable with time. However, the differences between the two time horizons were only moderate under the chosen conditions.
5.1.3 Alternative systems
The definition of the two EcoSan scenarios, biogas and urine diversion, aimed at local reuse of nutrients. In the urban dense areas, where nutrient demand did not meet the produced amounts of nitrogen and phosphorus, other systems, or modification of the chosen ones, might be more suitable. Urine diverting toilets are still cheap, water saving alternatives to WC’s. Piped collection of urine and collection of only the dehydrated faeces could save transports. Production of dry fertilizers, e.g. struvite, might be a feasible option in the future (Ganrot et al., 2007). For the biogas scenario, an option to provide adequate amounts of fertilizers to the urban farmers could be digester-connected public toilets, and other sanitation techniques for private toilets. Hospitals, schools, municipal institutions etc could also be suitable locations for biogas plants, providing the users with cheap energy. WSP’s could be combined with other wastewater treatment technologies where land is deficient or too expensive. These are just a few examples of many possible. Looking at a whole city like Kumasi, the most likely scenario might consist of a combination of different techniques, suited for different areas.

44
5.1.4 Conclusions
• The local nutrient reuse approach of the urine diversion and the biogas scenario did not appear applicable to the denser localities, but might be a feasible option in more spatial areas, where farms and back yard cultivation are more common. Biogas plants could still be a favorable option for public toilets, schools etc in the urban area.
• The waterborne scenario was associated with a high water consumption, but with lower transport needs than the two other scenarios.
• The eutrophying effect was highly dependent on the amount of effluent water that was disposed of to surface waters/was reused. Urine diversion had the lowest effect when total discharge was assumed, while the waterborne scenario, much due to the full inclusion of greywater in the treatment, had potential for the lowest effect if effluents were fully reused.
• The future city development is an important factor for the choice of sanitation systems. Continued practice of urban and peri-urban agriculture gives reason for at least partly local-reuse-oriented systems, while decrease of agriculture within the city area might speak in favor of more centralized solutions.
5.2 UNCERTAINTIES
5.2.1 Ingoing data and model parameters
Input data and model parameters have been determined mainly by consulting literature and experts. Performance of some of the chosen technologies is not well documented, and some of them are mainly studied under different conditions than the prevailing on the study site. Also figures of population, areas, waste generation etc. in Kumasi were either of poor quality, old, or lacking. Many parameters have been estimated based on one, or when possible several, literature sources. This has resulted in uncertainties that are difficult to quantify. Sensitivity analysis presents an option to identify important parameters, hence points out the parameters whose uncertainty it should be attempted to minimize. And if this is not possible, it still gives an indication to where the weaknesses of the model lie.
Sensitivity analysis None of the model parameters or the input data gave large changes in model results when varied, which indicates a certain stability of the model. Overall, the ingoing site- specific data showed some influence on model results. The variation of generated urine, faeces, and greywater, as well as their nutrient and organic matter content resulted in relatively large altering in outgoing values. Greywater parameters, both the nutrient content and the disposal parameters, showed influence on the eutrophying effect for the urine diverting system. The disposal parameters were all estimated, and were considered to be very uncertain (Appendix 2), hence contributed much uncertainty to the urine diversion simulation results. Another implication of the parameters importance is that a lowering of the phosphorus concentrations in greywater, by decreased use of phosphate-containing detergents, might cause significant decrease of the eutrophying effect. The phosphorus content in greywater was an important factor also in the two other scenarios.

45
Many of the important parameters in the biogas scenario belong to the digester effluent treatment submodel. These results are in line with the large variations in eutrophying effect seen when varying the amount of effluent water utilized/discharged. Further, this indicates that the implementation of a more efficient effluent treatment could lead to significant improvement in the scenarios’ environmental behavior. The eutrophying effect and the reuse potential of nitrogen and phosphorus in the waterborne scenario were mainly influenced by the nitrogen and phosphorus removal in the WSP’s.
5.2.2 System maintenance
The level of accurate operation and maintenance of components is a large contributing factor in system performance. Sanitation systems are closely linked to cultural behavior, opinions, and economical factors, why additional uncertainty to model results stem from the unknown future behavior of users and operators.
5.3 HEALTH SECURITY
The most important function of a sanitation system is to prevent the spreading of diseases. Pathogen die-off was not quantitatively modeled in this project, but the general behavior of the different systems studied.
The mechanisms controlling pathogen die-off in composting and dehydrating toilets have not yet been fully investigated (Austin, 2006; Peasly, 2000). According to some studies, both techniques enable safe use of faeces after 3-12 months, while some experts claim that secondary treatment always is necessary. Hence, the topic needs further attention before any certain conclusions can be drawn.
One advantage with biogas-connected toilets is that no direct handling of excreta is needed. The biogas digester does not produce a pathogen free sludge unless temperature reaches the thermophilic range for a certain time. The quality of the effluents in small-scale, unheated plants therefore depends on secondary treatment of the sludge. This is also an area where research has been limited this far. One example of a system that secures pathogen die-off is the effluent treatment (sedimentation, active coal filter and UV radiation) used by the Indian organization Sulabh at their public toilets (Jha, 2005).
Waste stabilization ponds can reduce pathogen concentrations considerably if they are designed and operated appropriately.
5.4 FEASABILITY OF THE SCENARIOS
The implementation of the defined systems before 2015 was not considered likely, this time horizon was rather used to investigate changes over time (between the 2015 and the 2030 horizon). 2030 was assumed to be a more realistic horizon, regarding time span only. There are however, a number of other factors worth discussing: economic growth, political agendas, building of institutional strength, cultural habits and taboos among others.

46
The land in the Ashanti region is traditionally owned by the community of the Asantenes (the ancestors, the ones that live, and the ones yet to be born), and cannot be owned by any individual, rather only be used within one’s lifetime (Corubolo and Mattingly, 1999). The land is being looked after by some 100 local chiefs acting under the Asantene king. The king and the old land tenure habits have been highly respected, and illegal squatting have often been reported by neighbors (Sinai, 2001). However, commercial interests of “corrupt” chiefs have in the last decades resulted in land being sold, with severe economic consequences for them traditionally using it. The lowered respect for the traditional system, together with intense migration have with time given rise to slums and other new settlements in the city outskirts (KMA, 2008b). The city has little influence over the development in these localities, and residential areas rise without general planning, making following implementation of infrastructure very complicated (Sinai, 2001). Defining responsibilities and building institutions for city and infrastructure planning is essential for solving the sanitary problems in the city. Keraita et al. (2003) stated that it is the KMA’s responsibility to ensure future planning of residential areas that lay ground for decentralized sanitation systems. They further point that solving the problems in the already existing overcrowded areas is a very complex task.
The defined systems in this thesis all suggest reuse of nutrients within the urban and peri-urban area. Today, manure is mostly used for fertilization, only nearly 2% of nitrogen and phosphorus applied on peri-urban land stems from chemical fertilizers (FAO, 2004b in Crawford et al. (2006)). Poultry farms are numerous in the region, and cheap poultry manure is the major fertilizer used. The request for the manure has increased, but these practices may still be a great hinder against the promotion of fertilizers from human excreta. Alternatively, the generated fertilizers could be an appreciated complement to manure when population and food demand increase.
Another concern with the EcoSan systems is that they demand higher user participation than for example waterborne systems, hence their performance depends much on user behavior. There is risk that, if for example compost and dehydrated faeces are dumped in surface waters, the new system might actually worsen the situation instead of improving it.
Around 16% of the population in Kumasi are Muslims, of which many practice anal cleansing after defeacation, they are so called “washers” (Ghana Statistical Service, 2005). For the biogas and the waterborne system, this does not require any modifications. Urine diversion toilets must however be adjusted so that cleansing water is separated from urine and faeces. Many designs for this application already exist (Winblad and Simpson Hebért, 2004).
Cultural taboos against using human excreta as fertilizers could hinder the implementation of EcoSan systems. However, Danso et al. (2003) investigated people’s perceptions in urban areas in Ghana, and concluded that the unwillingness of utilizing excreta was not the limiting factor in implementing source separating sanitation systems with reuse of nutrients.

47
6 REFERENCES
Adu, S. V., (1992). Soils of the Kumasi Region, Ashanti Region, Ghana. Soil Research Institute (Council For Scientific And Industrial Research), Kumasi, Ghana. AGAMA Energy, (2007). Biogas Technology: delivering Ecological Sanitation and Renewable Energy. Agama Energy. Aklaku, E., (2008). Biogas technology and applications in developing countries. Lecture notes. Aklaku, E. D., Jones, K., Obiri-Danso, K., (2006). "Integrated Biological Treatment and Biogas Production in a Small-Scale Slaughterhous in Rural Ghana". Water Environment
Research, 78, 2335-2339.
Alexiou, G. E., Mara, D. D., (2003). “Anaerobic Waste Stabilization Ponds. A Low-Cost Contribution to a Sustainable Wastewater Reuse Cycle”. Applied Biochemistry and
Biotechnology, Vol. 109, 241-252. Austin, L. M., (2006). Operational safety of urine diversion toilets in Durban, South
Africa. 32nd WEDC International Conference, Colombo, Sri Lanka. Baccini, P., Brunner, P. H., (1991). Metabolism of the Anthroposphere. Springer, New York, USA. Belevi, H., Leitzinger, C., Binder, C., Montangero, A., Strauss, M., Zurbrügg, C., (2000). Material flow analysis: a planning tool for roganic waste management in
Kumasi, Ghana. SANDEC, Duebendorf, Switzerland. Binder, C. R., (1996). The Early Recognition of Environmental Impacts of Human
Activities in Developing Countries. Abhandlung zur Erlangung des Titels Doktorin der naturwissenschaften, Eidgenoessischen technischen hochschule, Zürich, Switzerland. Brook, R., Davila, J. D., (editors), (2000). The Peri-urban Interface. A tale of Two
Cities. School of Agricultural and Forest Sciences, University of Wales, and the Development Planning Unit, University College London. Buama Ackon, S. E., (2006). Performance evaluation of Dompoase Faecal sludge
treatment plant. Unpublished M.Sc. thesis, Department of Civil Engineering, KNUST, Kumasi, Ghana. Cofie, O., Drechsel, P., Obuobie, E., Danso, G., Keraita, B., (2003). Towards the
millennium goals. Environmental sanitation and urban agriculture in Ghana.
International Water Managament Institute, West Africa Office, Ghana. Cornish, G., Mensah, E., and Ghesquire, P. (1999). Water quality and peri-urban irrigation: An assessment of surface water quality for irrigation and its implication for human health in the peri-urban zone of Kumasi, Ghana. Report OD/TN 95, DFID’s Water KAR (Knowledge and Research) Project R7132, HR Wallingford, UK. Corubolo, E., Mattingly, M., (1999). Peri-urban profiles. Kumasi. Development

48
Planning Unit, University College London. Crawford, E. W., Jayne, T. S., Kelley, V. A., (2006). “Alternative Approaches for Promoting Fertilizer Use in Africa”. Agriculture and Rural Development, Discussion Paper 22, The World Bank, Washington DC, USA. Danso, G., Drechsel, P., Gyiele, L., (2003). Urban household perception of urine-
excreta and solid waste source separation in urban areas in Ghana. 2ndinternational symposium on ecological sanitation, IWA and gtz. Devas, N., Korboe, D., (2000). ”City governance and poverty: the case of Kumasi”. Environment and Urbanization, Vol. 12, No. 1, 123-136. Drechsel, P., Giordano, M., Gyiele, L., (2004). Valuing nutrients in soil and water:
Concepts and techniques with examples from IWMI studies in the developing world.
Research Report 82. Colombo, Sri Lanka: International Water Management Institute. EcoSanRes (2008a). Closing the loop on phosphorus. http://www.ecosanres.org/pdf_files/ESR-factsheet-04.pdf (2008-10-29) EcoSanRes (2008b). The Sanitation Crisis. http://www.ecosanres.org/pdf_files/ESR-factsheet-01.pdf (2008-10-29) Energy Commission, Ghana (2006). Strategic National Energy Plan. Energy Commission, Ghana. Erni, M., (2007). Modelling urban water flows: An insight into current and future water availability and pollution of a fast growing city. Case study of Kumasi, Ghana. Unpublished M.Sc. thesis, Department Umweltwissenschaften, Eidgenössiche Technische Hochschule Zürich, Switzerland. FAO, (1992). Waste water treatment. http://www.fao.org/docrep/t0551e/t0551e05.htm#3.3%20natural%20biological%20treatment%20systems (2009-03-27) FAO, (1996). A system approach to biogas technology. http://www.fao.org/sd/Egdirect/Egre0022.htm (2009-02-10) Feit, C., (2004). http://assets.espn.go.com/i/eticket/20081113/photos/etick_cf_ghana11_850.jpg Gadogbe, E. K., (2006). Evaluation of the performance of septic tanks in new areas in
Kumasi (Ayeduase, Kantikrono, Ayigya, and Bomso). B.Sc. Thesis, Department of Engineering, KNUST, Kumasi, Ghana. Ghana Statistical Service (2005). Population and Housing Census. Ashanti Region.
Analysis of District Data and Implications for Planning. Ghana Statistical Service. Ganrot, Z., Dave, G., Nilsson, E., (2007). “Recovery of N and P from human urine by freezing, struvite precipitation and adsorption to zeolite and active carbon”.

49
Bioresources Technology, 98(16), 3112-21. Harris, (2004). http://www.vinceharris.me.uk/ghana/05-24%20hen%20in%20compound-000.jpg (2009-04-24) IRC, (2004). Waste stabilization ponds for wastewater treatment. http://www.irc.nl/page/8237 (2009-03-03) IWMI, (2008). Accra Starter Kit. International Water and Management Institute, Accra, Ghana. Jeppsson, U., Hellström, D., (2002). ”System analysis for environmental assessment of urban water and wastewater systems”. Water Science and Technology, Vol. 46, No. 6-7, 121-129. Jönsson, H., Richert Stintzing, A., Vinnerås, B., Salomon, E., (2004). Guidelines in the
Use of Urine and Faeces in Crop Production. EcoSanRes Publication Series, Report 2004-2, Stockholm Environmental Institute, Stockholm, Sweden. Keraita, B., Drechsel, P., Amoah, P., (2003). “Influence of urban wastewater on stream quality and agriculture in and around Kumasi, Ghana”. Environment & Urbanization,
Vol. 15, No. 2, 171-178. KMA (2008b). Kumasi Metropolitan Assembly. http://kma.ghanadistricts.gov.gh/ (2008-10-01) KMA, (2007a). Income levels in residential areas. Unpublished data, Statistical Office, Kumasi Metropolitan Assembly, Kumasi, Ghana. KMA, (2007b). Reports on Asafo pilot waste stabilization pond, unpublished, Waste Management Department, Kumasi Metropolitan Assembly, Ghana. KMA, (2008a). KMA Projected. Unpublished data, Statistical Office, Kumasi Metropolitan Assembly, Kumasi, Ghana. Konadu-Agyemang, K., O., (1991). ”Reflections on the Absence of Squatter Settlements in West African Cities: The Case of Kumasi, Ghana”. Urban Studies, Vol. 28, No. 1, 139-151. Korboe, D., Tipple, A. G., (1995). “City profile Kumasi”. Cities, Vol. 12, No 4, 267-274. Kossmann, W., Pönitz, U., Habermehl, S., Hoerz, T., Krämer, P., Klingler, B., Kellner, C., Wittur, W., Klopotek, F.v., Krieg, A., Euler, H., (2004). Biogas Digest. Volume I.
Biogas Basics. Isat and gtz, Germany. Kossmann, W., Pönitz, U., Habermehl, S., Hoerz, T., Krämer, P., Klingler, B., Kellner, C., Wittur, W., Klopotek, F.v., Krieg, A., Euler, H., (1999). Biogas Digest. Volume II.
Biogas – Application and Product Development. Isat and gtz, Germany.

50
Leitzinger, C., (2000). Ist eine Co-Kompostierung aus stofflicher Sicht in
Kumasi/Ghana sinnvoll?. Unpublished M.Sc. thesis, SANDEC, Eidgenoessiche Technische Hochschule (ETH), Zurich. Lindfors, L-G., Christiansen, K., Hoffman, L., Virtanen, Y., Juntilla, V., Hansen, O-J., Rønning, A. Ekvall, T. & Finnveden, G., (1995). Nordic Guidelines on Life-Cycle
Assessment. Nordic Council of Ministers. Nord 1995:20. Marchaim, U., (1992). Biogas processes for sustainable development. Food and Agriculture Organization of the United Nations, Rome, Italy. Morgan, P., (2006). Toilets That Make Compost. EcoSanRes Publication Series, Stockholm Environmental Institute, Stockholm, Sweden. Münch, E., (2008). Overview of anaerobic treatment options for sustainable sanitation
systems. Presentation from BGR Symposium “Coupling Sustainable Sanitation and Groundwater Protection”, Hannover, Germany. Obirih-Opareh, N., Van de Geest, S., (2000): Toilet and Sanitation in Ghana, an urgent
matter. Institute of Scientific and Technological Information, Accra, Ghana.
Obuobie, E., Keraita, B., Danso, G., Amoah, P., Cofie, O. O., Raschid-Sally, L., and P. Drechsel (2006). Irrigated urban vegetable production in Ghana: Characteristics,
benefits and risks. IWMI-RUAF-CPWF, Accra. ORWARE, (2000). http://www.ima.kth.se/im/orware/Swedish/index.htm (2009-04-18) Owuso-Addo, F., (2006). Evaluation of the performance of septic tanks in built-up areas
(Adum-Kumasi as Case Study). BSc Thesis, Department of Engineering, KNUST, Kumasi, Ghana. Peasey, A., (2000). Health aspects of dry sanitation with waste reuse. Task no. 324, WELL, London School of Hygiene and Tropical Medicine, London, the UK. Ramadan, H., Ponce, V. M., (2008), San Diego State University. Design and Performance of Waste Stabilization Ponds. http://stabilizationponds.sdsu.edu/ (2009-02-26) Ridderstolpe, P., (2004). Introduction to Greywater treatment. EcoSanRes Publication Series, Report 2004-4, Stockholm Environmental Institute, Stockholm, Sweden. Rose, G. D., (1999). Community-Based Technologies for domestic Wastewater Treatment and Reuse: options for urban agriculture. Cities Feeding People, CFP Report Series, Report 27. Salifu, L., (2008). Planning for Sustainable Sanitation in Cities. Clean towns: progress and prospects of strategic sanitation planning in Ghana. Presentation from the 2008

51
World Water Week in Stockholm (combined with personal communication). Schönning, C., Stenström, T. A., (2004). Guidelines for the Safe Use of Urine and
Faeces in Ecological Sanitation Systems. EcoSanRes Publications, Report 2004-1, Stockholm Environmental Institute, Stockholm, Sweden. Sida, (2008). http://www.Sida.se (2008-07-28) Simon, D., Nsiah-Gyabaah, K., Warburton, H., Adu-Gyamfi, V., McGregor, D., (2001). The Changing urban-rural interface of African cities: conceptual issues and an
application to Kumasi, Ghana. Centre for Developing Areas Research (CEDAR), Dept. of Geolography, Royal Holloway, University of London, EGHAM, Surrey. Sinai, I., (2001). “Moving or Improving: Housing Adjustment Choice in Kumasi, Ghana.” Housing Studies, Vol. 16, N. 1, 97-114. Suraj, M., (2004). Urbanisation and Water Resources Vulnerability in the Kumasi Metropolitan Area, Ghana. Department of Water and Environmental Studies, Linköping University. SuSanA, (2008). Sustainable sanitation for cities. http://www.susana.org/images/documents/05-working-groups/wg06/final-docs/en-susana-thematic-paper-WG06-cities-version-1.2.pdf (2009-02-11) Tettey-Lowor, F., (2008). Closing the loop between sanitation and agriculture in Accra, Ghana. (Improving yields in urban agriculture by using urine as a fertilizer and drivers &barriers for scaling-up). Wagening University, The Netherlands. The environmental and energy blog (2008). http://blogs.tnr.com/tnr/blogs/environmentandenergy/biogas_digester_sm.gif (2009-05-18) The World Bank (2008). http://web.worldbank.org/WBSITE/EXTERNAL/DATASTATISTICS/0,,contentMDK:20421402~pagePK:64133150~piPK:64133175~theSitePK:239419,00.html#Low_income (2008-10-01) Tilley, E., Lüthi, C., Morel, A., Zurbrügg, C., Schertenlieb, R., (2008). Compendium of Sanitation Systems and Technologies. Eawag aquatic research. http://www.eawag.ch/organisation/abteilungen/sandec/publikationen/compendium (2009-04-22) Tipple, A. G., Korboe, D., Willis, K., Garrod, G., (1998). ”Who is bulding what in urban Ghana? Housing supply in three towns”. Cities, Vol. 15, No. 6, 399-416. Tipple, G. A., (1982). Housing in Kumasi. A survey of households in low income areas.
Department of Planning, University of Science of Technology, Kumasi, Ghana. Tipple, G. A., Korboe, D., Garrod, G., Wills, K., (1999). ”Housing Supply in Ghana: a

52
study of Accra, Kumasi and Berekum.” Progress in Planning. Vol. 51, Issue 4, 255-324. UN Water (2008). Tackling a global crisis. International Year of Sanitation 2008, http://esa.un.org/iys/docs/IYS_flagship_web_small.pdf (2008-09-19) Winblad, U., Simpson-Hébert, M., (editors), (2004). Ecological sanitation - revised and
enlarged edition. SEI, Stockholm, Sweden. Zhao, Q., Wang, B., (1996). “Evaluation on a pilot-scale attached-growth pond system treating domestic wastewater”. Water Resources, Vol. 30, No. 1, 242-245.
Personal references
Augustina Adjei-Boateng, Environmental Engineer Head, Research and Development, Waste Management Department, Kumasi Metropolitan Assembly (November 2008). Dr Samuel Afrane, Professor and head of department, The Planning Department, KNUST, Kumasi, Ghana (October 2008). Mr Frimpong, Head of liquid waste management, Waste Management Department, Kumasi Metropolitan Assembly (November 2008). Richard Kuffor, IWMI-office Kumasi, Ghana (November 2008). P K Jha, Director General, Sulabh International Academy of Environmental Sanitation, Mahavir Enclave, New Delhi, India

1
APPENDIX 1
Ingoing data:
Parameter name
Explanation Value Unit Source Comment
Urine Total mass of urine 400 kg/cap yr Author's estimation from Geurtsh (2005), Esrey et al. (2001) and Vinnerås (2001)
BODu BOD in urine 1.8 kg/cap yr Author's estimation from Esrey et al. (2001), Andersson and Jensen (2002) and Vinnerås (2001)
Nu Nitrogen in urine 2.2 kg/cap yr Author's calculation after Jönsson and Vinnerås (2003)
Pu Phosphorus in urine 0.2 kg/cap yr Author's calculation after Jönsson and Vinnerås (2003)
DMu Dry matter content in urine
16 kg/cap yr Author's estimation from Vinnerås (2001) and Esrey et al. (2001)
4% of wet weight
VSu Volatile solids in urine 8 kg/cap yr Author's estimation from Jönsson et al. (2005) and Andersson and Jensen (2002)
50% of Dmu
TOCu Total organic carbon in urine
2 kg/cap yr Author's estimation from Andersson and Jensen (2002) and Esrey et al. (2001)
25% of Vsu
Faeces Total mass of faeces 100 kg/cap yr Author's estimation from Schouw et al. (2001), Esrey et al. (2001), Geurtsh (2005) and Fittschen (2000)
BODf BOD in faeces 7.5 kg/cap yr Average from Jönsson et al. (2005) and Swedish Environmental Protection Agency template values (in Andersson and Jensen (2002))
Nf Nitrogen in faeces 0.4 kg/cap yr Author's calculation after Jönsson and Vinnerås (2003)
Pf Phosphorus in faeces 0.1 kg/cap yr Author's calculation after Jönsson and Vinnerås (2003)
DMf Dry matter content in faeces
30 kg/cap yr Average from Jönsson et al. (2005), Swedish Environmental Protection Agency template values (in Andersson and Jensen
30% of wet weight

2
(2002), Esrey et al. (2001) and Anderson and Jensen (2002)
NH3NH4-Nfracf
Ammonia fraction of total N in faeces
0.25 Kossmann et al. (1999)
VSf Volatile solids in faeces
23.4 kg/cap yr Average fron Jönsson et al. (2005) and Andersson and Jensen (2002)
78% of DM
TOCf Total organic carbon in faeces
13.1 kg/cap yr Average from Esrey et al. (2001) and Andersson and Jensen (2002)
56% of VS
Greywater Total mass of greywater
10450 kg/cap yr Erni (2007)
BODgw BOD in greywater 10 kg/cap yr Average fron Jönsson et al. (2005), Andersson and Jensen (2002) and Swedish Environmental Protection Agency template values (in Andersson and Jensen (2002))
DMgw Dry matter content in greywater
22 kg/cap yr Author's estimation from Jönsson et al. (2005), Andersson and Jensen (2002) and Swedish Environmental Protection Agency template values (in Andersson and Jensen (2002))
NH3NH4-Ngwfrac
Ammonia fraction of N in greywater
0.2 Morel and Diener, 2006
Ngw Nitrogen in greywater 0.27 kg/cap yr Erni (2008)
Pgw Phosphorus in greywater
0.33 kg/cap yr Erni (2008)
VSgw Volatile solids in greywater
15.4 kg/cap yr Author's estimation from Jönsson et al. (2005) and Andersson and Jensen (2002)
70% of DM
TOCgw Total organic carbon in greywater
3.3 kg/cap yr Andersson and Jensen (2002)
22% of VS
REFERENCES Andersson Å., Jensen, A., (2002). Flöden och sammansättning på BDT-vatten, urin, fekalier och fast organiskt avfall i Gebers. Master thesis, Department of agricultural engineering, SLU, Uppsala, Sweden Erni, M., (2007). Modelling urban water flows: An insight into current and future water availability and pollution of a fast growing city. Case study of Kumasi, Ghana. Unpublished M.Sc. thesis, Department Umweltwissenschaften, Eidgenössiche Technische Hochschule Zürich, Switzerland.
Esrey, S. A., Andersson, I., Hillers, A., Sawyer, R., (2001). Closing the loop. Ecological sanitation for food security. Publication on Water Resources No. 18, UNDP and SIDA, Mexico.

3
Fittschen,I.,(2000). http://www.ensic.inplnancy.fr/COSTWWTP/Work_Group/Wg5/Hamburg2000/Fittschen.pdf Geurtsh, M. (Editor), 2005, WASTE. http://www.ecosan.nl/content/download/801/5817/file/fact%20sheet%20characteristics%20excreta.pdf
Jönsson, H., Baky, A., Jeppson, U., Hellström, D., Kärrman, E., (2005). Composition of urine, faeces, greywater and biowaste for utilisation in the URWARE model. Dept. Of Industrial Electrical Engineering and Automation, Lund University, Sweden.
Jönsson, H., Vinnerås, B., (2003). Adapting the nutrient content of urineand faeces in different countries using FAO and Swedish data. Contribution to the 2nd International symposium on ecological sanitation, April 2003, Lübeck, Germany.
Kossmann, W., Pönitz, U., Habermehl, S., Hoerz, T., Krämer, P., Klingler, B., Kellner, C., Wittur, W., Klopotek, F.v., Krieg, A., Euler, H., (1999). Biogas Digest. Volume II. Biogas – Application and Product Development. Isat and gtz, Germany.
Morel, A., Diener, S., (2006). Greywater Management in Low and Middle-income Countries, Review of different treatment systems for households or neighbourhoods. Swiss Federal Institute of Aquatic Science and Technology (Eawag), Dübendorf, Switzerland.
Schouw, N. L., Danteravanich, S., Mosbaek, H., Tjell, J. C., (2001). "Composition of human excreta- a case study from southern Thailand". The Science of the Total Environment. No. 286, 155-166.
Vinnerås, B., (2001). Faecal separation and urine diversion for nutrient management of household biodegradable waste and wastewater. Licentiate Thesis, Department of Agricultural Engineering, SLU, Uppsala, Sweden.

4
APPENDIX 2
Model parameters
Parameter name Explanation Value Unit Source
URINE DIVERSION
SCENARIO
URcoll Fraction of urine that is collected
0.86 ORWARE
URcolltankNH3frac Fraction N as NH3 in collection tank
0.95 ORWARE
URcolltankNH3loss Fraction NH3 lost through vaporization in collection tank
0.04 1
URstoretankNH3frac Fraction N as NH3 in storage tank
1 ORWARE
URstoretankNH3loss Fraction NH3 lost through vaporization in storage tank
0.03 1
URstoretanklocalNH3frac Fraction N as NH3 in private collection/storage tank
0.95 Author's estimation based on ORWARE
URstoretanklocalNH3loss Fraction NH3 lost through vaporization in private collection/storage tank
0.1 1
DEHYDRATION OF FAECES
DHedhfactor Factor multiplied with DMf to get moisture content in dried faeces
0.33
DHNtotdeg Fraction of nitrogen lost in dehydration
0.05 Montangero and Belevi (2007)
DHvsdeg Fraction of volatile solids lost in dehydration
0.05 Montangero and Belevi (2007)
COMPOSTING
LCwcont Water content in compost 0.5 GTZ (2006)
LCCtogas Fraction of carbon to gas in composting
0.52 2
LCCgasfracCH4 Fraction of carbon to gas in methane
0.005 C. Sundberg, personal communication
LCCgasfracCO2 Fraction of carbon to gas in carbon dioxide
0.995 2
LCCtoleach Fraction of carbon that leaks from compost
0.03 2
LCCtocomp Fraction of carbon that remains in compost
0.45 2
1 Author's estimation, based on data in Kvarnström et al 2006 and Jönsson et al (1998) 2 Obrist and Baccini (1986); Belevi and Baccini (1997) in Belevi (2002)

5
LCNtogas Fraction of nitrogen to gas in composting
0.3 2
LCgasfracN2O Fraction N2O of total nitrogen loss
0.02 ORWARE
LCgasfracN2 Fraction N2 of total nitrogen loss
0.02 ORWARE
LCgasfracNH3 Fraction NH3 of total nitrogen loss
0.96 ORWARE
LCNtoleach Fraction of nitrogen that leaks from compost
0.01 2
LCNtocomp Fraction of nitrogen that remains in compost
0.69 1
LCorgNcompfrac Fraction organic nitrogen of total nitrogen in compost
0.93 ORWARE
LCNH3NH4compfrac Fraction ammonia of total nitrogen in compost
0.01 ORWARE
LCNNO3compfrac Fraction nitrate of total nitrogen in compost
0.06 1
LCPtogas Fraction of phosphorus to gas in composting
0.001 1
LCPtoleach Fraction of phosphorus that leaks from compost
0.01 1
LCPtocomp Fraction of phosphorus that remains in compost
0.989 1
LCorgloss Fraction of organic material lost in composting
0.55 Author's calculation
LCorgleach Fraction of lost organic material that leaks from compost
0.03
WATERBORNE
SCENARIO
WBflush Flush water 10950 kg/cap yr
WBNH3frac Fraction NH3 of total nitrogen at the end of sewers
0.95 Author's estimation based on data in ORWARE
SEPTIC TANK
Stgwtotank Fraction of greywater to septic tank
0.8
Sttosurf Fraction disposed of to drain/surface water
0.5
Sttosoil Fraction disposed of on to soil 0.5
Stlefl Fraction sewage leaked or flooded from tank
0.2
STthr Fraction that remains in tank 0.8
STBODred Fraction of BOD reduced 0.4 2
STNred Fraction of nitrogen reduced 0.12 2
1 Obrist and Baccini (1986); Belevi and Baccini (1997) in Belevi (2002) 2 Author's calculations, based on data in data in Montangero and Belevi (2007)

6
STPred Fraction of phosphorus reduced
0.18 2
STNH3sludgefrac Fraction ammonia of total nitrogen in septic sludge
0.19 2
STTOCred Fraction of TOC reduced 0.3 2
DRAIN FIELD
DFTOCred Fraction of TOC reduced 0.9 Jenssen (2005)
DFNred Fraction of nitrogen reduced 0.3 1
DFPred Fraction of phosphorus reduced
0.7 3
SIMPLIFIED SEWERAGE
SEWgwtosewdense Fraction of greywater to sewers dense areas
0.6 Author's estimation
SEWtosurfdense Fraction of unsewered greywater on to soil
0.5 Author's estimation
SEWtosoildense Fraction of unsewered greywater to drain/surface water
0.5 Author's estimation
SEWgwtosewspat Fraction of greywater to sewers spatial areas
0.8 Author's estimation
SEWtosurfspat Fraction of unsewered greywater on to soil
0.5 Author's estimation
SEWtosoilspat Fraction of unsewered greywater to drain/surface water
0.5 Author's estimation
SEWleak Fraction of sewage leaking 0.1 Author's estimation
WASTE STABILIZATION PONDS
WSPBODred Fraction of BOD reduced 0.8 2
WSPTOCred Fraction of TOC reduced 0.36 1
WSPTOCtoCH4 Fraction of organic carbon to methane
0.48 1
WSPTOCtoCO2 Fraction of organic carbon to carbon dioxide
0.27 1
WSPTOCtosludge Fraction of organic carbon to sludge
0.25 1
WSPNtotred Fraction of nitrogen reduced 0.7 1
WSPNH4red Fraction of ammonia reduced 0.6 1
WSPfracNH3toair Fraction of ammonia to air 0.25 1
WSPPtotred Fraction of phosphorus reduced
0.45 1
WSPevap Fraction of water that 0.2 1
1 Authors estimation, based on data in Winblad and Simpson-Hebért (2006) and Jenssen (2005) 2 Author's estimation, based on data in Ramadan and Ponce (2008), Rose (1999), Toprak (1993) and Mara and Pearson (1998) in Rose (1999)

7
evaporates
ROCK FILTER
RFBODred Fraction of BOD reduced 0.6 Saidam et al. (1995) in Rose (1999)
RFPtotrem Fraction of phosphorus reduced
0.4 Saidam et al. (1995) in Rose (1999)
RFTOCred Fraction of TOC reduced 0.4 Saidam et al. (1995) in Rose (1999)
BIOGAS SCENARIO
BGflush Flushwater 960 kg/cap yr Author's estimation, based on data in Jha (2005)
BGNH3frac Fraction of nitrogen as ammonia
0.95 Author's estimation, based on data in ORWARE
DIGESTER
ADVSred Fraction of volatile solids reduced
0.66
ADTOCred Fraction of TOC reduced 0.66 Author's calculation
ADNred Fraction of nitrogen reduced 0.016 Author's calculation
ADNH4sludge Fraction of nitrogen in sludge as ammonia
0.6 Berg 2000 in Jönsson et al. (2004)
ADNorgsludge Fraction of nitrogen in sludge as organic
0.4 Berg 2000 in Jönsson et al. (2004)
ADBODred Fraction of BOD reduced 0.6 Author's estimation, based on data in Jha (2005) and Aklaku et al. (2006)
ADgasfracCH4 Fraction biogas as methane 0.65 1
ADgasfracCO2 0.32 1
ADgasfracH2 0.01 1
ADgasfracN2 0.01 1
ADgasfracH2O 0.003 1
ADgasfracH2S 0.007 1
Adgasleak Fraction of gas that leaks from reactor
0.15 Author's estimation
Adgasutilize Fraction of gas that can be utilized
0.85 Author's estimation
Adgasfactor Produced gas from amount TOC
0.73 m3/kg Author's calculation, based on data in data in Jha (2005)
EFFLUENT TREATMENT
BGETBODred Fraction of BOD reduced 0.9 1
1 Author's estimation, based on data in Jha (2005) and FAO (1996)

8
BGETPred Fraction of phosphorus reduced
0.5 2
BGETNred Fraction of nitrogen reduced 0.5 2
BGETNH4fracsludge Fraction of nitrogen in sludge as ammonia
0.5 2
BGETVSred Fraction of volatile solids reduced
0.5 2
BGETDMred Fraction of dry matter reduced 0.5 2
BGETTOCred Fraction of TOC reduced 0.5 2
GREYWATER
GWfractogutdense Fraction of greywater to gutters in dense areas
0.7 Author’s estimation
GWfractosoildense Fraction of greywater on to soil
0.3 Author’s estimation
GWfractogutfiltspat Fraction of greywater to filters or gutters, spatial areas
0.8 Author’s estimation
GWfractosoilspat Fraction on to soil, spatial areas
0.2 Author’s estimation
GWfracfiltspat 0.5 Author’s estimation
GWfracgutspat 0.5 Author’s estimation
GREASE TRAP
GTBODred Fraction of BOD reduced 0.15 Morel and Diener (2006)
GTNred Fraction of nitrogen reduced 0.15 Morel and Diener (2006)
GTPred Fraction of phosphorus reduced
0.05 Morel and Diener (2006)
GTVSred Fraction of volatile solids reduced
0.1 Morel and Diener (2006)
GTCred Fraction of organic carbon reduced
0.1
OPEN GUTTERS
GWleakgut Fraction of greywater leaked from gutters
0.2 Author's estimation
VERTICAL FLOW FILTER
FFNred Fraction of nitrogen reduced 0.35 Average, based on data in Jenssen (2005), Ridderstolpe (2004) and Morel and Diener (2006)
FFPred Fraction of phosphorus reduced
0.9 Author's estimation, based on data in Jenssen (2005) and
1 Author's estimation, based on data in Aklaku et al (2006), Jha (2005) and Prochaska and Zouboulis (2003)

9
Ridderstolpe (2004)
FFTOCred Fraction of TOC reduced 0.9 Jenssen (2005)
FFBODred Fraction of BOD reduced 0.9 Author's estimation, based on data in Morel and Diener (2006) and Ridderstolpe(2004)
SOIL INFILTRATION
ISNred Fraction of nitrogen reduced 0.2 1
ISPred Fraction of phosphorus reduced
0.7 1
ISVSred Fraction of volatile solids reduced
0.7 1
ISTOCred Fraction of TOC reduced 0.7 1
REFERENCES
Aklaku, E. D., Jones, K., Obiri-Danso, K., (2006). "Integrated Biological Treatment and Biogas Production in a Small-Scale Slaughterhous in Rural Ghana". Water Environment Research, 78, 2335-2339.
Belevi, H., (2002). Material flow analysis as a strategic planning tool for regional waste water and solid waste management". SANDEC, EAWAG, Duebendorf.
FAO, (1996). A system approach to biogas technology. http://www.fao.org/sd/Egdirect/Egre0022.htm (2009-02-10)
GTZ, (2006). Technical data sheets for ecosan components: Composting Toilets. http://www.gtz.de/en/dokumente/en-ecosan-tds-03-a-composting-toilets-general-description-2006.pdf
Jenssen, P. D., (2005). Greywater treatment. http://www2.gtz.de/dokumente/oe44/ecosan/cb/en-nutrients-greywater-treatment-systems-2005.pdf (2009-02-05)
Jha (2005). Recycling and reuse of human excreta from public toilets through biogas generation to improve sanitation, community health and environment. http://unapcaem.org/Activities%20Files/A01/Recycling%20and%20reuse%20of%20human%20excreta%20from%20public%20toilets%20through%20biogas%20generation%20to%20improve%20sanitation,%20community%20health%20and%20environment.pdf
Jönsson, H., Sonesson, U., Vinnerås, B., Höglund, C., Stenström, T. A., Dalemo, M., (1998). Source separationof human urine - nitrogen and phosphorus emissions. http://www.ramiran.net/doc98/FIN-POST/VINERAS.pdf
Jönsson, H., Stinzig Richert, A., Vinnerås, B., Salomon, E., (2004). Guidelines on the Use of Urine and Faeces on Crop Production. EcoSanRes Fact Sheet 2004-2, Stockholm Environmental Institute.
1 Authors estimation, based on data in Winblad and Simpson-Hebért (2006) and Jenssen (2005)

10
Kvarnström, E., Emilsson, K., Richert Stintzing, A., Johansson, M., Jönsson, H., af Petersens, E., Schönning, C., Christensen, J., Hellström, D., Qvarnström, L., Ridderstolpe, P., Drangert, J, (2006). Urine Diversion: One Step Towards Sustainable Sanitation. EcoSanRes Publication Series, Report 2006-1, Stockholm Environmental Institute, Stockholm, Sweden.
Montangero, A., Belevi, H., (2007). "Assessing nutrient flows in septic tanks by elicting expert judgement: A promising method in the context of developing countries". Water research, 41, 1052-1064.
Morel, A., Diener, S., (2006). Greywater Management in Low and Middle-income Countries, Review of different treatment systems for households or neighbourhoods. Swiss Federal Institute of Aquatic Science and Technology (Eawag), Dübendorf, Switzerland.
Prochaska, C. A., Zouboulis, A., I., (2003). "Performance of intermittently operated sand filters: a comparable study, treating wastewaters of different origins". Water, Air, and Soil Pollution, No: 147, 367-388.
Ramadan, H., Ponce, V. M., (2008). San Diego State University. Design and Performance of Waste Stabilization Ponds. Http://stabilizationponds.sdsu.edu/ (2009-02-26)
Ridderstolpe, P., (2004). Introduction to Greywater treatment. EcoSanRes Publication Series, Report 2004-4, Stockholm Environmental Institute, Stockholm, Sweden.
Rose, G. D., (1999). Community-Based Technologies for domestic Wastewater Treatment and Reuse: options for urban agriculture. Cities Feeding People, CFP Report Series, Report 27.
Toprak, H., (1993). "Methane emissions originating from the anaerobic waste stabilization ponds case study: Izmir wastewater treatment system". Chemosphere, Vol. 26, Issues 1-4, 633-639.
Winblad, U., Simpson-Hébert, M., (editors), (2004). Ecological sanitation - revised and enlarged edition. SEI, Stockholm, Sweden.

11
APPENDIX 3
The ORWARE-vector:
[1: C-tot 2: C-chsd C in carbohydrates, slowly degradable 3: C-chfd C in carbohydrates, fast degradable 4: C-fat 5: C-protein 6: BOD 7: VS 8: DM 9: CO2f 10: CO2b 11: CH4 12: VOC 13: CHX 14: AOX 15: PAH 16: CO 17: Phenols 18: PCB 19: Dioxin 20: O-tot 21: H-tot 22: H2O 23: N-tot 24: NH3/NH4 25: N-NOX 26: N-NO3 27: N-NO2 28: S-tot 29: S-SOX 30: P 31: Cl 32: K 33: Ca 34: Pb 35: Cd 36: Hg 37: Cu 38: Cr 39: Ni 40: Zn 41: C-chmd C in carbohydrates, medium degradable 42: Particles 43: COD]

APPENDIX 4
The Urine diversion model:
1
12
2 3

13
Effluent
3
Grease trap
2
Soil
1
Vertical flow filter
MATLAB
Function
Grease trap
MATLAB
Function
Greywater
1
Subsystems, urine diversion model (numbered on previous page)
1. Urine storage
2. Open gutters
3. Vertical flow filter
AirEm
2
Urine
1
Storage tank
MATLAB
Function
Collection tank
MATLAB
FunctionUrine
1
Surface water
4
To soil
3
Grease trap
2
AirEm
1
To
gutters
-K-
Open gutters
MATLAB
Function
On to soil
-K-
Grease trap
MATLAB
Function
2
Greywater
1

APPENDIX 5
The biogas model:
1
2
14

15
Subsystems, biogas scenario (numbered on previous page)
1. Anaerobic digestor
2. Effluent sludge treatment
Biogas
3
AirEm
2
Sludge
1
Utilized
-K-
Leaked
-K-
Digester
MATLAB
FunctionExcreta
1
Effluent
4
Leachate
3
AirEm
2
Compost
1
Sludge composting
MATLAB
Function
Digester
effluent
treatment
MATLAB
Function
Grease
trap sludge
2
Biogas
slurry
1

APPENDIX 6
The waterborne model:
1
2
1
16
4
3

17
Subsystems, waterborne scenario (numbered on previous page)
1. Disposal
2. Wastewater treatment
3. Disposal
Surface water
4
Wastewater
3
Sludge
and grease
2
Infiltration
1
To
sewerage
-K-
Soil
-K-
Simplified sewerage
Inspection chamber
Leachate
To treatment
On to soil / surface water
-K-
Grease trap
MATLAB
Function
Drain /
surf
-K-
Add urine to faeces
MATLAB
Function
Greywater
2
Excreta
1
Effluent
3
AirEm
2
Sludge
1
Waste stabilization pond
MATLAB
Function
Rock filter
MATLAB
Function
Wastewater
1
Infiltration
3
Wastewater
2
Surface water
1
To
septic tank
-K-
Soil
-K-
On to soil /
surface water
-K-
Drain /
surface water
-K-
Add urine to faeces
MATLAB
Function
Greywater
2
Exreta
1
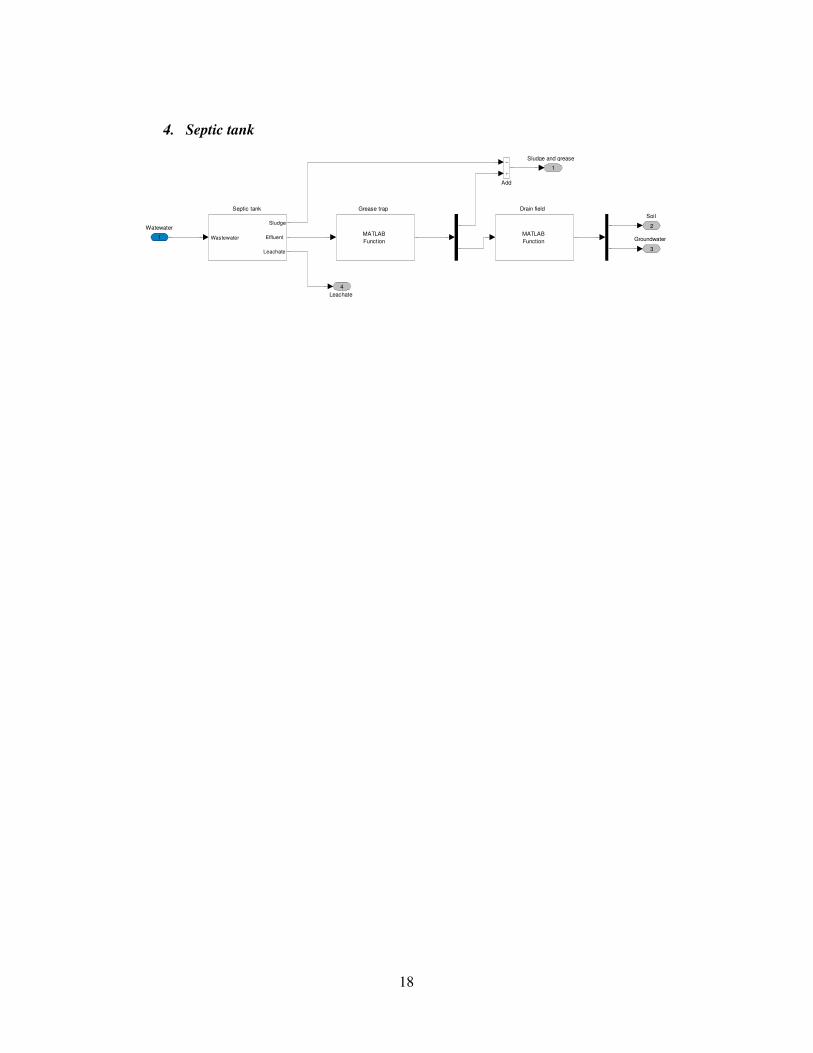
18
4. Septic tank
Leachate
4
Groundwater
3
Soil
2
Sludge and grease
1
Septic tank
Wastewater
Sludge
Effluent
Leachate
Grease trap
MATLAB
Function
Drain field
MATLAB
Function
Add
Watewater
1
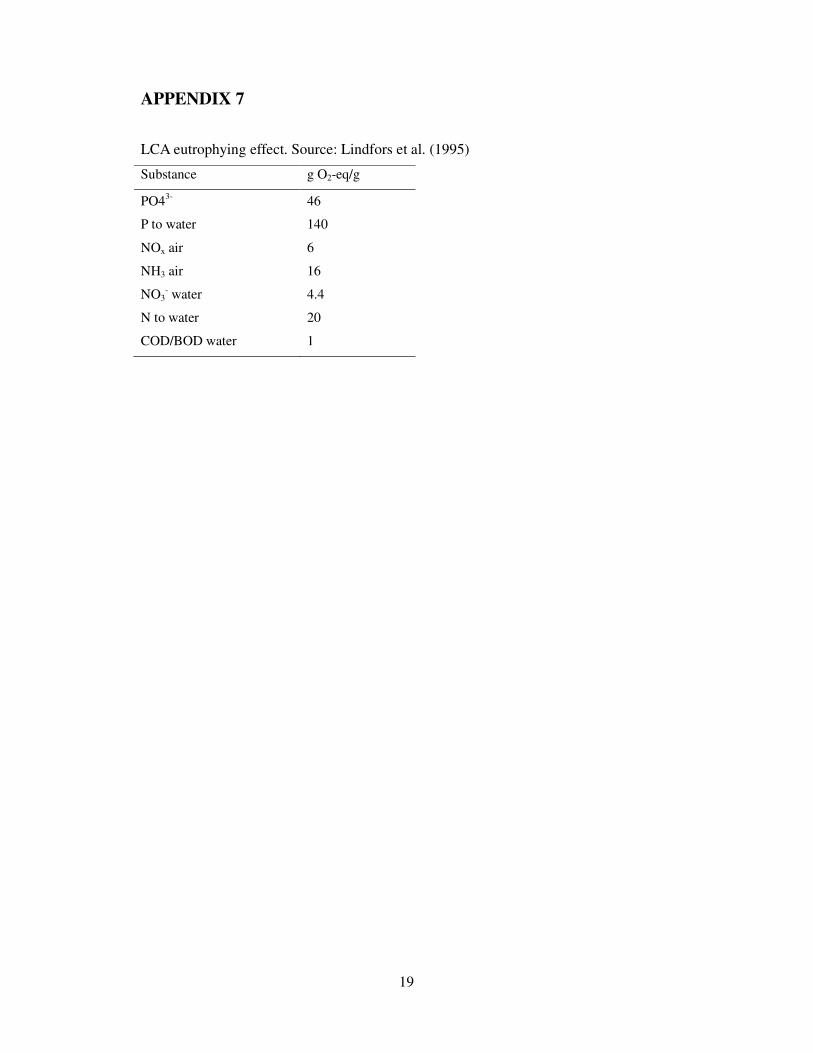
19
APPENDIX 7
LCA eutrophying effect. Source: Lindfors et al. (1995)
Substance g O2-eq/g
PO43- 46
P to water 140
NOx air 6
NH3 air 16
NO3- water 4.4
N to water 20
COD/BOD water 1

20
APPENDIX 8
Biogasreactor.m:
function [u]=biogasreactor(u,ADgasfactor,ADgasfracCO2,ADgasfracCH4,... ADgasfracH2O,ADgasfracH2S,ADgasfracN2,... ADTOCred,ADBODred,ADVSred,ADNH4sludge)
%Calculates sludge and biogas composition in fixed dome anaerobic
digester.
%Urine and faeces added element wise u=u(1:43)+u(44:86); ADgasyield=u(1)*ADgasfactor;
%Gas: u= [zeros(9,1) ADgasyield*ADgasfracCO2*1.87*(12/44) %kg C in CO2 ADgasyield*ADgasfracCH4*0.68*(12/16.043) %kg C in CH4 zeros(11,1) ADgasyield*ADgasfracN2*1.185 %kg N in N2 zeros(4,1) ADgasyield*ADgasfracH2S*(16/18) %kg S in H2S zeros(15,1)
%Sludge: u(1)*(1-ADTOCred) %TOC in sludge zeros(4,1) u(6)*(1-ADBODred) %BOD in sludge u(7)*(1-ADVSred) %Volatile solids in
sludge u(8)-u(7)*ADVSred %Dry matter in sludge u(9:22) u(23)-ADgasyield*ADgasfracN2*1.185 %Total nitrogen in
sludge (u(23)-ADgasyield*ADgasfracN2*1.185)*ADNH4sludge %Ammonia in
sludge u(25:43)];