Surface Transportation Supply Chain Security: Creating a ...
Procedia Chemistry 9 ( 2014 ) 284 – 294
1876-6196 © 2014 Elsevier B.V. This is an open access article under the CC BY-NC-ND license (http://creativecommons.org/licenses/by-nc-nd/3.0/).Peer-review under responsibility of the Organizing Committee of ICCE UNPAR 2013doi: 10.1016/j.proche.2014.05.035
ScienceDirectAvailable online at www.sciencedirect.com
International Conference and Workshop on Chemical Engineering UNPAR 2013, ICCE UNPAR 2013
Modeling Of LGV Supply Chain System for Land Transportation Sector
Mirza Mahendraa*, Yuswan Muharama, Sutrasno Kartohardjonoa, Fiqi Giffarib aDepartment of Chemical Engineering, Universitas Indonesia, Depok 16424, Indonesia
bLemigas, Jl. Ciledug Raya Kav. 109, Cipulir, Kebayoran Lama, Jakarta Selatan 12230, Indoneia
Abstract
Liquid Gas for Vehicles (LGV) is an alternative fuel for land transportation sector besides gasoline. Until now, fuel conversion program from gasoline to gas fuel has not been fully implemented in Indonesia, as the availability of gas fuel distribution infrastructure is far behind the gasoline distribution infrastructure. This research was conducted to find out the necessity of gas fuel distribution infrastructure development as well as the feasibility of gasoline to gas fuel conversion implementation. The phases on this research were potential estimation of gas fuel necessity for public transportation, analysis of gasoline supply chain, analysis of the necessity of LGV distribution infrastructure development and simulation of gas fuel supply chain economic system using project financing scenario. The result of infrastructure analysis produced a recommendation of 11 new units of LGV filling stations in big cities on Java Island. The economical price for, LGV is as much as IDR 8,392/LSP. Based on this calculation, recommendation of LGV was only for executive cabs. © 2014 The Authors. Published by Elsevier B.V. Selection and peer-review under responsibility of the Organizing Committee of ICCE UNPAR 2013.
Keywords: LGV, Gas Fuel, Supply Chain.
* Corresponding author. Tel.: +62-811-917-648; fax: +62-21-5269037.
E-mail address: [email protected]
© 2014 Elsevier B.V. This is an open access article under the CC BY-NC-ND license (http://creativecommons.org/licenses/by-nc-nd/3.0/).Peer-review under responsibility of the Organizing Committee of ICCE UNPAR 2013
Mirza Mahendra et al. / Procedia Chemistry 9 ( 2014 ) 284 – 294 285
1. Introduction
The use of energy sources until today still relies on the utilization of natural resources namely oil, natural gas, coal, and so forth. The discovery of oil and gas reserves in Indonesia in the last decade was dominated by the discovery of gas reserves compared to the discovery of oil. Some structures on gas findings have substantial reserves/ huge but mostly are relatively small and geographically dispersed.
Oil processed into fuel oil (BBM) is one of the vital commodities needed by all members of the public in their life and economic activities. Up to now Indonesia still provides subsidized fuel for the public. Current applied fuel subsidies is basically a price subsidy, the amount of money paid by government to the enterprises assigned to cover the difference between economic price and stated selling price to the public. Three types of current subsidized fuel oils are premium, kerosene and diesel.
In order to reduce the rate in fuel consumption growth, the government has adopted a diversification policy of energy sources in all activity sectors. Land transport is an important sector in order to support a smooth economic activity. This is one sector that requires large amounts of gasoline. The successful fulfillment of the target gasoline substitution in this sector will have a huge meaning to the success in national energy diversification.
Alternative fuels utilization other than gasoline is natural gas, which is one of the hydrocarbon that can be used as transportation fuel, raw materials for petrochemical and fertilizer industry, and other energy sources. Due to its nature, natural gas is a commodity which has a very large market. Delivery process of physical properties of gaseous natural gas requires special means of distribution through pipelines or in the form of Compressed Natural Gas (CNG), Liquid Petroleum Gas (LPG) and Liquefied Natural Gas (LNG) amongst others.
From year to year utilization of natural gas increases significantly in line with government policy to increase the use of domestic natural gas has made a demand in gas. Increased demand for natural gas is mainly dominated by the needs of power plants and the petrochemical industry feedstock. However, this increasing demand is still constrained by users’ geographical location in relation to the gas source in addition to the limited infrastructure availability that connects consumers to the gas sources causing gas supply shortage in some areas.
Utilization of natural gas as fuel for the transportation sector in Indonesia has started since 1986. In the last 20 years uncertain direction which includes limited resources, gas availability, installation of pipelines, socialization, and so forth has hindered its development. Through the supply chain modeling system, these problems are expected to be solved and be the solution for successful natural gas utilization in transportation fuel sector. This study aims to produce a model of LGV supply chain, economic viable component costs and selling price distribution of LGV. This study is limited to: - The data of public transit vehicles, minibus and taxis are in Jakarta, Bogor, Depok, Tangerang, Bekasi, Bandung,
Semarang, Yogyakarta Surabaya, Gresik and Sidoarjo; - LGV as Gas Fuel is used for supply chain modeling system; and - Profitability is measured by NPV, IRR and payback period.
2. Subject and Method
2.1. Subject
There are two types of fuel gas that has been commonly used, namely CNG (Compressed Natural Gas) or known by other names NGV (Natural Gas For Vehicles), and LPG (Liquid Petroleum Gas) or LGV (Liquid Gas For Vehicles). Compressed Natural Gas (CNG) fuel gas is created by the compression of methane (CH4) up to + 200 bar pressure. CNG is stored and distributed in a cylindrical pressure vessel. CNG composition generally or approximately 90% consisting of methane gas (CH4), ethane gas (C2H6), and other hydrocarbons as well as some impurities. CNG is less dense than the air, which is about 0.55 to 0.80 compared to 1 so that in the case of leaking it will evaporate into the atmosphere. CNG has an octane rating of less than about 120, the value of heat of combustion between 9,000 to 11,000 Kcal / Kg or ± 38 to 47 MJ / Kg.
LGV (Liquefied Gas for Vehicle) is a term used to refer to "LPG for vehicles". LGV term is used so as not to be confused with LPG for households. LGV-based LPG tailored specifically for vehicles with a composition of 59% propane (C3) and 41% butane (C4) with a high octane rating. There are other differences between households with
286 Mirza Mahendra et al. / Procedia Chemistry 9 ( 2014 ) 284 – 294
LGV, LPG has very low olefin content and also low levels of substance of "gas smell" (merchaptan), which is intentionally added to detect LPG leak.
LGV is a fuel gas that is formulated for use in motor vehicles spark ignition engine, suitable for small vehicles, both public transport vehicles such as bajaj, taxis, public transport, private vehicles and business operations (moderate or van/MPU) because the capacity of the tank is the same with the gasoline for the same distance and having a low pressure (low pressure) 8 to 12 bar, smaller than the CNG pressure which reach 200 bar. LGV combustion quality is equivalent to 98 RON and environmentally friendly. LGV evaporation considerable volume around 240 to 270 times. One of the factors supporting the use of fuel gas infrastructure in Indonesia is the availability of gas fuel distribution in Indonesia and the fact that to date gas fuel distribution infrastructure in Indonesia is still inadequate.
According to its type, gas fuel that can be implemented for motor vehicles are CNG and LGV. CNG would require gas pipeline infrastructure in order to be channel the gas supply to CNG Mother Station SPBGs or On Line Station. To the area or region that is possible to use CNG.
Some areas such as Semarang and Yogyakarta where there is no gas pipeline infrastructure available, it is feasible to use LGV as gas fuel for motor vehicles. In addition to this, LGV is also suitable for use on Executive Taxi due to the quality of the fuel. Table 1 is a summary of the gas fuel usage in major cities in Java and number of public vehicles.
Table 1. Gas Fuel Usage for Public Transportation in Java
No Province Vehicle Type Number of Fleet Fuel Type
1 Jakarta
Taxi 10,803 CNG
Executive Taxi 883 LGV
MPU 13,198 CNG
2 Bandung Taxi 1,503 CNG
MPU 17,796 CNG
3 Banten Taxi 6,480 CNG
MPU 6,661 CNG
4 Semarang Taxi 2,024 LGV
MPU 1,355 LGV
5 Yogyakarta Taxi 750 LGV
6 Surabaya Taxi 4,351 CNG
MPU 7,961 CNG
2.2. Method
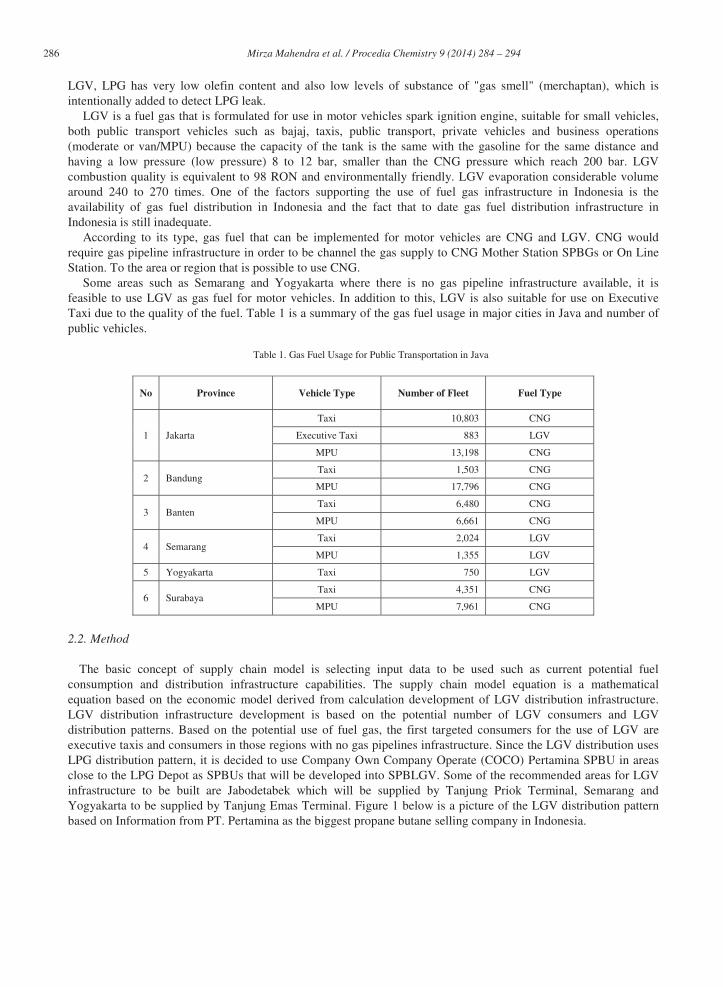
The basic concept of supply chain model is selecting input data to be used such as current potential fuel consumption and distribution infrastructure capabilities. The supply chain model equation is a mathematical equation based on the economic model derived from calculation development of LGV distribution infrastructure. LGV distribution infrastructure development is based on the potential number of LGV consumers and LGV distribution patterns. Based on the potential use of fuel gas, the first targeted consumers for the use of LGV are executive taxis and consumers in those regions with no gas pipelines infrastructure. Since the LGV distribution uses LPG distribution pattern, it is decided to use Company Own Company Operate (COCO) Pertamina SPBU in areas close to the LPG Depot as SPBUs that will be developed into SPBLGV. Some of the recommended areas for LGV infrastructure to be built are Jabodetabek which will be supplied by Tanjung Priok Terminal, Semarang and Yogyakarta to be supplied by Tanjung Emas Terminal. Figure 1 below is a picture of the LGV distribution pattern based on Information from PT. Pertamina as the biggest propane butane selling company in Indonesia.
Mirza Mahendra et al. / Procedia Chemistry 9 ( 2014 ) 284 – 294 287
Source: PT. Pertamina
Fig. 1. LGV Distribution Pattern and Costs Components from Source to SPBU
Based on LGV distribution pattern, the LGV potential consumption estimation is performed by referencing the amount of existing taxi fleet and the specific fuel consumption for each taxi in the region. Furthermore, the estimated potential LGV consumption is used as a base for determining the number of gas stations that will be modified from each region. The following table describes the potential LGV consumption and the number of Fuel Pump Stations that will be modified for Greater Jakarta, Semarang and Yogyakarta.
Table 2. LGV Potential Consumption and Number of LGV SPBG in Jabodetabek, Semarang and Yogyakarta
Area Total Fleet Potential Consumption (LSP)
Total of Modified Fuel Pump Station
Jakarta 1,275 44,625 5
Semarang 958 33,530 3
Yogyakarta 768 26,880 3
Economic model is the calculation of distribution cost based on the pattern of LGV distribution. Costs of LGV
distribution to the SPBUs consist of several components. Components of LGV procurement costs to the SPBUs are highly dependent on the LGV distribution pattern. LGV distribution pattern is very similar to LPG distribution pattern to the SPPBE (LPG dispensing stations and Freight Bulk) therefore the same costs components are used. LGV to SPBU Procurement Cost components are: - Propane Butane Price from source. In this study the price of propane butane from source is assumed to follow
Aramco CP price which is equal to US$ 850 / MT. - Propane Butane Freight Cost from Source. Assumed in accordance with Ministerial Decree of Energy and
Mineral Resources No. 1714K/12/MEM/2012, amounting to US$ 68.64/ MT. - Propane butaneImport Costs. Assumed in accordance with Ministerial Decree of Energy and Mineral Resources
No. 1714K/12/MEM/2012, amounting to 1.88% of CP Aramco, Aramco CP assuming US$ 850 / MT, hence import duties at US$15.98 / MT.
- Depot Throughput Costs. Since the same LPG depot is used, the depot throughput cost is set to be the same as LPG depot throughput cost which is US$ 26 / MT.
- Transportation Costs to SPBU. LGV to SPBU transportation costs are assumed to be the same as that of LPG to SPPBE at IDR 835 / (KM.MT).
- SPBU Modifications Costs. SPBU modification cost will be estimated using cash flow investment model. Assumed that modifications of the selected SPBU will be carried out through the addition of LGV storage infrastructure by 8 MT and adding other equipment’s such as compressors, pumps and dispensers. Table 3 below outlines the components of the Fuel Pump Station modifications investment costs while Table 4 describes the components of the Fuel Pump Station operational costs.
288 Mirza Mahendra et al. / Procedia Chemistry 9 ( 2014 ) 284 – 294
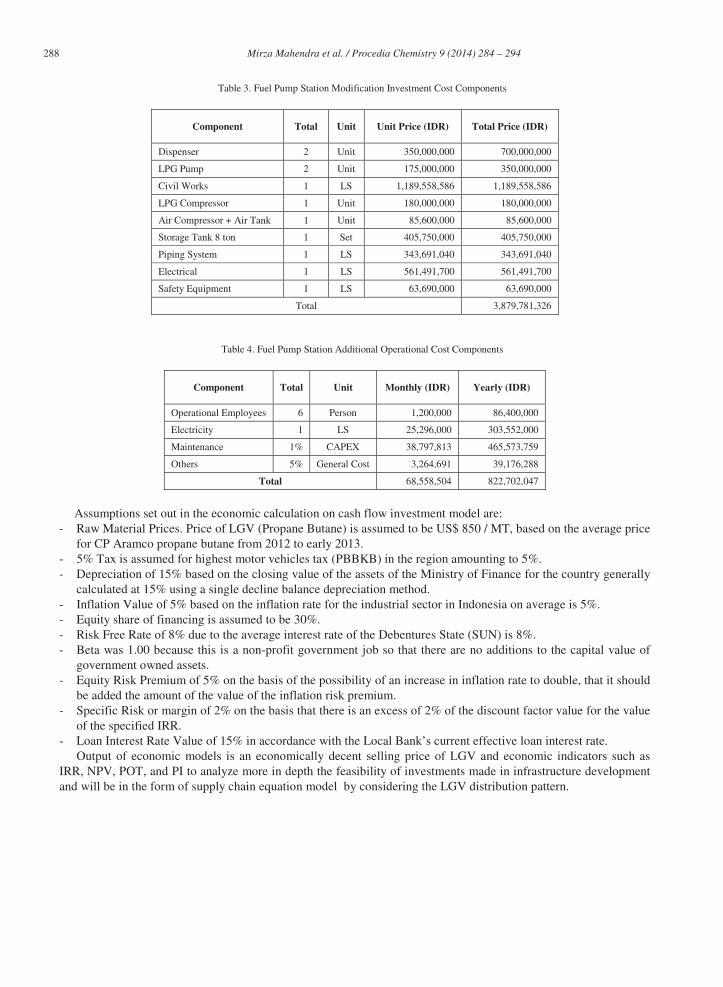
Table 3. Fuel Pump Station Modification Investment Cost Components
Table 4. Fuel Pump Station Additional Operational Cost Components
Component Total Unit Monthly (IDR) Yearly (IDR)
Operational Employees 6 Person 1,200,000 86,400,000
Electricity 1 LS 25,296,000 303,552,000
Maintenance 1% CAPEX 38,797,813 465,573,759
Others 5% General Cost 3,264,691 39,176,288
Total 68,558,504 822,702,047
Assumptions set out in the economic calculation on cash flow investment model are:
- Raw Material Prices. Price of LGV (Propane Butane) is assumed to be US$ 850 / MT, based on the average price for CP Aramco propane butane from 2012 to early 2013.
- 5% Tax is assumed for highest motor vehicles tax (PBBKB) in the region amounting to 5%. - Depreciation of 15% based on the closing value of the assets of the Ministry of Finance for the country generally
calculated at 15% using a single decline balance depreciation method. - Inflation Value of 5% based on the inflation rate for the industrial sector in Indonesia on average is 5%. - Equity share of financing is assumed to be 30%. - Risk Free Rate of 8% due to the average interest rate of the Debentures State (SUN) is 8%. - Beta was 1.00 because this is a non-profit government job so that there are no additions to the capital value of
government owned assets. - Equity Risk Premium of 5% on the basis of the possibility of an increase in inflation rate to double, that it should
be added the amount of the value of the inflation risk premium. - Specific Risk or margin of 2% on the basis that there is an excess of 2% of the discount factor value for the value
of the specified IRR. - Loan Interest Rate Value of 15% in accordance with the Local Bank’s current effective loan interest rate.
Output of economic models is an economically decent selling price of LGV and economic indicators such as IRR, NPV, POT, and PI to analyze more in depth the feasibility of investments made in infrastructure developmentand will be in the form of supply chain equation model by considering the LGV distribution pattern.
Component Total Unit Unit Price (IDR) Total Price (IDR)
Dispenser 2 Unit 350,000,000 700,000,000
LPG Pump 2 Unit 175,000,000 350,000,000
Civil Works 1 LS 1,189,558,586 1,189,558,586
LPG Compressor 1 Unit 180,000,000 180,000,000
Air Compressor + Air Tank 1 Unit 85,600,000 85,600,000
Storage Tank 8 ton 1 Set 405,750,000 405,750,000
Piping System 1 LS 343,691,040 343,691,040
Electrical 1 LS 561,491,700 561,491,700
Safety Equipment 1 LS 63,690,000 63,690,000
Total 3,879,781,326

Mirza Mahendra et al. / Procedia Chemistry 9 ( 2014 ) 284 – 294 289
3. Result
3.1. LGV Supply Chain Model Equation
.LGV Price General equation (LGV Price) is the sum of LGV Price for each cluster (LGVi Price), the following equation is generally LGV price formation:
=
=
×
=n
i
n
i i
V
Price LGVVPrice LGV
0
0)(
(1)
LGV price calculation for each cluster (LGVi Price) is estimated based on the LGV distribution channels. As
mentioned in the previous section the LGV distribution pattern resembles that of the LPG distribution pattern, therefore LPG distribution pattern is used. In general the components of the LGV price include LPG Procurement Costs, Depot Throughput Costs, Transportation Costs to Fuel Pump Station (SPBU) and Modifications costs to SPBU. Here is the LGV pricing equation:
ii Cost onModificati SPBU SPBUto Cost Depot LGV Cost tProcuremen LGVPrice LGV ++=
(2)
LGV procurement costs estimated to be the same as the LPG procurement costs as regulated by Ministerial Decree of Energy and Mineral Resources No. 2047K/12/MEM/2013, as follows:
Aramco CP 1.88% Ton
US$ 68.64 Aramco CP Cost tProcuremen LGV ++= (3)
LGV depot costs are quite dependent on the LPG sales throughput (V LPG) and the price of the unit is assumed
to be US$ 26 / MT, in order to get the following equation:
Ton
US$ 26 V Cost Depot LGV i ×= (4)
Costs for SPBU Modification for each cluster is estimated based on the components that include: - Pump Modification Capital Cost (CGV) - Project Duration (T) - The addition of the pump Operating Costs (OGV) - Addition of Cost of Money (IGV) - Pump Additional Profit (MGV) - LGV sales throughput (V)
i
iiii
i V
MGVIGVOGVT
CGV
Cost ion Modificat StationPump Fuel+++
= (5)
290 Mirza Mahendra et al. / Procedia Chemistry 9 ( 2014 ) 284 – 294
So if the above equations are incorporated into the LGV price equations for each cluster the following equation shall emerge:
+++
+××+
×+++=
i
iiii
ii
ii
V
MGVIGVOGVT
CGV
Ton km
RpVD
Ton
US$ 26 VAramco CP 1.88%
Ton
US$ 68.64 Aramco CPPrice LGV
835. (6)
3.2. LGV Infrastructure Development Cost
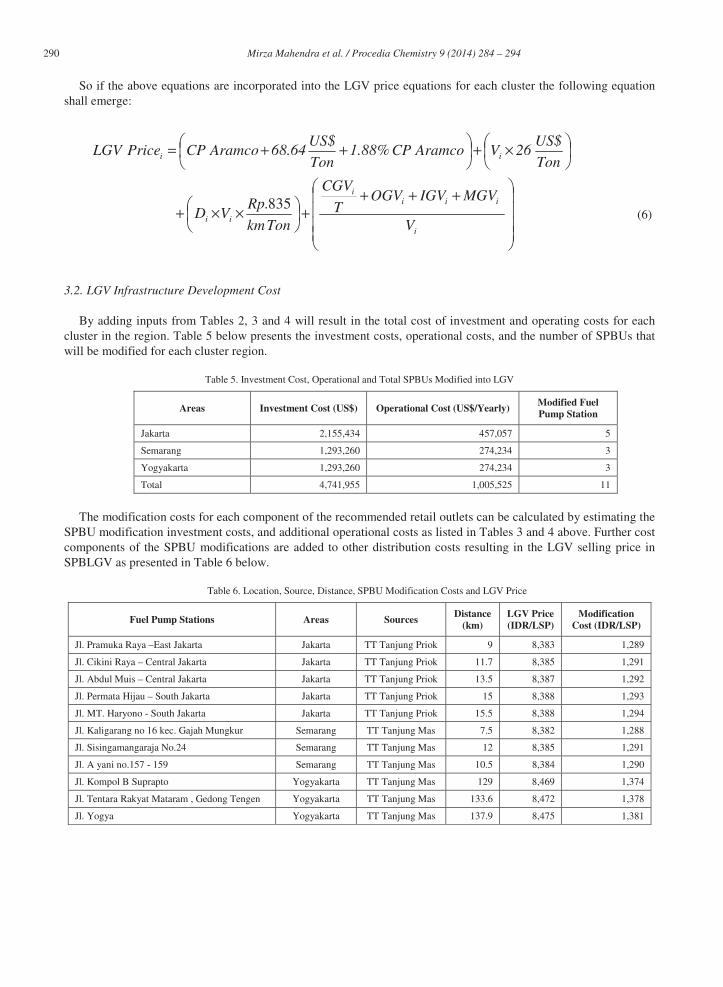
By adding inputs from Tables 2, 3 and 4 will result in the total cost of investment and operating costs for each cluster in the region. Table 5 below presents the investment costs, operational costs, and the number of SPBUs that will be modified for each cluster region.
Table 5. Investment Cost, Operational and Total SPBUs Modified into LGV
Areas Investment Cost (US$) Operational Cost (US$/Yearly) Modified Fuel Pump Station
Jakarta 2,155,434 457,057 5
Semarang 1,293,260 274,234 3
Yogyakarta 1,293,260 274,234 3
Total 4,741,955 1,005,525 11
The modification costs for each component of the recommended retail outlets can be calculated by estimating the
SPBU modification investment costs, and additional operational costs as listed in Tables 3 and 4 above. Further cost components of the SPBU modifications are added to other distribution costs resulting in the LGV selling price in SPBLGV as presented in Table 6 below.
Table 6. Location, Source, Distance, SPBU Modification Costs and LGV Price
Fuel Pump Stations Areas Sources Distance
(km) LGV Price (IDR/LSP)
Modification Cost (IDR/LSP)
Jl. Pramuka Raya –East Jakarta Jakarta TT Tanjung Priok 9 8,383 1,289
Jl. Cikini Raya – Central Jakarta Jakarta TT Tanjung Priok 11.7 8,385 1,291
Jl. Abdul Muis – Central Jakarta Jakarta TT Tanjung Priok 13.5 8,387 1,292
Jl. Permata Hijau – South Jakarta Jakarta TT Tanjung Priok 15 8,388 1,293
Jl. MT. Haryono - South Jakarta Jakarta TT Tanjung Priok 15.5 8,388 1,294
Jl. Kaligarang no 16 kec. Gajah Mungkur Semarang TT Tanjung Mas 7.5 8,382 1,288
Jl. Sisingamangaraja No.24 Semarang TT Tanjung Mas 12 8,385 1,291
Jl. A yani no.157 - 159 Semarang TT Tanjung Mas 10.5 8,384 1,290
Jl. Kompol B Suprapto Yogyakarta TT Tanjung Mas 129 8,469 1,374
Jl. Tentara Rakyat Mataram , Gedong Tengen Yogyakarta TT Tanjung Mas 133.6 8,472 1,378
Jl. Yogya Yogyakarta TT Tanjung Mas 137.9 8,475 1,381
Mirza Mahendra et al. / Procedia Chemistry 9 ( 2014 ) 284 – 294 291
4. Discussion
Table 6 shows that LGV selling price is around IDR 8,383/LSP up to IDR 8,475/LSP so it can be concluded that the LGV price is less competitive when compared with the subsidized fuel. LGV lowest price is at SPBU Jl. Pramuka Raya, East Jakarta with Fuel Station modification cost of IDR 1,289/LSP, and distance from the suppliers depot - TT Tanjung Priok is 9 KM. While the lowest price is at Yogya Highway SPBU with Fuel Station modification cost of IDR 1,381/LSP, and distance from suppliers depot – TT Tanjung Mas is 137.9 KM. It can be concluded that the distance is inversely proportional to the Fuel Pump Station modifications costs and LGV prices at SPBLGV.
4.1. Sensitivity Analysis of IRR against the LGV Selling Price
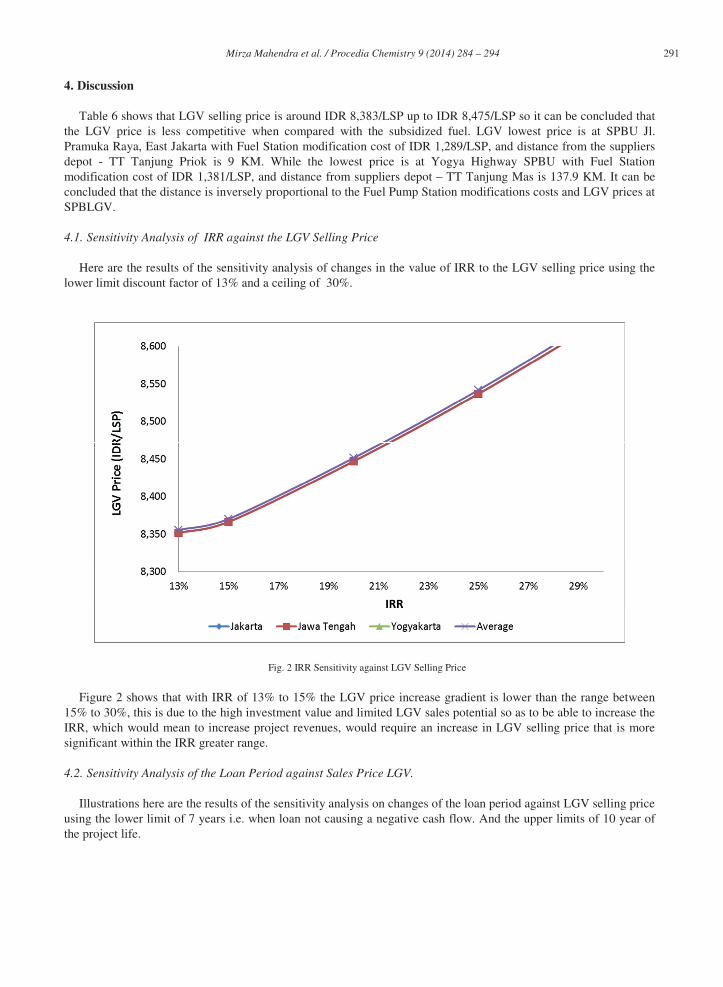
Here are the results of the sensitivity analysis of changes in the value of IRR to the LGV selling price using the lower limit discount factor of 13% and a ceiling of 30%.
Fig. 2 IRR Sensitivity against LGV Selling Price
Figure 2 shows that with IRR of 13% to 15% the LGV price increase gradient is lower than the range between 15% to 30%, this is due to the high investment value and limited LGV sales potential so as to be able to increase the IRR, which would mean to increase project revenues, would require an increase in LGV selling price that is more significant within the IRR greater range.
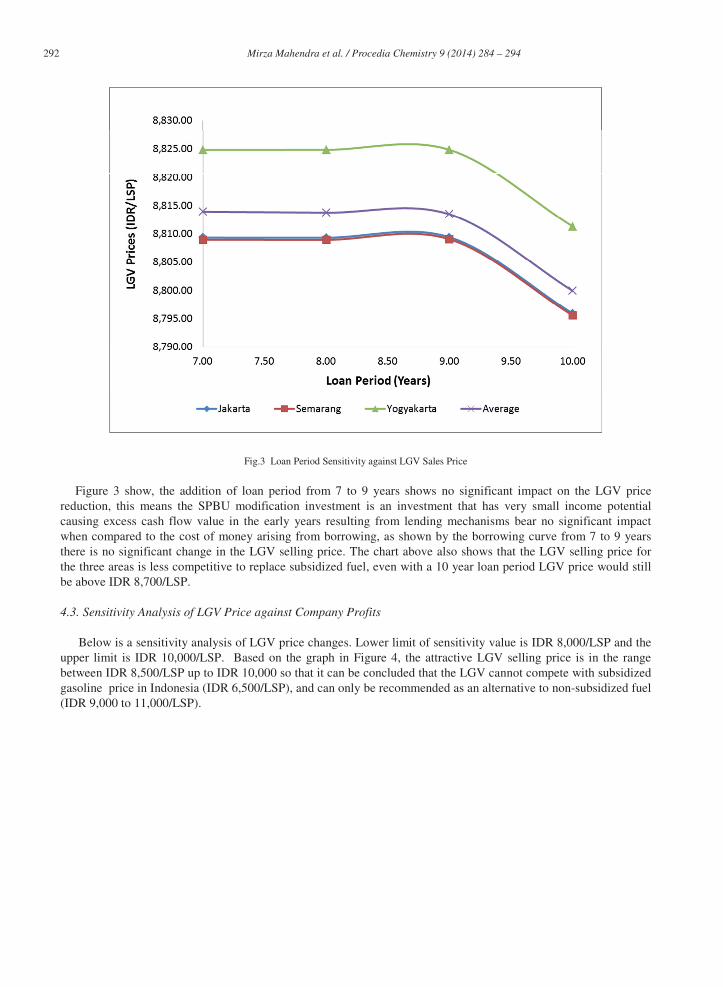
4.2. Sensitivity Analysis of the Loan Period against Sales Price LGV.
Illustrations here are the results of the sensitivity analysis on changes of the loan period against LGV selling price using the lower limit of 7 years i.e. when loan not causing a negative cash flow. And the upper limits of 10 year of the project life.
292 Mirza Mahendra et al. / Procedia Chemistry 9 ( 2014 ) 284 – 294
Fig.3 Loan Period Sensitivity against LGV Sales Price
Figure 3 show, the addition of loan period from 7 to 9 years shows no significant impact on the LGV price reduction, this means the SPBU modification investment is an investment that has very small income potential causing excess cash flow value in the early years resulting from lending mechanisms bear no significant impact when compared to the cost of money arising from borrowing, as shown by the borrowing curve from 7 to 9 years there is no significant change in the LGV selling price. The chart above also shows that the LGV selling price for the three areas is less competitive to replace subsidized fuel, even with a 10 year loan period LGV price would still be above IDR 8,700/LSP.
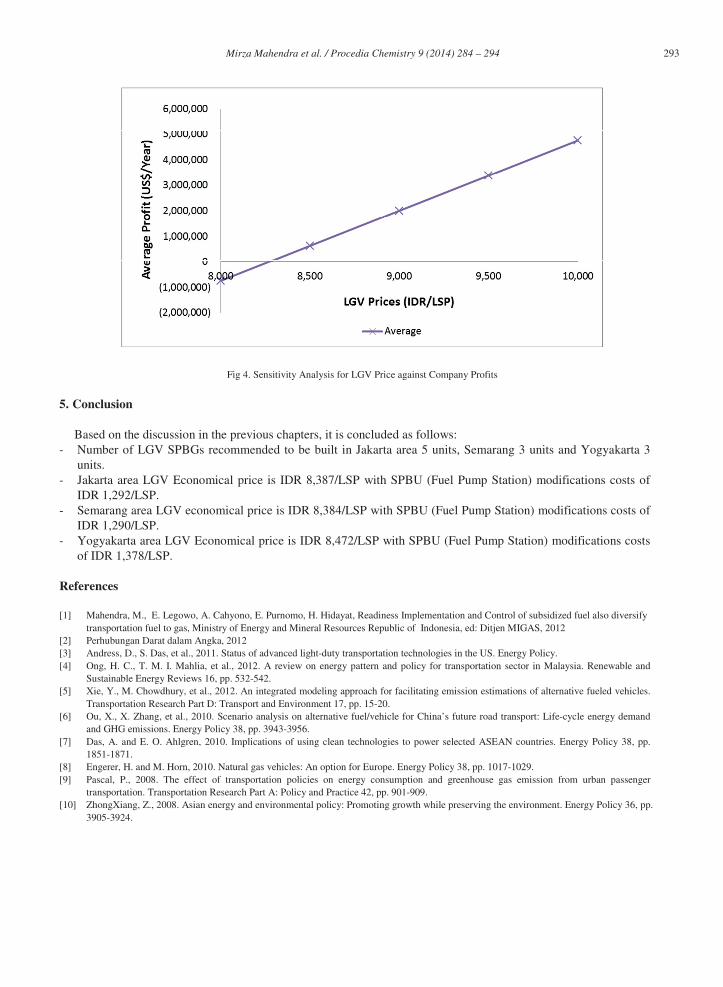
4.3. Sensitivity Analysis of LGV Price against Company Profits
Below is a sensitivity analysis of LGV price changes. Lower limit of sensitivity value is IDR 8,000/LSP and the upper limit is IDR 10,000/LSP. Based on the graph in Figure 4, the attractive LGV selling price is in the range between IDR 8,500/LSP up to IDR 10,000 so that it can be concluded that the LGV cannot compete with subsidized gasoline price in Indonesia (IDR 6,500/LSP), and can only be recommended as an alternative to non-subsidized fuel (IDR 9,000 to 11,000/LSP).
Mirza Mahendra et al. / Procedia Chemistry 9 ( 2014 ) 284 – 294 293
Fig 4. Sensitivity Analysis for LGV Price against Company Profits
5. Conclusion
Based on the discussion in the previous chapters, it is concluded as follows: - Number of LGV SPBGs recommended to be built in Jakarta area 5 units, Semarang 3 units and Yogyakarta 3
units. - Jakarta area LGV Economical price is IDR 8,387/LSP with SPBU (Fuel Pump Station) modifications costs of
IDR 1,292/LSP. - Semarang area LGV economical price is IDR 8,384/LSP with SPBU (Fuel Pump Station) modifications costs of
IDR 1,290/LSP. - Yogyakarta area LGV Economical price is IDR 8,472/LSP with SPBU (Fuel Pump Station) modifications costs
of IDR 1,378/LSP.
References
[1] Mahendra, M., E. Legowo, A. Cahyono, E. Purnomo, H. Hidayat, Readiness Implementation and Control of subsidized fuel also diversify transportation fuel to gas, Ministry of Energy and Mineral Resources Republic of Indonesia, ed: Ditjen MIGAS, 2012
[2] Perhubungan Darat dalam Angka, 2012 [3] Andress, D., S. Das, et al., 2011. Status of advanced light-duty transportation technologies in the US. Energy Policy. [4] Ong, H. C., T. M. I. Mahlia, et al., 2012. A review on energy pattern and policy for transportation sector in Malaysia. Renewable and
Sustainable Energy Reviews 16, pp. 532-542. [5] Xie, Y., M. Chowdhury, et al., 2012. An integrated modeling approach for facilitating emission estimations of alternative fueled vehicles.
Transportation Research Part D: Transport and Environment 17, pp. 15-20. [6] Ou, X., X. Zhang, et al., 2010. Scenario analysis on alternative fuel/vehicle for China’s future road transport: Life-cycle energy demand
and GHG emissions. Energy Policy 38, pp. 3943-3956. [7] Das, A. and E. O. Ahlgren, 2010. Implications of using clean technologies to power selected ASEAN countries. Energy Policy 38, pp.
1851-1871. [8] Engerer, H. and M. Horn, 2010. Natural gas vehicles: An option for Europe. Energy Policy 38, pp. 1017-1029. [9] Pascal, P., 2008. The effect of transportation policies on energy consumption and greenhouse gas emission from urban passenger
transportation. Transportation Research Part A: Policy and Practice 42, pp. 901-909. [10] ZhongXiang, Z., 2008. Asian energy and environmental policy: Promoting growth while preserving the environment. Energy Policy 36, pp.
3905-3924.

294 Mirza Mahendra et al. / Procedia Chemistry 9 ( 2014 ) 284 – 294
[11] Sonia, Y., 2007. An empirical analysis on the adoption of alternative fuel vehicles: The case of natural gas vehicles. Energy Policy 35, pp. 5865-5875.
[12] Janssen, A., S. F. Lienin, et al., 2006. Model aided policy development for the market penetration of natural gas vehicles in Switzerland. Transportation Research Part A: Policy and Practice 40, pp. 316-333.
[13] Hekkert, M. P., F. H. J. F. Hendriks, et al., 2005. Natural gas as an alternative to crude oil in automotive fuel chains well-to-wheel analysis and transition strategy development. Energy Policy 33, pp. 579-594.
[14] Poh, K. L. and B. W. Ang, 1999. Transportation fuels and policy for Singapore: an AHP planning approach. Computers & amp; Industrial Engineering 37, pp. 507-525.
[15] Demir, E., T. Bekta , and G. Laporte, 2011. A comparative analysis of several vehicle emission models for road freight transportation. Transportation Research Part D: Transport and Environment 16, pp. 347-357.
[16] Thamsiriroj, T., H. Smyth, and J.D. Murphy, 2011. A roadmap for the introduction of gaseous transport fuel: A case study for renewable natural gas in Ireland. Renewable and Sustainable Energy Reviews 15, pp. 4642-4651.
[17] Collantes, G. and M.W. Melaina, 2011. The co-evolution of alternative fuel infrastructure and vehicles: A study of the experience of Argentina with compressed natural gas. Energy Policy 39, pp. 664-675.
[18] Kalam, M.A. and H.H. Masjuki, 2011. An experimental investigation of high performance natural gas engine with direct injection. Energy 36, pp. 3563-3571.
[19] Amrouche, F., et al., 2011. Toward hydrogen enriched natural gas “HCNG” fuel on the algerian road. International Journal of Hydrogen Energy 36, pp. 4094-4102.
[20] Schulz, T.F., et al., 2007. Assessing wood-based synthetic natural gas technologies using the SWISS-MARKAL model. Energy 32, pp. 1948-1959.
[21] Karamangil, M.I., 2007. Development of the auto gas and LPG-powered vehicle sector in Turkey: A statistical case study of the sector for Bursa. Energy Policy 35, pp. 640-649.