Modeling Impacts and Adaptation to Sea-Level Rise. A ...
32
1 Modeling Impacts and Adaptation to Sea-Level Rise. A Review of the Literature Francesco Bosello, University of Milan, Fondazione Eni Enrico Mattei and Centro Euromediterraneo per I Cambiamenti climatici Enrica De Cian, Fondazione Eni Enrico Mattei and Centro Euromediterraneo per I Cambiamenti climatici Abstract. This paper reviews the state of the art on modeling work in the area of sea-level rise and extreme events. It focuses on the following questions: (1) What is the current state of the modeling literature on impacts and adaption related to sea-level rise and the extreme events that affect coastal impacts? (2) What are the implications of current findings on modeling impacts and adaptation for policy? (3) What gaps in modeling remain in this area? The paper does not consider the current state of the empirical literature and does not aim providing estimates of adaptation costs. However, considerations on the types of empirical information useful to modelers are presented. DRAFT REPORT: PLEASE DO NOT QUOTE
Transcript of Modeling Impacts and Adaptation to Sea-Level Rise. A ...

1
Modeling Impacts and Adaptation to Sea-Level Rise. A Review of the Literature
Francesco Bosello, University of Milan, Fondazione Eni Enrico Mattei and Centro Euromediterraneo per I Cambiamenti climatici
Enrica De Cian, Fondazione Eni Enrico Mattei and Centro Euromediterraneo per I Cambiamenti climatici
Abstract. This paper reviews the state of the art on modeling work in the area of sea-level rise and extreme events. It focuses on the following questions: (1) What is the current state of the modeling literature on impacts and adaption related to sea-level rise and the extreme events that affect coastal impacts? (2) What are the implications of current findings on modeling impacts and adaptation for policy? (3) What gaps in modeling remain in this area? The paper does not consider the current state of the empirical literature and does not aim providing estimates of adaptation costs. However, considerations on the types of empirical information useful to modelers are presented.
DRAFT REPORT: PLEASE DO NOT QUOTE
2
1. Introduction Coastal erosion and sea flooding impacts on densely populated and infrastructure-rich coastal cities has been one of the most prominent assessments in the climate change impact literature. The high concentration of human settlements in coastal areas make climate change impacts in coastal cities a major concern, with millions of exposed people and thousands of billions of USD of exposed assets at the global scale. Population density in coastal areas is on average three times the global mean density (Small and Nicholls, 2003; McGranahan et al. 2007). Around the world there are 136 major port cities hosting more than one million inhabitants. Thirteen of them appear in the top 20 most populated cities in the world. In 2005 the total value of the assets across these cities is estimated to be US$3,000 billion, corresponding to around 5% of global GDP (Nicholls et al. 2008).Therefore, large number of people and assets are already exposed to coastal flooding. And population in coastal zones is expected to increase despite the growing risk of coastal locations (Nicholls et al. 2010). Future sea-level rise remains highly uncertain. Important sources of uncertainty are the dynamics of large ice-sheets in Greenland and Antarctica, the interaction between mean sea-level, extreme water levels, and storm characteristics determining the largest impacts from coastal inundation (Seneviratne et al. 2012). Certainly, growing population and economic relevance of coastal cities will increase asset and people exposure, particularly in developing countries (Nicholls et al. 2008, Hanson et al. 2009, 2012). In many regions, the main driver of future economic losses of coastal impacts will be socioeconomic in nature and there is high confidence that locations currently experience negative coastal impacts will continue to do so (Handmer et a. 2012; Seneviratne et al. 2012). The Fourth Assessment IPCC report projects sea-level rise between 1990 and 2095 to range between 0.18–0.38 m for the B1 SRES scenario and 0.26–0.59 m for the A1FI scenario (Meehl et al. 2007). The sea-level rise projected in the 4AR only reflects the effect of thermal expansion of sea water and it does not account for the instability and possible large discharge from Greenland and West Antarctica ice sheets. Using a simple linear relationship, it was estimated that the melting of large ice sheets could increase the sea-level rise projection at the end of the century between 10 and 20 cm. The report also acknowledged that a larger contribution could not be ruled out. Kopp et al. (2009) examined sea-level rise in previous epochs when climatic conditions and ice sheets configuration were comparable with the present ones and suggests that during the Emian the global sea level might have risen by 6-9 m above present as a response to a global mean warming of 1–2°C, because of extensive melting of the ice sheets. Several studies since the publication of the AR4 report have developed statistical methods to relate observed variations in global sea level and changes in global temperature, and extrapolate future trends. They suggest that AR4 projections might have been conservative and that global mean sea level rise could be higher. Vermeer and Rahmstorf (2009) and Rahmstorf (2007) suggest that the AR4 climate change scenario range is consistent with 0.5 to 1.9 m of sea-level rise for the 21st century. Pfeffer et al. (2008), using a model of glaciers, conclude that a 2m increase in sea-level by 2100 could occur under extreme assumptions and that a 0.8m increase is more likely. A recent review (Overpeck and Weiss, 2009) concludes that sea-level rise in this century could significantly exceed 1 m by 2100. Starting from the same studies Nicholls et al. (2011) conclude that the upper bound for the twenty-first century
3
sea-level rise is of the order of 2 m. In addition, observed sea-level rise is following a trajectory close to the upper bounds of the SRES scenarios, in particular for the scenarios reported in the Third Assessment of the IPCC including land ice uncertainty (Cazenave and Nerem, 2004). Mid-latitude storms and tropical cyclones can have important effects on coastal areas and interact with sea level rise, causing increased extreme water levels and wave heights, increased erosion and risk of flood, and defense failure (Nicholls et al. 2007). However, the evidence on impacts from global warming on these types of extreme events remain uncertain, though there is a possibility that tropical storms intensity increase with warming (Meehl et al. 2007, Emanuel 2005, Webster et al. 2005). This paper reviews how the modeling of impacts and adaptation to sea-level rise has evolved since the first assessments published in the 1990s (Hoozemans et al. 1993). In 1991 the IPCC proposed methodologies and estimates of the cost of sea-level rise and the benefit of coastal protection (IPCC CZMS, 1991). Since then a large body of the literature has been dominated by engineering models based on detailed Geographical Information Systems (GIS) databases to determine areas, people, and activities at risk. In this survey we refer to this typology of modeling as bottom-up studies of coastal systems. Bottom-up studies can be divided into assessments with a global or macro regional coverage, and site-specific analyses. Global analyses are based on aggregated approximation of social-economic data. Impacts and effects of adaptation measures are estimated at the level of coastal segment with varying size. They usually compound adaptation measures in large categories, such as dike building and beach nourishment. Site-specific assessments focus on delimited locations where specific impacts and measures are analyzed in a greater using engineering or hydraulic models. The assessment of impacts and adaptation as well as the cost-benefit analysis provided by bottom-up studies only consider direct costs and benefits. These studies do not account for the feedback impacts and policies can have on the macroeconomic and social context (indirect costs), which is exogenously given. Indirect costs can be evaluated by top-down modeling. In this survey this category refers to models that are less detailed in the spatial/technical description of impacts and adaptation, but explicitly capture economic behavior and macroeconomic interactions. These exercises usually use results from bottom-up studies as input, complementing the technical bottom-up analysis with an economic evaluation. Following this approach, an increasing number of assessments integrate sea-level rise impacts with computable general equilibrium (CGE) models that track market (price-quantity, demand-supply) reactions to sea-level rise impacts and implemented adaptation measures. This methodology allows to estimate second-order effects and to formulate a measure of indirect costs. Sea-level rise has also been analyzed in its interaction with long-term economic growth using dynamic optimization models. These models, by including reduced-form equations for sea-level rise damage and adaptation costs, can identify optimal protection levels. When economic growth models are part of hard-linked integrated assessment models, interaction with the climate system can be highlighted. The paper is organized as follows. Section 2 reviews the current status of modeling impacts and adaptation, distinguishing between bottom-up and top-down approaches. The modeling of extreme events linked to sea-level rise are also discussed. Section 3 derives some policy implications. Section 4 discusses the modeling gaps that remain in the area and highlight the possible directions for future research.
4
2. Current state on modeling impacts and adaptation to sea level rise and extreme events. Methodologies and approaches used The drivers of actual impacts in coastal zones depend on a number of climate and non-climate factors (Nicholls et al. 2008). Climate drivers include variables such as global sea level rise, CO2 concentration, sea surface temperature, storm characteristics, run-off, changes in wind and precipitation patterns. Non-climate drivers include variables such as uplift/subsidence due to human or natural processes and socio-economic trends (population, GDP, coastward migration, tourism, land use and aquaculture, infrastructure and port developments, marine renewable energy). Direct impacts of sea-level rise include inundation, flood and storm damage; wetland losses; erosion, saltwater intrusion; rising water tables, impeded drainage. These effects clearly impact many social and economic aspects of life in coastal zones such as tourism, agriculture, biodiversity, health, freshwater resources, infrastructure (Nicholls et al 2010). Bottom-up approaches have been developed to deal with the direct impacts, while top-down models can assess the interaction with economic sectors. Top-down evaluations however need inputs from bottom-up studies, which are therefore a first important step for a reliable impact assessment.
2. 1 Bottom-up assessments of coastal impacts and adaptation Two are the main bottom-up methodologies that have been developed and used for the assessment of sea-level rise impacts on coastal areas with a global coverage. The first is the methodology developed in the Global Vulnerability Assessment (Hoozemans et al. 1993). The second is the DIVA tool, which consists of a global database and model. DIVA can be considered the successor of the Global Vulnerability Assessment (GVA1) and to date, it represents the main bottom-up approach to sea-level rise assessment. The GVA1 is a global application of the Common Methodology for Assessing the Vulnerability of Coastal Areas to Sea-Level Rise (IPCC CZMS 1992). This methodology was introduced to provide guidelines in the identification of population and assets at risk, in terms of a number of vulnerability indicators. Following the CZMS methodology, the key concepts in GVA1 are exposure and risk. A key indicator is Population at Risk (PaR), the product of the population density in a certain risk zone and the probability of a hazardous flooding event in that risk zone, taking into consideration standard of protections. This concept reflects changes in the population living in the risk zone (coastal flood plain), the flood frequency due to sea-level rise, and the protection standard of defenses. To arrive at the definition of PaR coastal population is used to compute the number of people in the hazard zone (exposed population ignoring defense measures). In order to estimate the portion of land threatened and estimate of the surge elevation is made. What actually drives SLR impacts is relative sea level rise, which is modeled as depending on surge characteristics, and subsidence, summing up local values for subsidence with expected sea level rises, in order to estimate the land surface potentially interested by flooding or storm surge. These areas are then converted to people in the hazard zone using the average population density for the coastal area. Lastly, the standard of protection is used to calculate PaR. Fundamental assumptions concern the characteristics of flood zone and the occurrence of flooding (the coastal flood plain has a constant slope, and the population is distributed uniformly across the coastal zone, and if a sea defense is exceeded by a surge, the entire area behind the sea defense is flooded). Another

5
issue that requires assumptions and judgments is the estimation of the standard of protection. Standards of protection have been estimated indirectly associating different protection classes (low, medium, high) to different classes of GNP/capita (less than 600US$, between 600 and 2400, above 2400). GVA1 provides the data for 192 polygons of varying size, in most cases corresponding to individual countries, though some countries are represented with more than one polygon. The development of a database that comprises this information for the globe has been an important contribution, as witnessed by the numerous subsequent studies using this data. It remains one the most influential in the field, still used by both bottom-up and top-down assessments (see e.g. Nicholls et al. (2010) on dike costs). Nevertheless at least five types of limitations have been stressed by subsequent studies:
1. the simplified treatment of impacts, flood risk, wetland losses, changes in coastal rice yields
2. the poor representation of non-climate drivers and of socio-economic factors 3. the limited representation of climate drivers. Only 1m global sea level rise is
considered. It assumes surge characteristics are constant over time and the impact of extreme events are not considered
4. the simplified treatment of adaptation. Protection costs are estimated indirectly by using GNP/capita in 1989 as an indicator of ability-to-pay parameter for a chosen level of protection. The level of adaptation is arbitrary. All areas with a population density above 10 persons/km2 are fully protected.
5. the limited spatial resolution. Results are valid only at regional or global scale. Regional results have been validated against national-scale vulnerability assessments (Nicholls et al. 1995)
Regarding the non-climate drivers, the impact of socio-economic assumptions, which have been demonstrated to be very important by subsequent studies, is neglected as the exercise is static. It assumes population and GDP to remain constant to 1990 levels and sea-level rise is imposed in the 1990 world. This could overstate the impact of sea-level rise and understate the role of socio-economic drivers. Another simplification is the assumption of a uniform subsidence rate of 15 cm/century across coastal zones. A first improvement of the GVA methodology is proposed by Nicholls et al (1999), who proposes a dynamic approach. Different global sea-level rise scenarios are derived from two General Circulation Models (CGMs) at the Hadley center. The main factors that influence the incidence and risk of flooding are also dynamically evolving over time. Population density in coastal regions is assumed to change twice the national population growth. Estimates of protection costs, the same classes of Hoozemans et al. (1993), have been revised to include deltaic regions where protection is more expensive. The study also introduces a module for assessing coastal wetland losses (salt marshes, mangroves, and associated unvegetated intertidal areas), contributing to improve the estimates of SLR impacts on coastal ecosystems. Wetlands responses to SLR are non-linear: losses arise only above some threshold SLR; low tide zones are more vulnerable; wetland losses can be compensated by some inland wetland migration as accommodation space is calculated. The study considers two alternatives with and without inland wetland migration and develop a non-climate trend as benchmark for comparison.

6
With these improvements the study estimated significantly higher risk of flooding with 1m SLR compared with the original Hoozemans et al. (1993) GVA1 estimates 46 million people affected by flooding in 1990 and 60 million people in 2100 with 1 m SLR. People living in the hazard zone (population exposed to SLR) was 200 millions in 1990. Nicholls et al. (1999) show that this would treble in 2080 without taking into account any sea level rise, as a sole consequence of population growth and population density increase (Table 1). The additional contribution of SLR is small (10% in 2080). Average number of people flooded increase even in the absence of SLR, depending on the standards of protection. Table 1 also shows that protection is very effective, a result that will be iterated in all subsequent studies.
Table 1: Global results from Nicholls et al. (1999)
No
protection Constant
Protection
Evolving Protection
(increasing with increases with GNP/capita)
Protection effectiveness
PHZ (People in the hazard zone,
millions)
AAPF (average
annual people flooded, millions)
AAPF (average annual people flooded,
millions) Constant
Protection Evolving Protection
2080s (no SLR) 575 36 13 -94% -98% 2080s (HadCM2
40cm SLR) 636 237 93 -63% -85% *PHZ: people at risk. AAPF: average people flooded
Five regions contain 90% of the average population flooded: Southern Mediterranean, West Africa, East Africa, South Asia, South-East Asia. South Asia accounts for 40% of global population at risk, reflecting numerous highly populated deltas in these regions. Results on Table 2 emphasizes the high vulnerability of small islands, which are characterized by the largest relative increase compared to 1990.
Table 2: Regional results from Nicholls et al. (1999)
Constant
Protection Evolving Protection
Protection effectiveness
AAPF (average annual people
flooded, millions)
AAPF (average annual people
flooded, millions)
Southern Med 13 6 -54%
West Africa 36 3 -92%
East Africa 33 5 -85%
South Asia 98 55
-44% (this might reflect higher
protection costs in deltaic regions)
South East Asia 43 21 -51%
Small islands 2.560 1.180 -54%
World 237 93 -61% *PHZ: people at risk. AAPF: average people flooded
7
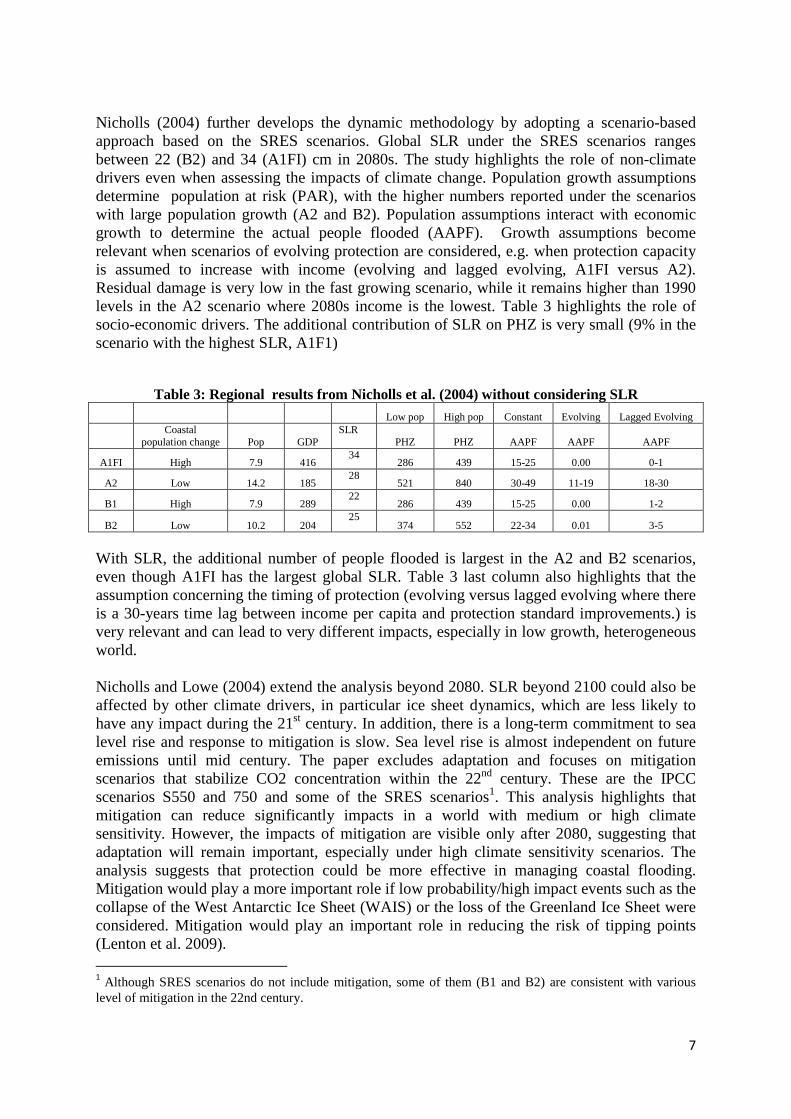
Nicholls (2004) further develops the dynamic methodology by adopting a scenario-based approach based on the SRES scenarios. Global SLR under the SRES scenarios ranges between 22 (B2) and 34 (A1FI) cm in 2080s. The study highlights the role of non-climate drivers even when assessing the impacts of climate change. Population growth assumptions determine population at risk (PAR), with the higher numbers reported under the scenarios with large population growth (A2 and B2). Population assumptions interact with economic growth to determine the actual people flooded (AAPF). Growth assumptions become relevant when scenarios of evolving protection are considered, e.g. when protection capacity is assumed to increase with income (evolving and lagged evolving, A1FI versus A2). Residual damage is very low in the fast growing scenario, while it remains higher than 1990 levels in the A2 scenario where 2080s income is the lowest. Table 3 highlights the role of socio-economic drivers. The additional contribution of SLR on PHZ is very small (9% in the scenario with the highest SLR, A1F1)
Table 3: Regional results from Nicholls et al. (2004) without considering SLR
Low pop High pop Constant Evolving Lagged Evolving
Coastal
population change Pop GDP SLR
PHZ PHZ AAPF AAPF AAPF
A1FI High 7.9 416 34
286 439 15-25 0.00 0-1
A2 Low 14.2 185 28
521 840 30-49 11-19 18-30
B1 High 7.9 289 22
286 439 15-25 0.00 1-2
B2 Low 10.2 204 25
374 552 22-34 0.01 3-5
With SLR, the additional number of people flooded is largest in the A2 and B2 scenarios, even though A1FI has the largest global SLR. Table 3 last column also highlights that the assumption concerning the timing of protection (evolving versus lagged evolving where there is a 30-years time lag between income per capita and protection standard improvements.) is very relevant and can lead to very different impacts, especially in low growth, heterogeneous world. Nicholls and Lowe (2004) extend the analysis beyond 2080. SLR beyond 2100 could also be affected by other climate drivers, in particular ice sheet dynamics, which are less likely to have any impact during the 21st century. In addition, there is a long-term commitment to sea level rise and response to mitigation is slow. Sea level rise is almost independent on future emissions until mid century. The paper excludes adaptation and focuses on mitigation scenarios that stabilize CO2 concentration within the 22nd century. These are the IPCC scenarios S550 and 750 and some of the SRES scenarios1. This analysis highlights that mitigation can reduce significantly impacts in a world with medium or high climate sensitivity. However, the impacts of mitigation are visible only after 2080, suggesting that adaptation will remain important, especially under high climate sensitivity scenarios. The analysis suggests that protection could be more effective in managing coastal flooding. Mitigation would play a more important role if low probability/high impact events such as the collapse of the West Antarctic Ice Sheet (WAIS) or the loss of the Greenland Ice Sheet were considered. Mitigation would play an important role in reducing the risk of tipping points (Lenton et al. 2009). 1 Although SRES scenarios do not include mitigation, some of them (B1 and B2) are consistent with various
level of mitigation in the 22nd century.

8
These analyses are based on exposure and risk rather than cost-benefit considerations. They evaluate the effectiveness of a given path for mitigation or adaptation. The ad-hoc assumption is that all dryland with a population density above 10 people per square meter is protected. We can classify these studies as bottom-up assessments of risk and exposure. Another type of bottom-up modeling proposes an economic, optimization approach. Fankhauser (1995) introduces an alternative approach based on cost/benefit algorithm that allows computing the areas that are economically optimal to defend. The fraction of vulnerable coast to be protected are derived from the comparison of the value of land at risk and the protection cost. The optimal protection level is that minimizing a total cost function composed by net present value of protection costs, dryland, net wetland, and capital loss. Minimization can be obtained by retreating (abandon the area), accommodating (accept the greater flooding), or protecting (build dikes) which compete against each other. There is a trade-off also between dryland and wetland protection. Wetland cannot be directly protected, but wetland adjustments (inland migration) can be halted by dryland protection (coastal squeeze). When optimal adaptation is allowed, protection is no longer uniform as assumed in previous studies (e.g. GVA1). The highest level of protection (100%) is observed in cities and harbors, where the value of land is sufficiently high. In other OECD areas such as open coasts and beaches protection ranges between 75% - 80% and 50% - 60%, respectively. The levels of optimal protection are much higher compared to local studies (for example Turner et al. 1995 for the UK). According to the recent critical assessment by Sugiyama et al. (2008) this is due to the assumption of low capital intensity implicit in the cost function formulation. This study shows that higher capital concentration would lead to lower protection levels. Sugiyama et al. (2008) also examine the implication of linear versus quadratic sea level rise. A quadratic share tends to postpone the bulk of costs, and thus would lead to lower protection costs even if the eventual outcome in 2100 would be the same. A first attempt to combine risk based approaches with economic analysis (based on the FUND model which is described in section 2.3) is presented in Nicholls and Tol (2006). The two methodologies however are not integrated but rather combined in a sequential manner. The two assessments conclude that, first, adaptation would be more effective than the mitigation considered, and, second, that the optimal level of protection is high. A similar approach but based on an improved methodology for the exposure analysis is followed by Anthoff et al. (2006) in the study preparation for the Stern Review. A GIS method is used to overlay geophysical (elevation and tidal range) and socio-economic data (population, GDP, national boundaries). The combination of different databases allows for a better description of the characteristics of flood zone, which crucially affects the computation of exposure indicators2 (for example, in GVA the coastal flood plain has a constant slope). This study suggests that the average slope of the coast increases above 1-m elevation. The distribution of all indicators considered (land area, population, GDP) increases relatively more from 0 to 1 m. From 1 m onward, it appears linear to 10m. This suggests that more land and people are in the most low-lying areas. It is interesting to note that what are the most exposes regions depends on the indicator considered. Whereas in terms of GDP (MER) East Asia and Europe are top in the list, in terms of population South Asia and East Asia account for 72% of globally exposed people.
2 Still results are subject to a number of limitations that are involved when managing and overlying different global databases, such as matching of data layer boundaries, variable resolution and data resampling, and input quality.
9
The exposure and risk methodology and the optimization modeling approach are fully integrated in the DIVA3 model. DIVA, which consists of a global database as well as a number of modules, is the basis for the most recent studies on sea level rise and coastal impacts. It is in fact the most detailed assessment in terms of impacts and adaptation with detailed spatial resolution. The DIVA tool includes a global coastal database, a set of consistent climatic and socio-economic scenarios, and a simulation model that allows evaluating the effect of climate and socio-economic changes and of adaptation of natural and human coastal systems at different scales, from regional to global. Both physical and economic impacts can be estimated. The model has a modular structure4, where each module represents a specific coastal subsystem. A number of modules compute the geodynamics effects of sea-level rise. Another module allows computing the socio-economic impact with and without adaptation measures. Compared to previous studies, DIVA allows all major direct impacts of sea-level rise to be quantified both in physical (e.g Km2 of land lost) and economic (e.g. value of land lost and adaptation costs) terms. These include: direct impact on erosion (land lost, sand lost), increased flood risk and inundation (dike height, people at risk, people actually flooded), coastal wetland loss and change (area of six different types of wetlands and monetary values of wetlands), salinisation (areas influenced by seawater intrusion into rivers). The set of adaptation options is also much broader than previous studies and includes: build dikes, migration, beach nourishment, tidal basin nourishment, wetlands nourishment (Hinkel and Klein 2006). Cost estimates for dikes and beach nourishment are based on Delft Hydraulics data and use the country cost factors by IPCC (1990) and Hoozemans et al. (1993). Different adaptation levels can be set. Optimal adaptation reflects a cost-benefit of the coasts of sea-level rise to society with the adaptation costs. The costing and adaptation module computes the economic impacts of sea-level rise and determines the level of adaptation. The impacts evaluated are:
• Land loss due to erosion and flooding • Forced migration • Wetland loss and change • Salinity intrusion
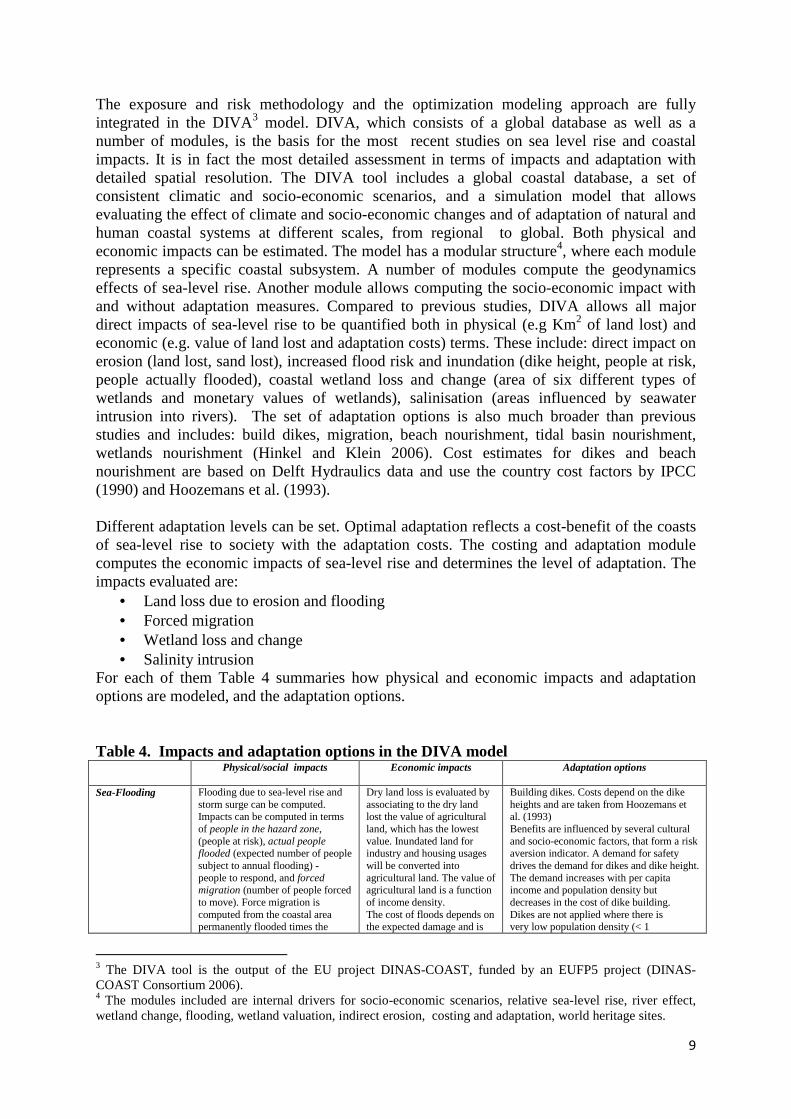
For each of them Table 4 summaries how physical and economic impacts and adaptation options are modeled, and the adaptation options. Table 4. Impacts and adaptation options in the DIVA model Physical/social impacts Economic impacts Adaptation options
Sea-Flooding
Flooding due to sea-level rise and storm surge can be computed. Impacts can be computed in terms of people in the hazard zone, (people at risk), actual people flooded (expected number of people subject to annual flooding) - people to respond, and forced migration (number of people forced to move). Force migration is computed from the coastal area permanently flooded times the
Dry land loss is evaluated by associating to the dry land lost the value of agricultural land, which has the lowest value. Inundated land for industry and housing usages will be converted into agricultural land. The value of agricultural land is a function of income density. The cost of floods depends on the expected damage and is
Building dikes. Costs depend on the dike heights and are taken from Hoozemans et al. (1993) Benefits are influenced by several cultural and socio-economic factors, that form a risk aversion indicator. A demand for safety drives the demand for dikes and dike height. The demand increases with per capita income and population density but decreases in the cost of dike building. Dikes are not applied where there is very low population density (< 1
3 The DIVA tool is the output of the EU project DINAS-COAST, funded by an EUFP5 project (DINAS-COAST Consortium 2006). 4 The modules included are internal drivers for socio-economic scenarios, relative sea-level rise, river effect, wetland change, flooding, wetland valuation, indirect erosion, costing and adaptation, world heritage sites.
10
population density in the areas. logistic in flood depth. The costs of migration are calculated on the basis of loss of GDP per capita.
person/km2), and above this population threshold, an increasing proportion of the demand for safety is applied.
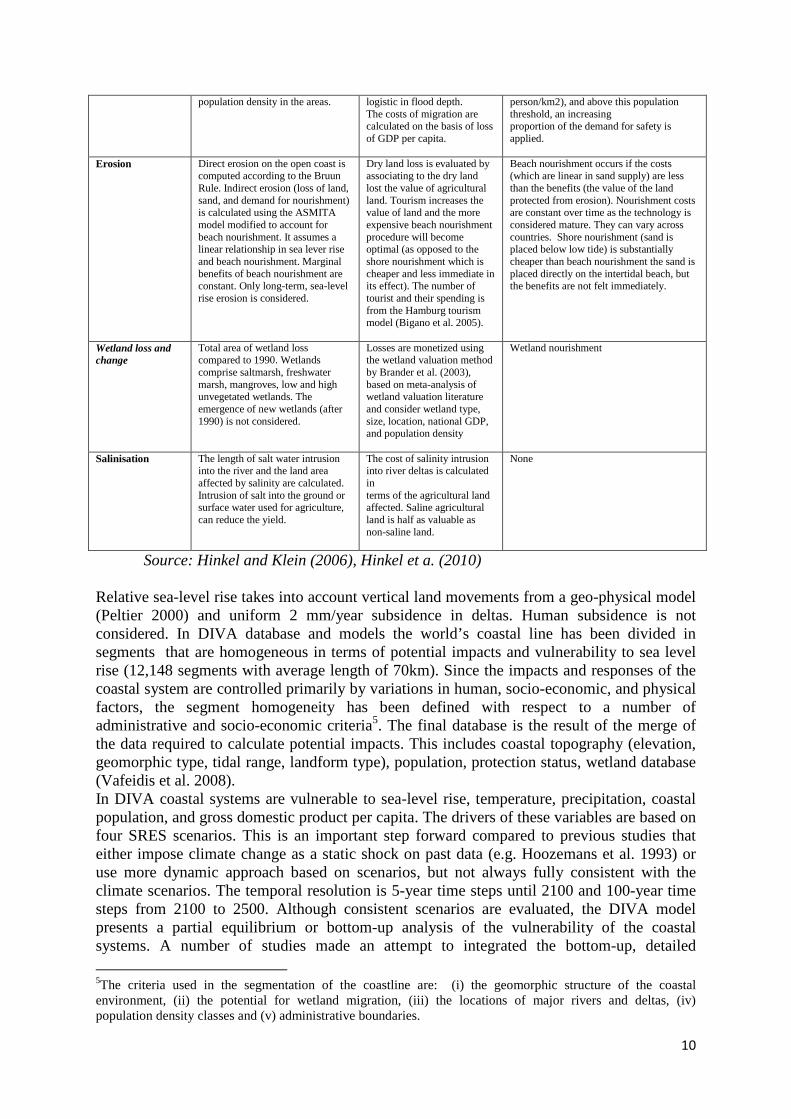
Erosion
Direct erosion on the open coast is computed according to the Bruun Rule. Indirect erosion (loss of land, sand, and demand for nourishment) is calculated using the ASMITA model modified to account for beach nourishment. It assumes a linear relationship in sea lever rise and beach nourishment. Marginal benefits of beach nourishment are constant. Only long-term, sea-level rise erosion is considered.
Dry land loss is evaluated by associating to the dry land lost the value of agricultural land. Tourism increases the value of land and the more expensive beach nourishment procedure will become optimal (as opposed to the shore nourishment which is cheaper and less immediate in its effect). The number of tourist and their spending is from the Hamburg tourism model (Bigano et al. 2005).
Beach nourishment occurs if the costs (which are linear in sand supply) are less than the benefits (the value of the land protected from erosion). Nourishment costs are constant over time as the technology is considered mature. They can vary across countries. Shore nourishment (sand is placed below low tide) is substantially cheaper than beach nourishment the sand is placed directly on the intertidal beach, but the benefits are not felt immediately.
Wetland loss and change
Total area of wetland loss compared to 1990. Wetlands comprise saltmarsh, freshwater marsh, mangroves, low and high unvegetated wetlands. The emergence of new wetlands (after 1990) is not considered.
Losses are monetized using the wetland valuation method by Brander et al. (2003), based on meta-analysis of wetland valuation literature and consider wetland type, size, location, national GDP, and population density
Wetland nourishment
Salinisation
The length of salt water intrusion into the river and the land area affected by salinity are calculated. Intrusion of salt into the ground or surface water used for agriculture, can reduce the yield.
The cost of salinity intrusion into river deltas is calculated in terms of the agricultural land affected. Saline agricultural land is half as valuable as non-saline land.
None
Source: Hinkel and Klein (2006), Hinkel et a. (2010) Relative sea-level rise takes into account vertical land movements from a geo-physical model (Peltier 2000) and uniform 2 mm/year subsidence in deltas. Human subsidence is not considered. In DIVA database and models the world’s coastal line has been divided in segments that are homogeneous in terms of potential impacts and vulnerability to sea level rise (12,148 segments with average length of 70km). Since the impacts and responses of the coastal system are controlled primarily by variations in human, socio-economic, and physical factors, the segment homogeneity has been defined with respect to a number of administrative and socio-economic criteria5. The final database is the result of the merge of the data required to calculate potential impacts. This includes coastal topography (elevation, geomorphic type, tidal range, landform type), population, protection status, wetland database (Vafeidis et al. 2008). In DIVA coastal systems are vulnerable to sea-level rise, temperature, precipitation, coastal population, and gross domestic product per capita. The drivers of these variables are based on four SRES scenarios. This is an important step forward compared to previous studies that either impose climate change as a static shock on past data (e.g. Hoozemans et al. 1993) or use more dynamic approach based on scenarios, but not always fully consistent with the climate scenarios. The temporal resolution is 5-year time steps until 2100 and 100-year time steps from 2100 to 2500. Although consistent scenarios are evaluated, the DIVA model presents a partial equilibrium or bottom-up analysis of the vulnerability of the coastal systems. A number of studies made an attempt to integrated the bottom-up, detailed
5The criteria used in the segmentation of the coastline are: (i) the geomorphic structure of the coastal environment, (ii) the potential for wetland migration, (iii) the locations of major rivers and deltas, (iv) population density classes and (v) administrative boundaries.

11
information from DIVA with top-down macroeconomic models. They will be reviewed in Section 2.3. Partial equilibrium applications of the DIVA model include mostly applications to Europe. Applications to other regions are also being carried out6. The PESETA (Projection of economic impacts of climate change in sectors of the European Union based on bottom-up analysis) project uses the first version of the DIVA model to estimate the physical and monetary impacts of climate change on coastal systems in Europe under two SRES scenarios (Richards and Nicholls 2009). Sea-level rise is consistent with the output of general circulation models (HadCM3 and ECHAM4) and ranges between 25.3 and 58.5cm for the A2 scenario model and between 19.4 and 50.8 cm for the B2 scenario. A high sea-level scenario is also considered (88cm). Physical impacts indicate that adaptation can reduce impacts by an order of magnitude between two and three. Both land loss and people flooded increase significantly with sea-level rise if adaptation is not considered. However, adaptation (beach nourishment and dikes) can greatly reduce damages (Table 5), with a positive net benefit already in 2020 and increasing over time. PESETA also offers a general equilibrium assessment of the related GDP implication. This is presented in Section 2.3 Table 5: Physical and economic impacts of sea-level rise in Europe as estimated in the PESETA
study for Europe.
People Damage Adaptation Flooded (thousands
per year) Cost (million/euro,
1995 values) Cost (million/euro,
1995 values) Medium sea-level rise scenario from
the ECHAM4 model
A2 B2 A2 B2 A2 B2 (43.8 cm in the A2 scenario and 36.7
in the B2 scenario)
2080s w/o ada 674 404 13796 12532 0 0
2080s with ada 35 24 1275 960 1300 990
-95% -94% -91% -92%
High sea-level rise scenario from the ECHAM4 model
A2 B2 A2 B2 A2 B2 (58.5 cm in the A2 scenario and 50.8
in the B2 scenario)
2080s w/o ada 1420 909 18632.3 16097.3 0 0
2080s with ada 36 25 1453.5 1026.3 1717 1288.4
-95% -97% -91% -92%
Hinkel et al. (2010) use a more recent version of DIVA with improved data on elevation7 with higher resolution (90m instead of 1km) and some other parameters. Impacts are simulated for the scenarios A2 and B1. Both scenarios are characterized by increasing GDP per capita, though much more in the B1 scenario where population declines after 20408.
6 See for example the study for Japan and China, http://www.scribd.com/doc/70494572/Sea-Level-Rise-Impacts-and-Adaptation-Costs-for-Japan-ROK-and-PRC, or for Tanzania http://economics-of-cc-in-tanzania.org/images/Tanzania_coastal_report_draft_vs_2_1_.pdf. 7 It is important to keep in mind that what actually matters for sea-level rise impacts is the relative sea-level rise, which depends on vertical accuracy. Data from digital elevation models (Rabus et al. 2003) used in this paper are the most accurate at present and are from the shuttle radar topography mission (SRTM).
8 Another difference compared to PESETA is the climate module. While Hinkel et al. (2010) used the DIVA’s default climate module CLIMBER-2, the PESETA project used the ECHAM4 and HADCM3 GCM, essentially for internal consistency.

12
As shown in Table 6, Hinkel et al. (2010) find that the sum of damage and adaptation cost is significantly lower than damage costs without adaptation, in accordance with the PESETA simulations (Richards and Nicholls 2009). The study also highlights the contribution of different impacts with sea-flood and salt intrusion being the most important in the short-run and migration becoming the main cost item in the second half of the century. With adaptation, salinity intrusion remains the major damage item, as no adaptation options are considered to deal with this damage component. The study also highlights the interaction with tourism. The rise in tourism drives up the demand for beach nourishment, as beaches become more valuable. Table 6: Physical and economic impacts of sea-level rise in Europe as estimated in the Hinkel et
al. (2010) study for Europe.
People Flooded
(thousand/year)
Land Loss
(km²/year)
Damage Cost
(million
euro/year)
Adaptation
Cost (million euro/year)
Total Cost
(million euro/year)
A2 B1 A2 B1 A2 B1 A2 B1 A2 B1 2100 w/o ada 776.2 204.5 16.4 12.2 16,933 17,496 0 0 16,933 17,496 2100 with Ada 3.4 1,8 0 0 2,291 1,917 3,536 2,621 5,827 4,538
-100% -99% -100% -100% -86% -89% -66% -74%
The Climate Cost Project (Brown et al. 2011) evaluates climate change impacts on various sectors in Europe. It compares coastal impacts and adaptation costs under the SRES scenario (A1B) with a mitigation scenario consistent with a global temperature increase of 2°C. SLR is similar in the two scenario until 2050, and after that date sea-level rise is stabilized, though not decelerated. Results are reported in terms of number of people at risk (people living in areas characterized by 1 in 1000 year flood), the number of people to move (people living in areas characterized by 1 in 1 year flood), total damage costs, and adaptation costs. This study, similarly to Hinkel et al. (2010), estimates the physical impact on wetlands, but it does not compute the monetized loss associated with the estimated loss of wetland, between 10 and 35% compared to 1995 levels. Economics damages are thus largely underestimated as previous studies found large impacts associated with ecosystem losses. The studies described in this section analyze impact and adaptation on coastal systems with a partial equilibrium perspective. As seen, the role of the socio-economic context is captured typically with a scenario approach. This is however an exogenous input to the analysis and thus not influenced by the social and economic changes triggered by the impacts themselves. In other words, the assessment of protection measures (dikes, beach nourishment, port upgrade, infrastructure upgrade) and residual damages (value of dryland and wetland lost, value of capital lost), indicate the direct costs. The feedback they can then exert through modified population movements, renovation investments or price changes are not accounted for. To capture these second-order effects, the literature increasingly proposes the use of computable general equilibrium models. Because of their explicit representation of domestic and international market exchanges, they appear particularly appropriated to provide insights on how sea-level rise impacts, which typically affect directly just some areas, countries or economic activities, affects the rest of the economy. Because of all these interactions the final economic effect of SLR (indirect cost) can be quite different from its direct cost.
13
The analysis conducted with CGE models however, is unable to endogenously compute the optimal (cost efficient) level of coastal protection. When this is considered, it derives from indication proposed by bottom up models like DIVA or even Fankhauser (1995). Moreover, with these approaches it is also difficult to compare the effect of adaptation and mitigation policies on sea-level rise, and to investigate the relation between the two. The top-down approaches developed to consider these aspects are presented in the next section.
2.2 Top-Down Computable General Equilibrium assessments of sea-level rise The use of CGE models for the economic assessment of SLR is usually part of wider integrated assessment exercises, where it usually constitutes the “end of pipe” evaluation step of a “soft-linking” approach. Climatic variables, sea-level rise, physical consequences and finally their economic evaluation belong to separated modeling exercises, which are then connected in a sequential process: climate models generate sea-level rise scenarios which are inputs to the coastal model, whose outputs, once translated into changes of key economic variables represented in CGE models, are the final input for the economic assessment9. Sea-level rise is usually modeled as a loss of productive capital and/or land. Sometimes forced migration is also included through increased household expenditure or a decreased labour productivity. CGE models typically do not define the optimal level of coastal protection, but at best can compare the cost of different pre-set level of protection with the cost of inaction. Cost of coastal protection are usually subtracted from national capital stocks, therefore assuming they do not contribute to the production of GDP, but just to offsetting climate damages. In some studies , they increase capital stock, through forced investment, but in doing so they displace consumption. A seminal effort of coupling sea-level rise and CGE is provided by Darwin and Tol (2001). The FARM CGE model is used to assess the GDP implication of a 0.5 meter sea-level rise with and without optimal protection. The optimal land area to be protected is computed using the module of the FUND model (Tol 2002a, 2002b), which is based on the Fankhauser (1995) optimality condition. FARM offers a quite sophisticated representation of land and of its value, which is not only differentiated by classes and uses, but also geographically as the model includes a GIS module. Sea-level rise in FARM is simulated by reducing land and capital quantities by uses and classes. The direct protection cost is composed of the cost of protection proper, of fixed capital and land lost which are instantaneously subtracted from regional endowments and cannot concur anymore to the production of goods and services. In the no protection case, the annuitized total cost for 50 cm of sea-level rise in 2100 reaches nearly US$66 billion. The highest losses among OECD countries are the nearly US$7 billions of Europe. Asian economies as a whole would lose US$42 billions. Direct cost of optimal protection are a tiny percent of regional GDP, however the final impact on welfare, measured by equivalent variation, is 13% larger. It is not equally distributed,
9 Soft-linked approaches are amply used in integrated assessment as they can reach a high detail in the representation of each different dimension involved in the analysis., Nonetheless the links between the different parts may show inconsistencies and non converging solutions. In addition, the computational burden is high. This often precludes the possibility of performing fully intertemporal optimization exercises, as some feedbacks could not be closed. Accordingly they mostly originate policy simulation or if-then exercises by assessing the (direct and higher order) costs of environmental policies.
14
though. It tends to be much larger in developed region (8 to 43%) than in the developing ones (4 to 10%). International trade tends to redistribute losses from high damage to low damage regions. The major limits of the study is the comparative static approach. The sea-level rise scenario is imposed on the 1990 socio-economic situation and therefore economic impacts are very likely underestimated. They study also points out at the importance of the assumptions in terms of capital and land values, as they significantly affect optimal protection levels. A general equilibrium approach has been used also by Deke et al., (2002) which restrict their study to the costs of coastal protection, ignoring land loss and its wider economic consequences. As in Darwin and Tol (2001), but with the relevant difference that their model is recursive dynamic, in Deke et al. (2002) the costs of coastal protection are subtracted from investment; this essentially reduces the capital stock, and hence economic output. They estimate a direct protection costs against 13 cm. of sea-level rise in 2030 ranging from 0.003% of GDP in Western Europe to 0.01% in North Africa and Middle East, and a final GDP loss ranging from 0.006% of Western Europe and the 0.087% of North Africa and Middle East with respect to the no protection case. Bosello et al. (2007) also use a static CGE model to evaluate potential cost of 0.25 m of sea-level rise and that of total protection. The main novelty respect to Darwin and Tol (2001) and Deke et al (2002) is that protection costs are not subtracted but rather added to investment with a displacement effect on consumption. In addition, the reference is an ideal 2050 economic system. When sea-level rise is implemented as a loss of productive land, GDP losses are negligible peaking to 0.03% in the China and India aggregate. When also capital losses are included, albeit remaining moderate, they increase significantly (the largest looser are now the net energy exporter regions with the 0.096% loss). The highest increase (roughly 10-fold) is experienced by developed regions which have a higher value of capital at risk (the biggest loser among them is Japan incurring a cost of the 0.054% of GDP). When total protection is implemented, GDP expands as forced higher investment inflates the economy (biggest gainer the Rest of Annex 1 countries with 0.1%), however utility is smaller than in the case of no protection as consumption is reduced. Direct effects differ from final impacts, and on balance tend to be smaller, moreover the distribution of direct and final costs turn to be highly different. Similar results are found by Bosello et al. (2012) within the PESETA project. They highlight the huge difference between the direct costs of the DIVA model and indirect costs of the static CGE model. Direct costs of land losses are different from GDP costs (in 15 out of 25 cases higher), and their distribution also changes. Market mechanisms explain the cost redistribution. Land and agricultural prices increase, with a benefit for net food exporters such as the EU. The net GDP loss at the word level reduces the demand of energy commodities, causing a reduction in their prices, with negative effects on energy exporters. This leads to an improvement on terms of trade in the EU. Policy implications can also differ depending on the model used. While in DIVA the benefit-cost ratio of optimal protection is always greater than one, in 12 out of 25 EU countries, global GDP under optimal protection is lower than without adaptation. The authors offer some guidelines for the interpretation of these results: the static nature of the CGE model unable to fully capture the expansive role of investment fostered by coastal defense; property losses not captured by GDP and sea-level rise effect modeled only as a loss of productive land, thus affecting primarily the agricultural sector disregarding effects on infrastructure and population. Indeed when these are accounted for, impacts are much higher (see below Ciscar et al. 2012). Recent studies have proposed a CGE-based joint assessment of sea-level rise and other climate change impacts. These studies allow evaluating the relative weight of the different

15
impact categories and the role of impact interaction. The use of recursive dynamic models is also more extensive compared with previous works. Bigano et al. (2008) analyze the economic implication of climate-induced sea-level rise and impacts on tourism activity. Tourism impacts are derived from a global model of tourism flows (HTM, see Bigano et al. 2007 ). The exercise models a direct relation between the two as changes in tourism flows are not only driven by climatic attractiveness, but also by the regional availability of coastal land. Tourism impacts are simulated with an exogenous change in market services demand. The economic impacts associated with tourism dominate the economic impacts associated with land loss due to sea-level rise by roughly an order of magnitude. Only in South and South East Asia the impacts lead to comparable economic losses. This suggest that demand-side impact, by affecting the composition of services consumption and thus production, is by far more relevant than the relatively small supply side shock due to land loss, which prevalently affects agricultural industries. The study also shows that impact interaction plays a role as GDP effects of impacts jointly considered are often larger than the sum of GDP effects of the two impacts considered separately. Within the PESETA project Ciscar et al. (2012) apply the static CGE model GEM-E3 to analyze the joint impacts of climate change on tourism, agriculture, river floods and coastal system on the EU economy. The temperature increase considered ranges from 2.5°C to 5.4°C and sea level is assumed to rise from 0.49 m to 0.88 m respectively. Resulting impacts are imposed on today’s economy. Effects of sea-level rise consist in floods and forced migration. Flooded areas and people displaced derive from DIVA model estimates and are then implemented into the CGE model as loss of productive capital and additional households’ expenditure, respectively. This additional expenditure does not provide a welfare gain, but it represents a welfare loss since households are forced to migrate. Sea-level rise builds a considerable share of welfare (measured by households’ consumption and leisure) and GDP losses. Depending on the temperature scenario, climate change can impose a total welfare loss to the EU as a whole ranging from the 0.22% to the 0.98%. The 72% and 47% of it respectively are due to impacts on coastal systems. These are particularly acute in central and northern Europe to reach 80% of total losses in British Isles. Bosello et al (2010, 2012) within the CIRCE and the CLIMATECOST projects propose a similar analysis for the Mediterranean and the EU respectively using a dynamic CGE model compounding. CIRCE analyses impacts on sea-level rise, tourism and energy demand impacts. CLIMATECOST extend the assessment to include also health, agriculture and river flooding. In both cases input information on land lost in mid century is derived from an updated version of the DIVA model for different sea-level rise scenarios. Both studies show that impacts of sea level rise are higher in Northern than in Southern EU. According to the CIRCE study the GDP loss would be 0.4 and 0.1% for Northern and Southern EU, respectively. According to the CLIMATECOST study the GDP loss would be 0.2 and 0.025% for Northern and Southern EU, respectively. The North African shore of the Mediterranean would have impacts somewhat in between North and South Europe. The use of recursive dynamic models tends to amplify negative impacts trough the multiplicative effect of disrupted investment that mimics infrastructural losses with respect to static assessments. A robust finding is the increase of land and agricultural prices that offset land losses in net food exporting regions like the EU through a positive terms of trade effect. The CGE models reviewed need land losses or other direct impacts as inputs, and they cannot tell anything regarding the optimal level of protection. They are also not able to inform about the trade-off between adaptation and mitigation, for two reasons. They lack the integration with climate models. Second, they do not model adaptation investments as a choice variable. Issues related to the optimal level of adaptation and the trade-off with mitigation can be addressed with top-down integrated assessment models, reviewed in Section 2.3.

16
2.3 Top-Down optimization assessments of sea-level rise A first step to endogenize coastal protection choices and to compare the effectiveness of adaptation and mitigation is provided by Tol (2007). Tol (2007) proposes a framework for studying optimal adaptation to sea-level rise and the trade-off between adaptation and mitigation. The analysis is based on the FUND model version 2.8n10 which consists of a set of scenarios on the basis of which a set of impacts are computed. The scenarios for population and economic growth are perturbated by the impacts of climate change. Population changes with climate-induced migration. Consumptions and investments are also reduced, without changing the saving rate. This reduces also GDP. The endogenous part of the model consist of a simple climate module (Tol 1999). Damages can be related to both the rate of change in temperature as well as the level of change. The climate impact module is based on Tol (2002a, 2002b), which describe static and dynamic estimates of climate change damages in different sectors, including sea-level rise. Estimates are provided for 9 macro-regions. Both static and dynamic estimates rely on the optimality condition derived in Fankhauser (1995). Dynamic estimates rely on projected protection costs, wetland and dryland losses and values. Land loss is linear in sea-level rise11; the value of dryland is linear in income density; wetland values are logistic in per capita income; migration is a function of land lost and average population density. Migration costs are three times the regional per capita income per migrant. The migration costs, however, are low compared to sea wall construction costs. Wetland losses are caused by both the rising sea level and the building of protection measures. Dryland losses and wetland losses due to sea level rise together constitute the residual damages. Using the Fankhauser (1995)’s first order condition, optimal protection sea-level rise is derived for the set of parameters and costs assumed. Most of the static data are from GVA (Hoozemans et al. 1993 and Bijlsma et al. 1996). Sensitivity of optimal protection is assessed for different assumptions on value of dryland. Tol (2007) shows that, because of the slow reaction of sea-level to temperature, mitigation can reduce sea-level rise impact by 10% at most. The analysis distinguishes the mitigation benefits net and gross of the mitigation costs. Although mitigation reduces adaptation costs, by reducing GDP, it can also reduce the potential to adapt. This income effect is more pronounced in rich countries. Anthoff et al. (2010) use a similar framework (FUND version 2.8) to study the effect of substantial sea-level rise up to 2 m per century at regional level. Protection costs are modified to be a function of the rate of sea-level rise and the proportion of protected coast. The cost-benefit analysis that determines optimal protection comes from the application of the Fankhauser (1995) model. Protection costs are calibrated to grow much more rapidly if sea-level rise is faster than 1 cm per year. The study shows that while damages increase exponentially between 0.5 and 1 m rise, they double between 1 and 2 m rise. In all cases total damages increase less than protection costs, confirming previous findings that protection is rational even with a large rise in sea level. Among the damage components considered (dryland loss, wetland loss, migration, and protection costs) the most important in size are protection costs and wetland loss. Interesting
10 Version 2.8n runs at its maximal spatial resolution, 207 countries. This model version 2.8 has instead 16 regions. 11 Anthoff et al. (2006) and Nicholls et al. (2008) suggest that the average slope of the coast increases above 1-m elevation (relative to high water). A linear assumption therefore is likely to overestimate impacts.

17
to note that while wetland losses increase with per capita income, the other damage components decrease because more protection is implemented. Because protection costs increase rapidly with sea-level rise, optimal protection with 1 m sea-level rise is lower than in the 0.5m scenario. Adaptation reduces damages more effectively in the 0.5 m rise scenario (by a factor of 3.5 as opposed to the 1 or 2m rise case where it is reduced by a factor of 1.4). Regarding the distribution, a few regions experience most of the costs, especially East Asia, North America, Europe and South Asia. Damages are higher in densely-populated coastal areas in East Asia and South Asia. Small islands also bear large damages that, although small in size, are significant relative to their economy. The study recognizes the risk of overestimating protection levels (a result that tends to be common to optimization, aggregate studies12) and the risk of underestimating the adaptation response retreat. Such response could be encouraged by other environmental concerns (e.g. wetland preservation) or extreme events, which have been neglected by most modelling analyses. Nicholls et al. (2008a) in fact show that retreat could be larger when considering the acceleration in global sea-level rise that could be triggered by the collapse of the West Antarctic Ice Sheet. The volume of the West Antarctic Ice Sheet corresponds to a 5 to 6m rise in global sea-level. By coupling an exposure analysis (based on GIS data analysis) with an economic assessment using the FUND model, the paper shows that when SLR increases above 2m, the optimal protection rates fall from 85 to 50%. Nevertheless, protection costs increase dramatically to 30 billion per year. They also discuss that such increase in protection investments would displace significant resources for other usages. But the macroeconomic effect of investment reallocation are not captured by the FUND model. Therefore, macroeconomic costs are likely to be underestimated. Sea-level rise impacts have also been incorporated with other impacts to calibrate a reduced-form damage function for Integrated Assessment Models (IAMs). Although results for coastal impacts in isolation do not exist, it is interesting to compare the assumptions made in different IAMs. A comparison between the AD-DICE, AD-RICE, and AD-WITCH models is provided in Agrawala et al. (2011). While AD-DICE and AD-RICE use inputs from the FUND model, AD-WITCH relies on the bottom-up estimates of the DIVA model. The modelling of adaptation is also different. While AD-WITCH consider sea-level rise adaptation as a stock measure, AD-DICE and AD-RICE also describe the flow component due to migration, tough this remains small compared to seawalls and dike protection. The two modelling approaches yield quite different protection levels. Protection levels in AD-RICE are generally much higher than AD-WITCH, especially for some developing regions.
2.4 Modeling approaches to extreme events and sea-level rise Coastal zones are areas where multiple environmental hazards coincide with concentrated economic activity and population (Small and Nicholls 2003). Sea-level rise is only one of the hazards coastal zones are exposed to and interactions with other natural (e.g. hurricanes) or climate- and human-induced (e.g. intensified hurricanes or subsidence) geophysical changes can exacerbate sea-level rise impacts. On the one hand, mean sea level rise will very likely contribute to increase extreme coastal high water levels. On the other hand, extreme water levels will affect exposure and sea-level rise impacts. Although there is no evidence that global warming will increase the frequency of storms, it is very likely that they will become more intense (in terms of maximum wind speed) and characterized by heavier precipitations,
12 Turner et al (1995) show that, although the protect strategy is economically justifiable on a region-wide basis in most scenarios, on a more localised scale 'do nothing and retreat' might be an optimal response.

18
at least is some areas. Recent studies suggest that the increases in the frequency and intensity of tropical cyclones observed recently can be partly attributed to climate change (Emanuel 2005; Webster et al. 2005). The impacts of coastal flooding due to mean, long-term trend in sea-level rise will exacerbated by extreme sea levels due to tropical and extratropical storms (see the IPCC SREX report). The studies discussed in Section 2.1 and 2.2 consider the impacts of gradual, long-term, rise of mean sea-level. Scenarios and exposure assessments are based on the SRES scenarios and sea-level rise projections from the 4AR are mostly due to thermal expansion, while the contribution of ice sheets is very limited. Surge characteristics are assumed to remain constant throughout the century, despite variation in temperature and mean sea-levels. Some recent studies look at the coupled impact of storm intensification and mean SLR. In most cases a bottom-up approach based on hydrodynamic models is adopted. The effect of non-tropical storms on the Atlantic coasts of Europe and Canada has been studied using tide/storm surge models (Gonnert 2004; Danard et al. 2003; Demernard et al. 2002; Lowe et al. 2001). The advantage of this modeling approach is the spatial detail. For example, Lowe et al. (2001) emphasizes that spatial heterogeneity matters even within the boundary of a country (United Kingdom). Extreme surge height could increase due to meteorological factors but also due to changes in mean sea-level, which is the dominant factor in most areas. McInnes et al. (2009) and Brown et al. (2010) examine the relative impact of mean sea-level rise and wind speed in Australia and Ireland, respectively, and conclude that sea level rise has a larger potential than meteorological changes to increase extreme sea levels. Mousavi et al. (2011) use a hydrodynamic model for hurricane and flood elevation to evaluate the effect of warming (sea surface temperature) on hurricane intensity and the impact of hurricane surge on flooding. Sea surface temperature projection are obtained from the MAGICC/SCENGEN model for three IPCC future climate scenarios B1, A1B, and A1FI, varying the climate sensitivity. Future hurricane intensity scenarios were developed by combining projected sea surface temperature and historically observed hurricane central pressure for three selected historical hurricanes. Flooding elevation is decomposed in the SLR component and the hurricane intensity contribution, which ranges between 30 and 40%, though it could increase to 50% when the intensity of very intense, large hurricanes producing catastrophic-type surge conditions are considered. The study confirm the finding in Ali (1996, 1999), that is the influences of SLR and storm intensification must be evaluated together. In some areas, in fact, hurricanes could contribute to causing flooding and damage as much as SLR. Based on these studies, the IPCC SREX report concludes that mean sea-level rather than changes in the characteristics of storms affect the extreme coastal high water. These studies are very detailed, but do not analyze the socio-economic consequences of extreme water levels or flooding. A step in this direction is made by a group of studies that add socio-economic considerations Nicholls et al. (2008) estimate and rank the exposure of major coastal cities with more than 1 million inhabitants (in 2005) to coastal flooding due to high wind and storm surge. They combine the effect of a global rise in sea-level of 0.5m with subsidence and the intensification of storms. This latter effect is captured by a storm enhancement factor that reflects the potential increase in extreme water levels due to more intense storms. The enhancement factor is set equal to 10%, based on Walsh and Ryan (2000), who estimate that a 10% increase in tropical cyclone intensity leads to a 10% increase in 100-year storm surge level. As a consequence, depending on the region, areas can be exposed to extreme water levels between 0.5 and 1.5m. Having computed city population, elevation data are used to derive population exposed. Assets exposed are computed by multiplying exposed people and per capita income. The analysis is based on exposure, and it does not consider the effect of protection, if not for the few cities with known protection standards. The study indicates that

19
sea-level rise alone leads to larger exposure compared to storm intensification. The second result is the important role of socio-economic assumptions, which is the main driver of exposure in developing countries. Human-induced subsidence has a similar effect of storm intensity. Nicholls et al. (2010), using the DIVA model, find that the additional protection costs due to a 10% increase tropical cyclones would be 9% in 2040. Though this could be higher (13%) in some regions, it remains small compared to the overall additional costs due to high sea-level rise. Dasgupta et al. (2009) apply a similar methodology to study the vulnerability of the world’s coastal zones to intensification of storm surges. A detailed GIS analysis is used to estimate the impact of future storm surge increases associated with more intense storms and a 1m sea-level rise. Data on coastal attributes and surge are from DIVA. After delineating future inundation zones, this information is overlaid with indicators for coastal populations, settlements, economic activity, and wetlands. Results indicate very heavy potential losses that are much more concentrated in some regions and countries than others. Highly vulnerable large cities are concentrated at the low end of the international income distribution. The major limitation of this study is the evaluation of exposure assuming current population, socioeconomic, and land use patterns. Another important limitation is the exclusion of small island states from the analysis, which are actually particularly vulnerable due to the large fraction of land at low elevation. A few top-down Integrated Assessment Models have also made an attempt to integrate the damages due to Tropical (Mendelsohn et al. 2009) and Extratopical storms (Narita et al. 2010). Mendelshon et al. (2009) project global and regional damages caused by tropical storms under different climate scenarios. The results of climate models are used to generate thousands of hurricane tracks for both current and future damage. Economic damages are then computed using an estimated damage function. Hurricane damages are regressed on storm characteristics (magnitude, location, damage) and vulnerability drivers (population density, income) is estimated using US data. International data are used to estimate how damage changes with vulnerability. Narita et al. (2009) introduce a damage function into the FUND model. However, both Mendelshon et al. and Narita et al. do not make explicit the link between storm intensity, surge characteristics, and extreme sea water levels.
3. Current state on modeling impacts and adaptation to sea-level rise and extreme events. Discussion of policy implications of main results What is the optimal adaptation level? Different modeling approaches come to very different conclusions on the optimal level of adaptation to sea-level rise. In general, bottom-up studies support widespread coastal protection. This outcome is common to economic optimization studies and risk/exposure assessments. Nicholls and Tol (2006) uses both approaches to conclude that an arbitrary level of adaptation would be very effective and that adaptation would also make economic sense. Although these studies can be considered optimistic in terms of socio-economic assumptions, at the same time they underestimate the true portfolio of adaptation options. Therefore, if they

20
underestimate adaptation costs on the one hand, they overestimate it on the other hand. A key assumption however is that as economic growth instantaneously translates into the potential to build dikes and the investment in coastal protection do not displace investments for other usage. On the other hand, CGE models show that indirect costs with adaptation are larger (because investments displace consumption) and therefore no protection might be preferred. What is the optimal mix between mitigation, adaptation, and economic growth? The studies reviewed in Section 2 emphasize the effectiveness of protection to sea-level rise. Cost-benefit analyses suggest very high optimal protection levels. Exposure studies that evaluate a given protection level derive high benefits from adaptation. The studies that consider higher rise in sea-level or coastal impacts in mitigation scenarios also highlight the role of mitigation. Adapting to 2m global sea level rise would be quite different than adapting to 0.5m sea-level rise. Nicholls et al. (2011) show that, although in some regions, Europe and the North America, impacts are small for a 0.5 m sea-level rise, they become significant for a 2m rise, when the existing defense measures are no longer effective. Protection costs would increase significantly, especially in developed regions, and mostly driven by dike and dike maintenance costs13. While adaptation makes economic sense and in fact adaptation plans to high sea-level rise are being tested on some European cities, the question is the capacity of implementation in poor and exposed countries. Brown et al. (2011) examine coastal impacts in a mitigation scenario consistent with the 2°C target. An interesting result is that mitigation could narrow significantly the uncertainty range of people affected, from 131-865 to 50-185 thousands. In addition, mitigation increases the benefit-cost ratio of adaptation (Table 7). These studies suggest that also in the case of policy response to coastal impacts, adaptation and mitigation should be combined. While adaptation would make economic sense already in the short-term, as in fact it is already implemented in many coastal areas, mitigation would have benefits in the second half of the century by reducing the damage adaptation will be coping with. An effective policy strategy needs to combine mitigation and adaptation. This is emphasized mainly by studies that extend the analysis beyond 2080. It is in fact over the longer run that variables such as ice sheet dynamics become more relevant (Nordhaus 2010), which instead until 2100 are less likely to have visible impacts. In addition, there is a long-term commitment to sea level rise and response to mitigation is slow. Sea level rise is almost independent on future emissions until mid century. Nicholls and Lowe (2004) highlight that mitigation can reduce significantly impacts in a word with medium or high climate sensitivity. They reach these conclusions by analyzing the IPCC scenarios S550 and 750 and some of the SRES scenarios. Although SRES scenarios do not include mitigation, they are consistent with various level of mitigation in the 22nd century. The impacts of mitigation are visible only after 2080, suggesting that adaptation will remain important, especially under high climate sensitivity scenarios. Nicholls and Tol (2006) suggest that protection could be effective in managing coastal flooding. Mitigation would play a more important role if low probability/high impact events such as the collapse of the West Antarctic Ice Sheet (WAIS) or the loss of the Greenland Ice Sheet were considered. Mitigation would play an important role in reducing the risk of triggering tipping points (Lenton et al. 2009).
13
Nicholls et al. (2011) uses the DIVA model to evaluate the potential impacts of 0.5 and 2 m global mean rise in sea-level rise. This requires a revision of some assumptions. In particular, dike costs are raised offline by four times compared to the cost of building a 1 m dike. Maintenance costs (1% per year) are also added offline. They also make use of results produced from the FUND model, which is an optimization model (see the next section) to account for the fact that when costs increase by four times, 25% of the developed coastal zone is abandoned.

21
Table 7: Brown et al. 2011: Selected Results in 2080s
A1B E1 Population 448 461
GDP 53,838 45,844 Number of people at risk
(Thousand of people) 121-425 40-145
Number of people to move (Thousand of
people)
10-440 10-40
Number of people affected (Thousand of
people)
131-865 50-185
Total damage costs (no ada) - euro
19.3-156 (25.4) bn 15.8-20.1
Total damage costs (w ada) - euro
2.5-2.9 1.9-2.1
Adaptation costs- euro 1.3-2 0.5-0.8 Benefit-cost ratio of
adaptation 14.2 20.9
What is the role of adaptive capacity and what strategy could enhance adaptive capacity? Several studies emphasize that actual impacts are expected to increase especially because of the strong urbanization trend in many coastal parts of the world (McGranahm et al 2007). Socio-economic changes in fact are one of the most important drivers of increasing population and asset exposure (Nicholls et al. 2008). This even more true, for developing and rapidly growing countries and coastal cities. Hinkel et al. (2010) stress the trade-off between the physical stimulus from sea-level rise and the socio-economic stimulus of growing per capita GDP, and hence exposure. Although a higher rate or level of sea-level rise could lead to larger physical impacts in terms of people flooded and land loss, damage costs could be larger for lower projection of sea-level rise but faster growth, such as in SRES scenario B1 as opposed to the A2, where projected sea-level rise is higher. There is therefore a strong link between economic development and climate change impacts. Adaptive capacity refers to the ability to adjust to climate change, to exploit opportunities, and to cope with consequences. Although economic growth will allow for general improvements in protection levels, cultural, historical, and political factors also influence awareness and therefore the policy response. Especially in developing countries, economic growth could have both positive and negative effects as it could increase the capacity to adapt, but also exposure. South, Southeast, and East Asia contain the largest concentration of people threatened by sea-level rise. While absolute impacts are small, they are a large fraction of their economy size (Nicholls 2004, Nicholls and Tol 2006). Although adaptation to SLR can be seen as a no regret strategy, given the increasing exposure driven by socio-economic changes rather than climate change, nevertheless in some regions these investments are not made creating an adaptation deficit. The studies revised in this paper all assume that optimal adaptation will be implemented and the barriers related to the adaptive deficit are not considered. Especially in developing countries the institutional capacity for integrated coastal management is low. In these countries soft-adaptation measures should be promoted first. What is the role of autonomous and planned adaptation? Whereas in the case of some impacts, autonomous adaptation can represent a first effective response, in the case of sea-level rise this is unlikely to happen. Autonomous adaptation

22
refers to the adjustment that occurs as a response to market price adjustments. Although some autonomous adaptation in coastal areas can be observed (e.g. ecosystems adjustments, changes in land and property prices), current trends of increasing infrastructure and population density along the coasts points at the risk of autonomous mala-adaptation. Therefore, significant planned adaptation is needed for dealing with coastal impacts. In addition, the public sector plays a major role, as most of these investments represent a collective activity dealing with a shared resource (Klein et al. 2000) .
4. Limits of existing effort and guidance to empirical studies Hallegatte (2011) provides a useful framework that guides the critical evaluation of current modeling effort of sea-level rise impacts and adaptation in this section. Sea-level rise can affect land availability and prices, capital and infrastructure, natural capital, population density and distribution by inducing migration with effect on social capital as well, and risk. Extreme events such as cyclones or hurricanes are additional hazards that can exacerbate these effects. If these impacts are seen in the context of a simple growth framework, then it is clear that sea-level rise can affect economic growth through various mechanisms. All these impacts have an effect on capital accumulation and thus, on economic growth. Needless to say that impacts could go beyond the direct effect on output, and directly influence welfare and utility (e.g. through losses of ecosystems). From the modeling perspective, it is clear that a bottom-up technical analysis is useful to the extent the broader social and economic consequences are evaluated. In this sense, efforts that combine different modeling approaches in a soft-linked manner are useful. Four are the main issues that offer room for future work and improvement:
1. Integration of bottom-up and top-down studies 2. Integration of impact assessments with CGE models with optimal adaptation (or
policy driven adaptation). Improve the modeling of adaptation choices and investments, which remain stylized and ad hoc in most models.
3. Top-down modeling of extreme events 4. Improvements in the treatment of adaptive capacity.
4. 1. Link between bottom-up and top-down studies Significant progress has been made regarding the link between bottom-up and top-down studies. Several European projects have developed this type of integration. However, the geographical scope has been limited mostly to Europe (PESETA, ClimateCost) or the Mediterranean area (CIRCE). An effort to link the DIVA model with the MIT IGSM-EPPA model is also under development (Sugiyama et a. 2008). Top-down models need inputs from bottom-up studies. This means that the accuracy of the bottom-up studies per se remains important, and that the assumptions made to translate bottom-up inputs to top-down frameworks are not neutral. At the moment the bottom-up inputs to top-down models are available for limited geographical areas. A direction for bottom-up studies is the extension to more countries. The DIVA model has global coverage and therefore it could be applied to all countries.
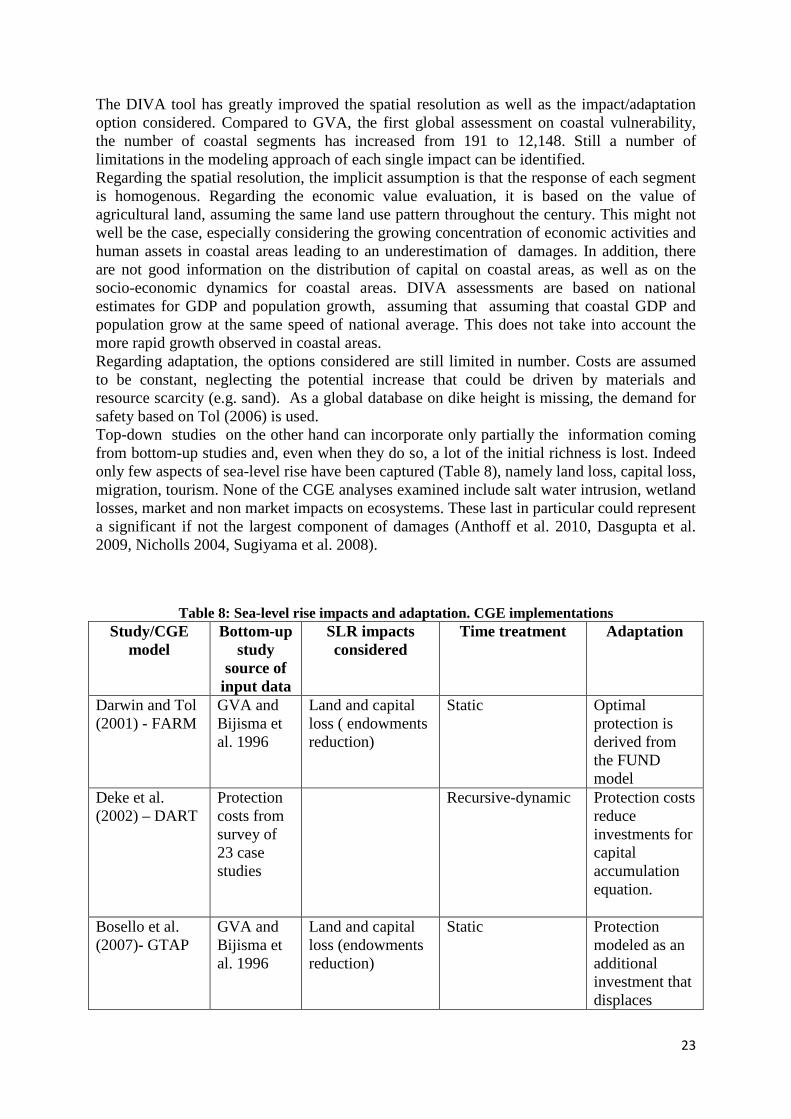
23
The DIVA tool has greatly improved the spatial resolution as well as the impact/adaptation option considered. Compared to GVA, the first global assessment on coastal vulnerability, the number of coastal segments has increased from 191 to 12,148. Still a number of limitations in the modeling approach of each single impact can be identified. Regarding the spatial resolution, the implicit assumption is that the response of each segment is homogenous. Regarding the economic value evaluation, it is based on the value of agricultural land, assuming the same land use pattern throughout the century. This might not well be the case, especially considering the growing concentration of economic activities and human assets in coastal areas leading to an underestimation of damages. In addition, there are not good information on the distribution of capital on coastal areas, as well as on the socio-economic dynamics for coastal areas. DIVA assessments are based on national estimates for GDP and population growth, assuming that assuming that coastal GDP and population grow at the same speed of national average. This does not take into account the more rapid growth observed in coastal areas. Regarding adaptation, the options considered are still limited in number. Costs are assumed to be constant, neglecting the potential increase that could be driven by materials and resource scarcity (e.g. sand). As a global database on dike height is missing, the demand for safety based on Tol (2006) is used. Top-down studies on the other hand can incorporate only partially the information coming from bottom-up studies and, even when they do so, a lot of the initial richness is lost. Indeed only few aspects of sea-level rise have been captured (Table 8), namely land loss, capital loss, migration, tourism. None of the CGE analyses examined include salt water intrusion, wetland losses, market and non market impacts on ecosystems. These last in particular could represent a significant if not the largest component of damages (Anthoff et al. 2010, Dasgupta et al. 2009, Nicholls 2004, Sugiyama et al. 2008).
Table 8: Sea-level rise impacts and adaptation. CGE implementations
Study/CGE model
Bottom-up study
source of input data
SLR impacts considered
Time treatment Adaptation
Darwin and Tol (2001) - FARM
GVA and Bijisma et al. 1996
Land and capital loss ( endowments reduction)
Static Optimal protection is derived from the FUND model
Deke et al. (2002) – DART
Protection costs from survey of 23 case studies
Recursive-dynamic Protection costs reduce investments for capital accumulation equation.
Bosello et al. (2007)- GTAP
GVA and Bijisma et al. 1996
Land and capital loss (endowments reduction)
Static Protection modeled as an additional investment that displaces
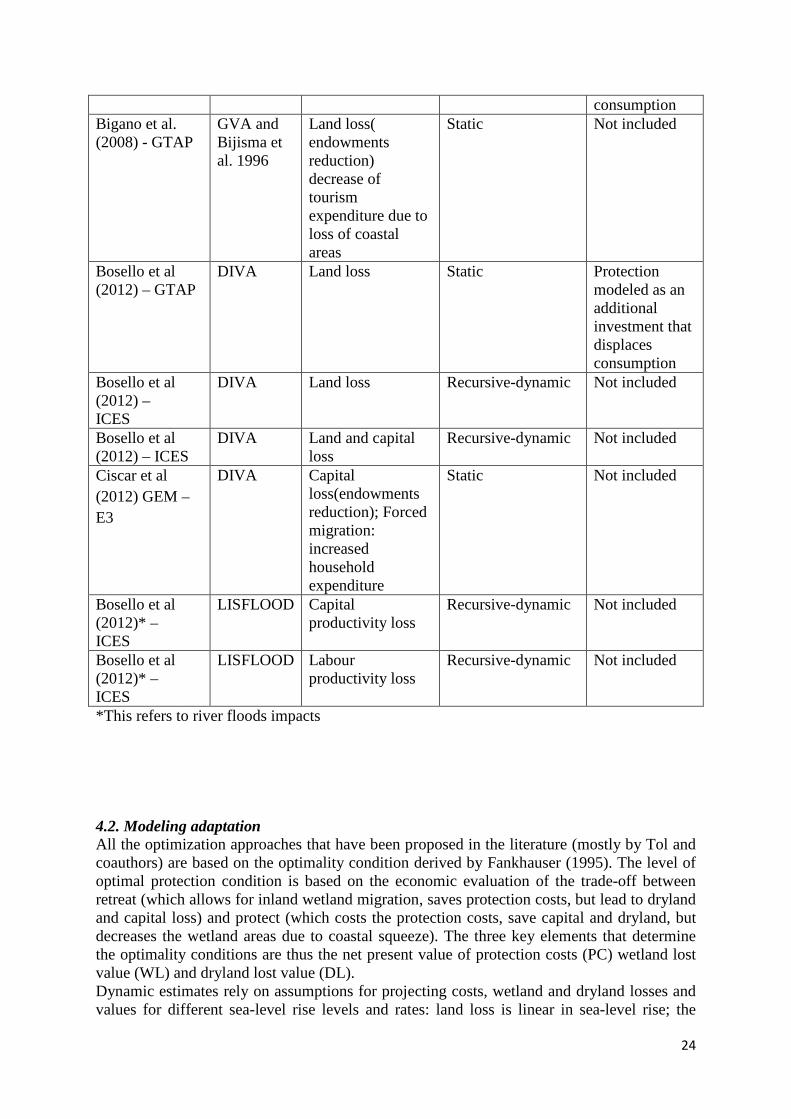
24
consumption Bigano et al. (2008) - GTAP
GVA and Bijisma et al. 1996
Land loss( endowments reduction) decrease of tourism expenditure due to loss of coastal areas
Static Not included
Bosello et al (2012) – GTAP
DIVA Land loss Static Protection modeled as an additional investment that displaces consumption
Bosello et al (2012) – ICES
DIVA Land loss Recursive-dynamic Not included
Bosello et al (2012) – ICES
DIVA Land and capital loss
Recursive-dynamic Not included
Ciscar et al (2012) GEM –E3
DIVA Capital loss(endowments reduction); Forced migration: increased household expenditure
Static Not included
Bosello et al (2012)* – ICES
LISFLOOD Capital productivity loss
Recursive-dynamic Not included
Bosello et al (2012)* – ICES
LISFLOOD Labour productivity loss
Recursive-dynamic Not included
*This refers to river floods impacts 4.2. Modeling adaptation All the optimization approaches that have been proposed in the literature (mostly by Tol and coauthors) are based on the optimality condition derived by Fankhauser (1995). The level of optimal protection condition is based on the economic evaluation of the trade-off between retreat (which allows for inland wetland migration, saves protection costs, but lead to dryland and capital loss) and protect (which costs the protection costs, save capital and dryland, but decreases the wetland areas due to coastal squeeze). The three key elements that determine the optimality conditions are thus the net present value of protection costs (PC) wetland lost value (WL) and dryland lost value (DL). Dynamic estimates rely on assumptions for projecting costs, wetland and dryland losses and values for different sea-level rise levels and rates: land loss is linear in sea-level rise; the

25
value of dryland is linear in income density; wetland values are logistic in per capita income; migration is a function of land lost, average population density and it costs three times the regional per capita income per migrant. Assumptions on land values also dates back to estimates provided in Fankhauser 1995) for the OECD, and are extrapolated to other regions using GDP adjustment factors. Using the Fankhauser (1995)’s first order condition, optimal protection sea-level rise is derived for the set of parameters and costs assumed. Most of the static data are from GVA (Hoozemans et al. 1993 and Bijlsma et al. 1996). Sensitivity of optimal protection is assessed for different assumptions on value of dryland. The calibration and estimation of each of these components would critically affect estimated protection levels. A discussion is provided by Suygimaet al. (2008), who highlight the importance of capital distribution along the coastline. The study highlights which improvements could be made to optimize frameworks currently available:
• Include other forms of protection such as beach nourishment • Improve the representation of wetland loss, following early development by Nicholls
(2004) • Allow for time-varying optimal protection level
4.3. Towards the ideal model The ideal model that could properly account for the dynamic nature of sea-level rise impacts and the forward-looking nature of the adaptation response would be a dynamic forward looking model, similar to Integrated Assessment Models. The FUND model does not fully endogenize the investments decision. Although it allows to evaluate optimal protection, the model does not account for the displacement effect of investments on other variables such as other investments or consumption. A set-up that could offer the proper framework for the modeling of sea-level adaptation as choice variable, with dedicated investments could be the AD-DICE/AD-RICE/AD-WITCH framework (Agrawala et al. 2011). As discussed in section 3, autonomous adaptation to coastal impacts will not be effective and therefore planned adaptation plays a particularly important role. This treatment of adaptation to sea-level rise could be combined with the reduced form module for sea-level rise impacts introduced by Nordhaus (2010). Nordhaus (2010) propose a new version of the RICE model that features a module to project future sea-level rise (SLR) in coming centuries. The module distinguish the contribution to sea-level rice of thermal expansion, glaciers and small ice caps, as well as the Greenland and the Western Antarctic Ice Sheet. The uncertainty and the failure of existing models to represent past dynamics is explicitly recognized and discussed. The calibration of the Greenland effect is based on of Ridley et al. (2005), which finds a SLR contribution of 5.5 mm/year over the first 300 years for a 4xCO2 simulation. Modeling the dynamics of the Western Antarctic Ice Sheet is even more conjectural. The author assume that the melting point for the WAIS is a global temperature increase of 3 °C from preindustrial levels and that the discharge increases linearly between 3 and 6°C. The time horizon is much longer than any previous study, recognizing that sea-level responses are slow and that effects associated with ice sheet dynamics are more likely to occur in the 22nd century. The results indicate that over the long-run thermal expansion contribution ranges between one-third and one-fourth of the SLR (beyond 2300). Nordhaus’s framework could integrate the module developed by Narita et al. (2010) to represent extratropical cyclone damages into the FUND model or the damage function of tropical cyclones estimated in Mendelshon et al. (2009). The coupling of the effect of storms and sea-level rise requires a link between storm intensity and sea-level rise (Walsh and Ryan 2000). A formulation that links surface temperature, sea-level rise, and storm intensification

26
is presented in Mousavi et al. (2011). The model formulation is simple and it could be implemented in integrated assessment models that have a climate module, such as DICE/RICE (see section 2.3 and 3) and AD-WITCH (Bosello et al. 2010). What is still not clear is the role of adaptation in preventing extreme event damages (for a discussion see Mendelsohn et al. 2009).
4.1 Guidance to empirical studies The paper does not consider the current state of the empirical literature and does not aim providing estimates of adaptation costs. However, some areas where empirical work is warranted are listed below.
• Development of an improvement database on the spatial distribution of population, income, and capital in coastal areas.
• Assessment/ estimate of growth dynamics in coastal areas for GDP, population, land, and property values with and without climate change or sea-level rise.
• Revised estimation of the demand for safety. Currently the DIVA model uses a formulation that links safety demand to per capita income, population density, and the cost of dike building. The assumption on how protection standards could evolve over time is very important and the analysis shows that this assumption affects significantly coastal flooding impacts. Other variables in addition to income per capita could affect protection standards. For example, Northern Europe has much higher protection standards than New York, though income per capita is lower. In most models examined in the paper the vice-versa would occur. In contrast, the empirical evidence also questions the assumption often made that the demand for safety increases with income per capita. Examples of successful adaptation exist in emerging economies, while examples of failure exist rich countries such as in New Orleans.
• Develop a methodology to estimate the adaptation deficit. Nicholls et al. (2010) discuss an approach based on the cost of upgrading existing infrastructure. The costs of soft-measures such as the development of institutional and technical capacity should also be considered.
• In DIVA technological change is assumed to play no role as technologies for hard adaptation are considered mature. However, innovation and application of information technologies could help soft adaptation or risk management (storm forecast and warnings).
• Estimation of extreme events damage functions especially in developing countries. There are international database on hurricane damages but they do not report the magnitude of storms. Estimating the effect of adaptation is also difficult because of data availability
27
5. References Agrawala, S., Bosello F., C. Carraro , E. De Cian, E. Lanzi, K. De Bruin and R. Dellink (2011). “PLAN or REACT? Analisys of adaptation costs and benefits Using Integrated Assessment Models, Climate Change Economics, Vol.2 (3), 1-36. Ali A, (1996) Vulnerability of Bangladesh to climate change and sea level rise through tropical cyclones and storm surges. J Water Air Soil Pollut 92:171–179 Ali A, (1999) Impacts and adaptation assessment in Bangladesh. Clim Res 12:109–116 Anthoff D, Nicholls RJ, Tol RJS, and Vafeidis AT (2006) Global and regional exposure to large rises in sea-level: a sensitivity analysis. Tyndall Working Paper 96 Tyndall Centre for Climate Change Research. Anthoff D, Nicholls RJ, Tol RJS (2010) The economic impact of substantial sea-level rise. Mitigation and Adaptation Strategies for Global Change 15(4), 321–35. Bijlsma L, CN Ehler, RJT Klein, SM Kulshrestha, RF McLean, N Mimura, RJ Nicholls, LA Nurse, H Perez Nieto, EZ Stakhiv, RK Turner and RA Warrick (1996) Coastal zones and small islands. In: Climate Change 1995: Impacts, Adaptations, and Mitigation of Climate Change: Scientific-Technical Analyses – Contribution of Working Group II to the Second Assessment Report of the Intergovernmental Panel on Climate Change, R. T. Watson, M. C. Zinyowera, and R. H. Moss (eds.), Cambridge University Press: Cambridge, pp. 289-324. Bigano A, Bosello F, Roson R, RSJ Tol (2008) “Economy-wide impacts of climate change: a joint analysis for sea level rise and tourism", Mitigation and Adaptation Strategies for Global Change, Vol. 13, n. 8. Bosello F, Roson R, Tol RSJ (2007) Economy wide estimates of the implications of climate change: sea-level rise. Env Res Ec 37:549–571 Bosello F, Eboli F, Parrado R, (2010), “Climate Change Impacts in the Mediterranean: Preliminary Results by means of a CGE Analysis”, Deliverable 10.7.2, Circe project. Bosello F, Roson R, Tol RSJ (2012), “Economy-wide Estimates of the Implications of Climate Change: Sea-Level Rise”, Environmental & Resource Economics 37:549–571 CIRCE?? Bosello CIRCE da inserier Bosello F, Nicholls RJ, Richards J, Roson R, Tol RSJ (2012), “Economic impacts of climate change in Europe: sea-level rise”, Climatic Change 112: 63–81 Bosello F, Eboli F, Pierfederici R, (2012) Assessing the Economic Impacts of Climate Change. An Updated CGE Point of View, FEEM Note di Lavoro 2012.002 Brown, J.M., A.J. Souza, and J. Wolf, 2010: Surge modelling in the eastern Irish Sea: present and future storm impact. Ocean Dynamics, 60(2), 227-236.

28
Brown S, Nicholls RJ, Vafeidis A, Hinkel J, Watkiss P, (2011) Sea-Level Rise. The Impacts and Economic Costs of Sea-Level Rise on Coastal Zones in the EU and the Costs and Benefits of Adaptation, Technical Policy Briefing Note 02 http://www.climatecost.cc/images/Policy_brief_2_Coastal_10_lowres.pdf Ciscar JC, Szabó L, van Regemorter D, A Soria (2012), “The integration of PESETA sectoral economic impacts into the GEM-E3 Europe model: methodology and results”, Climatic Change 112, Number 1 Danard M, Munro A, Murty T (2003) Storm surge hazard in Canada. Nat Hazards 28:407–431 Darwin, R. F. and R. S. J. Tol, 2001. Estimates of the Economic Effects of Sea-Level Rise. Environmental and Resource Economics, 19: 113-129. Dasgupta, S., Laplante, B., Murry, S., and Wheeler, D. 2009. Sea-Level Rise and Storm Surges: A Comparative Analysis of Impacts in Developing Countries. Policy Research Working Paper 4901. World Bank, Washington, DC. Demernard J, Sætra Ø, Røed LP (2002) Future wind, wave and storm surge climate in the northern North Atlantic. Clim Res 23:39–49 Deke, O., K. G. Hooss, C. Kasten, G. Klepper and K. Springer, 2001. Economic Impact of Climate Change: Simulations with a Regionalized Climate-Economy Model. Kiel Working Paper No. 1065, Kiel Institute of World Economics, Kiel. DINAS-Coast Consortium (2006) DIVA: Version 1.0. CD-ROM. Potsdam Institute for Climate Impact Research, Potsdam Emanuel, K., 2005. Increasing destructiveness of tropical cyclones over the past 30 years. Nature: 436, 686-688. Fankhauser, S., 1995. Protection versus Retreat: The Economic Costs of Sea-Level Rise. Environment and Planning A, 27: 299-319. Gonnert G (2004) Maximum storm surge curve due to global warming for the European North Sea region during the 20th–21st century. Nat Hazard 32:211–218 Grinsted, A, et al. 2010. Reconstructing sea level from paleo and Nordic Council of Ministers, Copenhagen 2010, Physical Climate Science since IPCC AR4. A brief update on new findings between 2007 and April 2010 Grinsted, A., Moore, J. C. & Jevrejeva, S. 2009 Reconstructing sea level from paleo and projected temperatures 200 to 2100 AD. Clim. Dyn. 34, 461–472. (doi:10.1007/s00382- 008-0507-2) Hallegatte, S. (2011). SR17: The economic growth impact of sea-level rise. Sustainable Development Network, the World Bank Ecole Nationale de la Météorologie, Météo-France
29
Lowe JA, Gregory JM, Flather RA (2001) Changes in the occurrence of storm surges around the United Kingdom under a future climate scenario using a dynamic storm surge model driven by the Hadley Centre climate models. Clim Dyn 18:179–188 Handmer, J., Y. Honda, Z.W. Kundzewicz, N. Arnell, G. Benito, J. Hatfield, I.F. Mohamed, P. Peduzzi, S. Wu, B. Sherstyukov, K. Takahashi, and Z. Yan, 2012: Changes in impacts of climate extremes: human systems and ecosystems. In: Managing the Risks of Extreme Events and Disasters to Advance Climate Change Adaptation [Field, C.B., V. Barros, T.F. Stocker, D. Qin, D.J. Dokken, K.L. Ebi, M.D. Mastrandrea, K.J. Mach, G.-K. Plattner, S.K. Allen, M. Tignor, and P.M. Midgley (eds.)]. A Special Report of Working Groups I and II of the Intergovernmental Panel on Climate Change (IPCC). Cambridge University Press, Cambridge, UK, and New York, NY, USA, pp. 231-290. Hinkel J (2005) DIVA: an iterative method for building modular integrated models. Advances in Geosciences 4:45–50 Hinkel, J. and R. J. T. Klein, 2007. Integrating knowledge for assessing coastal vulnerability to climate change. In: Managing Coastal Vulnerability: An Integrated Approach, L. McFadden, R. J. Nicholls, and E. C. Penning-Rowsell (eds.), Elsevier Science: Oxford, pp. 61-78. Hinkel, J., RJ Nicholls, AT Vafeidis, RSJ Tol, T Avagianou (2010). Assessing risk of and adaptation to sea-level rise in the European Union: an application of DIVA. Mitig Adapt Strateg Glob Change (2010) 15:703–719. DOI 10.1007/s11027-010-9237-y Hoozemans, F.M.J., Marchand, M., and Pennekamp, H.A. 1993. A Global Vulnerability Analysis: Vulnerability Assessment for Population, Coastal Wetlands and Rise Production on a Global Scale, 2nd ed., Delft Hydraulics, Netherland IPCC. 1990. Sea-level Rise: A World-wide Cost Estimate of Basic Coastal Defence Measures. Report prepared for Intergovernmental Panel for Climate Change and Rijkswaterstaat. Delft Hydraulics, Delft, Netherlands IPCC CZM (1991) Common methodology for assessing vulnerability to sea-level rise. Ministry of Transport, Public Works and Water Management, The Hague IPCC CZMS (1992) Global climate change and the rising challenge of the sea. Report of the coastal zone management subgroup. IPCC Response Strategies Working Group, Ministry of Transport, Public Works and Water Management, The Hague Kopp, R.E., et al. 2009. Probabilistic assessment of sea level during the last interglacialstage. Nature, 462, 863–867. Doi:10.1038/nature08686 McGranahan, G., D. Balk and B. Anderson. 2007. The rising tide: assessing the risks of climate change and human settlements in low elevation coastal zones. Environment & Urbanization 19(1): 17-37. International Institute for Environment and Development (IIED). http://eau.sagepub.com/cgi/content/abstract/19/1/17
30
McInnes, K.L., I. Macadam, and J.G. O’Grady, (2009). The Effect of Climate Change on Extreme Sea Levels along Victoria’s Coast. A Project Undertaken for the Department of Sustainability and Environment, Victoria as part of the ‘Future Coasts’ Program. CSIRO, Victoria, Australia, 55 pp. Meehl, G.A., T.F. Stocker, W.D. Collins, P. Friedlingstein, A.T. Gaye, J.M. Gregory, A. Kitoh, R. Knutti, J.M. Murphy, A. Noda, S.C.B. Raper, I.G. Watterson, A.J. Weaver and Z.-C. Zhao, 2007. Global Climate Projections. In: Climate Change 2007: The Physical Science Basis. Contribution of Working Group I to the Fourth Assessment Report of the Intergovernmental Panel on Climate Change, Solomon, S., D. Qin, M. Manning, Z. Chen, M. Marquis KB, Averyt, M. Tignor and H.L. Miller (eds.), Cambridge University Press: Cambridge, United Kingdom and New York, NY, USA, pp. 747-845. Narita D, Tol RSJ, Anthoff D. 2009. Economic costs of extratropical storms under climate change: an application of FUND. Working Papers, WP274, Economic and Social Research Institute, Dublin. Nicholls RJ, 1995. Synthesis of vulnerability analysis studies. Proceedings of WORLD COAST 1993, Ministry of Transport, Public Works and Water Management, the Netherlands. pp. 181-216. Nicholls RJ, Hoozemans, F.M.J., Marchand, M., 1999. Increasing flood risk and wetland losses due to global sea-level rise: regional and global analyses. Global Environmental Change 9, S69–S87. Nicholls RJ, (2002) Analysis of global impacts of sea level rise: a case study of flooding. Physics and Chemistry of the Earth 27, 1455–66. Nicholls RJ (2004) Coastal flooding and wetland loss in the 21st century: changes under the SRES climate and socio-economic scenarios. Glob Environ Change 14(1):69–86 Nicholls RJ, JA Lowe (2004). Benefits of mitigation of climate change for coastal areas. Global Environmental Change 14 (2004) 229–244 Nicholls RJ, and Tol, R.S.J. (2006) Impacts and responses to sea-level rise: a global analysis of the SRES scenarios over the twenty-first century, Philosophical Transactions of the Royal Society A 364, 1073–95. Nicholls RJ, (2007) Adaptation Options for Coastal Areas and Infrastructure: An Analysis for 2030. Report to the UNFCCC, Bonn. Nicholls RJ, Hanson, S., Herweijer, C., Patmore, N., Hallegatte, S., Corfee-Morlot, J., Chateau, J., and Muir-Wood, R. (2008) Ranking Port Cities with High Exposure and Vulnerability to Climate Extremes: Exposure Estimates. OECD Environment Working Papers No. 1. OECD Publishing, Paris.
Nicholls RJ, RSL Tol, AT Vafeidis, (2008a). Global estimates of the impact of a collapse of the West Antarctic ice sheet: an application of FUND. Climatic Change, 2008, Volume 91, Numbers 1-2, Pages 171-191

31
Nicholls RJ, Brown S, Hanson S (2010) Economics of Coastal Zone Adaptation. Discussion Paper No. 10, The World Bank. Nicholls RJ, Marinova N, Lowe JA, et al. (2011). Sea-level rise and its possible impacts given a 'beyond 4 degrees C world' in the twenty-first century . PHILOSOPHICAL TRANSACTIONS OF THE ROYAL SOCIETY A-MATHEMATICAL PHYSICAL AND ENGINEERING SCIENCES Volume: 369 Issue: 1934 Pages: 161-181 DOI: 10.1098/rsta.2010.0291 Nordhaus WD, 2010. Projections of Sea Level Rise http://nordhaus.econ.yale.edu/documents/SLR_021910.pdf Overpeck JT, Otto-Bliesner BL, Miller GH, Mush DR, Alley RB, Kiehl, JT (2006) Palaeoclimatic evidence for future ice-sheet instability and rapid sea-level rise. Science, 311, 1747-1750 Peltier WR, (2000) ICE4G (VM2) Glacial isostatic Adjustment Corrections, in Sea Level Rise: History and Consequences, Douglas, B.C., Kearney, M.S., and S.P. Leatherman (Eds.) Academic Press, San Diego Pfeffer W, Harper J, O’Neel, S. 2008 Kinematic constraints on glacier contributions to 21st-century sea-level rise. Science 321, 1340–1343. (doi:10.1126/science.1159099) Rabus B, Eineder M, Roth A, Bamler R (2003) The shuttle radar topography missiona new class of digital elevation models acquired by spaceborne radar. ISPRS J Photogramm Remote Sens 57(4):241–262 Rahmstorf S, (2007) A semi-empirical approach to projecting future sea-level rise. Science, 315, 368-70. Rahmstorf S, (2010). A new view on sea level rise. Nature Reports Climate Change. Published online: 6 April 2010. Doi:10.1038/climate.2010.29 Rahmstorf, S., Cazenave, A., Church, J., Hansen, J., Keeling, R., Parker, D. & Somerville, R. 2007 Recent climate observations compared to projections. Science 316, 709. (doi:10.1126/ science.1136843) Richard AJ, RJ Nicholls (2009) Impacts of climate change in coastal systems in Europe. PESETA-Coastal Systems study, JRC Scientific and Technical Report EUR 24130 EN Seneviratne, S.I., N. Nicholls, D. Easterling, C.M. Goodess, S. Kanae, J. Kossin, Y. Luo, J. Marengo, K. McInnes, M. Rahimi, M. Reichstein, A. Sorteberg, C. Vera, and X. Zhang, 2012: Changes in climate extremes and their impacts on the natural physical environment. In: Managing the Risks of Extreme Events and Disasters to Advance Climate Change Adaptation [Field, C.B., V. Barros, T.F. Stocker, D. Qin, D.J. Dokken, K.L. Ebi, M.D. Mastrandrea, K.J. Mach, G.-K. Plattner, S.K. Allen, M. Tignor, and P.M. Midgley (eds.)]. A Special Report of Working Groups I and II of the Intergovernmental Panel on Climate Change (IPCC). Cambridge University Press, Cambridge, UK, and New York, NY, USA, pp. 109-230.

32
Small C, Nicholls RJ, (2003) A global analysis of human settlement in coastal zones, Journal of Coastal Research, 19(3), pp. 584–599. Sugiyama M, RJ Nicholls, A Vafeidis (2008) Estimating the Economic Cost of Sea-Level Rise, MIT Global Change Joint Program, Report 156, Apr 2008. Tol RSJ (2002a) Estimates of the damage costs of climate change—part 1: benchmark estimates. Environ Resour Econ 21:47–73 Tol RSJ (2002b) Estimates of the damage costs of climate change—part II: dynamic estimates. Environ Resour Econ 21:135–160 Tol RSJ (2007) The double trade-off between adaptation and mitigation for sea level rise: an application of FUND. Mit Ad Str for Gl Ch 5(12):741–753 Turner RK, Adger N, Doktor P, (1995) Assessing the Economic Costs of Sea Level Rise. Environment and Planning A, 27, 1777-1796. Vafeidis, A., Nicholls, R.J. and McFadden, L. (2003) Developing a database for global vulnerability analysis of coastal zones: the DINAS-COAST project and the DIVA tool. In, Proceedings of the 23rd EARSeL Symposium on Remote Sensing in Transition. 23rd EARSeL Symposium , Millpress Science Publishers. Vafeidis AT, Nicholls RJ, McFadden L, Tol RSJ, Spencer T, Grashoff PS, Boot G, Klein RJT (2008) A new global coastal database for impact and vulnerability analysis to sea-level rise. J Coast Res 24(4):917–924 Vermeer, M. & Rahmstorf, S. 2009 Global sea level linked to global temperature. Proc. Natl Acad. Sci. USA 106, 21 527–21 532. (doi:10.1073/pnas.0907765106) Webster PJ, GJ Holland, JA Curry, and HR Chang. 2005. Changes in tropical cyclone number, duration and intensity in a warming environment. Science 309: 1844-46.