Modeling Dynein: The Gear-Shifting Motor Manoranjan Singh, Roop Mallik, Steve Gross, and Clare Yu...
57
Modeling Dynein: The Gear- Shifting Motor Manoranjan Singh, Roop Mallik, Steve Gross, and Clare Yu University of California, Irvine step
-
Upload
dallas-brad -
Category
Documents
-
view
214 -
download
0
Transcript of Modeling Dynein: The Gear-Shifting Motor Manoranjan Singh, Roop Mallik, Steve Gross, and Clare Yu...
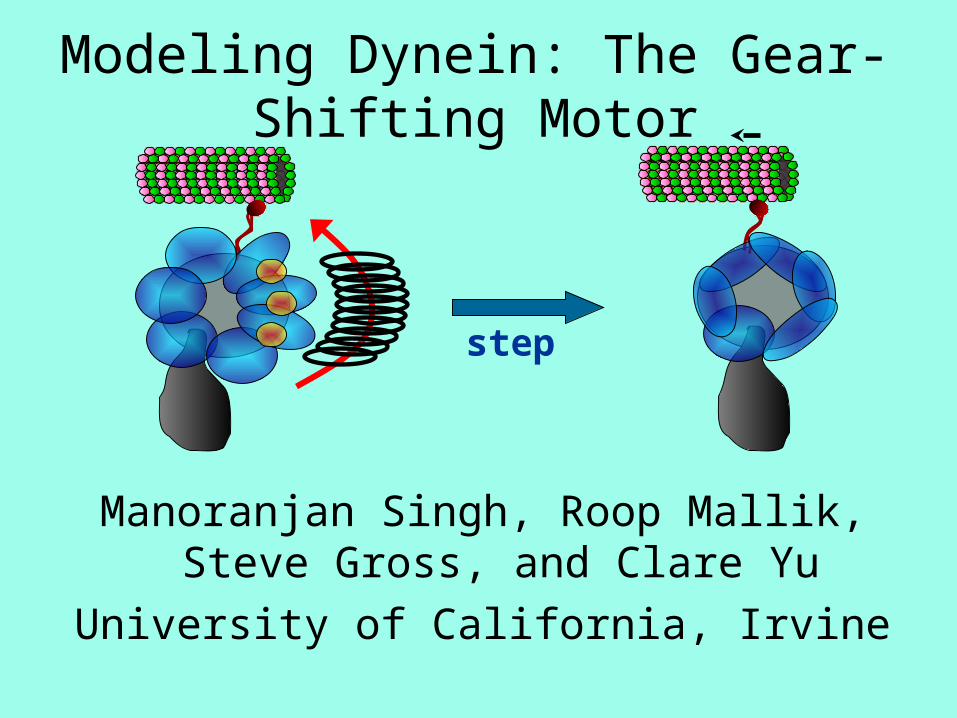
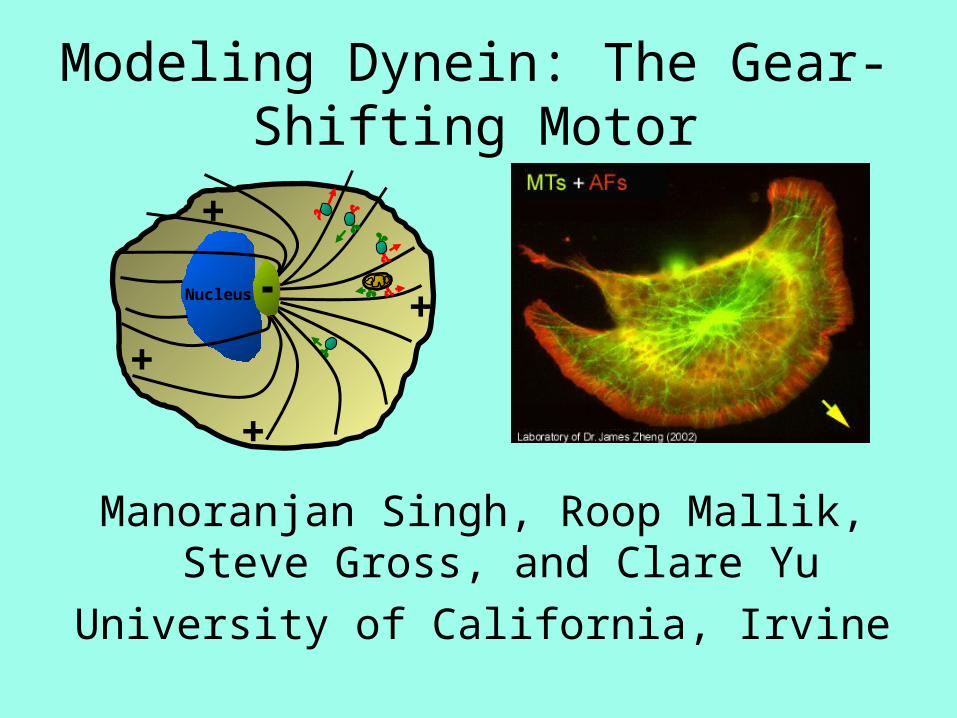
Modeling Dynein: The Gear-Shifting Motor
Manoranjan Singh, Roop Mallik, Steve Gross, and Clare Yu
University of California, Irvine
step

A Cell Is Like a City• Workers• Power Plant• Roads• Trucks• Factories• Library• Recycling center• Police• Post office• Communications
• Proteins• Mitochondria• Actin fibers, microtubules• Kinesin, dynein, myosin• Ribosomes• Genome• Lysosome• Chaperones• Golgi apparatus• Signaling networks

Intracellular Traffic
© Scientific American
+
+
+
+Nucleus
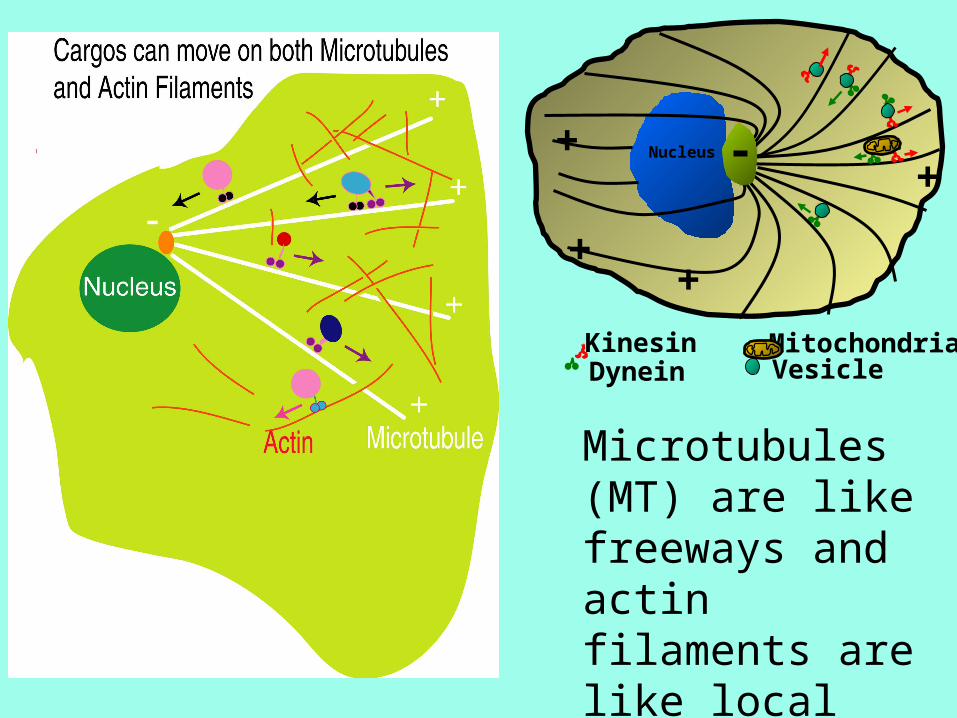
Microtubules (MT) are like freeways and actin filaments are like local surface streets.
DyneinKinesin
VesicleMitochondria
+
++
Nucleus
+
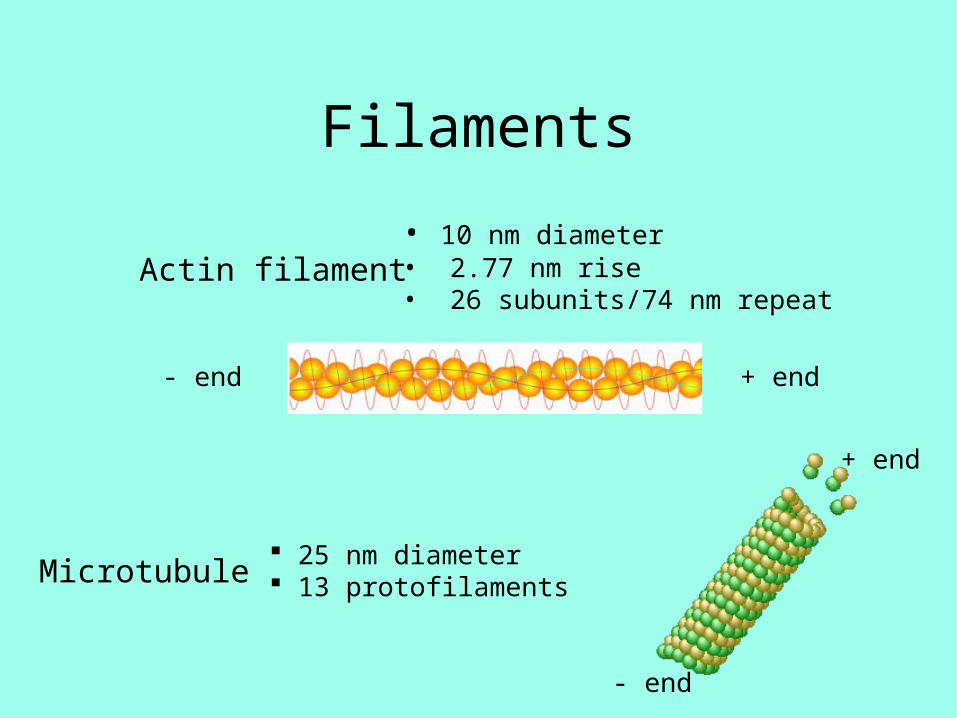
Filaments
Actin filament• 10 nm diameter• 2.77 nm rise• 26 subunits/74 nm repeat
Microtubule 25 nm diameter 13 protofilaments
+ end- end
+ end
- end
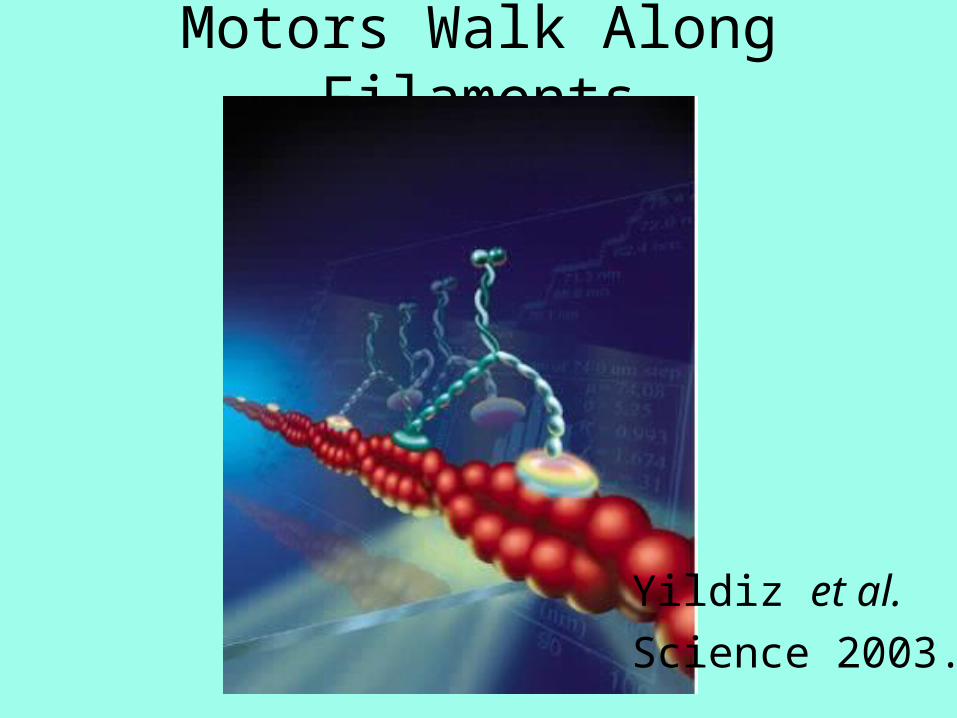
Motors Walk Along Filaments
Yildiz et al.
Science 2003.
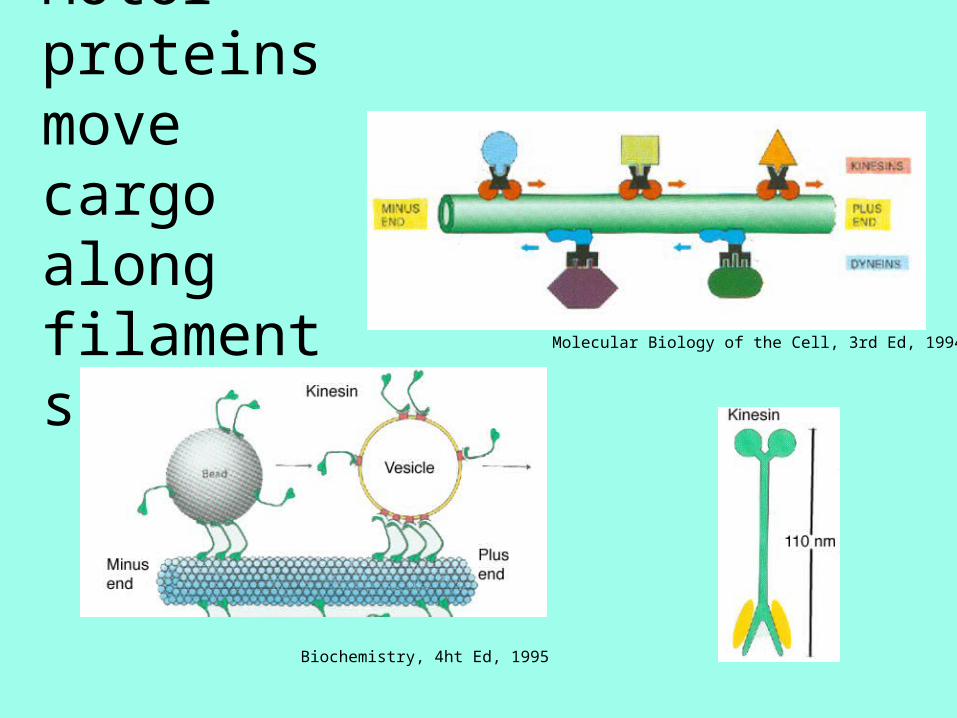
Biochemistry, 4ht Ed, 1995
Motor proteins move cargo along filaments Molecular Biology of the Cell, 3rd Ed, 1994

Herpes Virus Transport in Neurons Along Microtubules
• Virus Movie: VirusMov.mov
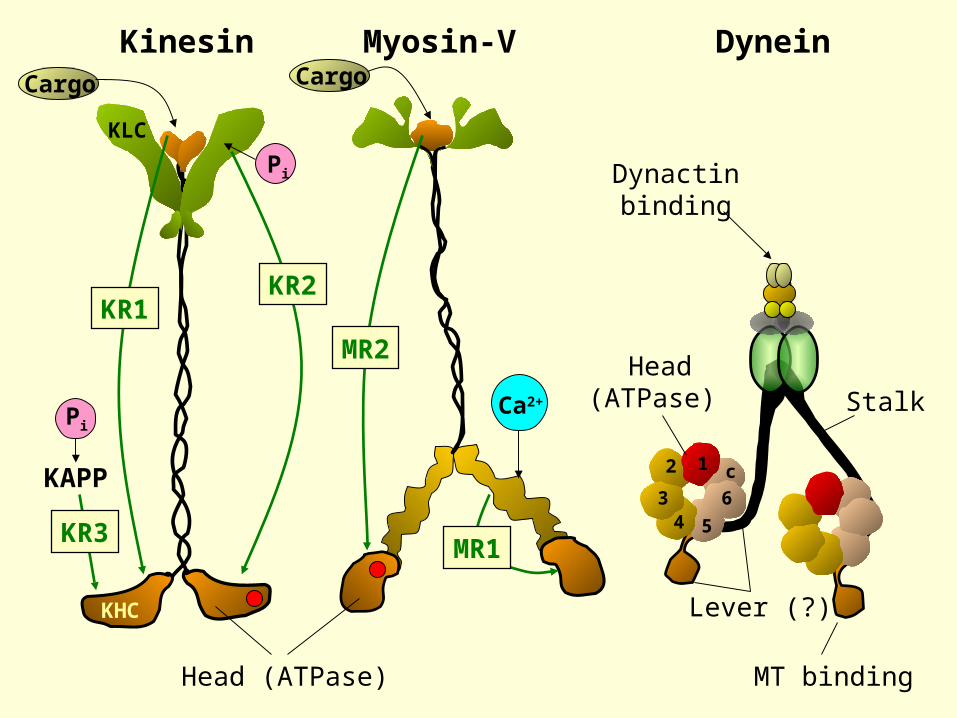
Kinesin Myosin-V Dynein
Head (ATPase)
1
43
5
c
6
2
Head(ATPase)
Lever (?)
StalkPi
Pi
KAPP
KHC
KLC
KR2
KR3
Cargo
Ca2+
MR2
MR1
Cargo
KR1
Dynactinbinding
MT binding

The anatomy of a dynein molecule
N.Hirokawa, Science, 279, 519 (1998)Figure edited to show stalk
Burgess et. al. Nature 421, 715 (2003)
4
1
5 3
2
7
6
ATP ADP+Pi
Microtubule
Stalk
Stem
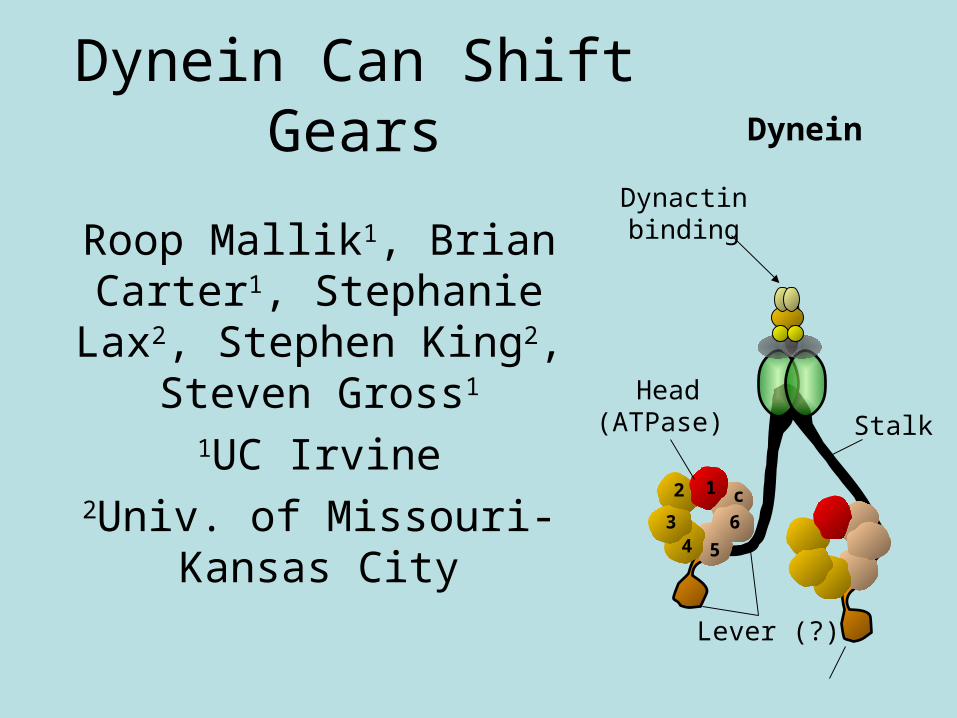
Dynein Can Shift Gears
Roop Mallik1, Brian Carter1, Stephanie Lax2, Stephen
King2, Steven Gross1
1UC Irvine2Univ. of Missouri-Kansas City
Dynein
1
43
5
c
6
2
Head(ATPase)
Lever (?)
Stalk
Dynactinbinding
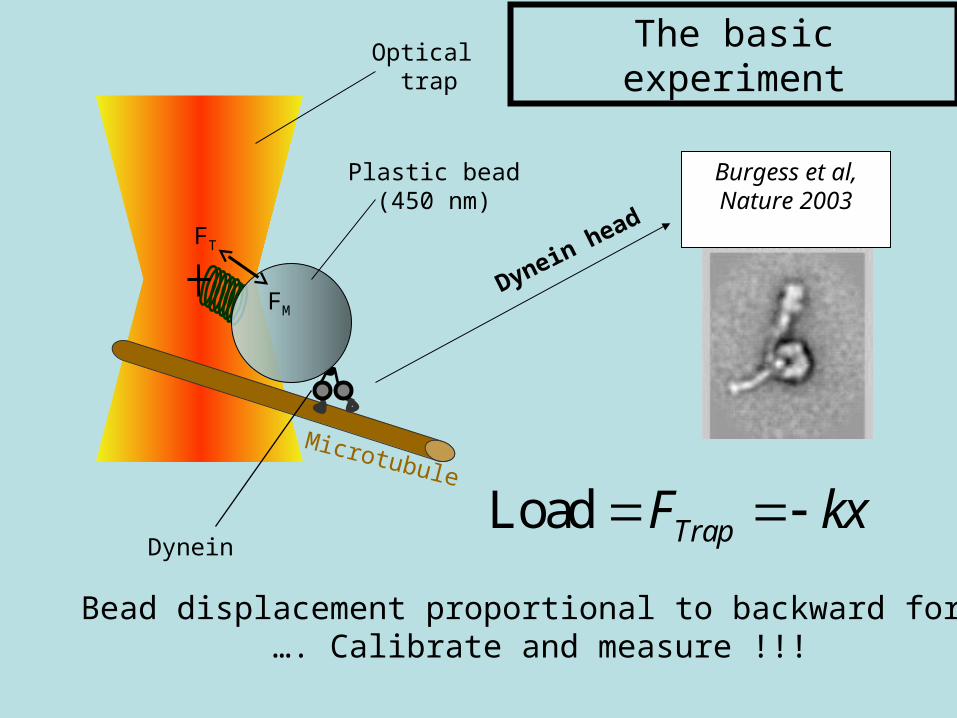
Microtubule
Plastic bead(450 nm)
Optical trap
FT
FM
Dynein head
Burgess et al,Nature 2003
Dynein
Bead displacement proportional to backward force…. Calibrate and measure !!!
The basic experiment
Load TrapF kx

Typical trace of motion
Optical trap stiffness = spring constant = k = 0.011 pN/nm
F = - kx
Mallik et al., Nature 427, 649 (2004).
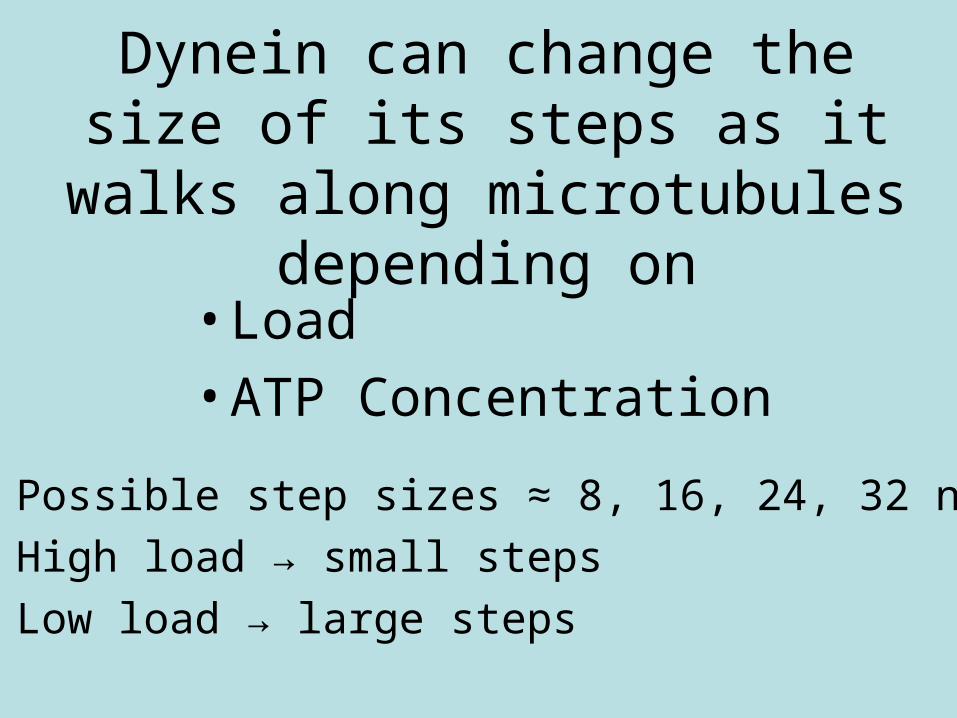
Dynein can change the size of its steps as it walks along
microtubules depending on
• Load
• ATP Concentration
• Possible step sizes ≈ 8, 16, 24, 32 nm
• High load → small steps
• Low load → large steps
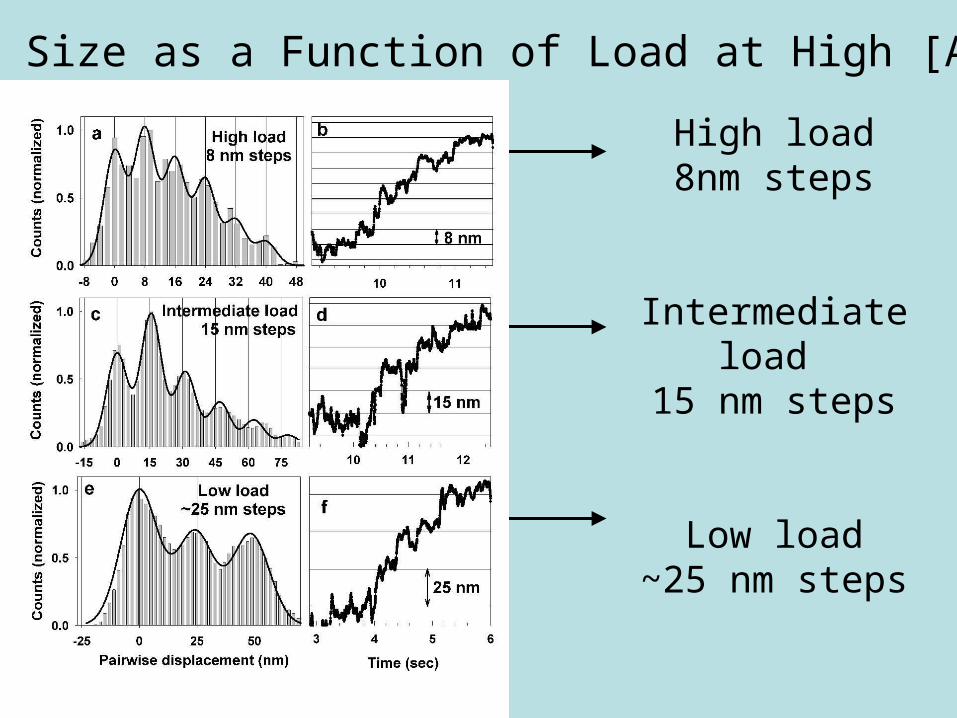
High load8nm steps
Intermediate load 15 nm steps
Low load~25 nm steps
Step Size as a Function of Load at High [ATP]
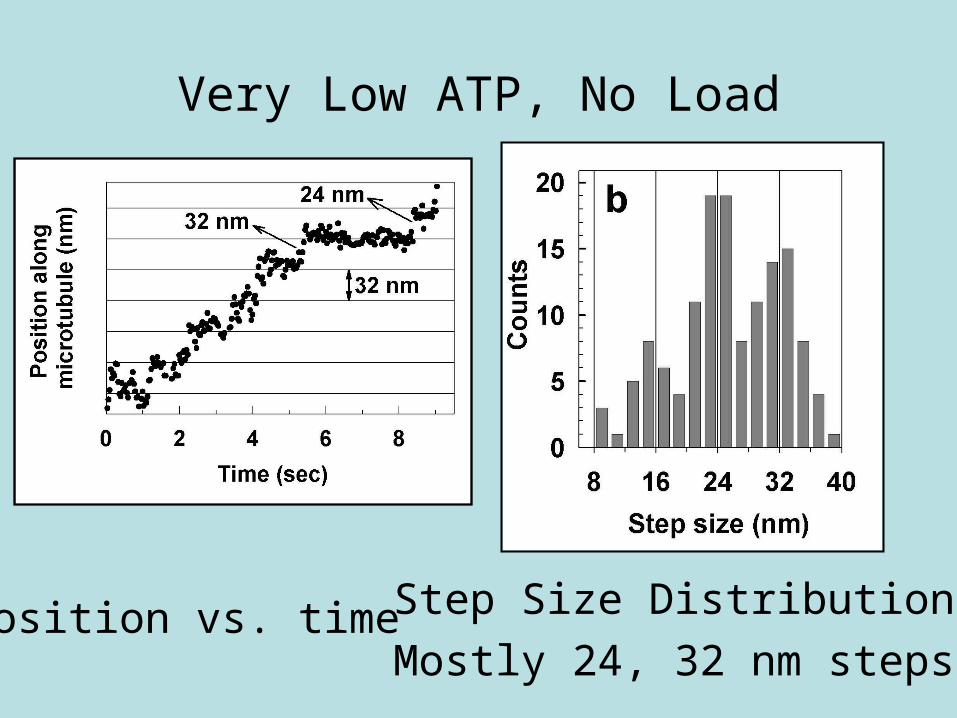
Very Low ATP, No Load
Position vs. time Step Size Distribution
Mostly 24, 32 nm steps

Stalling Force
• Motor attached to bead
• Motor walks along microtubules
• Laser tweezers pull on bead
• As bead moves a distance x from center of trap, it feels a spring force = F = -kx
• If force = stalling force, motor cannot pull bead.
Microtubule
Optical trap
FT
FM
Dynein
bead
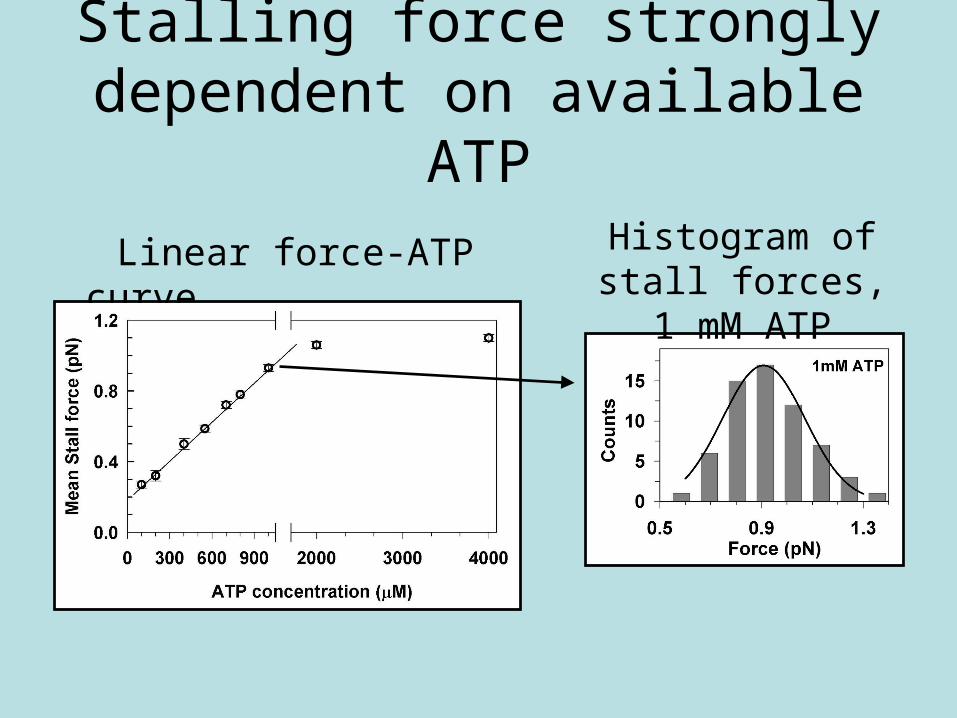
Stalling force strongly dependent on available ATP
Linear force-ATP curve Histogram of stall forces, 1 mM ATP
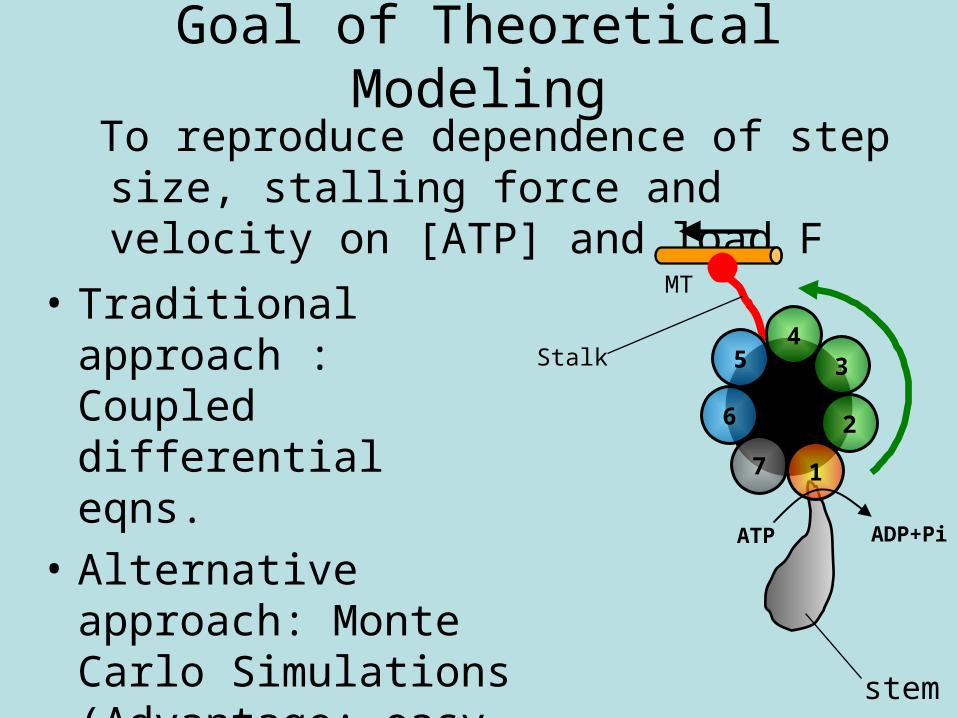
Goal of Theoretical Modeling
To reproduce dependence of step size, stalling force and velocity on [ATP] and load F
4
1
5 3
2
7
6
ATP ADP+Pi
MT
Stalk
• Traditional approach : Coupled differential eqns.
• Alternative approach: Monte Carlo Simulations (Advantage: easy to deal with complicated nonlinear dependencies) stem

Desired Features of ATP Binding
• ATP can bind to (or unbind from) sites 1-4• Step size decreases as number of bound sites
increases
4
1
5 3
27
6
ATP ADP+Pi
MT
Stalk
• Problem: High [ATP], no load → small step size (nonsense)• Solution: Different ATP binding affinities on different sites • Dictates sequential binding: site #1, then #3, then #4, then #2• Binding probability on sites 2-4 increases with load F (need
fuel to haul cargo)
1 3 4 2on on on onk k k k
# ATP bound
1 2 3 4
Step size
32
nm
24
nm
16
nm
8
nm
• Binding probability increases with [ATP]
stem
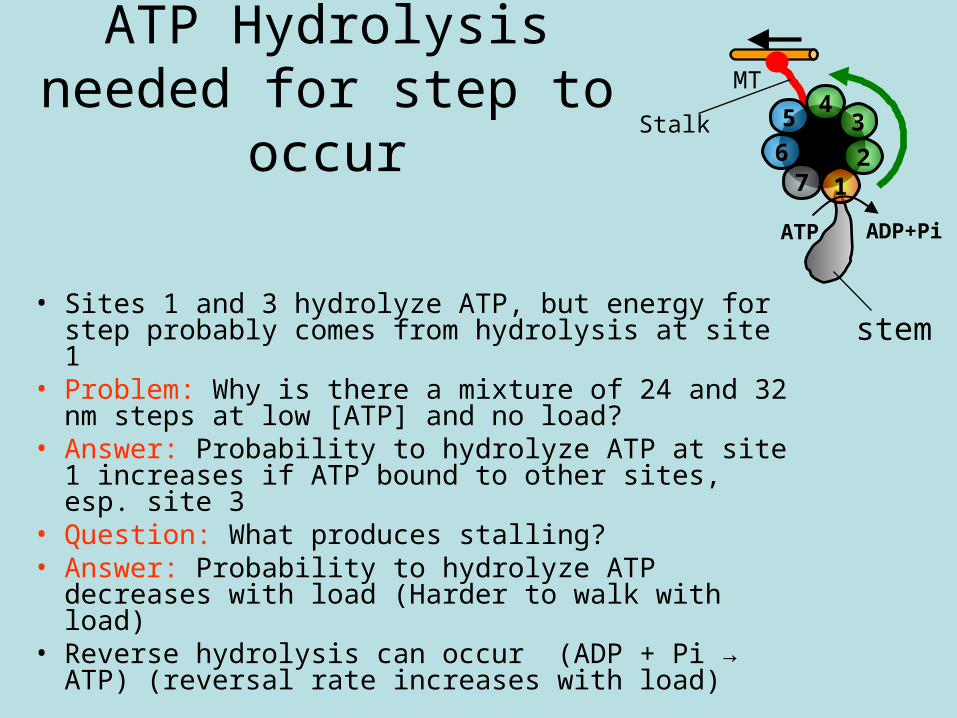
ATP Hydrolysis needed for step to occur
• Sites 1 and 3 hydrolyze ATP, but energy for step probably comes from hydrolysis at site 1
• Problem: Why is there a mixture of 24 and 32 nm steps at low [ATP] and no load?
• Answer: Probability to hydrolyze ATP at site 1 increases if ATP bound to other sites, esp. site 3
• Question: What produces stalling?• Answer: Probability to hydrolyze ATP decreases
with load (Harder to walk with load)• Reverse hydrolysis can occur (ADP + Pi → ATP)
(reversal rate increases with load)
4
1
5 3
27
6
ATP ADP+Pi
MT
Stalk
stem

Monte Carlo Simulation
1. Bind (or unbind) ATP: Probability for n → n ± 1, Pbind(site i) = ki
on [ATP] Δt k2-4
on= k2-4on(F=0)exp{Fa/kT}
2. Hydrolyze ATP at site 1: Phydrolyze = po exp{-αFd/kT} Δt
where po → po/100 if n = 13. Reverse hydrolysis: Preverse = pr exp{(1- α )Fd/kT)}
or take a step4. Repeat
n = number of sites bound = {0, 1, 2, 3, 4}
d = step size = (5 – n) · 8 nm (conjecture)


Theoretical Position vs. Time
high [ATP]
low [ATP]
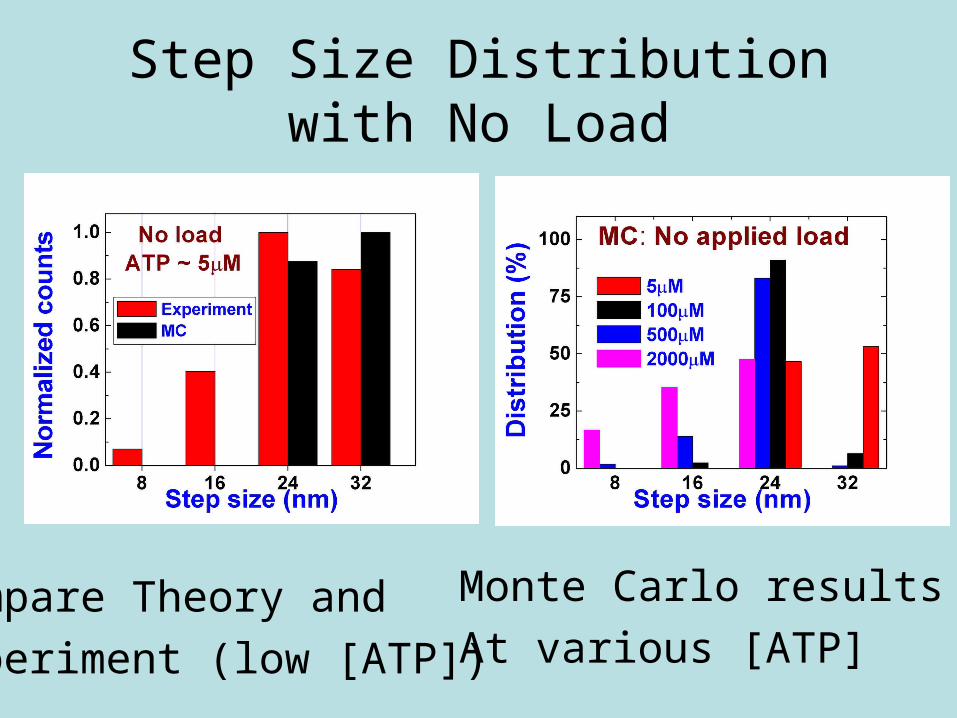
Step Size Distribution with No Load
Monte Carlo results
At various [ATP]Compare Theory and
Experiment (low [ATP])

High [ATP] = 1 mM Low [ATP] = 100 μM
Simulation Results of Step Size•Step size decreases as load increases
•Agrees with experiment

Theoretical Predictions
Velocity vs. [ATP]
concentration at
various loads
Velocity vs. Load
at various [ATP]
concentrations

Conclusions about Dynein
• Dynein can change step size depending on load and [ATP]
• Monte Carlo simulations in good agreement with experiment
• No load: sites # 1 and # 3 bind ATP → large step size ~ 32 and 24 nm
• Large load, 4 sites bind ATP → small step size ~ 8 nm

Collaborators
Dmitri Petrov, Steve Gross, Clare Yu, Manoranjan Singh
(missing: Roop Mallik)

THE END
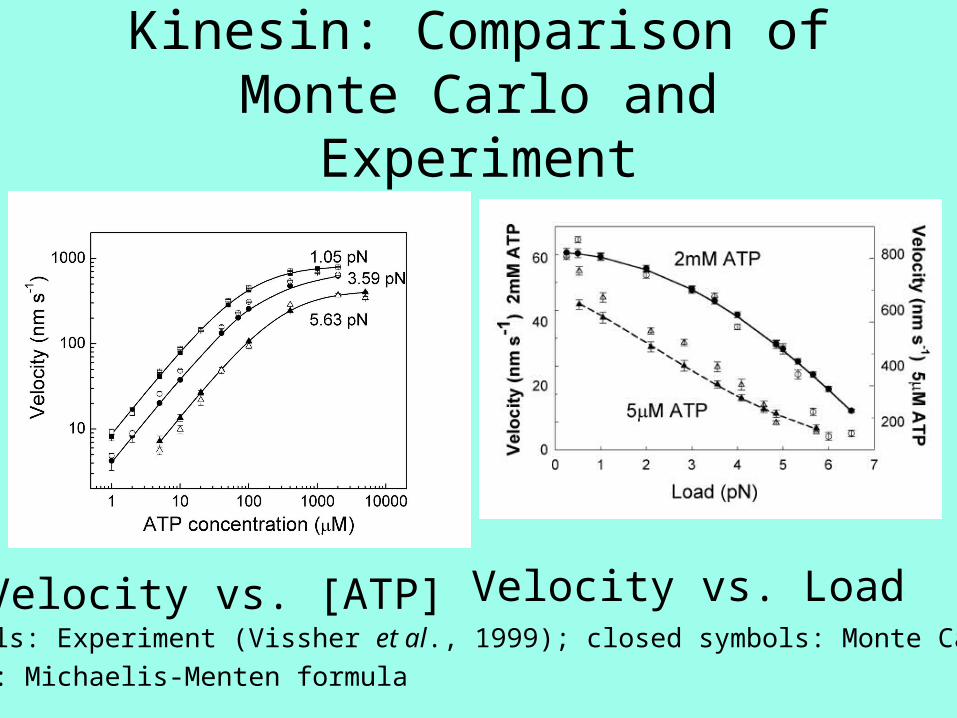
Kinesin: Comparison of Monte Carlo and Experiment
Velocity vs. [ATP] Velocity vs. LoadOpen symbols: Experiment (Vissher et al., 1999); closed symbols: Monte Carlo;
solid line: Michaelis-Menten formula
Modeling Dynein: The Gear-Shifting Motor
Manoranjan Singh, Roop Mallik, Steve Gross, and Clare Yu
University of California, Irvine
+
+
+
+Nucleus

Intracellular Traffic
© Scientific American
How is intracellular transport regulated?
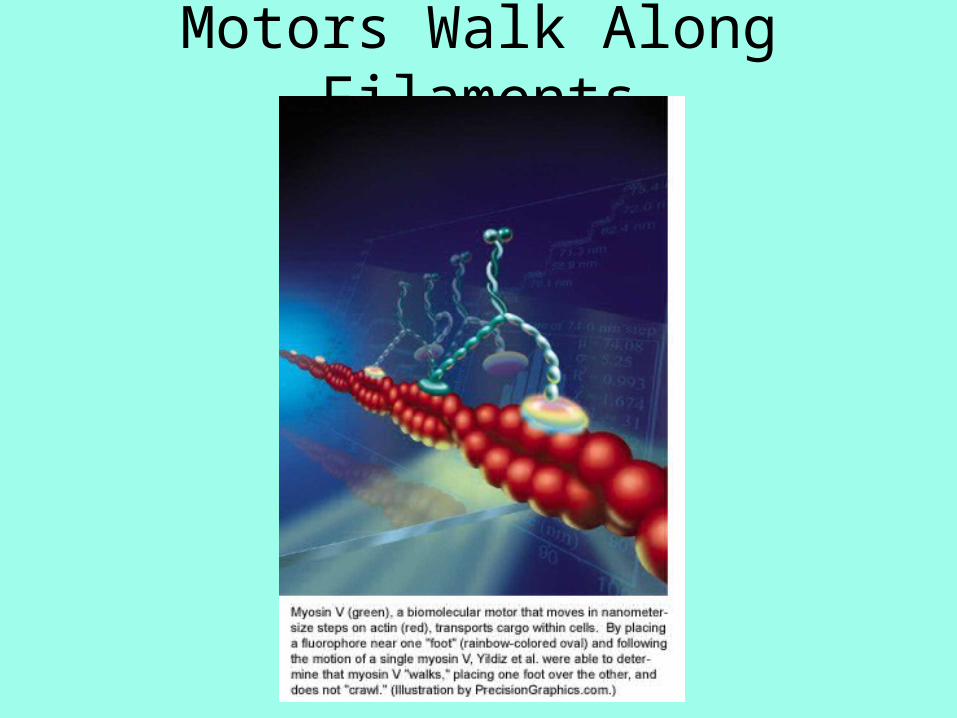
Motors Walk Along Filaments
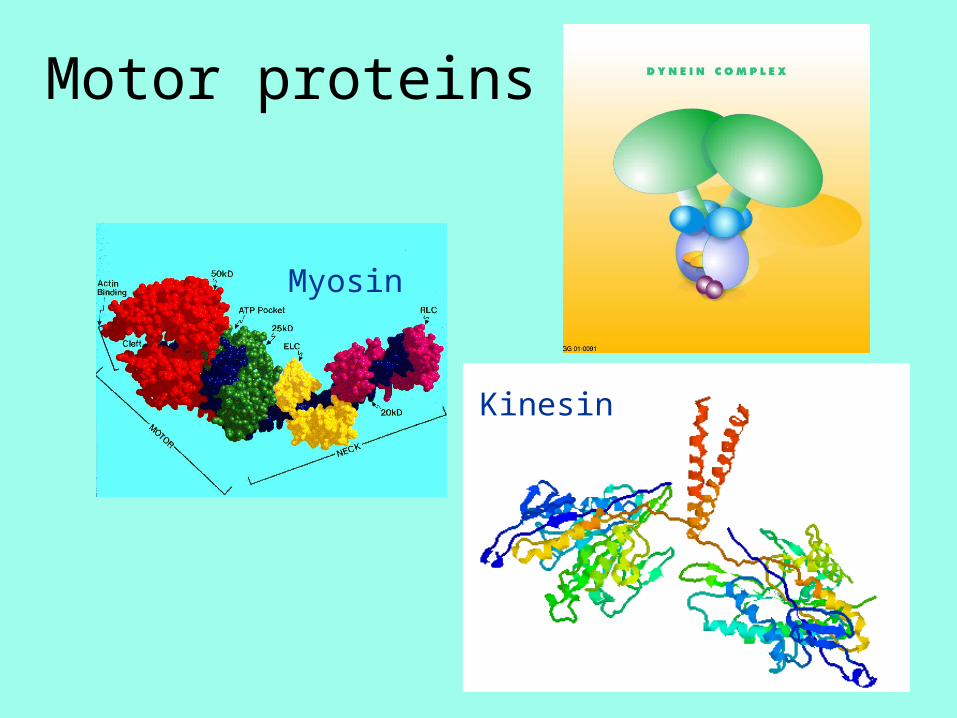
Motor proteins
Myosin
Kinesin

++
Dynein
Kinesin
Vesicle
Mitochondria
+
+
+
+Nucleus
Highway System of a Cell

ATP Fuels the Motor
• ATP = Adenosine Triphosphate• ATP has 3 phosphate ions• Hydrolysis: 1 phosphate ions breaks off• ADP = Adenosine Diphosphate has 2 phosphate
ions • Energy is released
ATP → ADP + Pi
4
1
5 3
27
6
ATP ADP+Pi
MT
Stalk
Stem
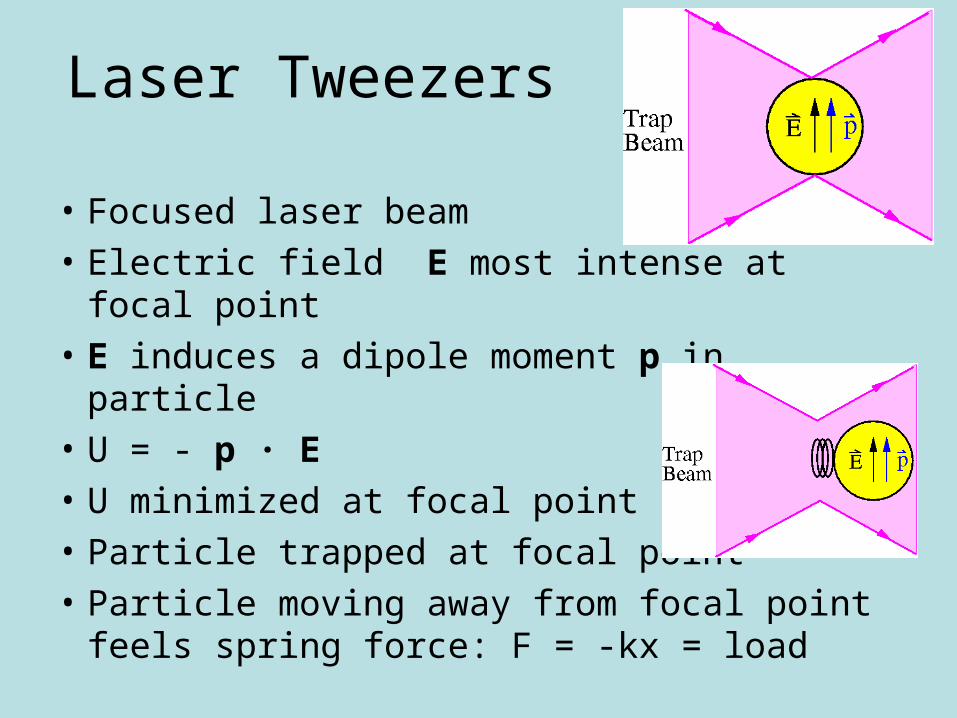
Laser Tweezers
• Focused laser beam
• Electric field E most intense at focal point
• E induces a dipole moment p in particle
• U = - p · E
• U minimized at focal point
• Particle trapped at focal point
• Particle moving away from focal point feels spring force: F = -kx = load
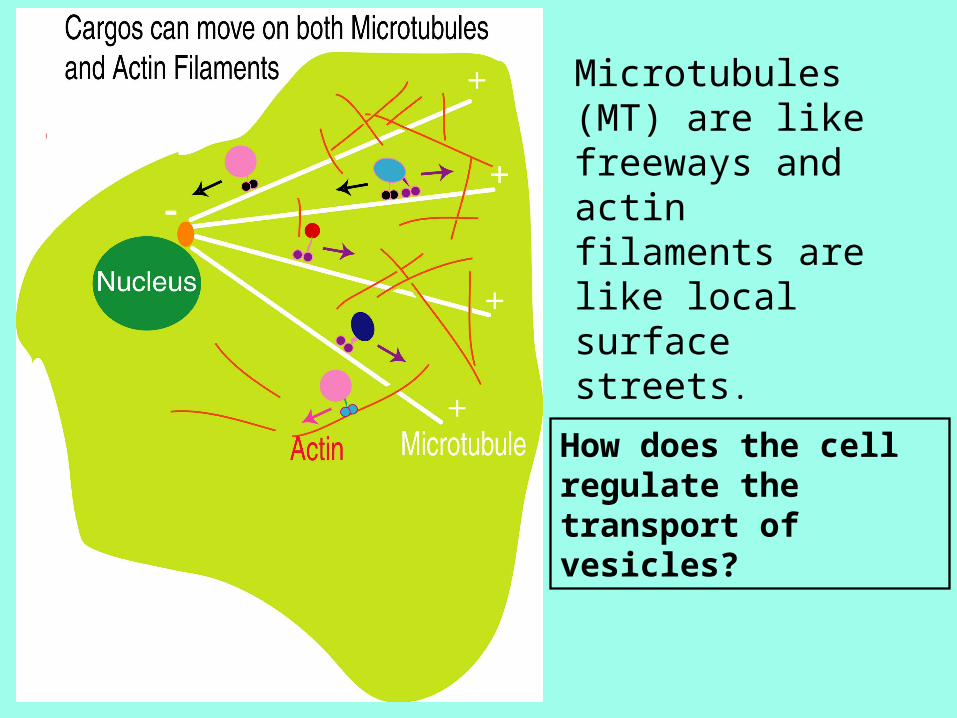
How does the cell regulate the transport of vesicles?
Microtubules (MT) are like freeways and actin filaments are like local surface streets.

Pos
ition
alo
ng m
icro
tubu
le (
nm)
Time (sec)
Step size as function of load
High load8nm steps
Intermediate load 15 nm steps
Low load~25 nm steps
(High [ATP])

Stepsize changes as a function of load
Intermediate load~ 0.4 to 0.8 pN
15 nm steps
Low load< 0.4 pN
~25 nm steps
(High [ATP])
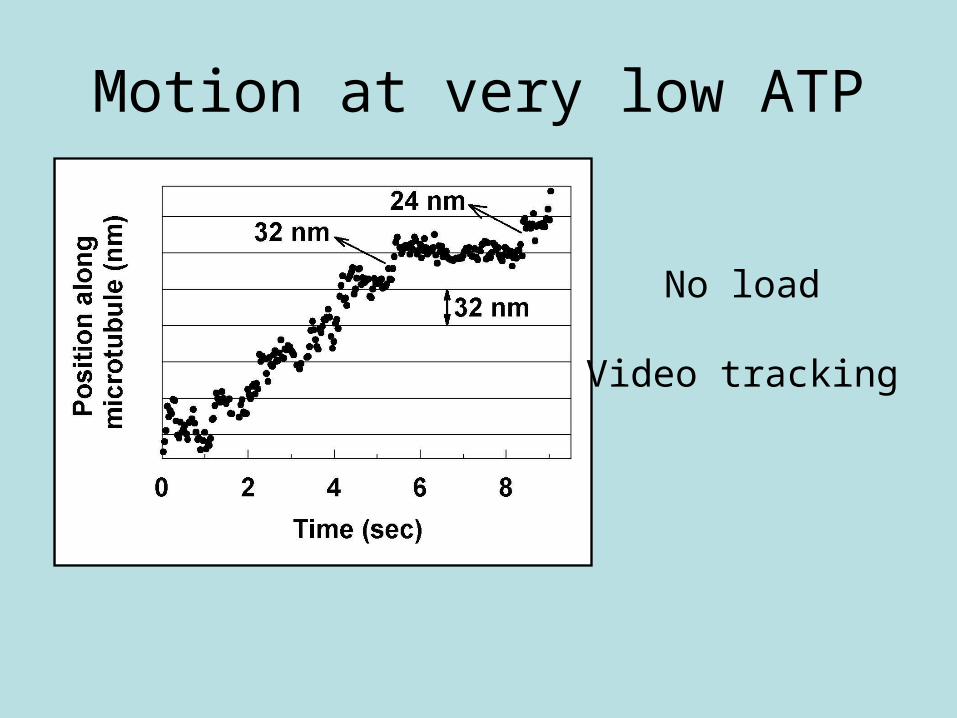
Motion at very low ATP
No load
Video tracking
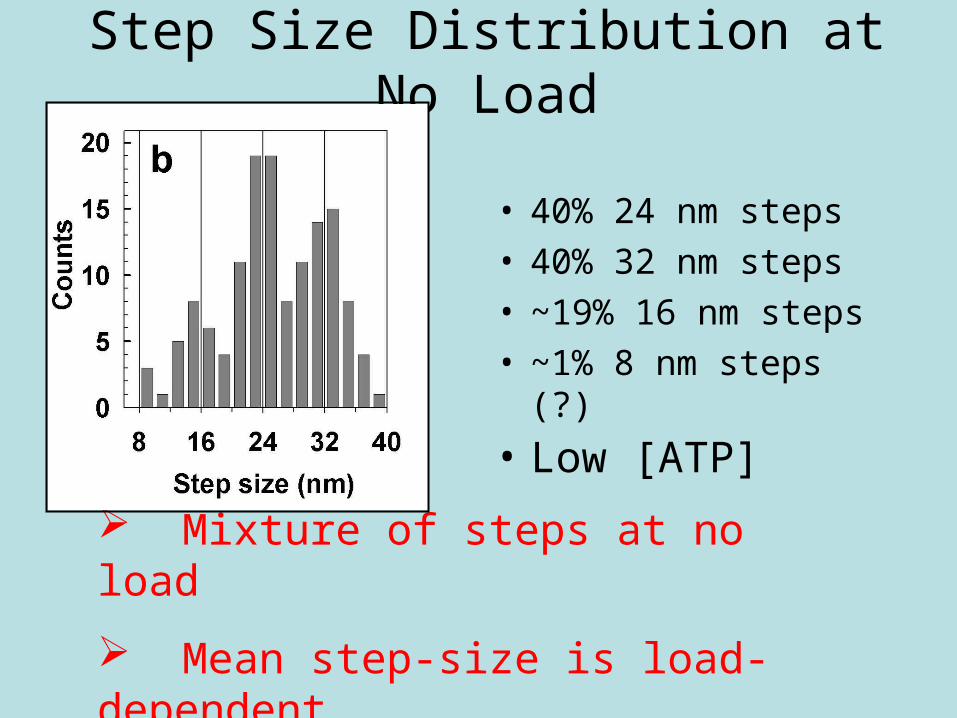
Step Size Distribution at No Load
• 40% 24 nm steps• 40% 32 nm steps• ~19% 16 nm steps• ~1% 8 nm steps (?)
Mixture of steps at no load
Mean step-size is load-dependent
• Low [ATP]
Lo
ad
step
Small
Large
step
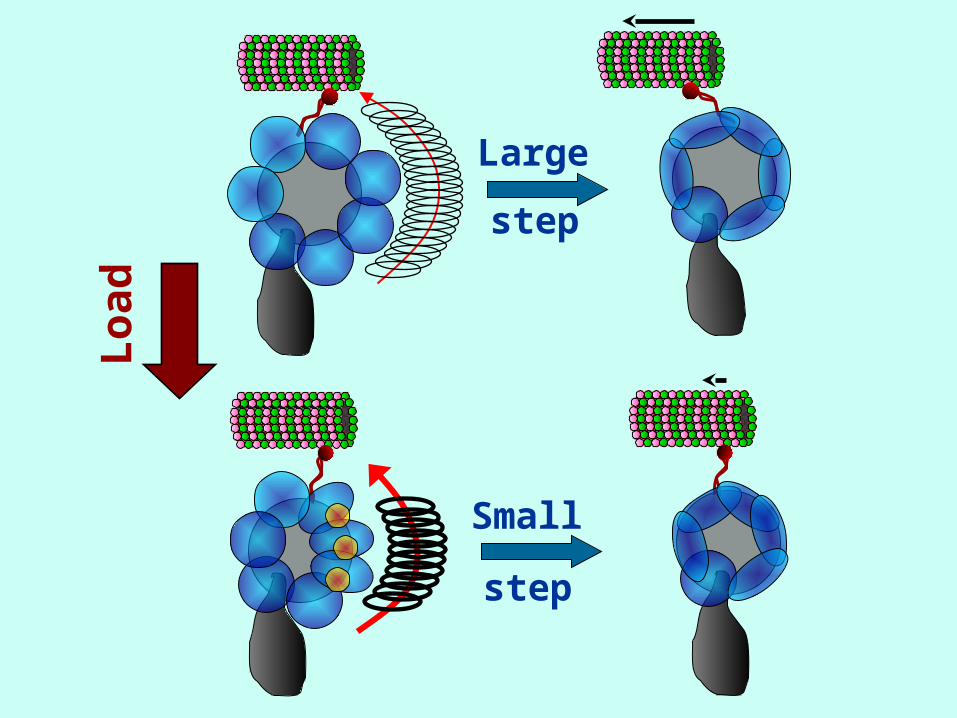
Lo
ad
step
Large
Small
step
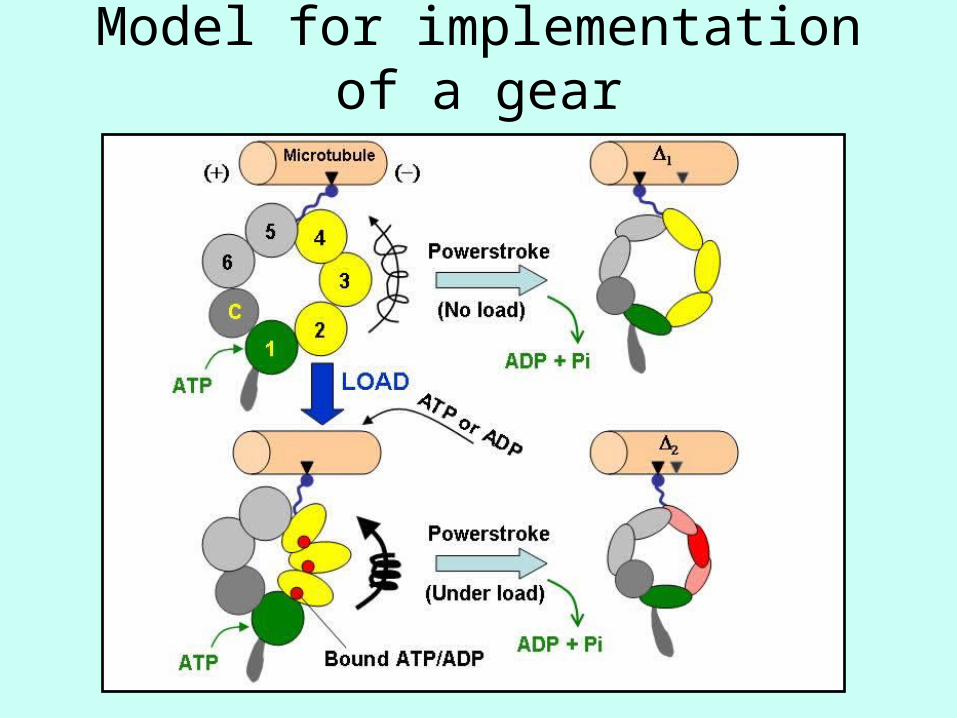
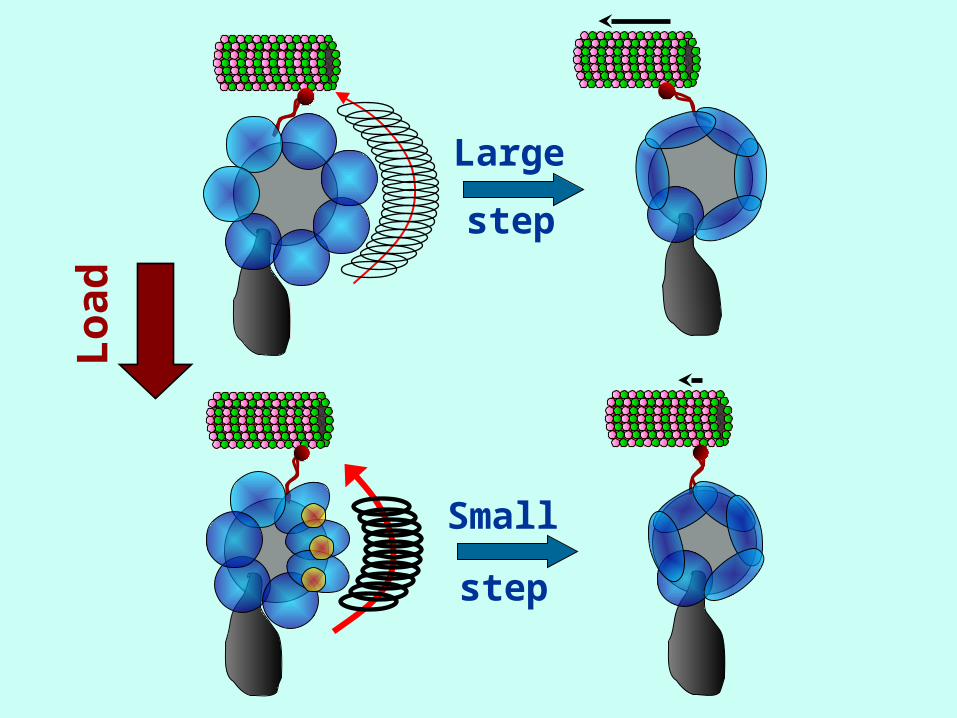
Model for implementation of a gear

Desired Features• ATP can bind to sites 1-4• Step size decreases as number of bound sites
increases• Binding probability increases with [ATP]• Different ATP binding affinities on different sites
dictates sequential binding (1, 3, 4, 2)• Binding probability on sites 2-4 increases with load
F (need fuel to haul cargo)• ATP can unbind• Hydrolysis needed for step to occur• Sites 1 and 3 hydrolyze ATP, but energy for step
probably comes from hydrolysis at site 1• Probability to hydrolyze ATP at site 1 increases if
ATP bound to other sites, esp. site 3• Probability to hydrolyze ATP decreases with load
(Harder to walk with load)• Reverse hydrolysis can occur (ADP + Pi → ATP)
4
1
5 3
27
6
ATP ADP+Pi
MT
Stalk
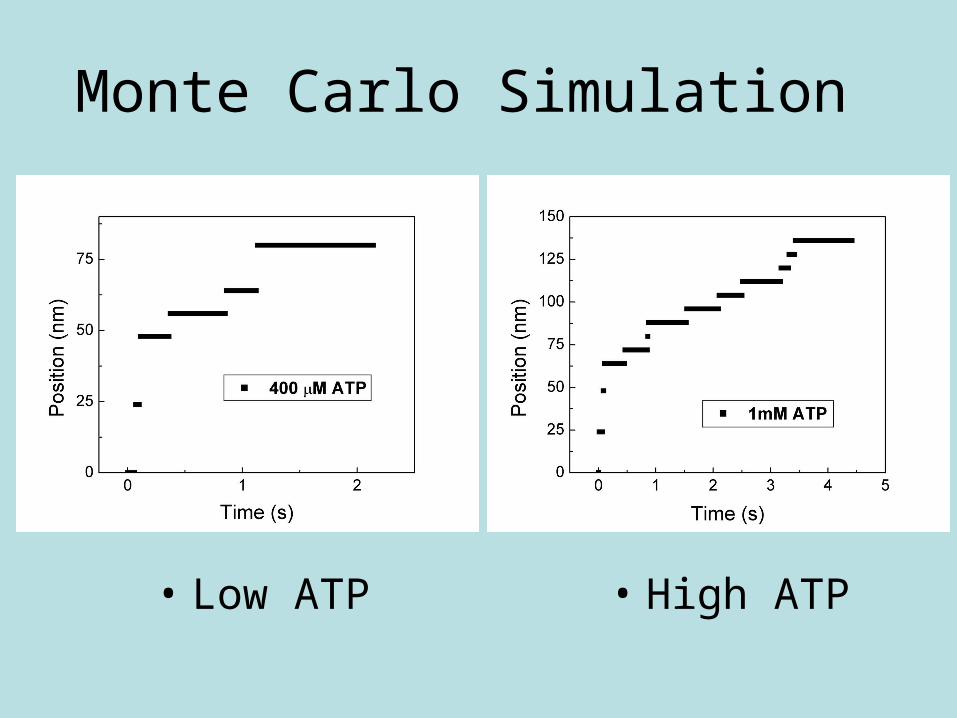
Monte Carlo Simulation
• Low ATP • High ATP
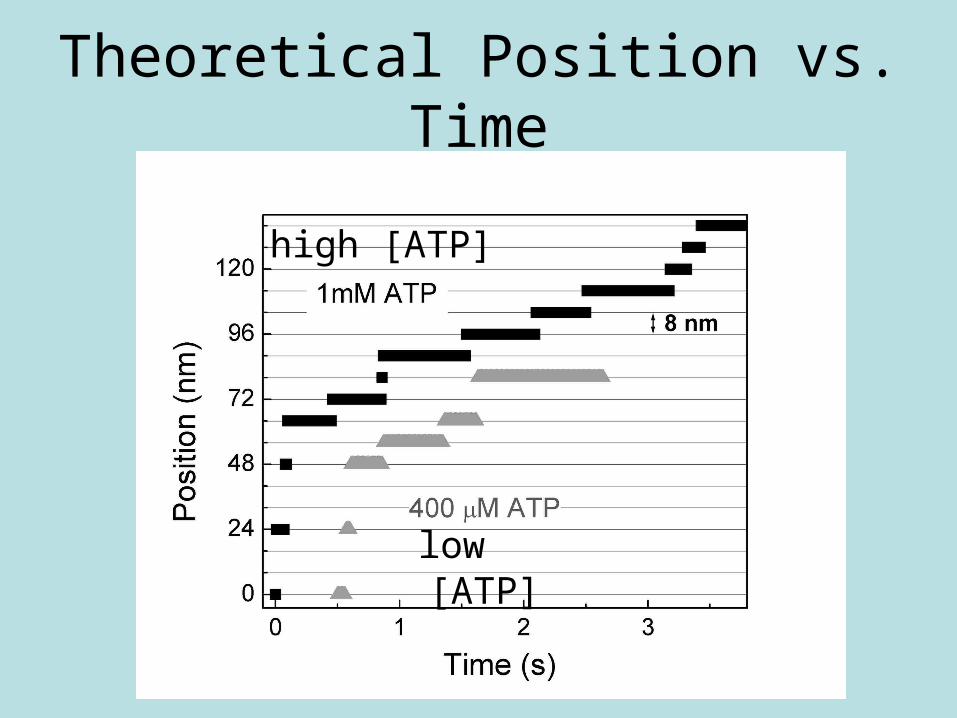
Theoretical Position vs. Time
low [ATP]
high [ATP]

Step Size Distribution
High ATP
Low ATP
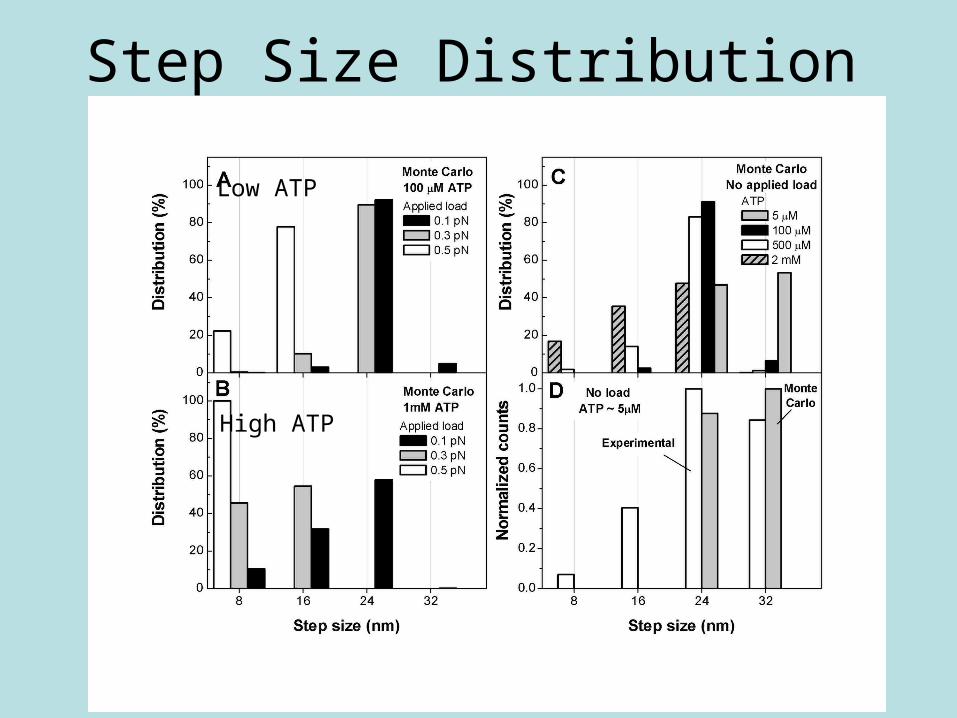
Step Size Distribution
Low ATP
High ATP
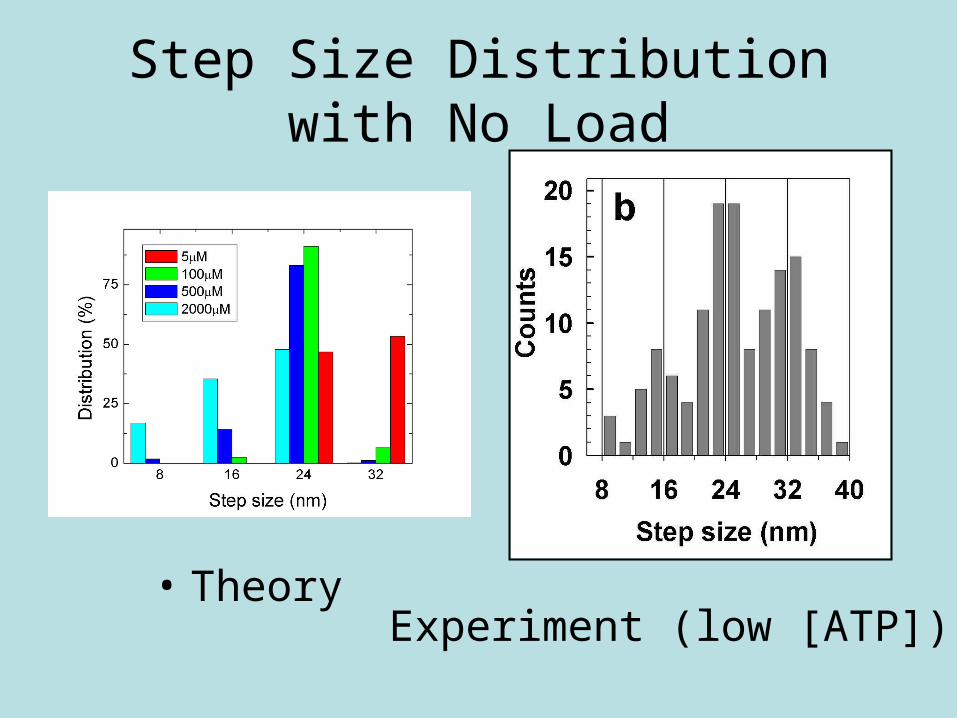
Step Size Distribution with No Load
• TheoryExperiment (low [ATP])

Step Size Distribution with No Load: Compare Theory and Experiment
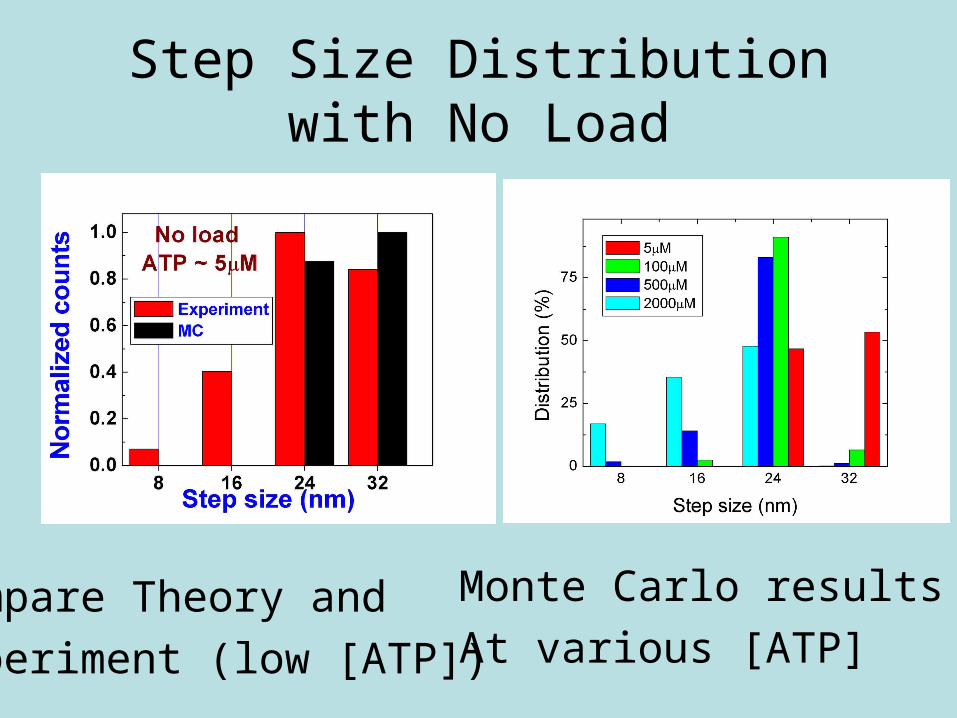
Step Size Distribution with No Load
Monte Carlo results
At various [ATP]Compare Theory and
Experiment (low [ATP])
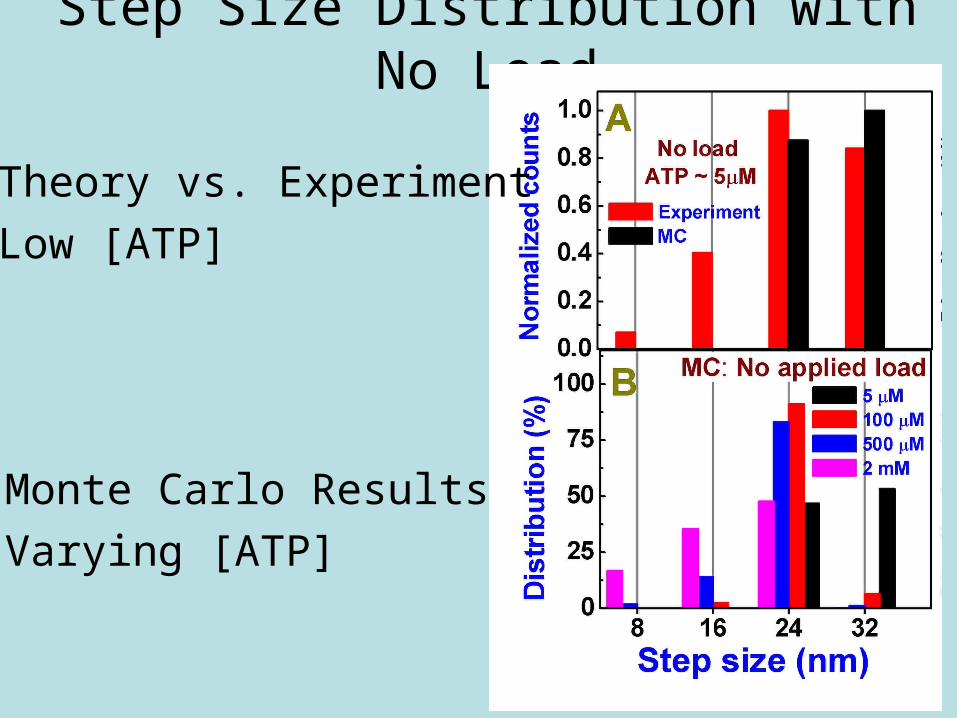
Step Size Distribution with No Load
• Theory vs. Experiment
• Low [ATP]
• Monte Carlo Results
• Varying [ATP]

High [ATP] = 1 mM Low [ATP] = 100 μM
Simulation Results of Step Size•Step size decreases as load increases
•Agrees with experiment

Predicted Velocity vs. Load