Mobile Apps and Sites Apps and Sites Consumer behaviour in three verticals: retail, travel and...
45
Mobile Apps and Sites Consumer behaviour in three verticals: retail, travel and finance Google and Ipsos Connect UK July 2015 UK Ipsos Connect
Transcript of Mobile Apps and Sites Apps and Sites Consumer behaviour in three verticals: retail, travel and...

Mobile Apps and SitesConsumer behaviour in three
verticals: retail, travel and finance
Google and Ipsos Connect UKJuly 2015
UK Ipsos Connect

2
The story on a page
THERE’S A LOT MORE COMPETITION IN RETAIL APPS THAN TRAVEL OR FINANCE
Most have only one or two travel and finance apps, while retail is more prolific
Users are far more likely to spend through retail apps than travel or finance
Frequent app users tend to spend more
PEOPLE ARE AMBIVALENT TOWARDS APPS AND SITES – BRANDS NEED TO EXCEL AT BOTH
Apps are used for a combination of quick tasks and ‘time killing’ activities
Sites are liked for quantity of information
Sites are far more likely to be chosen by first time users
PERSONALISATION IS A WINNING THEME OF SUCCESSFUL APPS
There’s potential to leverage frequent customers as this is a main driver for downloading
Website and point of purchase are effective points to promote retail and finance apps
Encouraging recommendations is key for travel apps
Personalisation is vital for a well-liked app
RE-ENGAGEMENT IS TOUGH; KEEP USERS HOOKED
Lack of relevance is a key driver for disengagement, and many are reluctant to be enticed back
Search results and reminders have a place in encouraging re-use
New, exclusive content and discounts are especially powerful
Retail is particularly competitive, with uptake, abandonment and re-engagement all higher

3
Some soundbites
11% of retail app users have more than 20 retail apps installed
¾ of finance app users have just 1 or 2 apps
of retail app users have spent money in-app in the last 30 days, and 15% have spent more than £100
There’s no clear functional differentiation between apps and mobile sites - users are fairly ambivalent in choosing between them
Personalisation is key: ‘remembers my preferences’ is the top feature of the heaviest-used apps
There’s an appetite for re-engagement: 52% say they could be encouraged to use an app again via offers, notifications or ads
2

4
App portfolios
5
Most just have a few apps they use frequently, but there’s higher competition and higher spend in retail

6
Most own only a few apps – but there’s a great deal of competition when it comes to retail app ownership
How many apps do you have installed?
TRAVEL FINANCERETAIL
13%1 app
2 app
3 app
4 app
5 app
6 - 10 app
11 - 15 app
16 - 20 app
Over 20 app
16%
14%
14%
10%
14%
5%
3%
11%
33%
25%
14%
6%
4%
8%
3%
1%
5%
39%
36%
11%
5%
3%
2%
1%
2%
Q1: Please check your phone and tell us how many [vertical]apps you have installed Base: Retail: 460, Travel: 461, Finance: 459

7
There’s a real spread in how often apps are used, though finance apps tend to be used frequently
Average number of retail/travel/finance apps used…(among those with 20 or fewer retail apps; or 10 or fewer travel/finance apps)
TRAVEL FINANCERETAIL
0.8
1.5
1.4
0.9
0.2
0.4
0.7
0.6
0.7
0.2
0.6
0.8
0.3
0.2
0.1
Daily
Weekly
Monthly
Less often
Never
Q2: of the apps you have installed on your smartphone, how many do you use…?Base: Retail: 371, Travel: 419, Finance: 445

8
Finance apps are used almost as frequently as retail apps, despite far fewer being installed at any one time
% of people claiming to use a retail/travel/finance app…
TRAVEL FINANCERETAIL
30%
54%
46%
41%
15%
44%
68%
58%
41%
14%
Daily
Weekly
Monthly
Less often
Never
44%
60%
25%
15%
11%
TRAVEL FINANCERETAIL
Q2: of the apps you have installed on your smartphone, how many do you use…?Base: Retail: 460, Travel: 461, Finance: 459

9
Although a majority don’t tend to transact in travel or finance apps, those who do can spend a lot
Amount spent through apps
TRAVEL FINANCE
Within the last 30 daysKey: Within the last 7 days
Spend nothing
Spend £0-100
Spend £100+
89%80%
10%14% 23%27%
1%6%
2%9%
75%64%
A minority are spending very large amounts via apps - most likely booking holidays, paying bills
Q16: Roughly how much have you spent on purchases of products, services or subscriptions made through apps in the past..?Base: Retail: 460, Travel: 461, Finance: 459

10
Retail app users are far more likely to spend, and spend more
Amount spent through Retail apps Within the last 30 daysKey: Within the last 7 days
Spend nothing
Spend £0-100
Spend £100+
54%34%
3%15%
RETAIL
43%51%
Q16: Roughly how much have you spent on purchases of products, services or subscriptions made through apps in the past..?Base: Retail: 460, Travel: 461, Finance: 459

11
Unsurprisingly, it’s those who use apps more frequently that are more likely to spend
TRAVEL FINANCE
% of all users who made a purchase in the last 7 days
% of daily users who made a purchase in the last 7 days
Difference
46%
57%
11%
20%
25%
38%
+11% +9% +13%
RETAIL
Base: Retail: 460, Travel: 461, Finance: 459

12
Apps vs. mobile sites

13
Users tend to be ambivalent between apps and sites – brands need to excel at both

14
Apps are preferred for speed, sites for quantity of info; but high ambivalence reveals need to deliver on both
In which of the following situations would you prefer to use apps and which would you prefer to use mobile websites?Retail, travel & finance combined
Need to complete a task quickly
want to kill time
Are worried about privacy/security
Look for something specific
Browse/look for inspiration
Want to compare options
Need a lot of information
49% 43% 9%
33% 58% 9%
22% 61% 17%
20% 54% 26%
19% 57% 24%
16% 61% 23%
15% 49% 36%
Prefer app Don’t know Prefer mobile site
Q12: In which of the following situations would you prefer to use apps and which would you prefer to use mobile websites? When you…Base: 1380

15
Within retail, apps are more popular than sites, but a larger proportion of users are ambivalent
Retail:Which of these would you prefer to use an app for and which would you prefer to use a mobile website for?
Browser or look for products
Compare prices when in a store
Purchase a product
Find directions to a store
Compare product features
Read reviews by other shoppers
Look for customer service info
36% 51% 13%
35% 58% 8%
32% 54% 14%
28% 60% 12%
25% 60% 15%
22% 65% 13%
18% 67% 15%
Prefer app Don’t know Prefer mobile site
Those with 3-4 retail apps are most likely to prefer to purchase via an app
Otherwise preferences are the same regardless of number of apps installed
Q11: Which of these would you prefer to use an app for and which would you prefer to use a mobile website for?Base: Retail: 460, Travel: 461, Finance: 459
16
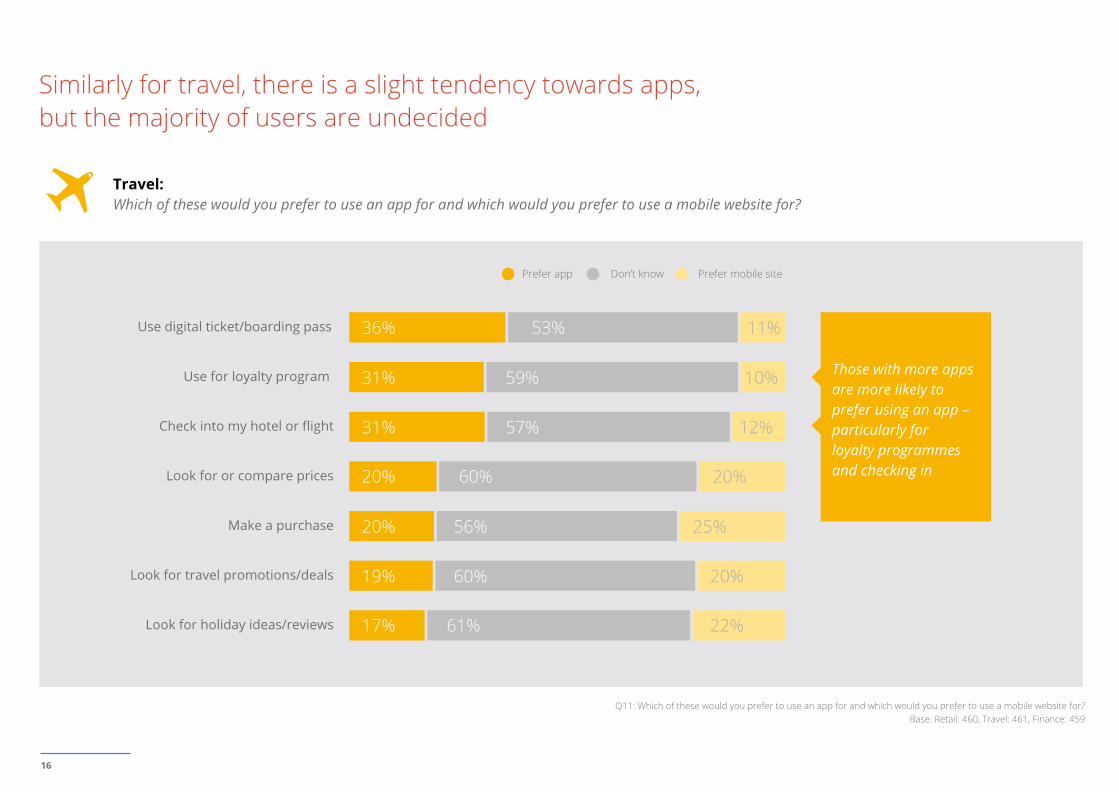
Similarly for travel, there is a slight tendency towards apps, but the majority of users are undecided
Travel:Which of these would you prefer to use an app for and which would you prefer to use a mobile website for?
Use digital ticket/boarding pass
Use for loyalty program
Check into my hotel or flight
Look for or compare prices
Make a purchase
Look for travel promotions/deals
Look for holiday ideas/reviews
36% 53% 11%
31% 59% 10%
31% 57% 12%
20% 60% 20%
20% 56% 25%
19% 60% 20%
17% 61% 22%
Prefer app Don’t know Prefer mobile site
Those with more apps are more likely to prefer using an app – particularly for loyalty programmes and checking in
Q11: Which of these would you prefer to use an app for and which would you prefer to use a mobile website for?Base: Retail: 460, Travel: 461, Finance: 459

17
Apps preferred to check accounts and make payments; sites more popular for other activities
Finance:Which of these would you prefer to use an app for and which would you prefer to use a mobile website for?
Check my account status
Make a payment
Look for/ compare prices/rates
Purchase insurance
Research financial products/ services
Request a quote/sign up for service
Get an insurance quote
64% 31% 5%
53% 36% 11%
17% 58% 25%
14% 55% 31%
13% 58% 29%
13% 61% 26%
13% 59% 29%
Prefer app Don’t know Prefer mobile site
Those with more apps have a stronger preference for making payments and checking accounts using an app
Q11: Which of these would you prefer to use an app for and which would you prefer to use a mobile website for?Base: Retail: 460, Travel: 461, Finance: 459

18
These app preferences are reflected in usage – a combination of quick tasks and ‘time killing’ activities
Top 3 activities carried out on apps by vertical
Browsed or looked for products
61%
Purchased a product
45%
Read reviews by other shoppers
37%
Looked for or compared prices
28%
Looked for holiday ideas/
reviews
27%
Looked for travel
promotions/ deals
21%
Made a payment
51%
Looked for/ compared
prices/ rates
20%
Checked my account status
77%
RETAIL TRAVEL FINANCE
Q10: Which of the following activities have you engaged in on your smartphone (either through a mobile browser or an app) in the last 30 days?Base: Retail: 460, Travel: 461, Finance: 459

19
New users prefer sites, but lack of distinction among others shows need for strong performance on both
Imagine you were searching for a brand online that you have/haven’t used before. Would you prefer to click on a link to brand’s…?
RETAIL TRAVEL FINANCE
22% 15%
57% 28% 54%
24%
47% 33% 40%
27%
34%
20%
Q20a: Imagine you were searching for a brand online that you have used before. Would you prefer to click on a link to their…?Q20b: Imagine it was a brand you haven’t used before . Would you prefer to click on a link to their…?
Base: Retail: 460, Travel: 461, Finance: 459
If haven’t used before:
If used brand before (and have app installed):
14%
23% 63%
35%
21%
43%

20
Engaging users

21
Desirable apps are those that fit into users’ everyday lives, effortlessly

22
A strong cross-device experience is a winning feature of preferred apps
To what extent do you agree or disagree that the following attributes are true of apps that you use most frequently?
TRAVEL FINANCERETAIL
23% 42%
14% 36%
16% 33%
15% 37%
13% 24%
12%
7% 17%
28%
22% 41%
13% 29%
15% 29%
9% 34%
6% 20%
5%
3%
36% 38%
16% 37%
12% 37%
9% 37%
13% 24%
16%
11%
6%
6%13%
23%
Q15: To what extent do you agree or disagree that the following attributes are true of apps that you use most frequently?Base: Retail: 460, Travel: 461, Finance: 459
Makes my life easier
Same experienceacross devices
Has an intuitiveuser interface
Appealing designand aesthetic
A brand I iteract with offline
Always has new content
Connect with mysocial networks

23
Regular use of brand is biggest reason for download – leverage this to increase loyalty among customers
For which reasons have you downloaded an app in the past?Top 5 reasons across verticals
53%
29%
57%
28%
14%
20%
28%
11%14%
31%
10%12% 14%
25%
8%
Regularly usecompany
Suggested to me on a website
To accessdiscouts/rewards
To completea purchase
Recommended by others
Retail Travel Finance
Website and point of purchase can be effective tools to promote the app
Encourage recommendations
Q7a&b: For which reasons have you downloaded a [vertical] app in the past?Base: 1380

24
Personalisation is key to encouraging app usage, along with a wide range of features and security
Most preferred features of appsRetail, travel & finance combined
“Remembers my preferences”
“Has a wide range of features”
“Requires you to sign in”Desire for privacy driven
by finance apps
46%
42%
39%
Q14a&b: Thinking about apps that you use, which of the following features do you prefer to have?Base: 1380

25
Location-based info is appreciated in travel apps, while security is unsurprisingly a must for finance
Thinking about apps that you use, which of the following features would you prefer to have?
TRAVEL FINANCERETAIL
49%
45%
29%
39%
35%
30%
22%
18%
12%
9%
42%
37%
64%
36%
38%
25%
14%
12%
15%
5%
47%
44%
25%
28%
15%
20%
38%22%
17%
13%
11%
Remember my preferences
Has a wide range of features
Requieres you to sign in
Remembers my info on all devices
Remember billing info
Stores personalised info
Uses my location to provide info
Can login using social network
Isn’t free but has no adverts
Links to my social networks
Q14a&b: Thinking about apps that you use, which of the following features do you prefer to have?Base: Retail: 460, Travel: 461, Finance: 459

Agree stronglyKey: Agree slightly
26
Ratings, reviews and descriptions are influential in downloading decisions (though price is of course key)
How important are the following factors when making a decision about which app(s) to download?
TRAVEL FINANCERETAIL
Price
Rating
Reviews
Description
Memory used
Number of users
Popularity with friends
52% 28%
16% 36%
21% 34%
17% 31%
20% 25%
6%
7% 16%
19%
42% 25%
18% 38%
20% 32%
18% 35%
14% 24%
15%
11%
6%
5%
47% 28%
22% 37%
23% 33%
16% 39%
13% 26%
5%
6% 14%
18%
Q8: When searching for apps in your smartphone’s app store, how important are the following factors when making a decision about which app(s) to download?Base: Retail: 460, Travel: 461, Finance: 459
27
Re-engaging users

28
It’s tough to entice abandoners back; keeping hold of existing users with re-engagement tactics is key

29
Lack of relevance and memory lead to abandonment – factors that aren’t easily solved by brands
Have you stopped using or uninstalled apps on your smartphone for any of the reasons below?
TRAVEL FINANCERETAIL
I no longer need to use it
Wasn’t as useful as I thought
I lost interest
Needed to free up memory
There were too many ads
Technical problems with the app
I found a better/ more useful app
Didn’t have the features I wanted
It was difficult to use
Update made change I didn’t like
Poor paymente process
I heard negative things about it
30%
35%
32%
32%
20%
19%
13%
16%
12%
7%
5%
15%
27%
25%
19%
21%
13%
13%
15%
14%
5%
3%
3%
13%
20%
16%
16%
13%
9%
10%
11%
8%
7%
5%
4%
8%
Q17a&b: Have you stopped using or uninstalled apps on your smartphone for any of the reasons below? Base: Retail: 460, Travel: 461, Finance: 459

30
Search can be key to driving more frequent usage, but many are unlikely to be persuaded
Thinking about apps that you don’t use regularly on your smartphone, which of the following would make you use the app more often?
TRAVEL FINANCERETAILTOTAL
Search results takig you to it
Reminder when not used in a while
Reminder if loginton other device
Online ads taking you to it
Notification whenfriends use it
Reminder when watching a video
None of the above
12%
11%
7%
14%
12%
9%
9%
6%
7%
61%
13%
11%
5%
4%
4%
2%
72%67%
6%
5%
5%
8%
11%
8%
5%
6%
5%
68%
Q18: Thinking about apps that you don’t use regularly on your smartphone, which of the following would make you use the app more often? Base: Retail: 460, Travel: 461, Finance: 459

31
High abandonment means a small but significant proportion of app users could be re-engaged
18%* 39% 7%
9%28%33%*TRAVEL
% open to re-engagement via search, reminders, ads
or notifications
Search, reminders, ads and notifications could impact…
x
x
=
=
RETAIL of all retail app users
of all travel app users
(*Source: Ipsos app re-engagement study, information unavailable for financial apps)
% of installed apps that are forgotten

32
New benefits exclusive to the app would be most effective in encouraging usage – especially for retail
Thinking about apps that you’ve stopped using or uninstalled, what reasons would make you more likely to start using the app again?
TRAVEL FINANCERETAILTOTAL
12%
11%
7%
6%
5%
5%
48%
Discount on next purchase
Exclusive or bonus content
Notification if new features added
Email/text ifnew features added
Family or friends start using it
Ads that take you to the app
None of the above
41%
29%
16%
13%
8%
7%
35%
26%
22%
13%
10%
8%
5%
51%
20%
16%
10%
9%
9%
4%
58%
Q19: Thinking about apps that you’ve stopped using or uninstalled, what reasons would make you more likely to start using the app againBase: Total: 1380 Retail: 460, Travel: 461, Finance: 459

33
As we saw earlier, when seeking out a brand, users are torn between apps and sites
Imagine you were searching for a brand online that you’ve used before. Would you prefer to click on a link to brand’s…?
RETAIL TRAVEL FINANCE
47%
33% 37% 43%
21%
40%
27%
34%
20%
If used brand before (and have app installed):
Prefer appKey: Don’t know Prefer mobile site
Q20a: Imagine you were searching for a brand online that you have used before. Would you prefer to click on a link to their…?
Base: Retail: 460, Travel: 461, Finance: 459

34
Retail is competitive – users have more apps, are quicker to abandon them, and easier to tempt back
71% 2.4 65%
1.7 49%41%TRAVEL
Average number of reasons selected for uninstalling apps
Open to re-engagement (didn’t select ‘none of the above’ option)
RETAIL
1.2 42%24%TRAVEL
Base: Retail: 460, Travel: 461, Finance: 459
% who own more than two apps

35
Methodological background
35
Methodological background
35
Methodological background

36
Objectives
DISCOVERY
ACQUISITION
USAGE
ABANDONMENT
RE-ENGAGEMENT
This study covers the whole mobile app lifecycle taking the most salient parts from the US mobile app project and the UK app re-engagement project previously conducted by Ipsos, but streamlining it to a 10 minutes survey.
The objective is to understand users’ behaviour across mobile web and apps to help advertisers build holistic mobile strategies.
37
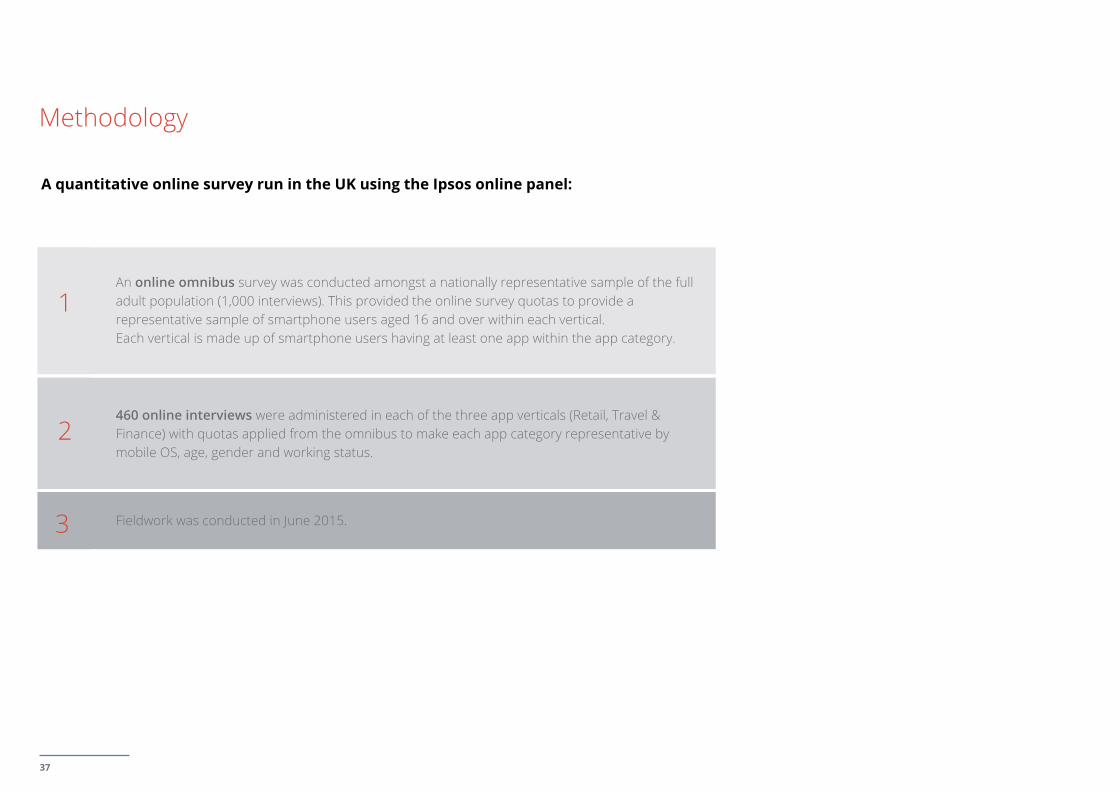
Methodology
A quantitative online survey run in the UK using the Ipsos online panel:
An online omnibus survey was conducted amongst a nationally representative sample of the full adult population (1,000 interviews). This provided the online survey quotas to provide a representative sample of smartphone users aged 16 and over within each vertical. Each vertical is made up of smartphone users having at least one app within the app category.
460 online interviews were administered in each of the three app verticals (Retail, Travel & Finance) with quotas applied from the omnibus to make each app category representative by mobile OS, age, gender and working status.
Fieldwork was conducted in June 2015.
1
2
3

38
The omnibus ensured sample was representative per vertical
Omnibus study results:
FINANCE
Android
iOS
Male
Female
37% 39% 32%
48% 39% 32% 52% 39% 32%
40% 47% 50%
60% 53% 50%
21% 19% 23%
27% 24% 28%
22% 22% 31% 29% 35% 28%
TRAVELRETAIL
16-24
25-34
35-44
45+
Nationwide, nationally representative studyBase: 1000
% natural fallout among those with android or iOS

39
The online survey provided results per vertical
An online survey was carried out among 1380 app users
All to have used an app of the relevant category within the last 30 days
460 retail app users(e.g. online & high street shops,
or supermarkets)
461 travel app users(e.g. public transport, flights,
holidays, GPS, maps)
459 finance app users(Finance, insurance and banking apps)
The questionnaire covered the full app lifecycle: discover, acquisition, usage, abandonment and re-engagement
Initial 500 interviews were planned, but the decision to stop fieldwork with a base sample of ~ 460 was taken to meet timings.

40
Appendix

41
Additionally, some fun or interesting features drive desire to download retail apps and experience with similar apps facilitates the trial of new travel apps
For which reasons have you downloaded an app in the past?
TRAVEL FINANCERETAIL
53%
28%
32%
31%
14%
11%
20%
14%
11%
9%
7%
8%
29%
14%
11%
10%
25%
19%
13%
11%
6%
5%
6%
7%
57%
20%
14%
12%
8%
12%
7%
10%
5%
7%
4%
6%
Regularly use company
Suggested to me on a website
To access discounts/rewards
To complete a purchase
Recommended by others
Past experience with similar app
It sounded interesting/fun
suggested to me in the app store
Saw an ad on my smartphone
Activity unavailable on website
Saw an ad elsewhare
Saw an ad on a computer/tablet
Q7a&b: For which reasons have you downloaded a [vertical] app in the past?Base: Retail: 460, Travel: 461, Finance: 459

42
While many people browse and read reviews in retail apps, less than a third use them to compare prices and features
Compared prices in store
28%
Browsed or looked for products
61%
Compared product features
28%
Purchased a product
45%
Read reviews by other shoppers
37%
Found directions to a
store
22%
Looked for customer
service info
17%
Q10: Which of the following activities have you engaged in on your smartphone (either through a mobile browser or an app) in the past 30 days
Retail: activities engaged in on smartphone in last 30days

Travel: activities engaged in on smartphone in last 30days
43
Travel apps uses are more scattered: also less than a third uses them to compare prices and another third uses them to look for holiday ideas
Q10: Which of the following activities have you engaged in on your smartphone (either through a mobile browser or an app) in the past 30 days
Used for loyalty
programme
10%
Looked for or compared
prices
28%
Looked for holiday ideas/
reviews
27%
Checked in to my hotel or
Flight
10%
Used digital ticket/boarding
pass
13%
Looked for travel
promotions/ deals
21%
Made a purchase
16%
Finance: activities engaged in on smartphone in last 30days
44
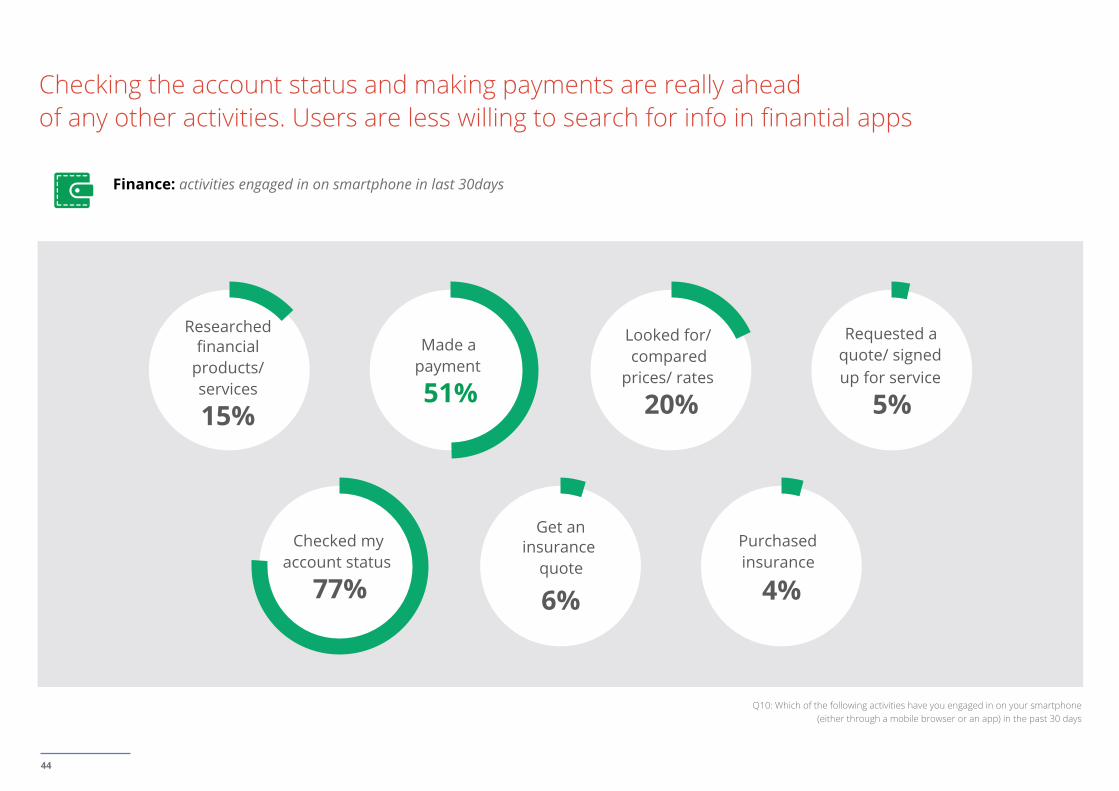
Checking the account status and making payments are really ahead of any other activities. Users are less willing to search for info in finantial apps
Q10: Which of the following activities have you engaged in on your smartphone (either through a mobile browser or an app) in the past 30 days
Researched financial
products/ services
15%
Made a payment
51%
Looked for/ compared
prices/ rates
20%
Requested a quote/ signed up for service
5%
Checked my account status
77%
Get an insurance
quote
6%
Purchased insurance
4%

353545
Thank you
IPSOS
Tak Ha ([email protected])Dafne Ortiz ([email protected])Nicola Catchpole ([email protected])
Alya Hazell ([email protected])