Ke ipsos columbia_university_report_june_2015_pa_final_version
49
© 2012 Ipsos. All rights reserved. Contains Ipsos' Confidential and Proprietary information and may not be disclosed or reproduced without the prior written consent of Ipsos. Transport Sector Survey: Nairobi City County Prepared by : Ipsos Limited (Kenya) Prepared for : Media Release Date : 17 th June, 2015
-
Upload
ipsos-kenya -
Category
Government & Nonprofit
-
view
351 -
download
0
Transcript of Ke ipsos columbia_university_report_june_2015_pa_final_version

© 2012 Ipsos. All rights reserved. Contains Ipsos' Confidential and Proprietary information andmay not be disclosed or reproduced without the prior written consent of Ipsos.
Transport Sector Survey: Nairobi City County
Prepared by : Ipsos Limited (Kenya)
Prepared for : Media Release
Date : 17th June, 2015

2
Methodology
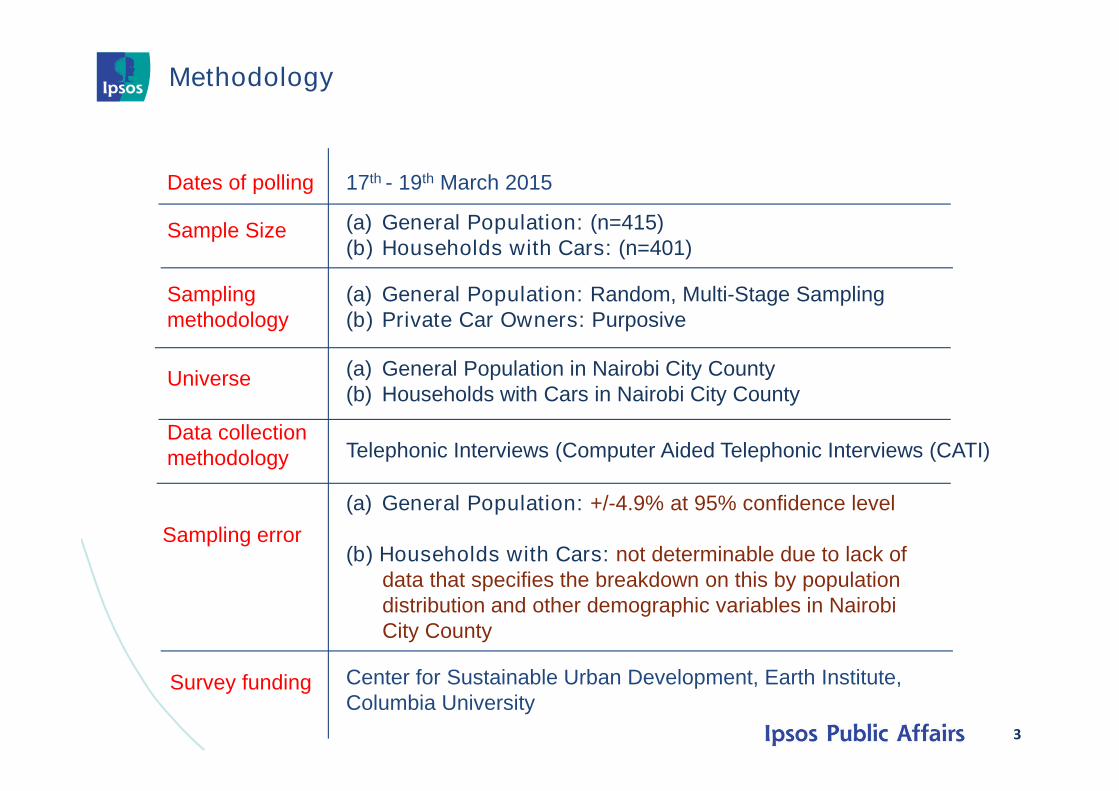
Methodology
3
Dates of polling 17th - 19th March 2015
Sample Size (a) General Population: (n=415)(b) Households with Cars: (n=401)
Samplingmethodology
(a) General Population: Random, Multi-Stage Sampling(b) Private Car Owners: Purposive
Universe
Data collectionmethodology
Sampling error
Telephonic Interviews (Computer Aided Telephonic Interviews (CATI)
Survey funding
(a) General Population in Nairobi City County(b) Households with Cars in Nairobi City County
(a) General Population: +/-4.9% at 95% confidence level
(b) Households with Cars: not determinable due to lack ofdata that specifies the breakdown on this by populationdistribution and other demographic variables in NairobiCity County
Center for Sustainable Urban Development, Earth Institute,Columbia University
4
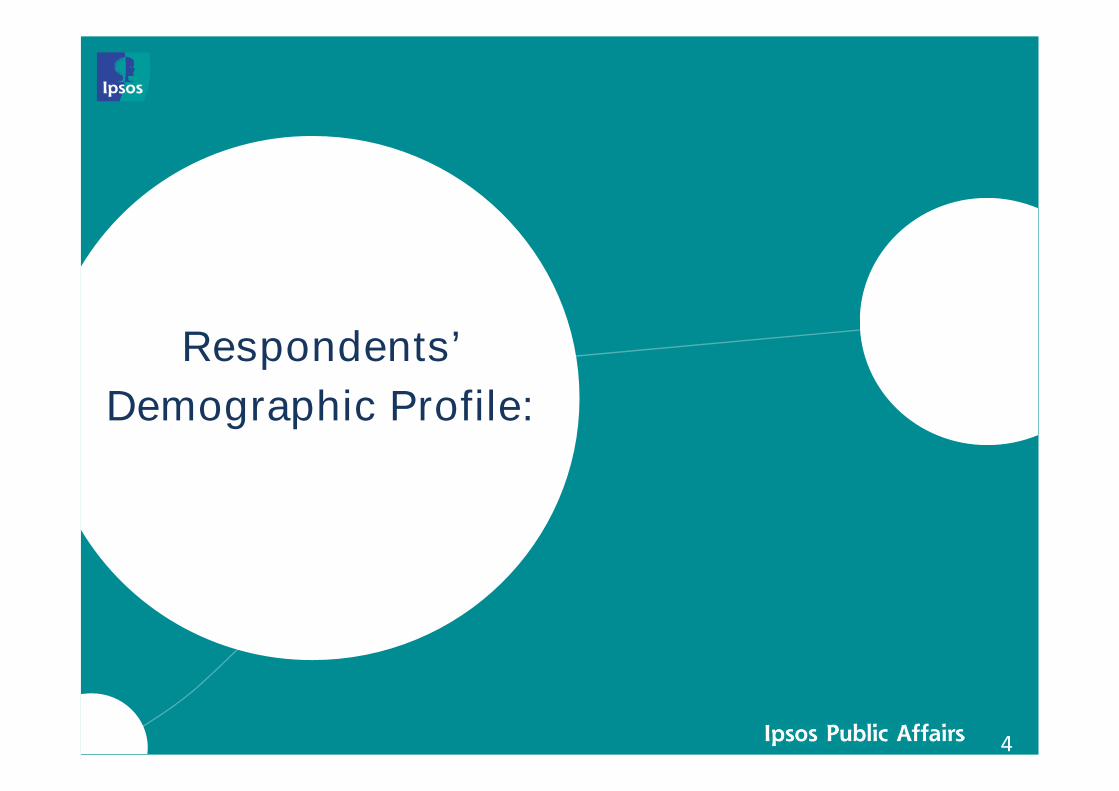
Respondents’
Demographic Profile:

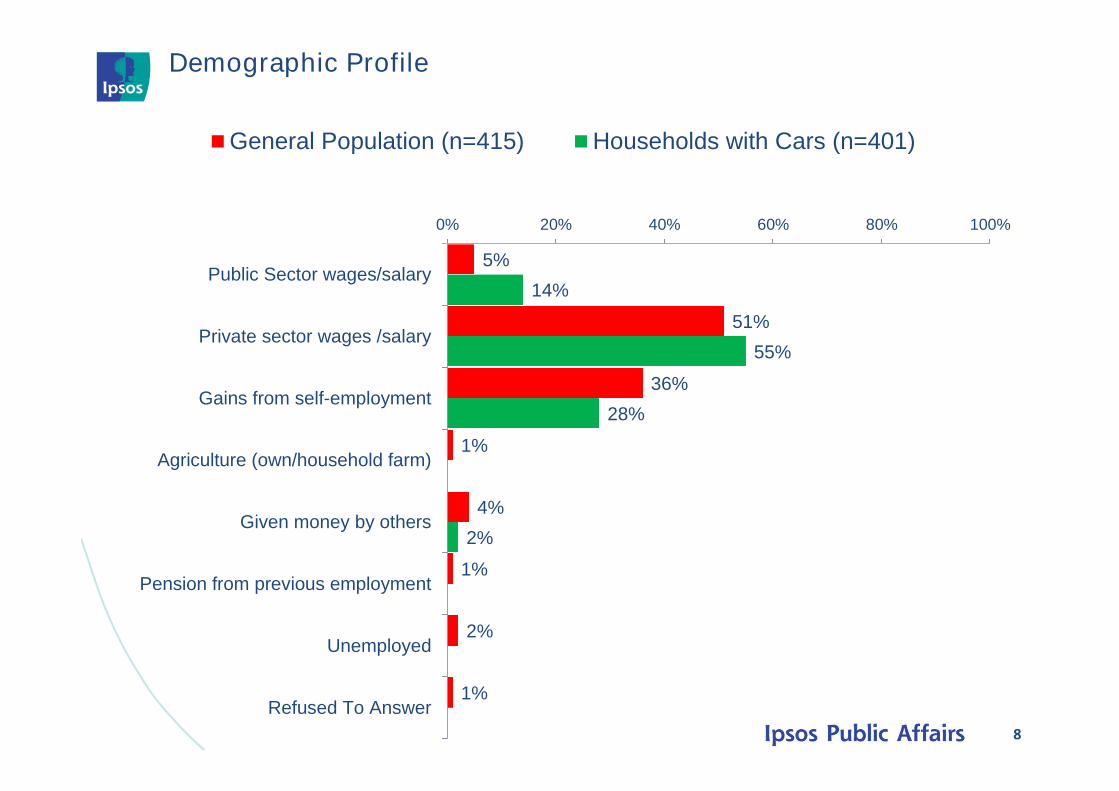
Demographic Profile
5
36% 34%
22%
8%
52%48%
34%29%
23%
14%
79%
21%
0%
20%
40%
60%
80%
100%
Nairobi East Nairobi North Nairobi West Westlands Male Female
General Population (n=415) Households with Cars (n=401)

Demographic Profile
6
30%
39%
18%14%
8%
48%
33%
11%
0%
20%
40%
60%
80%
100%
18 – 24 years 25 – 34 years 35 – 44 years 45+ years
General Population (n=415) Households with Cars (n=401)

Demographic Profile
7
1%
5%
4%
40%
7%
15%
11%
14%
3%
1%
3%
2%
25%
6%
17%
8%
35%
4%
0% 10% 20% 30% 40% 50%
Some primary education
Primary education completed
Some secondary education
Secondary education completed
Some middle level college (not University)
Completed mid-level college (not University)
Some University education
University education completed
Post Graduate (Masters, MBA, PhD)
Other
General Population (n=415) Households with Cars (n=401)
Demographic Profile
8
5%
51%
36%
1%
4%
1%
2%
1%
14%
55%
28%
2%
0% 20% 40% 60% 80% 100%
Public Sector wages/salary
Private sector wages /salary
Gains from self-employment
Agriculture (own/household farm)
Given money by others
Pension from previous employment
Unemployed
Refused To Answer
General Population (n=415) Households with Cars (n=401)

Demographic Profile
9
7%
28%
14%
8%
2%
5%
2%
1%
5%
18%
11%
1%
9%
18%
12%
9%
9%
6%
1%
1%
3%
11%
18%
0% 10% 20% 30% 40% 50%
Less than 10,000
10,001 – 25,000
25,001 – 40,000
40,001 – 55,000
55,001 – 75,000
75,001 – 100,000
100,001 – 150,000
150,001 – 399,000
Over 400,000
Has No income
DK
RTA
General Population (n=415) Households with Cars (n=401)
10
Transport Policy-Making:
Public Participation inNairobi City County
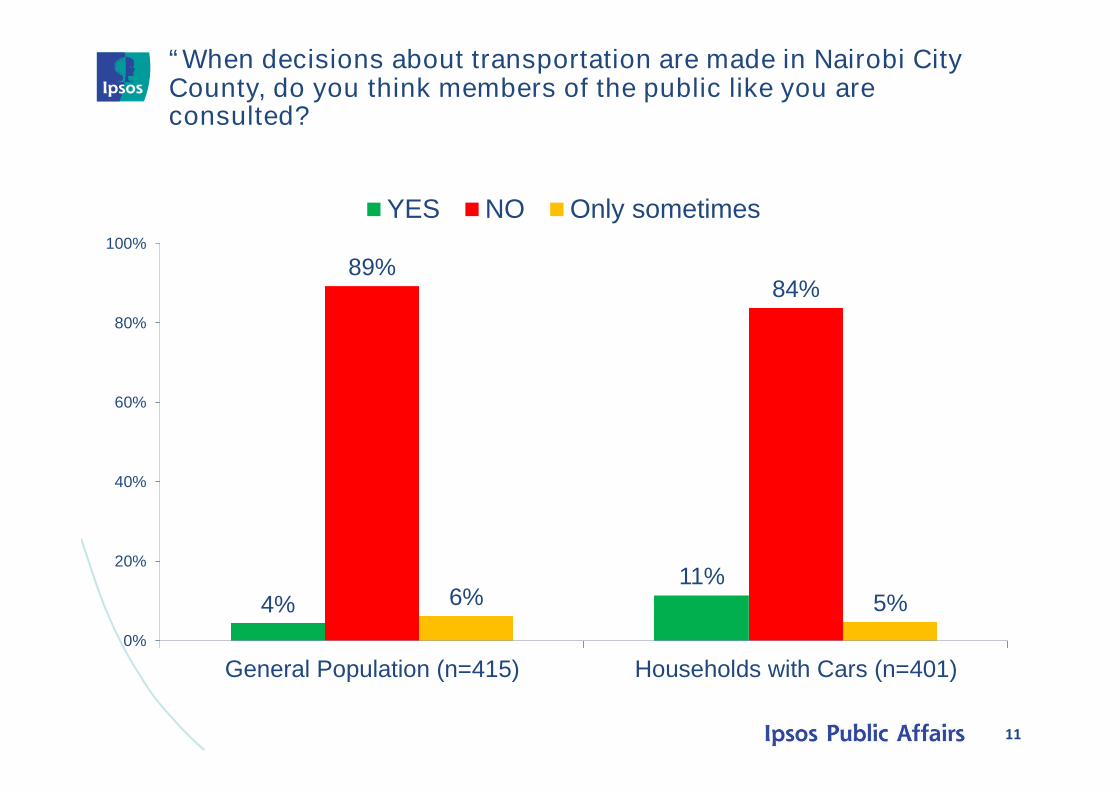
“When decisions about transportation are made in Nairobi CityCounty, do you think members of the public like you areconsulted?
11
4%11%
89%84%
6% 5%
0%
20%
40%
60%
80%
100%
General Population (n=415) Households with Cars (n=401)
YES NO Only sometimes

12
Car Ownership and Usage

Car Ownership and Usage
13
“Does anyone in your household own a vehicle?”
32%
100%
68%
0%
20%
40%
60%
80%
100%
General Population (n=415) Households with Cars (n=401)
YES NO
Respondentowns
, 60%
Anotherhouseholdmember(s)
own(s),40%
Base: Those who stated that they orsomeone in their household owns a
vehicle (n=133)
Respondentowns
, 80%
Anotherhouseholdmember(s)
own(s),20%
Base: Households with Cars (n=401)
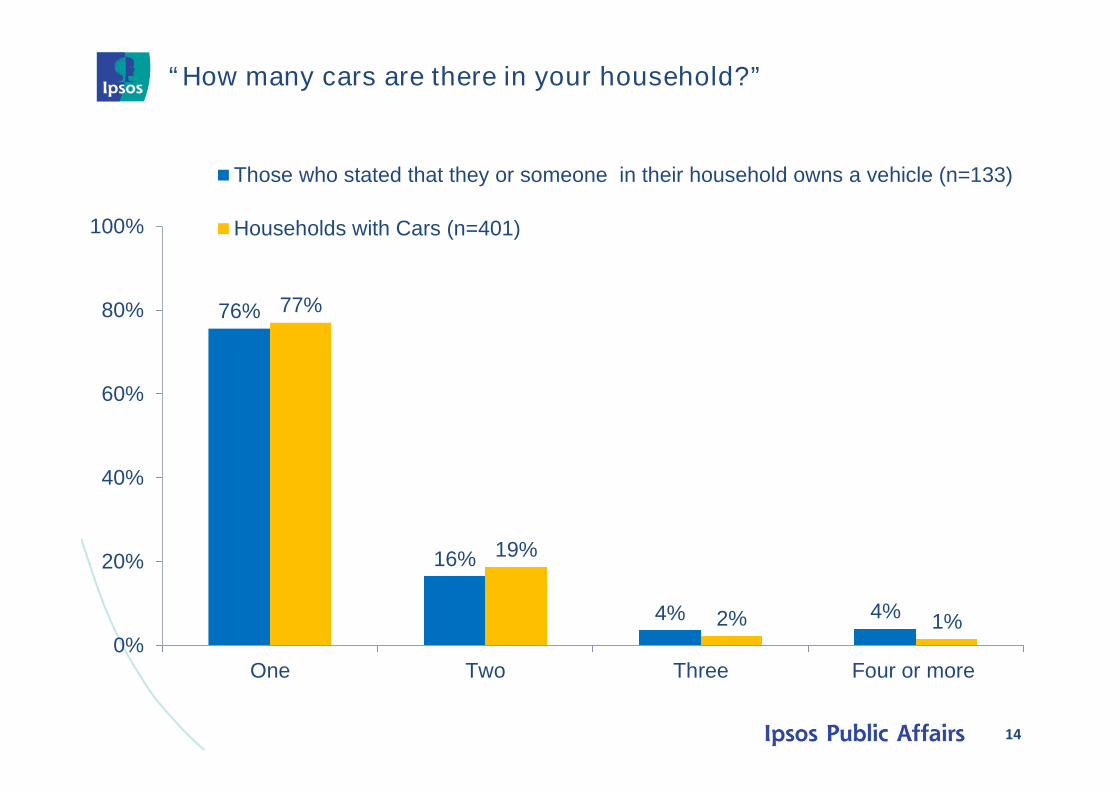
“How many cars are there in your household?”
76%
16%
4% 4%
77%
19%
2% 1%0%
20%
40%
60%
80%
100%
One Two Three Four or more
Those who stated that they or someone in their household owns a vehicle (n=133)
Households with Cars (n=401)
14

“What is the car/are the cars mainly used for?”
75%
21%
4%
65%
27%
7%
0%
20%
40%
60%
80%
100%
For personal transport Both business and personaltransport
For doingbusiness/commercial purpose
Those who stated that they or someone in their household owns a vehicle (n=133)
Households with Cars (n=401)
15

16
Current Situation onTransportation in Nairobi City
County:
• Modes
• Destinations
• Time Spent Getting to Main Destination
• Loss of Business/Work Due to TransportChallenges
• Estimated Time Lost in Traffic
• Inaccessible Areas
• Crime Experiences In The Last One YearWhile Moving Around

“When you have to go somewhere, how often do you use…?”
17
71%
1%
20%
42%
7%
1%
16%
10%15%
25%
14%
2% 3%
13%
58%
36%
28%
51%
25%22%
1%
30% 28%
6%
27%
72% 74%
0%
20%
40%
60%
80%
100%
Matatu/Bus Taxi Private car Walking Motorcyclebodaboda
Train Bicycle
Daily/ Usually Once/Twice a week Rarely Never
Base: General Population (n=415)

“When you have to go somewhere, how often do you use…?”
18
37%
2%
63%
27%
1% 1%
37%
11%
29%23%
7%2% 2%
23%
66%
6%
40%
47%
23% 25%
2%
20%
2%6%
44%
75% 75%
0%
20%
40%
60%
80%
100%
Matatu/Bus Taxi Private car Walking Motorcyclebodaboda
Train Bicycle
Daily/ Usually Once/Twice a week Rarely Never
Base: Households with Cars (n=401)

“What’s your most common destination?”
90%
19% 17%12%
94%
21% 20%
8%
0%
20%
40%
60%
80%
100%
Work/Job Shopping Visitingfriends/relatives
Educationalinstitution
General Population (n=415) Households with Cars (n=401)
19
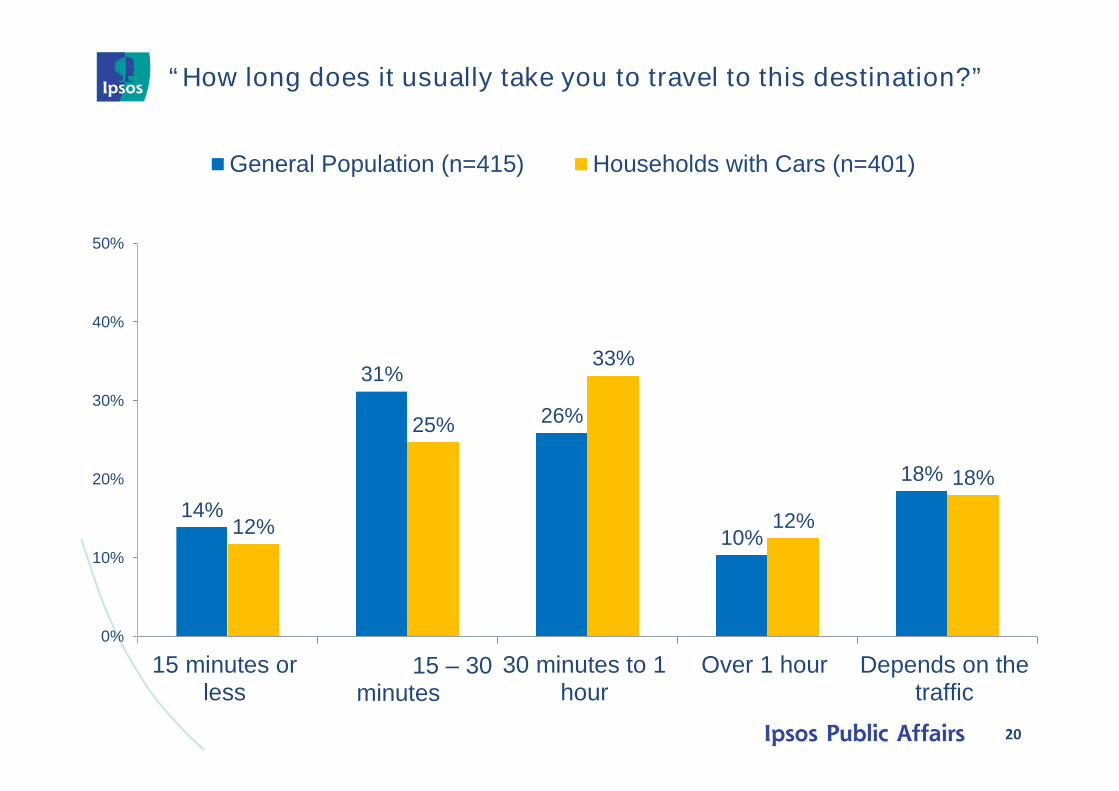
“How long does it usually take you to travel to this destination?”
20
14%
31%
26%
10%
18%
12%
25%
33%
12%
18%
0%
10%
20%
30%
40%
50%
15 minutes orless
15 – 30minutes
30 minutes to 1hour
Over 1 hour Depends on thetraffic
General Population (n=415) Households with Cars (n=401)

“How long does it usually take you to travel to this destination?”
21
14%
31%
26%
10%
18%
12%
25%
33%
12%
18%
0%
10%
20%
30%
40%
50%
15 minutes orless
15 – 30minutes
30 minutes to 1hour
Over 1 hour Depends on thetraffic
General Population (n=415) Households with Cars (n=401)

“How much time do you think you lose in traffic in a typical weekday?”
22
6% 2%
15% 14%
31%26%
48%
57%
0%
20%
40%
60%
80%
100%
General Population (n=415) Households with Cars (n=401)
Hardly any/None Up to half an hour (30 minutes)
About 30 minutes to 1 hour 1 hour or more
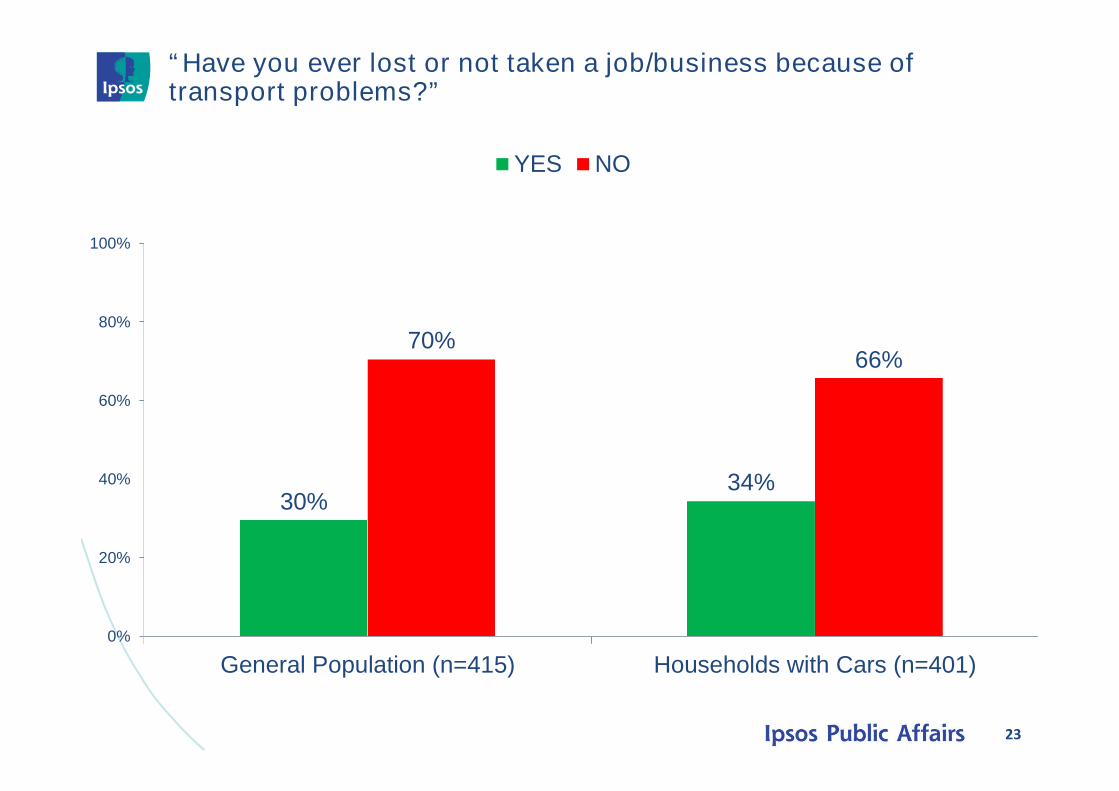
“Have you ever lost or not taken a job/business because oftransport problems?”
23
30%34%
70%66%
0%
20%
40%
60%
80%
100%
General Population (n=415) Households with Cars (n=401)
YES NO

“Are there any places you sometimes need to go to that you cannotdo so by using matatu or bus?”
24
12% 12%
82% 80%
6% 8%
0%
20%
40%
60%
80%
100%
General Population (n=415) Households with Cars (n=401)
YES NO Not sure
• Industrial area• Kirinyaga Road• Embakasi• Muthaiga• Parklands• Karen• Dennis Pritt Road

“In the last one year, have you been a victim of crime in the citywhile moving around?’
25
39% 36%
61% 64%
0%
20%
40%
60%
80%
100%
General Population (n=415) Households with Cars (n=401)
YES NO
49%
36%
20%
15%
7%
1%
27%
35%
42%
8%
5%
0% 10% 20% 30% 40% 50%
Inside a public transport vehicle
Walking from once place to another
Inside a personal vehicle
Waiting for a public transport vehicle at a bus stop
On the street talking to someone
Other
General Population (n=160) Households with Cars (n=143)
“What were you doing at the time this/ times these happened?
26
Attitudes Towards
Non- Motorized Transport
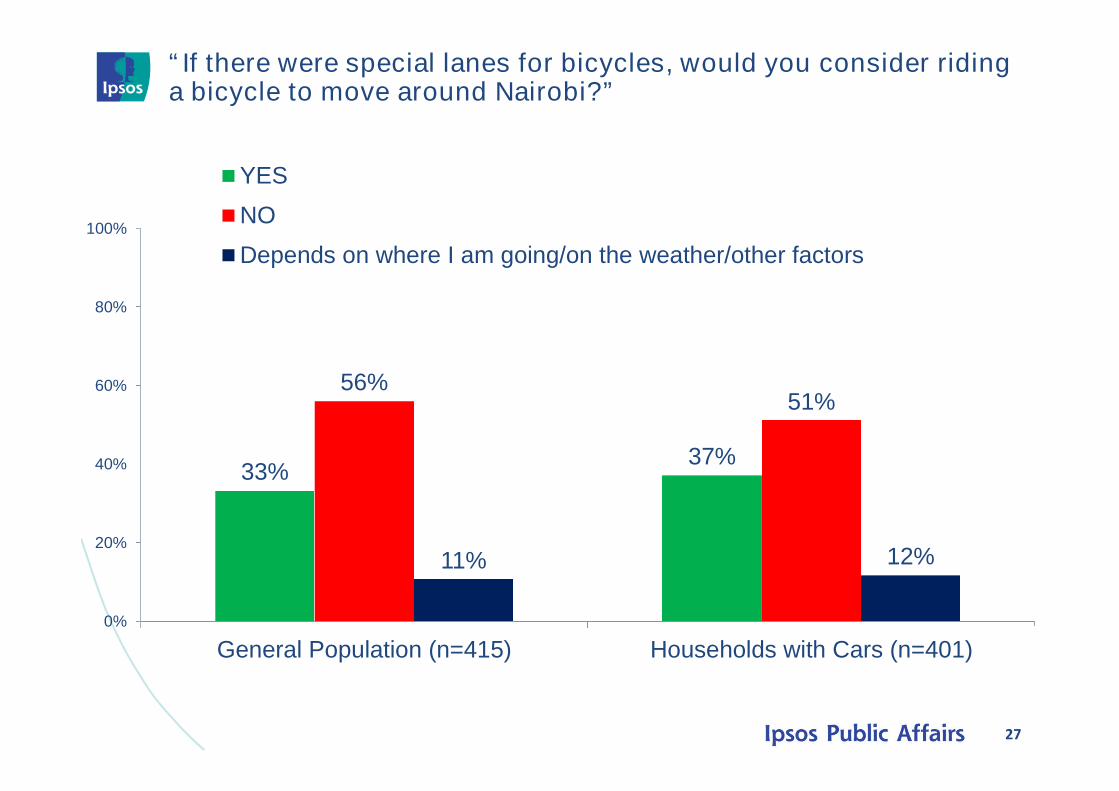
“If there were special lanes for bicycles, would you consider ridinga bicycle to move around Nairobi?”
27
33%37%
56%51%
11% 12%
0%
20%
40%
60%
80%
100%
General Population (n=415) Households with Cars (n=401)
YES
NO
Depends on where I am going/on the weather/other factors

“If there were special lanes for bicycles, would you consider ridinga bicycle to move around Nairobi?”
28
28%
40%
58%
50%
14% 11%
0%
20%
40%
60%
80%
100%
Car Owners (General Population); n=91 Car Owners (Households with Cars) ;n=322
YES
NO
Depends on where I am going/on the weather/other factors

“What can be done be done to make it easier for people to walk invarious places around the city?”
67%
64%
37%
25%
7%
1%
1%
1%
1%
1%
68%
59%
37%
30%
9%
0% 20% 40% 60% 80% 100%
Better side-walks
Better pedestrian cross walks/over/under-passes/foot bridges
Less crime
More park areas
Cleaner environment
Better roads i.e. expansion
Removal of private car within CBD
Improve on security i.e. more lighting,CCTV
No entrance PSV Vehicles in town
DK
General Population (n=415) Households with Cars (n=401)
29

“How would you like to travel around Nairobi if the following werenot an issue?”
15%
21%25%
22%
4% 2%
60%
47%44%
1%
16% 16%
2% 2%
8%
1%5%
2%5% 3%
0%
20%
40%
60%
80%
100%
Cost Time Safety
Matatu/Bus Taxi Private car
Walking Motor-cycle bodaboda Train
Bicycle
30Base: General Population (n=415)

“How would you like to travel around Nairobi if the following werenot an issue?”
14% 14% 13%13%
6%4%
67%
61%
56%
2%
11%
18%
1% 1%4%2%
4%2%1% 1% 4%
0%
20%
40%
60%
80%
100%
Cost Time Safety
Matatu/Bus Taxi
Private car Walking
Motor-cycle bodaboda Train
Bicycle
31Base: Households with Cars (n=401)

32
Children and SchoolTransport

“Are there any children living in the home/household who go toschool every day?”
33
43%
60%57%
40%
0%
20%
40%
60%
80%
100%
General Population (n=415) Households with Cars (n=401)
YES NO
One, 41%
Two, 40%Three, 16%
Four ormore, 3%
Base: Those who stated that there are childrenliving in the home/household who go to school
(n=178)
One, 35%
Two, 45%
Three , 15%
Four ormore, 5%
Base: Those who stated that there are childrenliving in the home/household who go to school
(n=240)

“How far is their school?”
34
67%
20%
3%
9%
35%
45%
15%
5%
0%
20%
40%
60%
80%
100%
Less than 2 Km 2-5 km 5-10 Km 11 -20 Km DK
General Population (n=178) Households with Cars (n=240)

“How do they usually get to and from school?”
35
57%
28%
12%7%
3%
25%
53%
11%
21%
1%0%
20%
40%
60%
80%
100%
Walk School bus Public transport(bus/matatu)
Private car Motorcycles
General Population (n=178) Households with Cars (n=240)

“Do you feel that your child’s trip to and from school is safe orunsafe?”
36
71%
19%10%
65%
27%
8%
0%
20%
40%
60%
80%
100%
Safe Somewhat safe Unsafe
General Population (n=178) Households with Cars (n=240)
38%
31%
17%
14%
25%
26%
21%
26%
1%
0% 50%
Road accidents byother vehicles
Crime (kidnapping,terrorism, robbery)
Traffic accident whilewalking
Poor driving of schoolbus
Child's health
General Population (n=51)
Private Car Owners (n=84)
“What is your biggest concern?”

37
Road Accidents:
Personal and FamilyInvolvement

“Have you ever been involved in a road accident?”
38
12%25%
88%75%
0%
20%
40%
60%
80%
100%
General Population (n=415) Private Car Owners (n=401)
YES NO
“What did it or the most recent one involve if more than one?”
55%
47%
11%
11%
4%
1%
61%
39%
5%
10%
1%
0% 20% 40% 60% 80% 100%
Personal car
Matatu
Truck
Motor-bike
Pedestrians
Knocked a wall
General Population (n=52)
Private Car Owners (n=99)

“Have any of your family members ever been involved been in aroad accident?”
39
11%21%
89%79%
0%
20%
40%
60%
80%
100%
General Population (n=415) Households with Cars (n=401)
YES NO
“Was anyone of them seriously injured or killed?”
63%
24%
17%
6%
6%
60%
21%
20%
7%
0% 20% 40% 60% 80% 100%
Someone was seriously injured
No one killed/injured
Someone was killed
Someone was slightlyinjured(minor)
Other
General Population (n=47)
40
Future Considerations onTransportation in Nairobi
City County:
Information Sources, Opinion onFlexible Working Hours, Lower
Speed Limits and Information Gaps

“When you need to go somewhere in Nairobi that you haven’t beento before, how do you get information about the best way to getthere?”
71%
41%
33%
23%
11%
2%
2%
1%
56%
62%
25%
18%
17%
2%
4%
2%
1%
1%
0% 20% 40% 60% 80% 100%
Friends
Google maps
Family members
Ask the conductor/driver
Internet
Ask a security guard
Use a phone app
Ask anybody
Use taxi/ask taxi driver
Use road signs
General Population (n=415) Households with Cars (n=401)
41

“Do you support ….?”
91%
68%
97%
7%
31%
2%2%0%
20%
40%
60%
80%
100%
Flexiblework/business
hours?
Lower speedlimits in the
city?
Lower speedlimits around
schools?
YES NO No opinion
42
95%
70%
98%
4%
29%
1%1% 1%0%
20%
40%
60%
80%
100%
Flexiblework/business
hours?
Lower speedlimits in the
city?
Lower speedlimits around
schools?
YES NO No opinion
Base: Households with Cars (n=401)Base: General Population (n=415)

“What kind of information about transport should the governmentprovide to the public in Nairobi?”
43
51%
50%
40%
37%
18%
10%
0%
1%
54%
44%
41%
49%
8%
8%
1%
1%
0% 20% 40% 60% 80% 100%
Road changes/repair
Current traffic conditions
New projects
Traffic control measures/technology
Public transport maps
Expenditure
Updates about fare
Road safety compaign
DK
General Population (n=415) Households with Cars (n=401)

44
Air Quality in Nairobi CityCounty

“What is your opinion of the air in Nairobi?”
45
15%
3%
26%
43%
12%
1%
14%
3%
32%
42%
9%
0% 20% 40% 60% 80% 100%
It is good
It is very good
It is bad
It is very bad
It is in between (neither bad nor good)
Not sure
General Population (n=415) Households with Cars (n=401)
“Do you think it (the air) affects your health?”
93% 93%
1% 1%6% 6%0%
20%
40%
60%
80%
100%
General Population (n=288) Households with Cars (n=294)
YES NO Not sure
46
Nairobi National Park

“Have you ever visited Nairobi National Park?”
47
60%
75%
40%
25%
0%
20%
40%
60%
80%
100%
General Population (n=415) Households with Cars (n=401)
YES NO

“Have you ever visited Nairobi National Park?”
48
86%
78%
14%
22%
0%
20%
40%
60%
80%
100%
Car Owners (General Population); n=91 Car Owners (Households with Cars) ;n=322
YES NO

For further information contact:Dr. Jackie KloppAssociate Research ScholarCenter for Sustainable Urban DevelopmentEarth Institute, Columbia University+254 705 788 [email protected]
Victor RatengProject Manager - Opinion [email protected]
Follow us on twitter: @IpsosKe
49