MIS209 INTRODUCTION TO MANAGEMENT...
21
MIS209 INTRODUCTION TO MANAGEMENT SCIENCE Introduction to Management Science - Modeling H. Kemal İlter, B.Eng., M.B.A., Ph.D. Assoc. Prof. of Operations Management @hkilter D-314, Business School Yildirim Beyazit University http://j.mp/QQ209 [email protected] Ankara Fall 2015
-
Upload
truongkhuong -
Category
Documents
-
view
221 -
download
2
Transcript of MIS209 INTRODUCTION TO MANAGEMENT...
MIS209 INTRODUCTION TO MANAGEMENT SCIENCEIntroduction to Management Science - Modeling
H. Kemal İlter, B.Eng., M.B.A., Ph.D.Assoc. Prof. of Operations Management
@hkilter
D-314, Business SchoolYildirim Beyazit University
http://j.mp/QQ209
AnkaraFall 2015
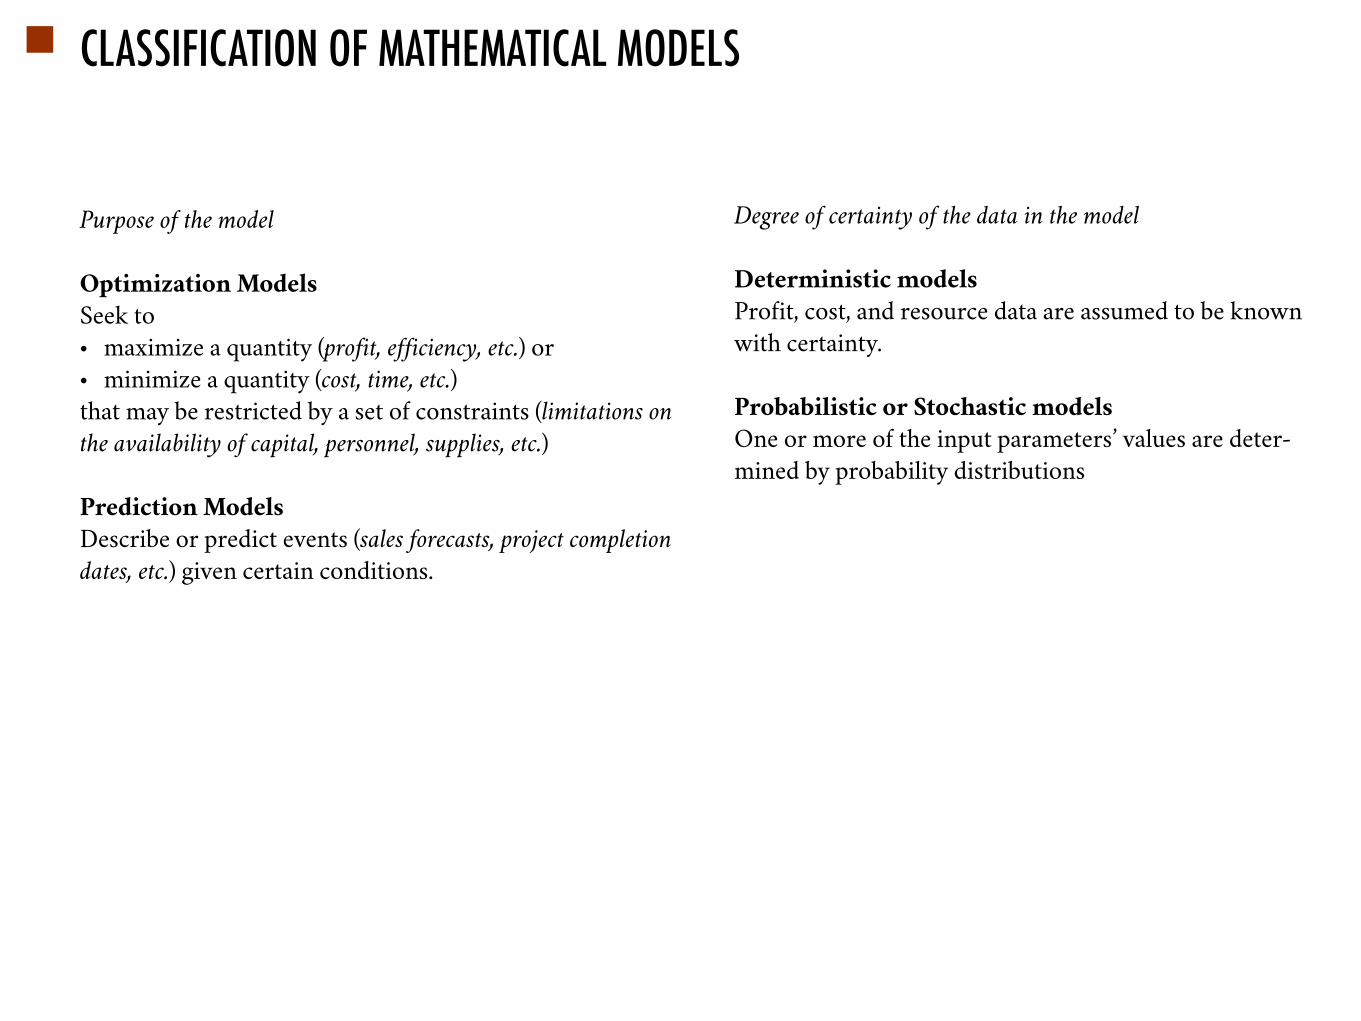
CLASSIFICATION OF MATHEMATICAL MODELS
Purpose of the model
Optimization Models Seek to • maximize a quantity (profit, efficiency, etc.) or • minimize a quantity (cost, time, etc.) that may be restricted by a set of constraints (limitations on the availability of capital, personnel, supplies, etc.)
Prediction Models
Describe or predict events (sales forecasts, project completion dates, etc.) given certain conditions.
Degree of certainty of the data in the model
Deterministic models
Profit, cost, and resource data are assumed to be known with certainty.
Probabilistic or Stochastic models
One or more of the input parameters’ values are deter-mined by probability distributions
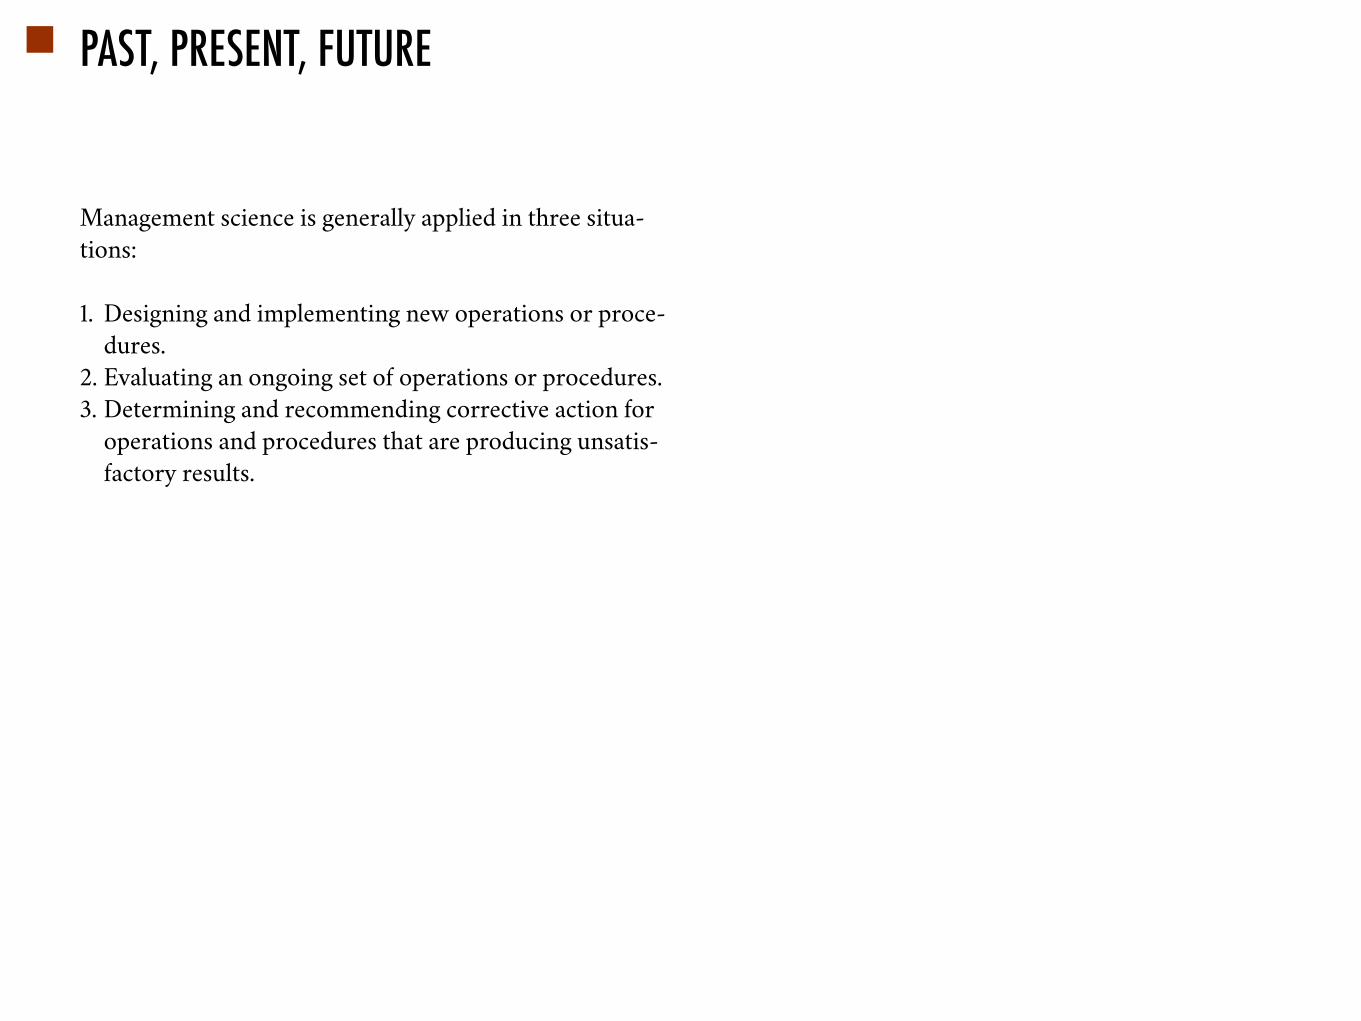
Management science is generally applied in three situa-tions:
1. Designing and implementing new operations or proce-dures.
2. Evaluating an ongoing set of operations or procedures.3. Determining and recommending corrective action for
operations and procedures that are producing unsatis-factory results.
PAST, PRESENT, FUTURE
MANAGEMENT SCIENCE PROCESS
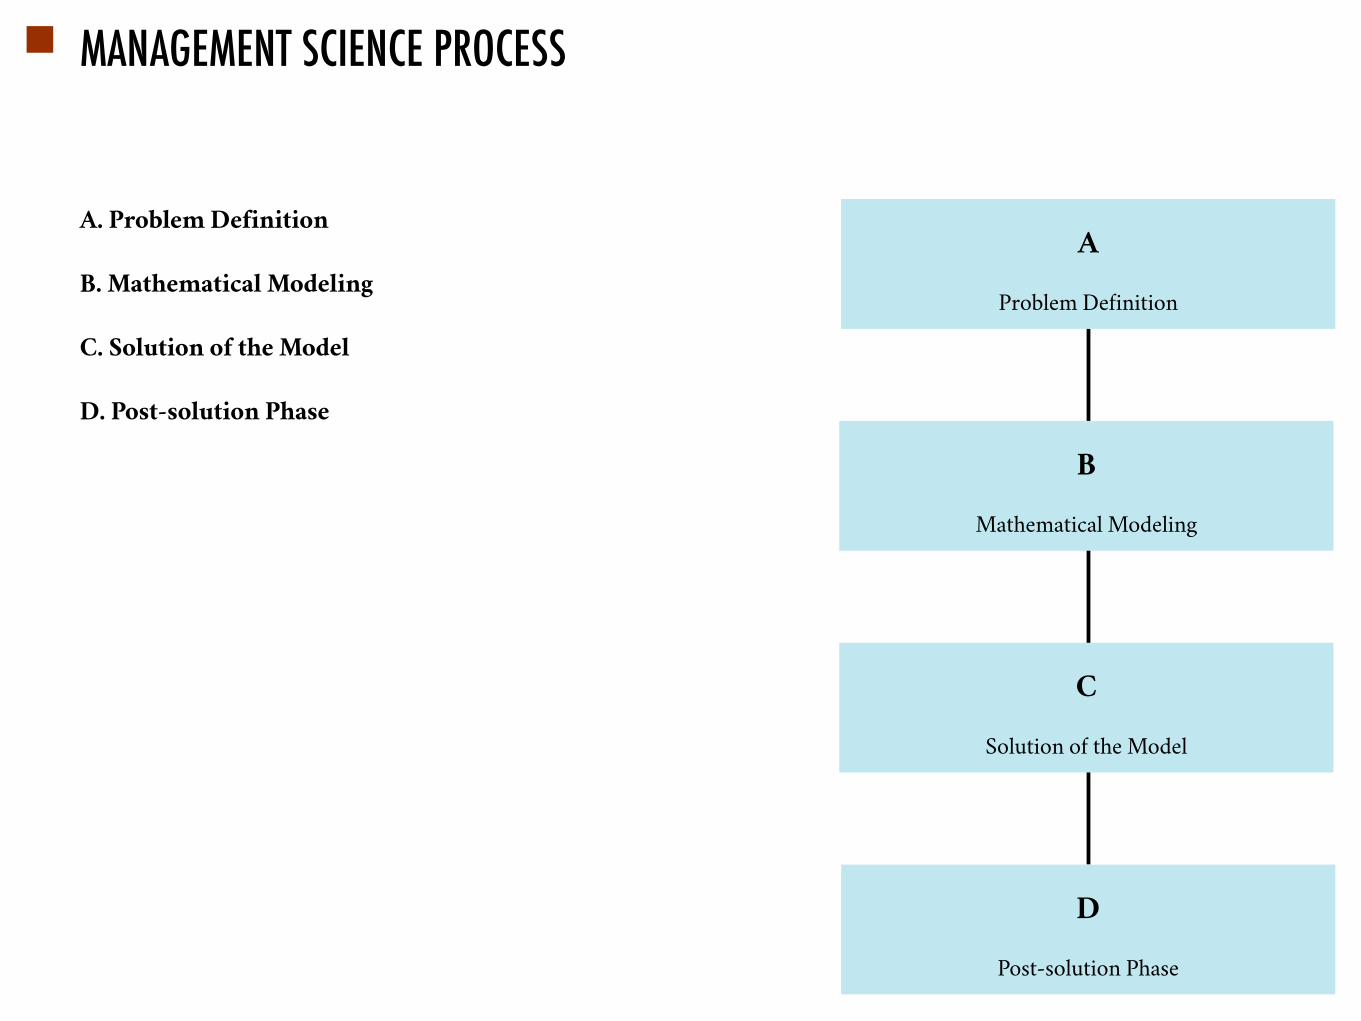
A. Problem Definition
B. Mathematical Modeling
C. Solution of the Model
D. Post-solution Phase
A
Problem Definition
B
Mathematical Modeling
C
Solution of the Model
D
Post-solution Phase
MANAGEMENT SCIENCE PROCESS
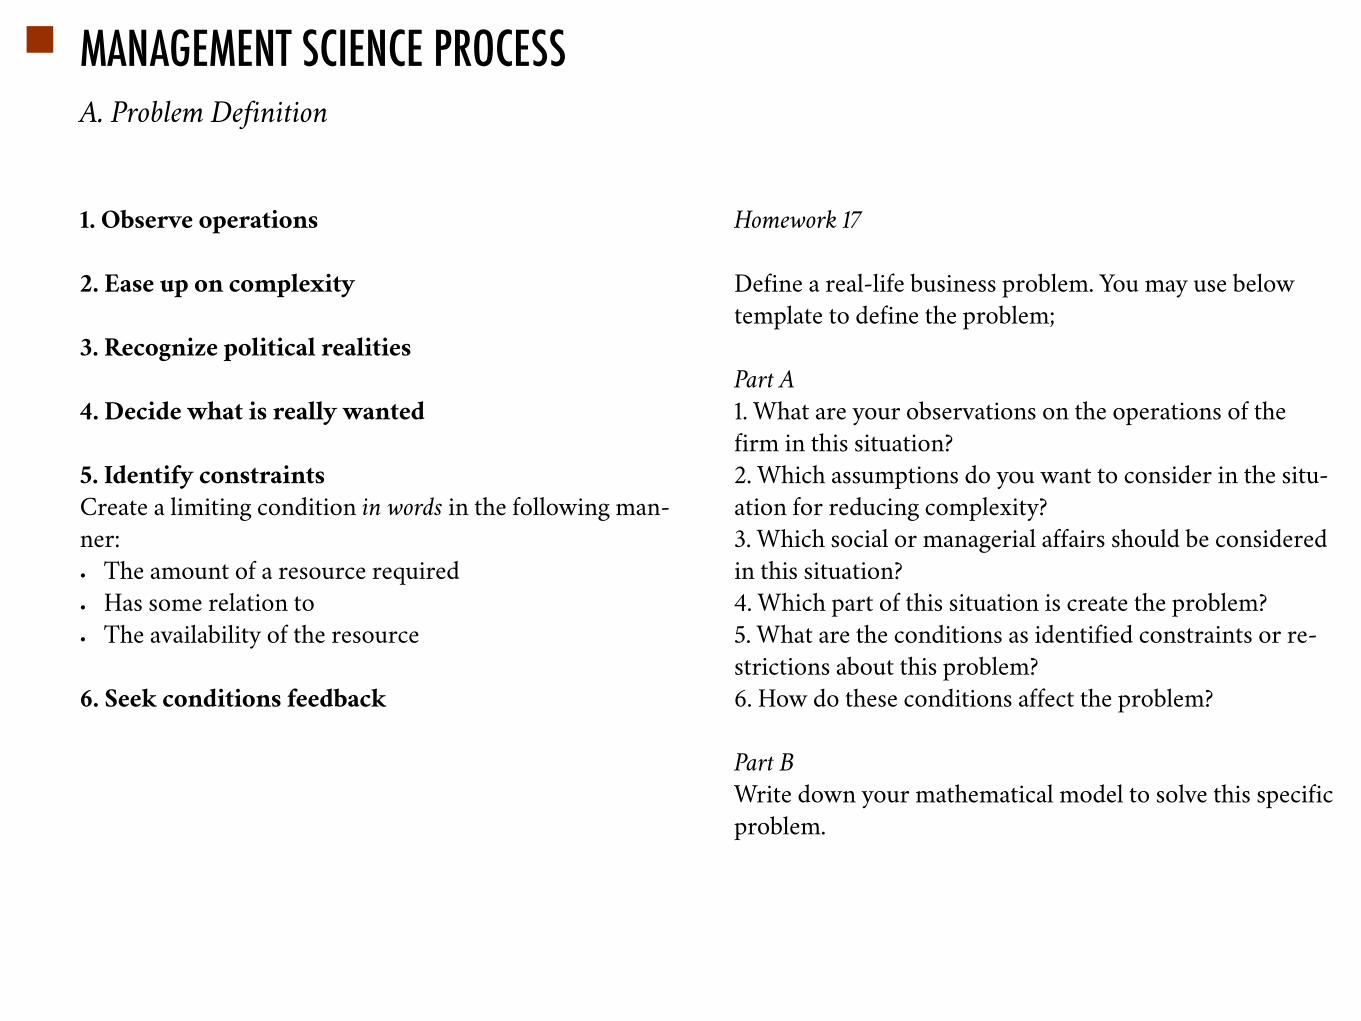
1. Observe operations
2. Ease up on complexity
3. Recognize political realities
4. Decide what is really wanted
5. Identify constraints
Create a limiting condition in words in the following man-ner:• The amount of a resource required• Has some relation to• The availability of the resource
6. Seek conditions feedback
A. Problem Definition
Homework 17
Define a real-life business problem. You may use below template to define the problem;
Part A1. What are your observations on the operations of the firm in this situation?2. Which assumptions do you want to consider in the situ-ation for reducing complexity?3. Which social or managerial affairs should be considered in this situation?4. Which part of this situation is create the problem?5. What are the conditions as identified constraints or re-strictions about this problem?6. How do these conditions affect the problem?
Part BWrite down your mathematical model to solve this specific problem.
MANAGEMENT SCIENCE PROCESS
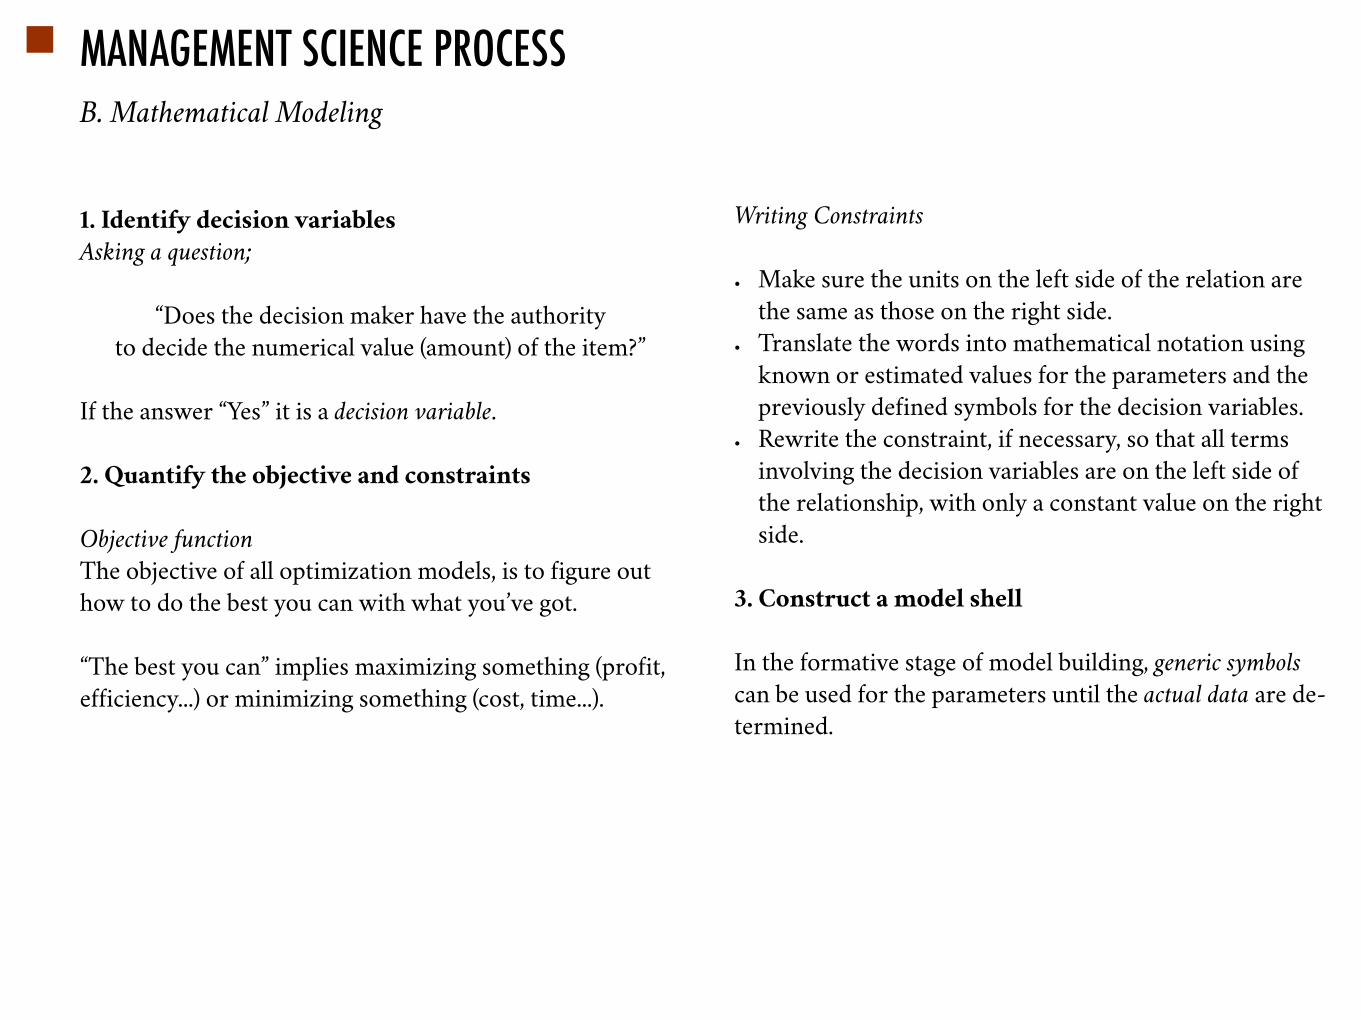
1. Identify decision variables
Asking a question;
“Does the decision maker have the authority to decide the numerical value (amount) of the item?”
If the answer “Yes” it is a decision variable.
2. Quantify the objective and constraints
Objective functionThe objective of all optimization models, is to figure out how to do the best you can with what you’ve got.
“The best you can” implies maximizing something (profit, efficiency...) or minimizing something (cost, time...).
B. Mathematical Modeling
Writing Constraints
• Make sure the units on the left side of the relation are the same as those on the right side.
• Translate the words into mathematical notation using known or estimated values for the parameters and the previously defined symbols for the decision variables.
• Rewrite the constraint, if necessary, so that all terms involving the decision variables are on the left side of the relationship, with only a constant value on the right side.
3. Construct a model shell
In the formative stage of model building, generic symbols can be used for the parameters until the actual data are de-termined.
MANAGEMENT SCIENCE PROCESS
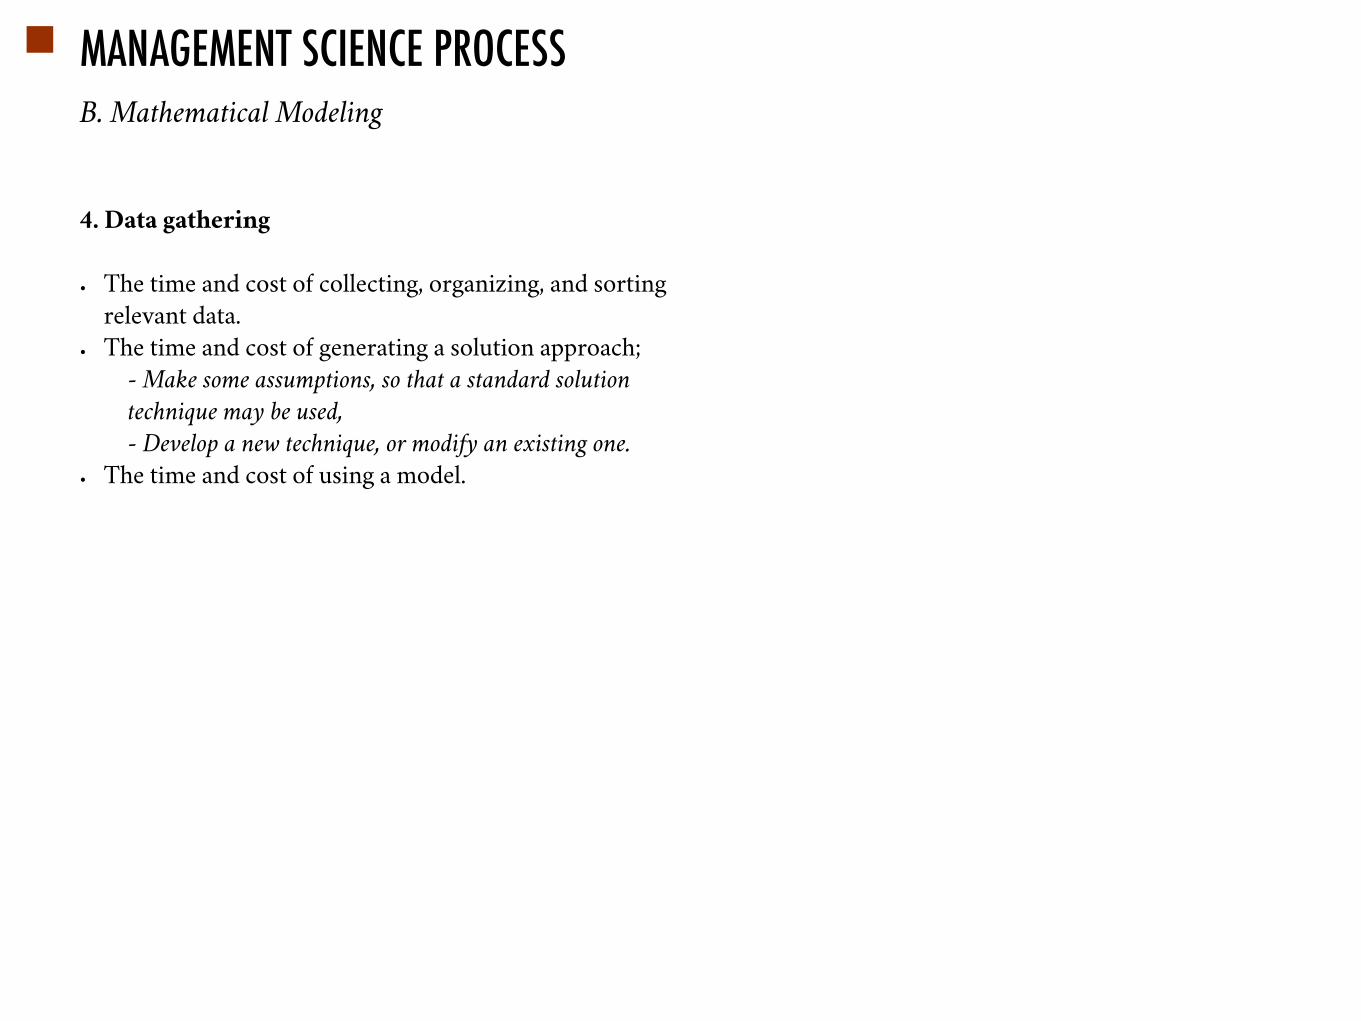
4. Data gathering
• The time and cost of collecting, organizing, and sorting relevant data.
• The time and cost of generating a solution approach;- Make some assumptions, so that a standard solution technique may be used,- Develop a new technique, or modify an existing one.
• The time and cost of using a model.
B. Mathematical Modeling
1. Choose an appropriate solution technique
2. Generate model solutions
3. Test/validate model results
4. Return to modelling step if results are unacceptable
5. Perform “what-if” analyses
MANAGEMENT SCIENCE PROCESSC. Solution of the Model
1. Prepare a business report or presentation
2. Monitor the progress of the implementation
MANAGEMENT SCIENCE PROCESSD. Post-Solution Phase
AN EXAMPLE
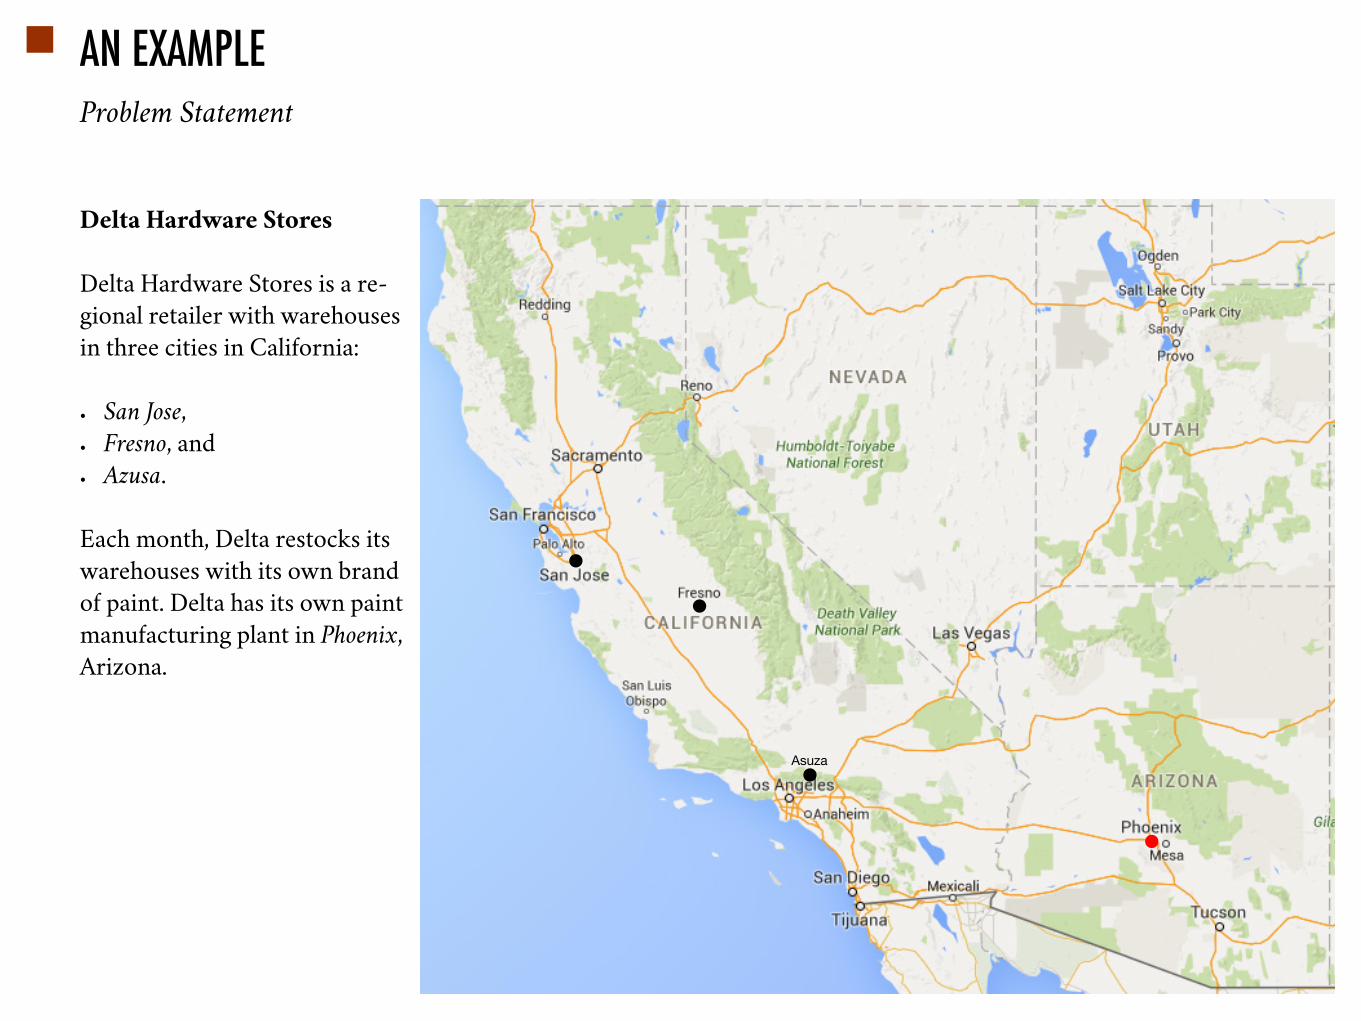
Delta Hardware Stores
Delta Hardware Stores is a re-gional retailer with warehouses in three cities in California:
• San Jose,• Fresno, and• Azusa.
Each month, Delta restocks its warehouses with its own brand of paint. Delta has its own paint manufacturing plant in Phoenix, Arizona.
Problem Statement
Asuza
AN EXAMPLE
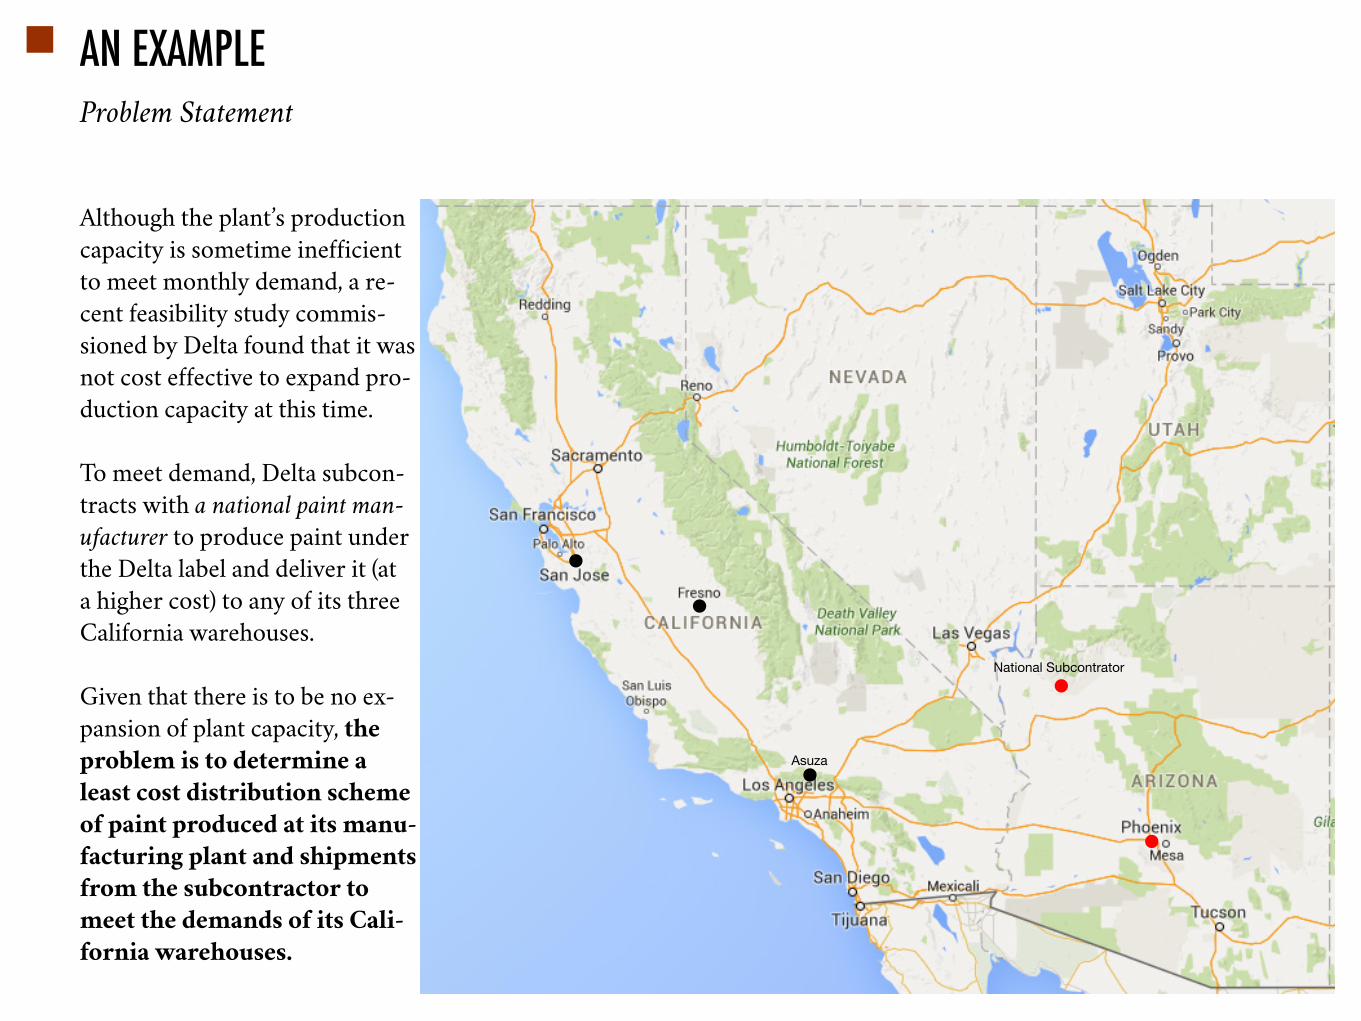
Although the plant’s production capacity is sometime inefficient to meet monthly demand, a re-cent feasibility study commis-sioned by Delta found that it was not cost effective to expand pro-duction capacity at this time.
To meet demand, Delta subcon-tracts with a national paint man-ufacturer to produce paint under the Delta label and deliver it (at a higher cost) to any of its three California warehouses.
Given that there is to be no ex-pansion of plant capacity, the
problem is to determine a
least cost distribution scheme
of paint produced at its manu-
facturing plant and shipments
from the subcontractor to
meet the demands of its Cali-
fornia warehouses.
Problem Statement
Asuza
National Subcontrator
AN EXAMPLE
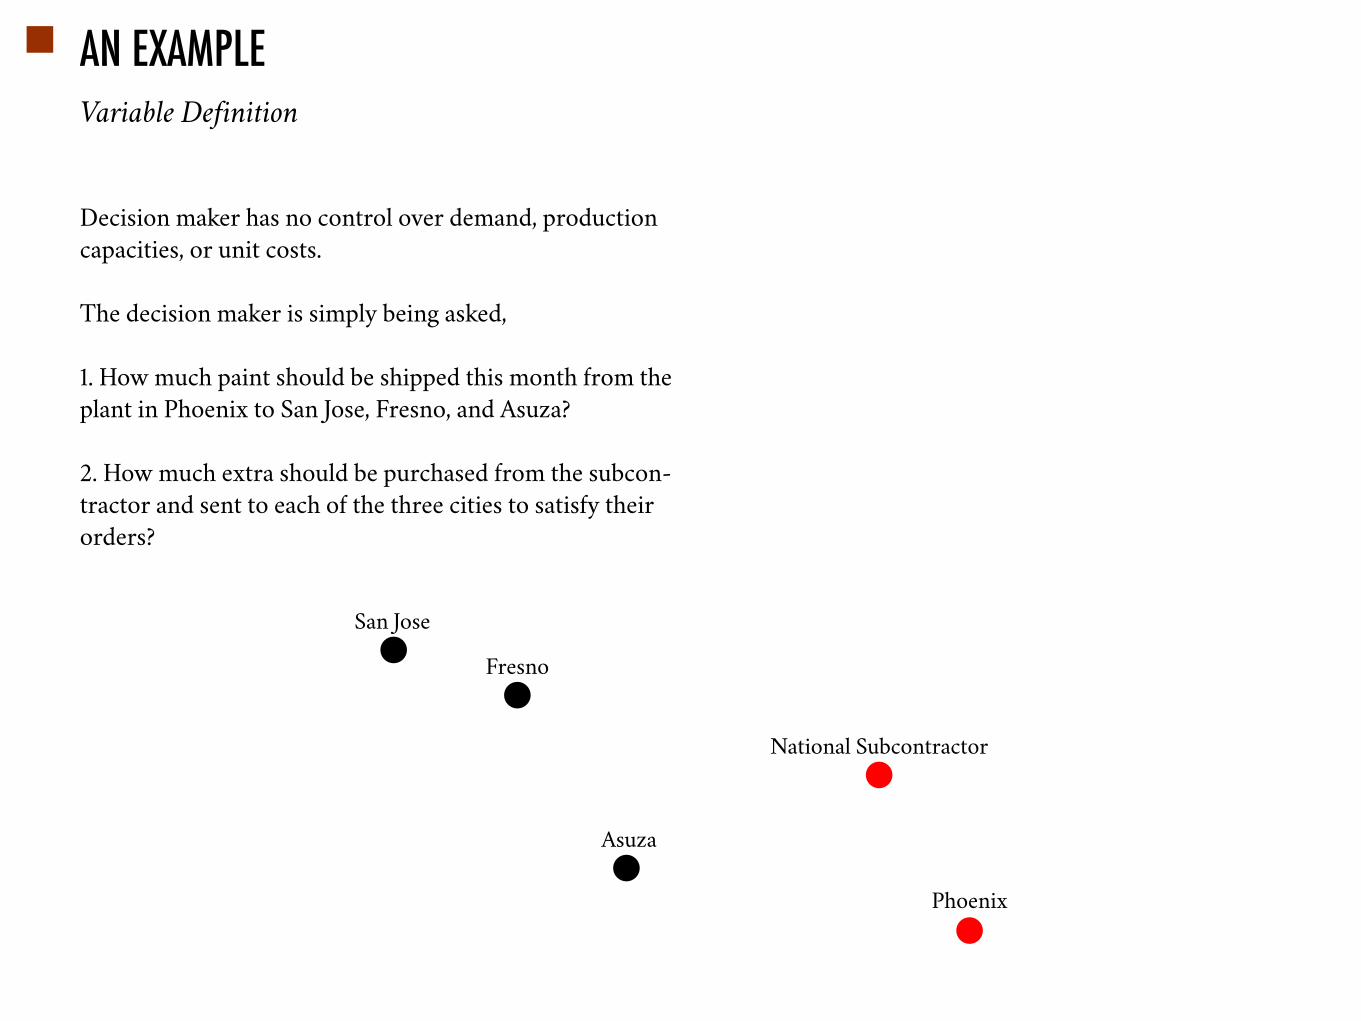
Decision maker has no control over demand, production capacities, or unit costs.
The decision maker is simply being asked,
1. How much paint should be shipped this month from the plant in Phoenix to San Jose, Fresno, and Asuza?
2. How much extra should be purchased from the subcon-tractor and sent to each of the three cities to satisfy their orders?
Variable Definition
National Subcontractor
Phoenix
San Jose
Fresno
Asuza
AN EXAMPLE
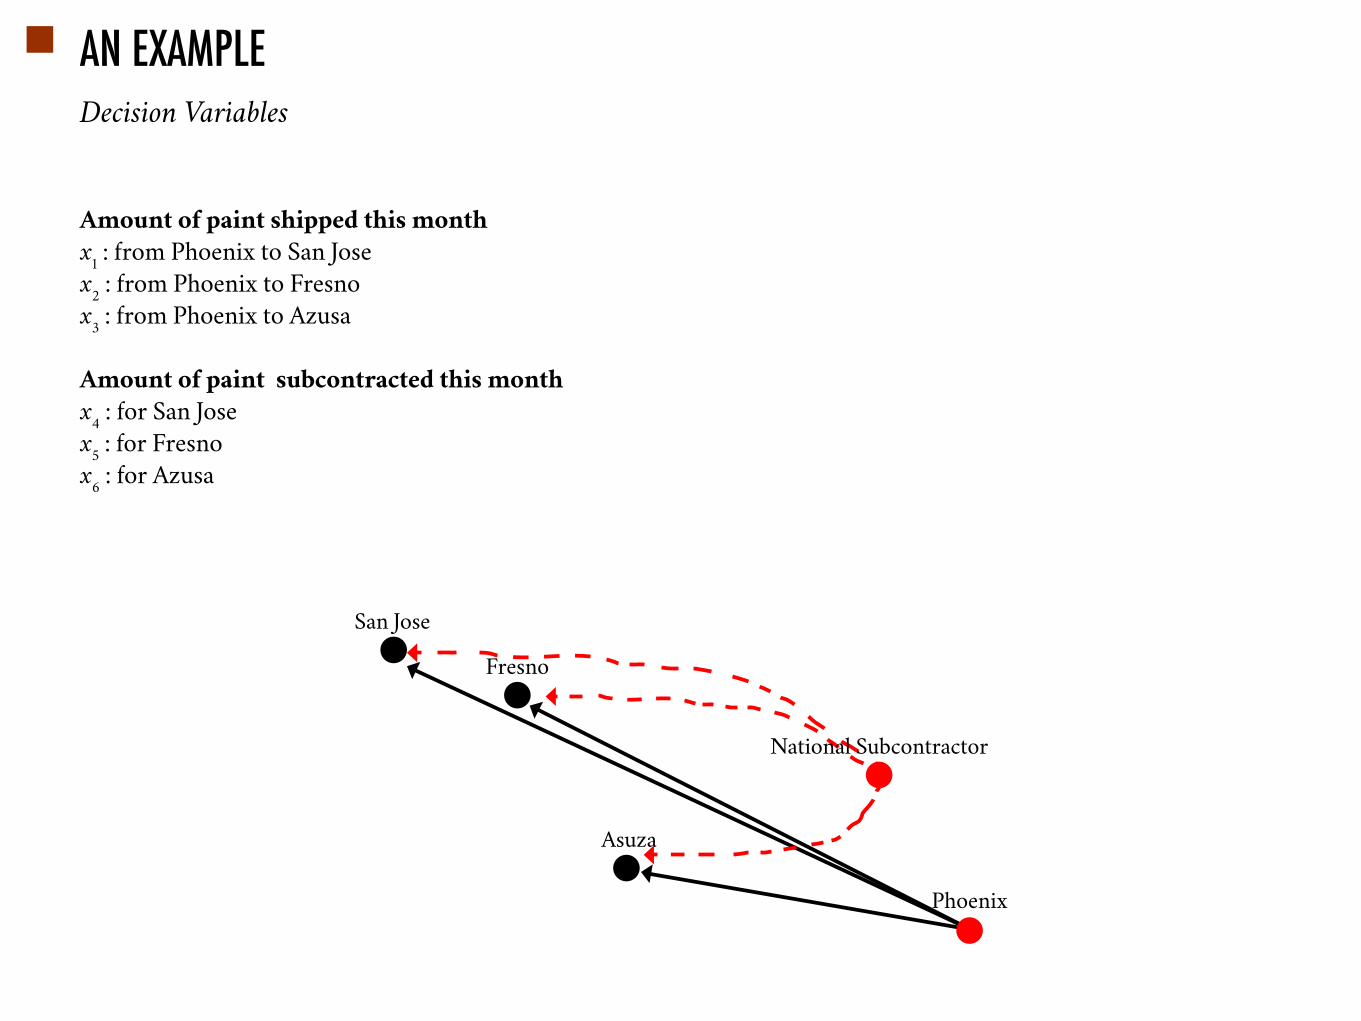
Amount of paint shipped this month
x1 : from Phoenix to San Josex2 : from Phoenix to Fresnox3 : from Phoenix to Azusa
Amount of paint subcontracted this month
x4 : for San Josex5 : for Fresnox6 : for Azusa
Decision Variables
National Subcontractor
Phoenix
San Jose
Fresno
Asuza
AN EXAMPLE
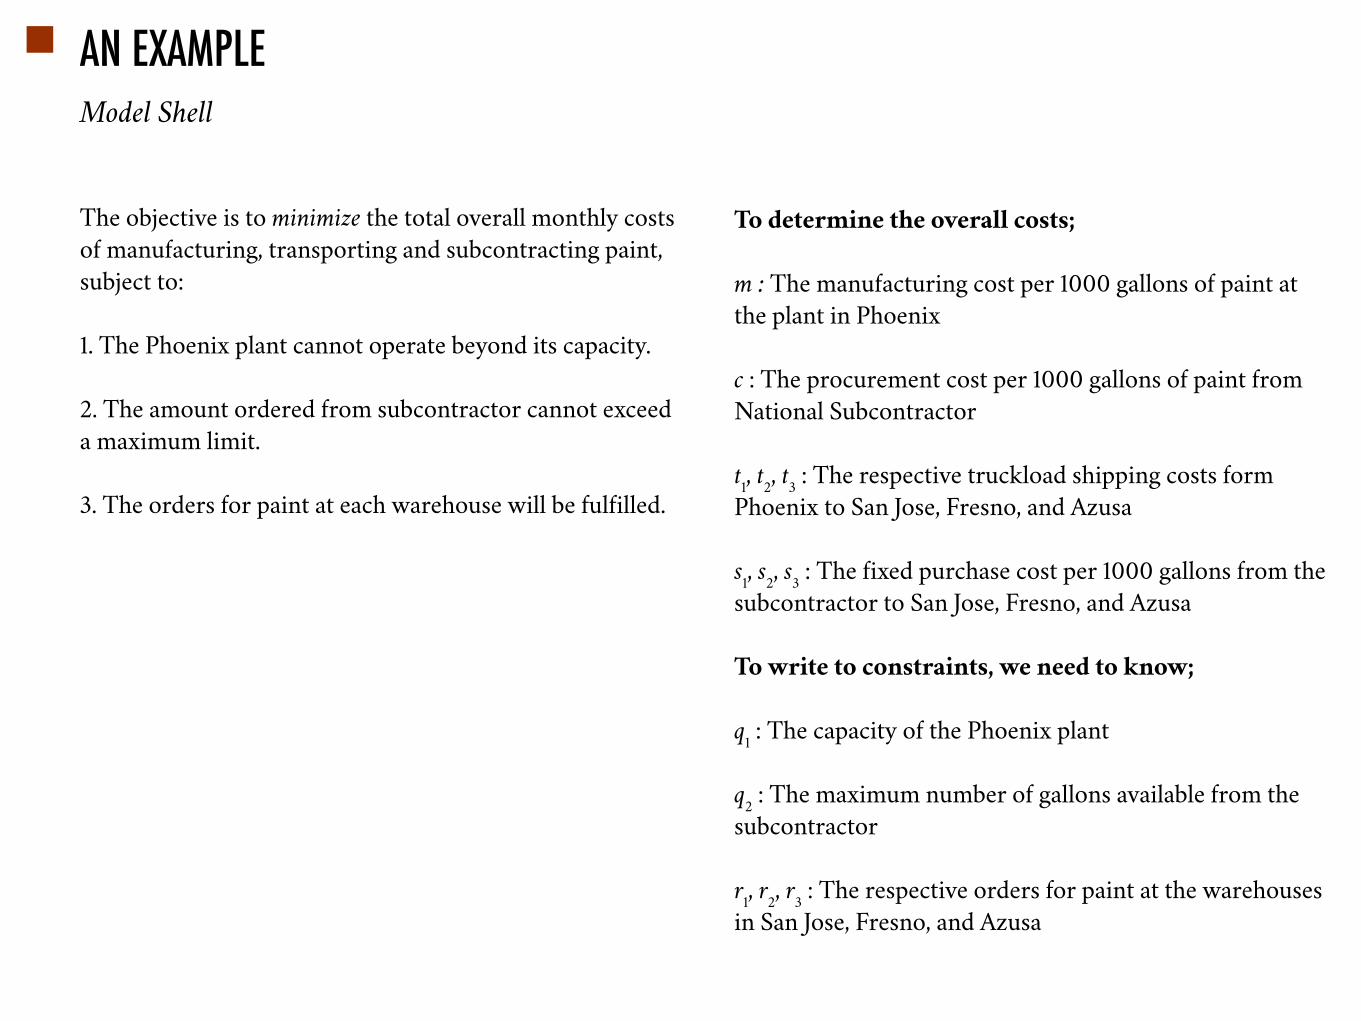
The objective is to minimize the total overall monthly costs of manufacturing, transporting and subcontracting paint, subject to:
1. The Phoenix plant cannot operate beyond its capacity.
2. The amount ordered from subcontractor cannot exceed a maximum limit.
3. The orders for paint at each warehouse will be fulfilled.
To determine the overall costs;
m : The manufacturing cost per 1000 gallons of paint at the plant in Phoenix
c : The procurement cost per 1000 gallons of paint from National Subcontractor
t1, t2, t3 : The respective truckload shipping costs form Phoenix to San Jose, Fresno, and Azusa
s1, s2, s3 : The fixed purchase cost per 1000 gallons from the subcontractor to San Jose, Fresno, and Azusa
To write to constraints, we need to know;
q1 : The capacity of the Phoenix plant
q2 : The maximum number of gallons available from the subcontractor
r1, r2, r3 : The respective orders for paint at the warehouses in San Jose, Fresno, and Azusa
Model Shell
AN EXAMPLE
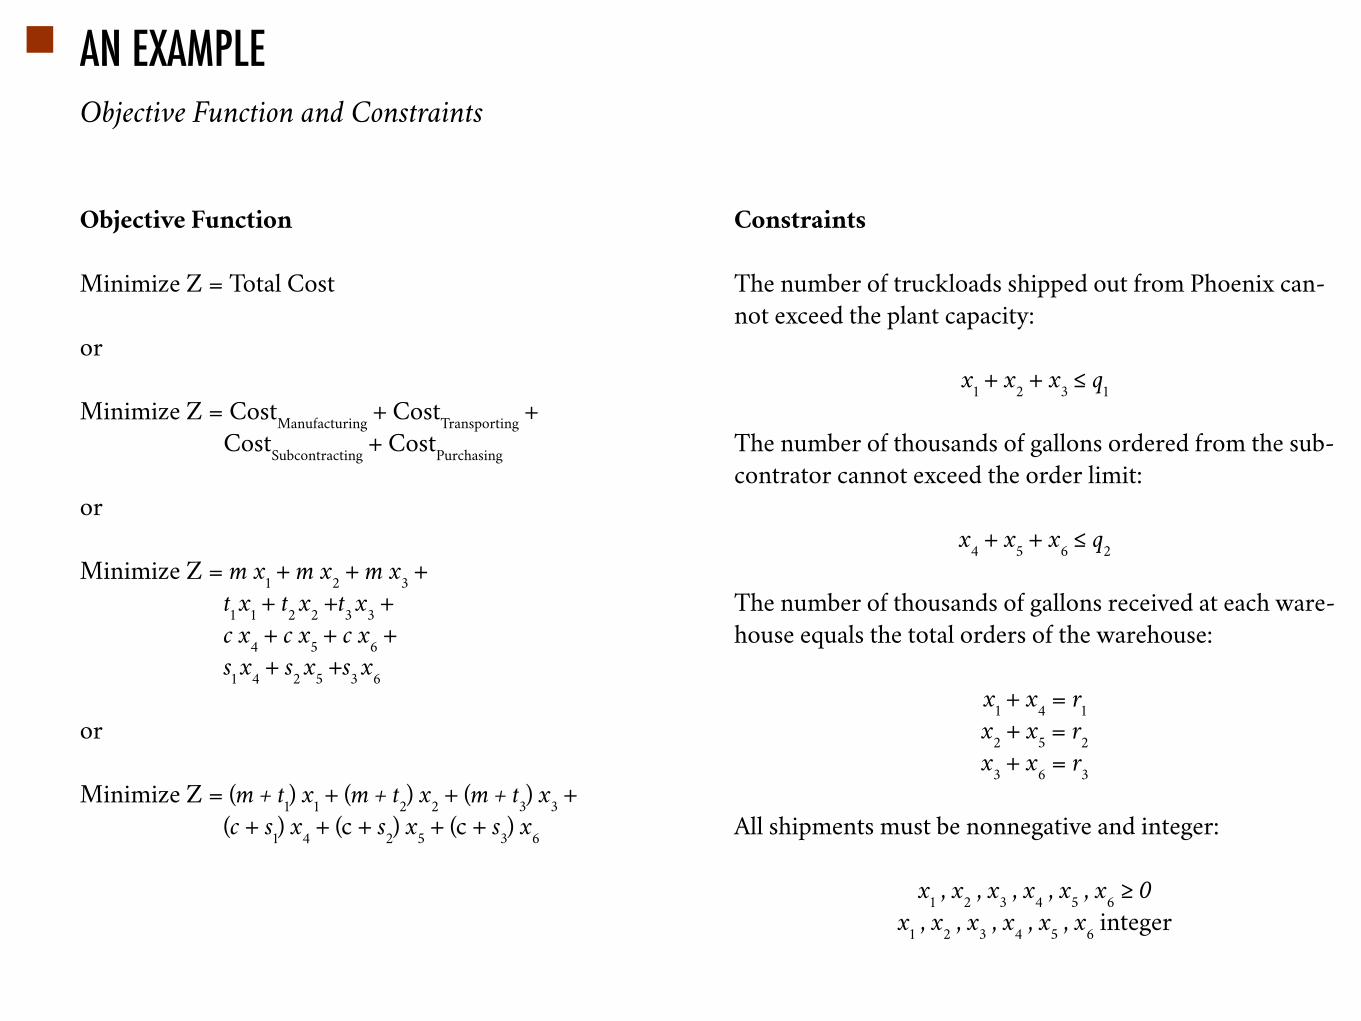
Objective Function
Minimize Z = Total Cost
or
Minimize Z = CostManufacturing + CostTransporting + CostSubcontracting + CostPurchasing
or
Minimize Z = m x1 + m x2 + m x3 + t1 x1 + t2 x2 +t3 x3 + c x4 + c x5 + c x6 + s1 x4 + s2 x5 +s3 x6
or
Minimize Z = (m + t1) x1 + (m + t2) x2 + (m + t3) x3 + (c + s1) x4 + (c + s2) x5 + (c + s3) x6
Objective Function and Constraints
Constraints
The number of truckloads shipped out from Phoenix can-not exceed the plant capacity:
x1 + x2 + x3 ≤ q1
The number of thousands of gallons ordered from the sub-contrator cannot exceed the order limit:
x4 + x5 + x6 ≤ q2
The number of thousands of gallons received at each ware-house equals the total orders of the warehouse:
x1 + x4 = r1x2 + x5 = r2x3 + x6 = r3
All shipments must be nonnegative and integer:
x1 , x2 , x3 , x4 , x5 , x6 ≥ 0x1 , x2 , x3 , x4 , x5 , x6 integer
AN EXAMPLE
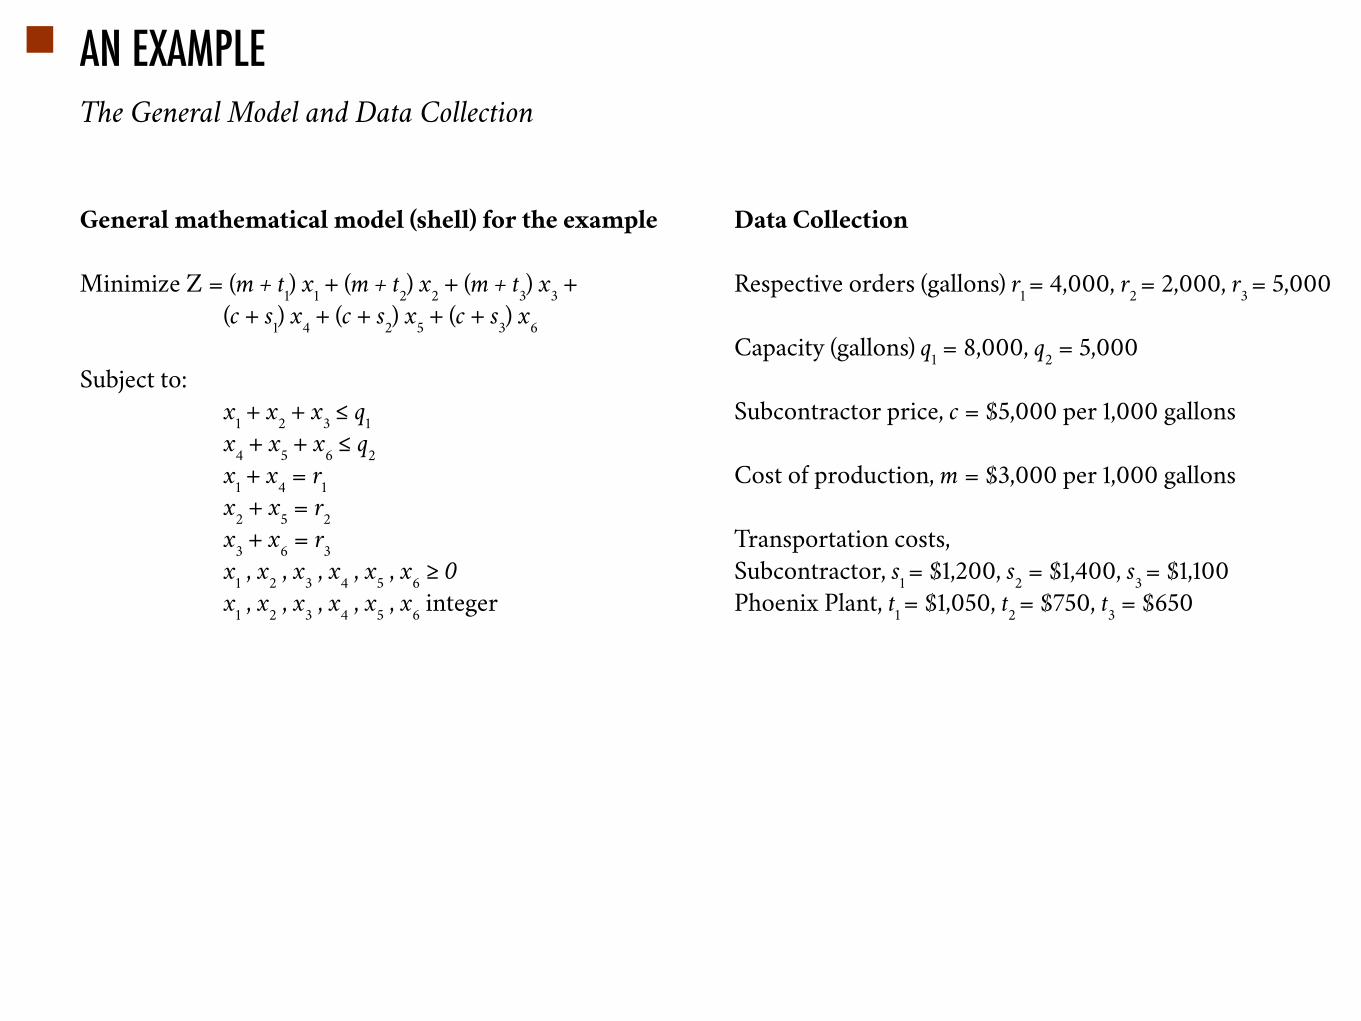
General mathematical model (shell) for the example
Minimize Z = (m + t1) x1 + (m + t2) x2 + (m + t3) x3 + (c + s1) x4 + (c + s2) x5 + (c + s3) x6
Subject to: x1 + x2 + x3 ≤ q1 x4 + x5 + x6 ≤ q2 x1 + x4 = r1 x2 + x5 = r2 x3 + x6 = r3 x1 , x2 , x3 , x4 , x5 , x6 ≥ 0 x1 , x2 , x3 , x4 , x5 , x6 integer
Data Collection
Respective orders (gallons) r1 = 4,000, r2 = 2,000, r3 = 5,000
Capacity (gallons) q1 = 8,000, q2 = 5,000
Subcontractor price, c = $5,000 per 1,000 gallons
Cost of production, m = $3,000 per 1,000 gallons
Transportation costs,Subcontractor, s1 = $1,200, s2 = $1,400, s3 = $1,100Phoenix Plant, t1 = $1,050, t2 = $750, t3 = $650
The General Model and Data Collection
AN EXAMPLE
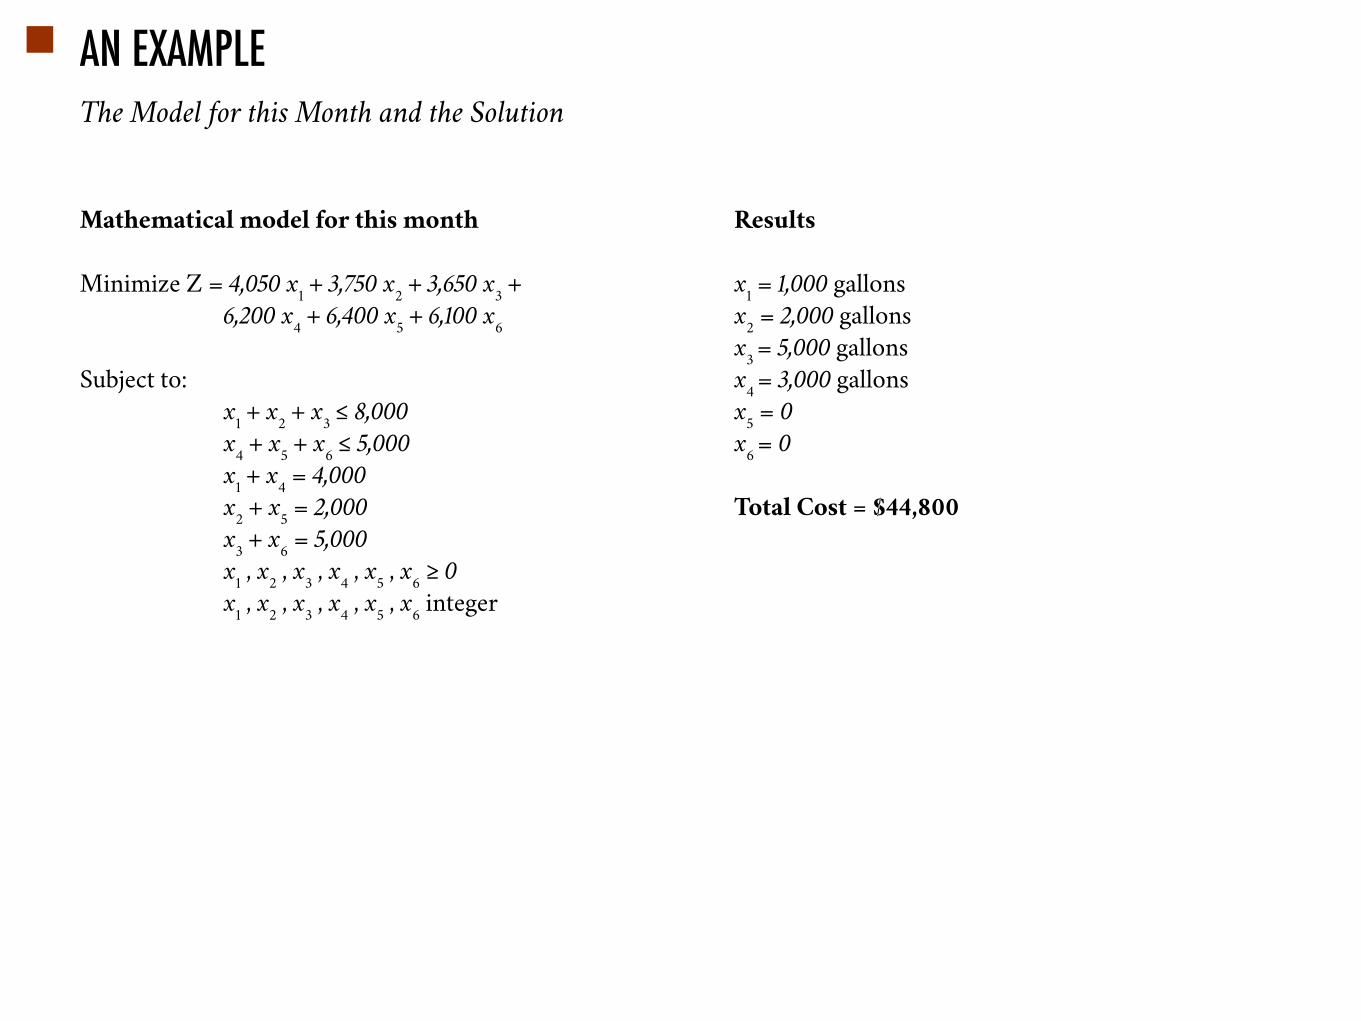
Mathematical model for this month
Minimize Z = 4,050 x1 + 3,750 x2 + 3,650 x3 + 6,200 x4 + 6,400 x5 + 6,100 x6
Subject to: x1 + x2 + x3 ≤ 8,000 x4 + x5 + x6 ≤ 5,000 x1 + x4 = 4,000 x2 + x5 = 2,000 x3 + x6 = 5,000 x1 , x2 , x3 , x4 , x5 , x6 ≥ 0 x1 , x2 , x3 , x4 , x5 , x6 integer
Results
x1 = 1,000 gallonsx2 = 2,000 gallonsx3 = 5,000 gallonsx4 = 3,000 gallonsx5 = 0x6 = 0
Total Cost = $44,800
The Model for this Month and the Solution
BREAK-EVEN ANALYSIS
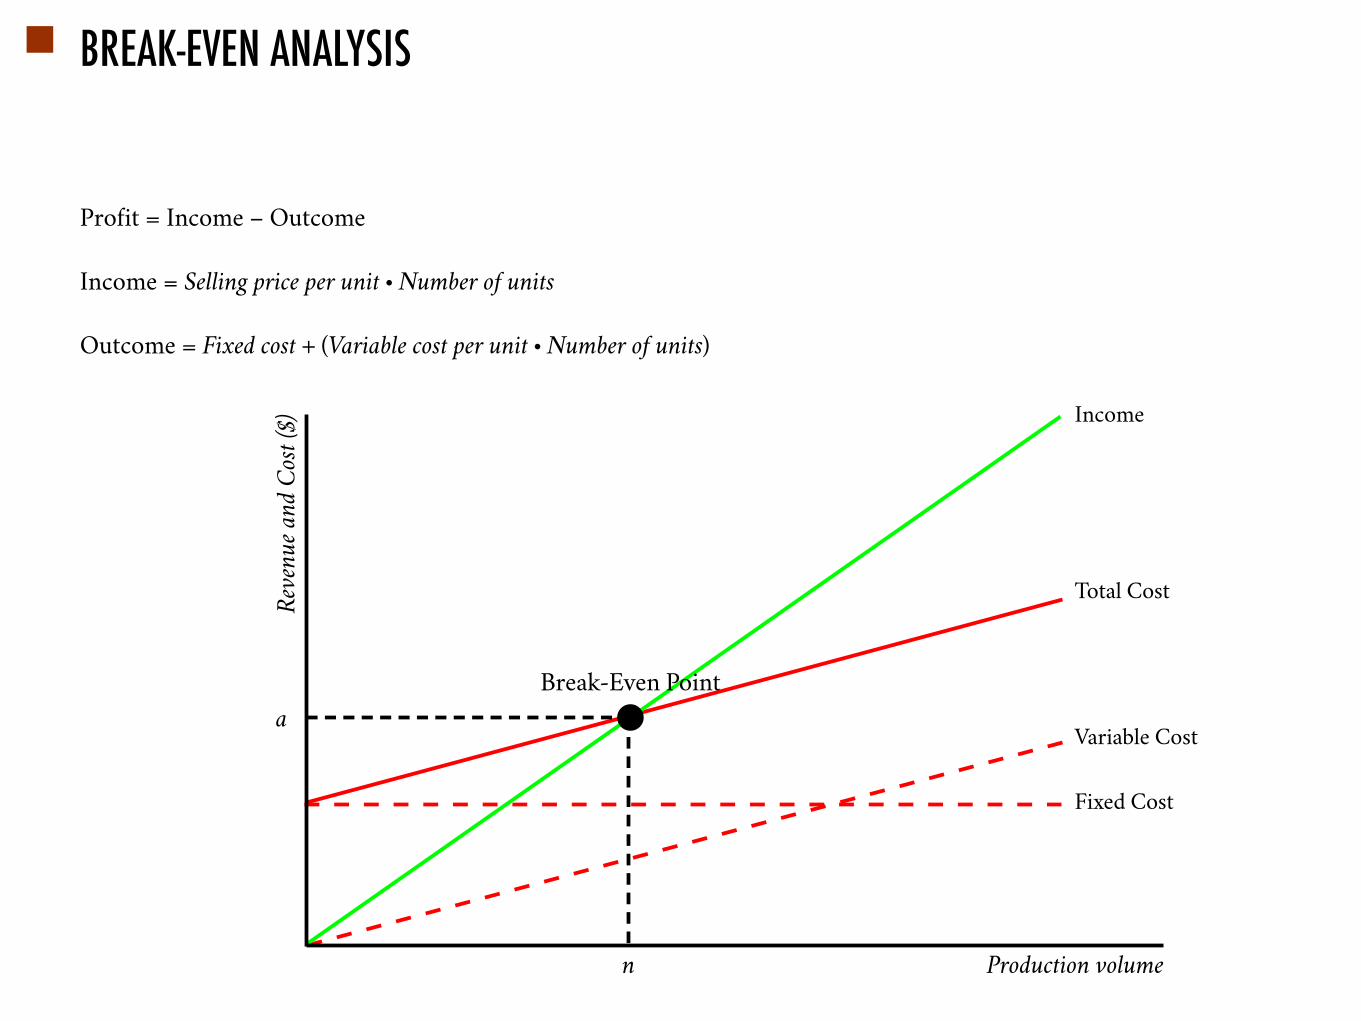
Profit = Income – Outcome
Income = Selling price per unit • Number of units
Outcome = Fixed cost + (Variable cost per unit • Number of units)
Total Cost
Variable Cost
Fixed Cost
Income
a
n
Break-Even Point
Production volume
Reve
nue a
nd C
ost (
$)
ADDENDUM
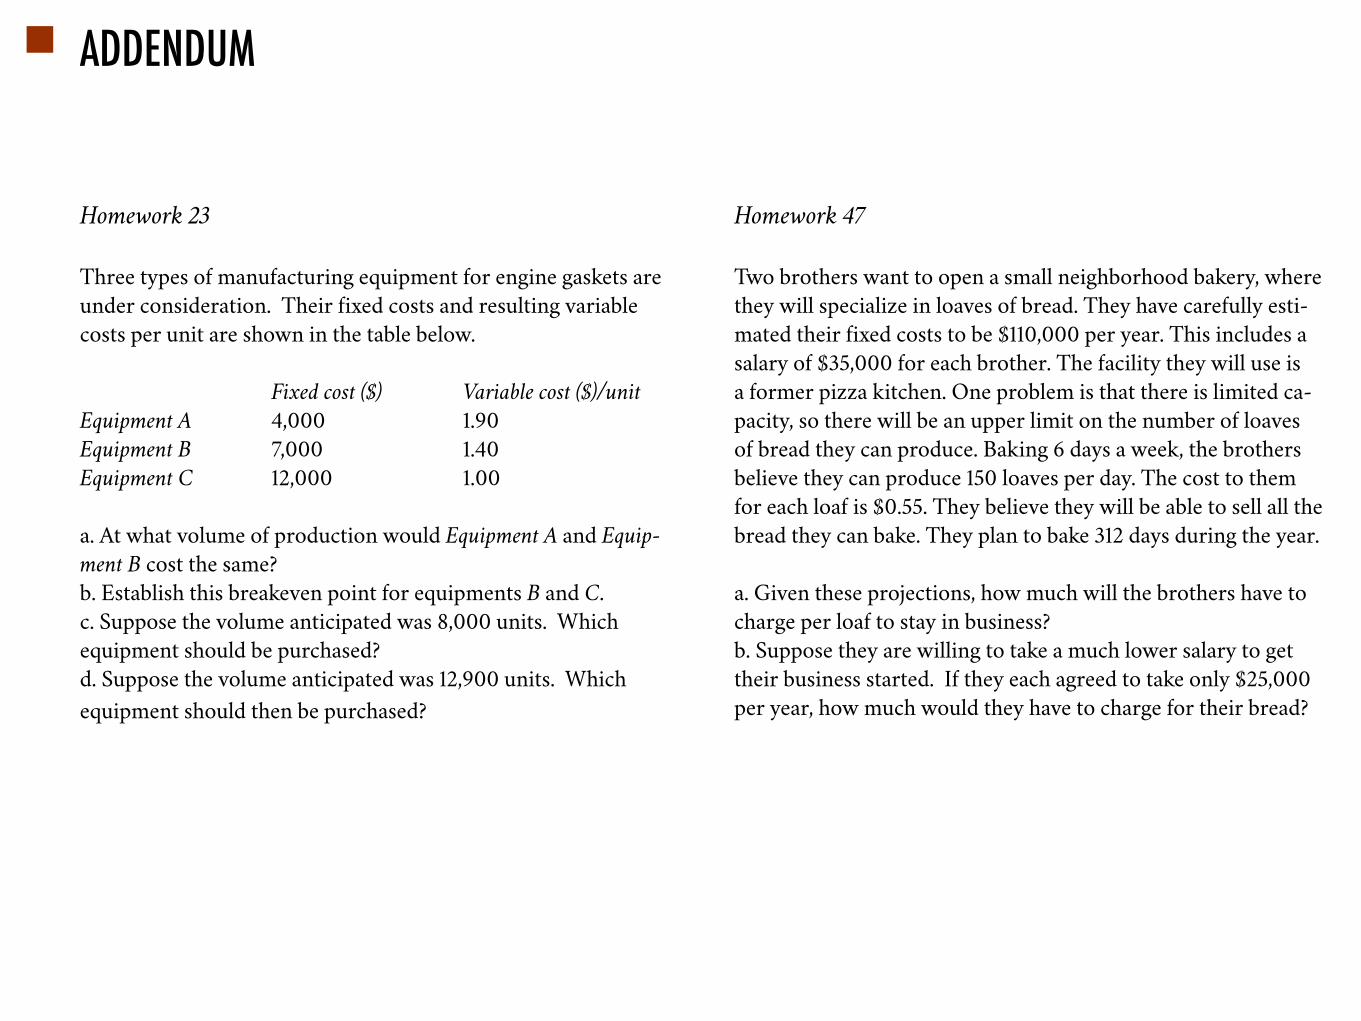
Homework 23
Three types of manufacturing equipment for engine gaskets are under consideration. Their fixed costs and resulting variable costs per unit are shown in the table below.
Fixed cost ($) Variable cost ($)/unitEquipment A 4,000 1.90Equipment B 7,000 1.40Equipment C 12,000 1.00
a. At what volume of production would Equipment A and Equip-ment B cost the same? b. Establish this breakeven point for equipments B and C. c. Suppose the volume anticipated was 8,000 units. Which equipment should be purchased?d. Suppose the volume anticipated was 12,900 units. Which equipment should then be purchased?
Homework 47
Two brothers want to open a small neighborhood bakery, where they will specialize in loaves of bread. They have carefully esti-mated their fixed costs to be $110,000 per year. This includes a salary of $35,000 for each brother. The facility they will use is a former pizza kitchen. One problem is that there is limited ca-pacity, so there will be an upper limit on the number of loaves of bread they can produce. Baking 6 days a week, the brothers believe they can produce 150 loaves per day. The cost to them for each loaf is $0.55. They believe they will be able to sell all the bread they can bake. They plan to bake 312 days during the year. a. Given these projections, how much will the brothers have to charge per loaf to stay in business? b. Suppose they are willing to take a much lower salary to get their business started. If they each agreed to take only $25,000 per year, how much would they have to charge for their bread?
ADDENDUM
Homework 793
The ThinkBig Company currently manufactures a product which sells for $1.30. The fixed costs associated with this operation are $18,000; the variable costs are $0.65 per unit on a volume of 35,000 units per month. They are considering new equipment which will increase the fixed costs to $26,000 and the variable costs to $0.75, but the demand is expected to increase to 55,000 units, so this option may be attractive. Should ThinkBig make this investment? Why or Why not?
The ThinkBig Company is now ready to purchase the new equip-ment. Two changes to the above plan include a price change to $1.45 per unit, and a revised demand forecast to 45,000 units. Given these circumstances, should the investment be made?
Problem from the Textbook
George Johnson recently inherited a large sum of money; he wants to use a portion of this money to set up a trust fund for his two children. The trust fund has two investment options: (1) a bond fund and (2) a stock fund. The projected returns over the life of the investments are 6% for the bond fund and 10% for the stock fund. Whatever portion of the inheritance he finally de-cides to commit to the trust fund, he wants to invest at least 30% of that amount in the bond fund. In addition, he wants to select a mix that will enable him to obtain a total return of at least 7.5%.
Formulate a linear programming model that can be used to de-termine the percentage that should be allocated to each of the possible investment alternatives.
ADDENDUM
Problem from the Textbook
The Sea Wharf Restaurant would like to determine the best way to allocate a monthly advertising budget of $1000 between news-paper advertising and radio advertising. Management decided that at least 25% of the budget must be spent on each type of media, and that the amount of money spent on local newspaper advertising must be at least twice the amount spent on radio ad-vertising. A marketing consultant developed an index that mea- sures audience exposure per dollar of advertising on a scale from 0 to 100, with higher values implying greater audience exposure. If the value of the index for local newspaper advertising is 50 and the value of the index for spot radio advertising is 80, how should the restaurant allocate its advertising budget in order to maxi-mize the value of total audience exposure?
Formulate a linear programming model that can be used to de-termine how the restaurant should allocate its advertising budget in order to maximize the value of total audience exposure.
Problem from the Textbook
Tom’s, Inc., produces various Mexican food products and sells them to Western Foods, a chain of grocery stores located in Texas and New Mexico. Tom’s, Inc., makes two salsa products: Western Foods Salsa and Mexico City Salsa. Essentially, the two prod-ucts have different blends of whole tomatoes, tomato sauce, and tomato paste. The Western Foods Salsa is a blend of 50% whole tomatoes, 30% tomato sauce, and 20% tomato paste. The Mexico City Salsa, which has a thicker and chunkier consistency, con-sists of 70% whole tomatoes, 10% tomato sauce, and 20% toma-to paste. Each jar of salsa produced weighs 10 ounces. For the current production period, Tom’s, Inc., can purchase up to 280 pounds of whole tomatoes, 130 pounds of tomato sauce, and 100 pounds of tomato paste; the price per pound for these ingredients is $0.96, $0.64, and $0.56, respectively. The cost of the spices and the other ingredients is approximately $0.10 per jar. Tom’s, Inc., buys empty glass jars for $0.02 each, and labeling and filling costs are estimated to be $0.03 for each jar of salsa produced. Tom’s contract with Western Foods results in sales revenue of $1.64 for each jar of Western Foods Salsa and $1.93 for each jar of Mexico City Salsa.
Develop a linear programming model that will enable Tom’s to determine the mix of salsa products that will maximize the total profit contribution.


