Miocene Depositional Systems and Hydrocarbon Resources ... · AND HYDROCARBON RESOURCES: THE TEXAS...
107
MIOCENE DEPOSITIONAL SYSTEMS AND HYDROCARBON RESOURCES: THE TEXAS COASTAL PLAIN by Jules R. DuBar assisted by Elizabeth M. Andrews, Katherine Hubby, and David C. Noe Bureau of Economic Geology w. L. Fisher, Director The University of Texas at Austin Austin, Texas 78712 prepared for The U.S. Geological Survey Contract No. 14-08-0001-G-707 December 16, 1983
Transcript of Miocene Depositional Systems and Hydrocarbon Resources ... · AND HYDROCARBON RESOURCES: THE TEXAS...

MIOCENE DEPOSITIONAL SYSTEMS AND HYDROCARBON RESOURCES:
THE TEXAS COASTAL PLAIN
by
Jules R. DuBar
assisted by
Elizabeth M. Andrews, Katherine Hubby, and David C. Noe
Bureau of Economic Geology w. L. Fisher, Director
The University of Texas at Austin Austin, Texas 78712
prepared for
The U.S. Geological Survey Contract No. 14-08-0001-G-707
December 16, 1983
ABSTRACT
INTRODUCTION
General Statement
Objectives
Methodology
STRATI GRAPHY
General Statement
Anahuac Formation
Fleming Group
Oakville Formation
Fleming Formation
Lagarto Formation
Gol iad Formation
Wi 11 is Format ion
Galveston Formation
GEOLOGIC FRAMEWORK
DEPOSITIONAL SYSTEMS
General Statement
Cypress Fluvial System
Moulton Streamplain System
Santa Cruz Fluvial System.
San Jacinto Delta System
TABLE OF CONTENTS
Indianola Barrier-Strandplain-Bay System
Rosita Delta System.
2
2
3
3
4
4
10
13
13
15
18
19
21
21
22
24
24
25
28
29
31
33
36

HYDROCARBON PRODUCTION
General Statement
Geology of Hydrocarbon Plays
Play
Play II
Play III
Play IV
Play V
Play VI
Play VII
Play VIII
Play IX
Play X
EVALUATION OF REMAINING RESOURCE POTENTIAL
Miocene MSU Source Quality
Evaluation Methods
Comparative Results
CONCLUSIONS
ACKNOWLEDGMENTS
REFERENCES
APPENDIX
Miocene Field Inventory by RR Commission and County
i i
38
38
38
43
43
44
45
45
46
47
47
48
48
51
51
58
58
66
80
81
89
90

1.
2.
3.
4.
Figures
Regional correlation sections and depositional sub-basins. . . . . . . . . Formal Late Cenozoic I ithostratigraphic units; Texas Coastal Plain.
. . . . . . . . . . .
General ized dip-section showing stratigraphic relationships of Miocene MSU Operational Unit A and B; Texas Coastal Plain
Miocene-PI iocene outcrops; updip I imit upper Anahuac shale wedge, Amphistegina B shoreline.
5
6
7
8
5. Estimated calibration and correlation of Texas Late Cenozoic ••••••• 11 biostratigraphic and lithostratigraphic units and paleon-tological markers.
6. Stratigraphic relationship of the Oakville, Anahuac and Frio ••••••• 14 Formations, Kenedy County, Texas.
7. Areal distribution of Miocene-Pliocene mammalian faunas..... 16
8. Principal Miocene depocenters based on isopach maps constructed .23 from subsurface well control.
9. Cumulative production of oil and gas for each of the 10 Miocene •••••• 42 MSU plays.
10. Cross-section of the Louisiana Gulf Coast Basin showing distri- •••••• 50 bution of productive intervals for oil and most probable oil generat i on zone.
11. Composite maturation profiles of two representative wells in age- ••••• 51 defined Gulf Coast producing trend.
12. Location and boundaries of Railroad Commission of Texas (RRC) ••••••• 53 Districts 2,3, and 4.
13. Total number of wells drilled in each county of RRC Districts ••••••• 54 2, 3, and 4.
14. Total number of oi I tests in each county of RRC Districts 2,3, •••••• 55 and 4.
15. Total number of gas tests in each county of RRC Districts 2, 3, ...... 56 and 4.
16. Historical changes of dri II ing density (mi 2 per exploratory •••••••• 57 well) for RRC Districts 2,3, and 4.
iii

1 •
2.
3.
4.
Tables
Key to vertebrate fossil local ities depicted on figure 7
Geologic exploration attributes of Miocene MSU plays.
Quantitative geologic attributes of Miocene MSU plays ••
Summary of general characteristics and analytical and. computed data, Miocene crude oils of Texas.
• • • • • • 1 7
• 39
• 40
• • 41
5. Statistical summary of recoverable oi 1, mi 11 ion bbl ••••••••••••• 59 (cumulative-well-number method).
6. Statistical summary of recoverable gas, bcf ••••••••••••••••• 60 (cumulative-well-number method).
7. Statistical summary of recoverable oil, million bbl ••••••••••••• 61 (cumulative-footage method).
8.
9.
Statistical summary of gas, bcf (cumulative-footage method) •
Statistical summary of recoverable oi 1, mi 11 ion bbl •••• (discovery-versus-time method).
· 62
• 63
10. Statistical summary of recoverable gas, bcf ••••••••••••••••• 64 (discovery-versus-time method).
11. Summary of estimates of future discoveries, Miocene MSU, •••••••••• 65 derived from historical projections.
12. Recoverable oi 1 (10 6 bbl) in Miocene MSU plays ••••••••••••••• 67 (cumulative-well-number method).
13. Recoverable gas (bcf) Miocene MSU plays ••••••••••••••••••• 68 (cumulative-well-number method).
14. Recoverable oil (10 6 bbl) Miocene MSU plays ••••••••••••••••• 69 (cumulative-footage method).
15. Recoverable gas (bcf) Miocene MSU (cumulative-footage method) •••••••• 70
16. Recoverable oil (106 bbJ) Miocene MSU (discovery-versus-time method) ••••• 71
17. Recoverable gas (bcf) Miocene MSU (discovery-versus-time method) ••••••• 72
18.
19.
20.
Summary of estimates of future discoveries, Miocene plays, deerived from historical projections.
Hydrocarbon inventory for Miocene MSU plays ••
Field-size distribution by play; Miocene MSU •••
21. Fields with greater than 100 mi 11 ion boe production; Miocene MSU.
iv
.73
. . 74
· 75
• ••• 76

Plates (in pocket)
1. Top of Miocene MSU structure map
2. Miocene MSU isopach map
3. Miocene Operational Unit A Net-sandstone isolith map
4. Miocene Operational Unit B Net-sandstone isolith map
5. Miocene Operational Unit A Sandstone-percentage map
6. Miocene Operational Unit B Sandstone-percentage map
7. Facies map Miocene Operational Unit A
8. Facies map Miocene Operational Unit B
9. Miocene MSU depositional systems
10. Stratigraphic dip section 2 - 2'
11. Stratigraphic dip section 10 - 10'
12. Stratigraphic dip section 14 - 14'
13. Stratigraphic dip section 22 - 22'
14. Map of hydrocarbon fields and outline of plays
v

Figure Captions
Figure 1. Regional correlation sections and depositional sub-basins.
Figure 2. Formal Late Cenozoic lithostratigraphic units; Texas Coastal Plain.
Figure 3. Generalized dip-section showing stratigraphic relationships of Miocene MSU Operational Unit A and B; Texas Coastal Plain.
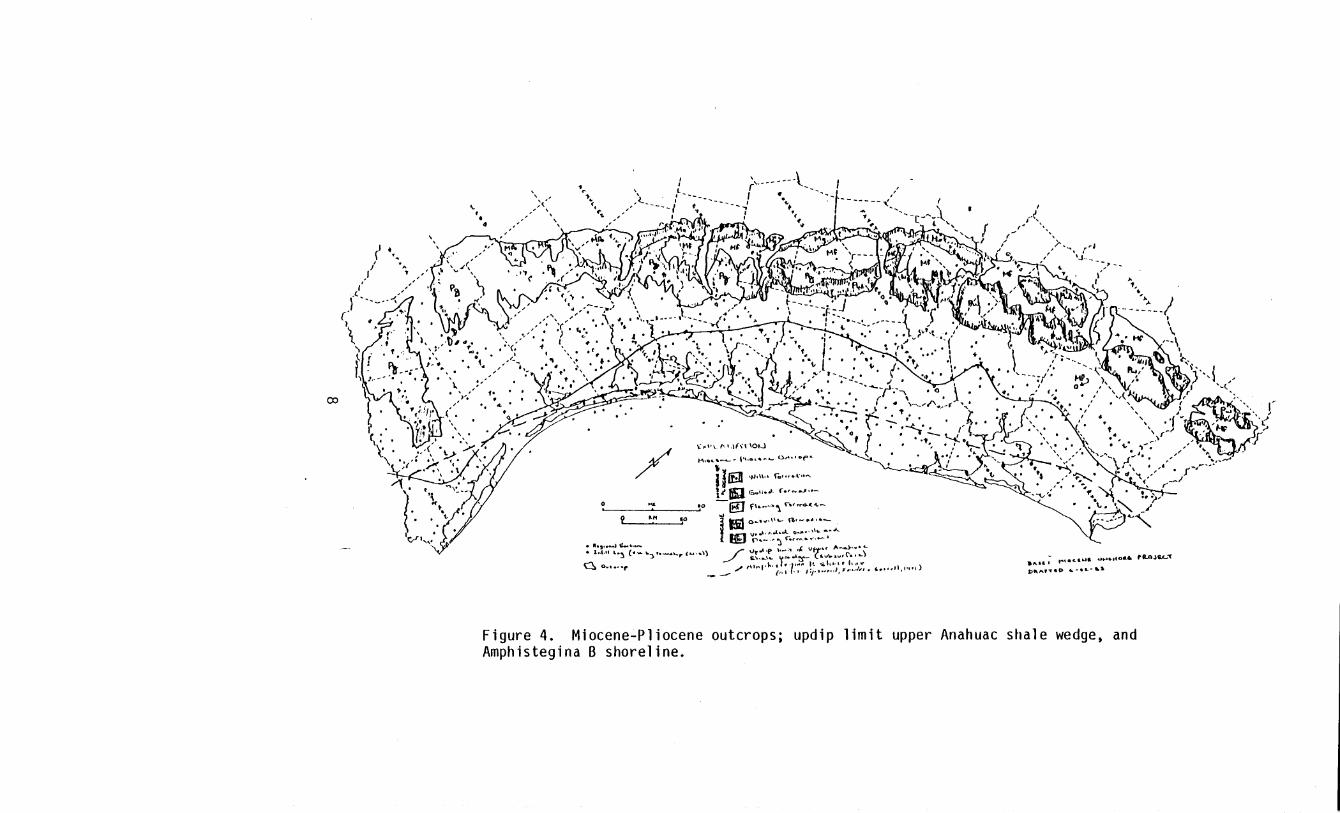
Figure 4. Miocene-Pliocene outcrops; updip limit upper Anahuac shale wedge, and Amphistegina B shoreline.
Figure 5. Estimated calibration and correlation of Texas Late Cenozoic biostratigraphic and lithostratigraphic units and paleontological markers.
Figure 6. Stratigraphic relationship of the Oakville, Anahuac, and Frio Formations, Kenedy County, Texas.
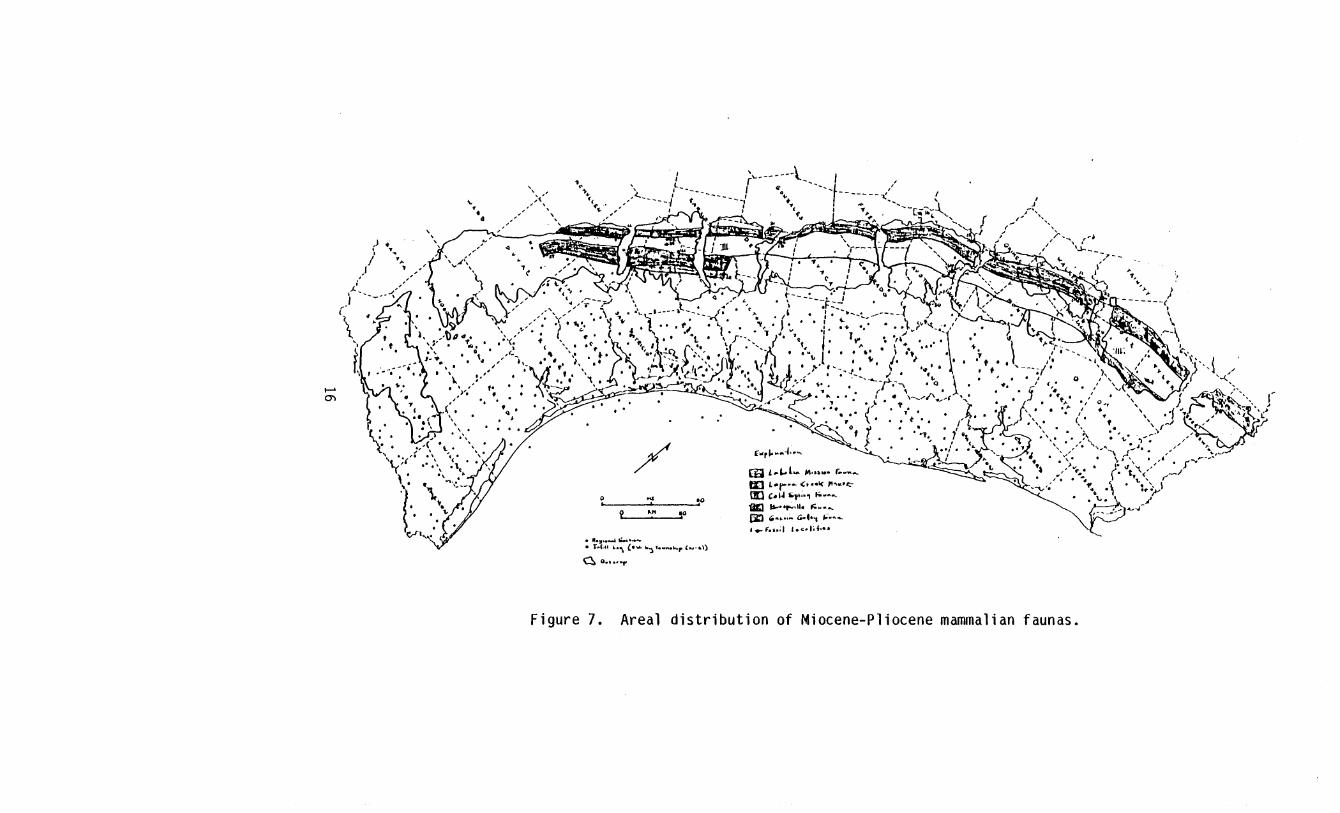
Figure 7. Areal distribution of Miocene-Pliocene mammalian faunas.
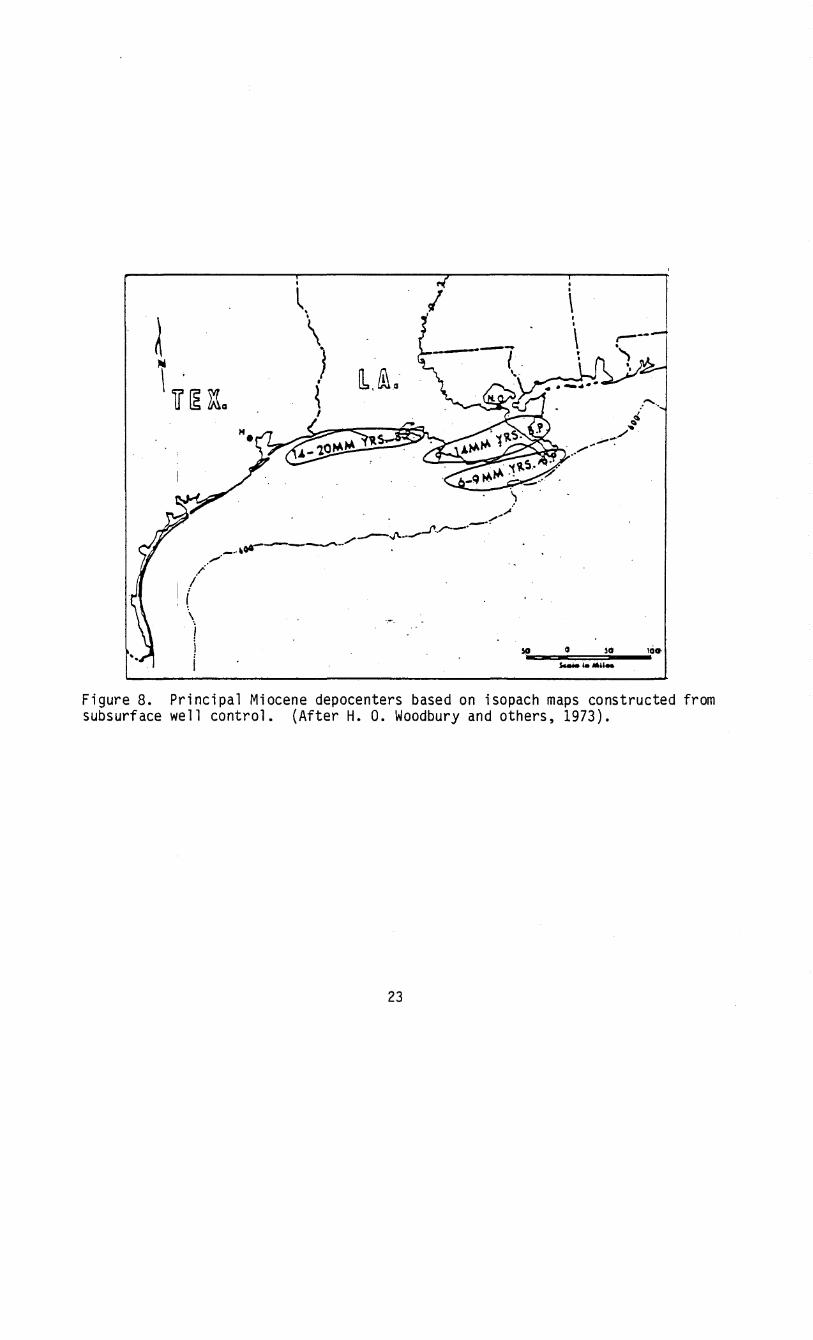
Figure 8. Principal Miocene depocenters based on isopach maps constructed from subsurface well control. (After H. O. Woodbury and others, 1973).
Figure 9. Cumulative production of oil and gas for each of the 10 Miocene MSU plays.
Figure 10. Cross-section of the Louisiana Gulf Coast Basin showing distribution of productive intervals for oil and most probable oil generation zone. (After Dow, 1978).
Figure 11. Composite maturation profiles of two representative wells in age-defined Gulf Coast producing trend. (After Dow, 1978).
Figure 12. Location and boundaries of Railroad Commission of Texas (RRC) Districts 2, 3, and 4.
Figure 13. Total number of wells drilled in each county of RRC Districts 2, 3, and 4.
Figure 14. Total number of oil tests in each county of RRC Districts 2, 3, and 4.
Figure 15. Total number of gas tests in each county of RRC Districts 2, 3, and 4.
Figure 16. Historical changes of drilling density (mi 2 per exploratory well) for RRC Districts 2, 3, and 4. (After H. O. Woodbury and others, 1973).
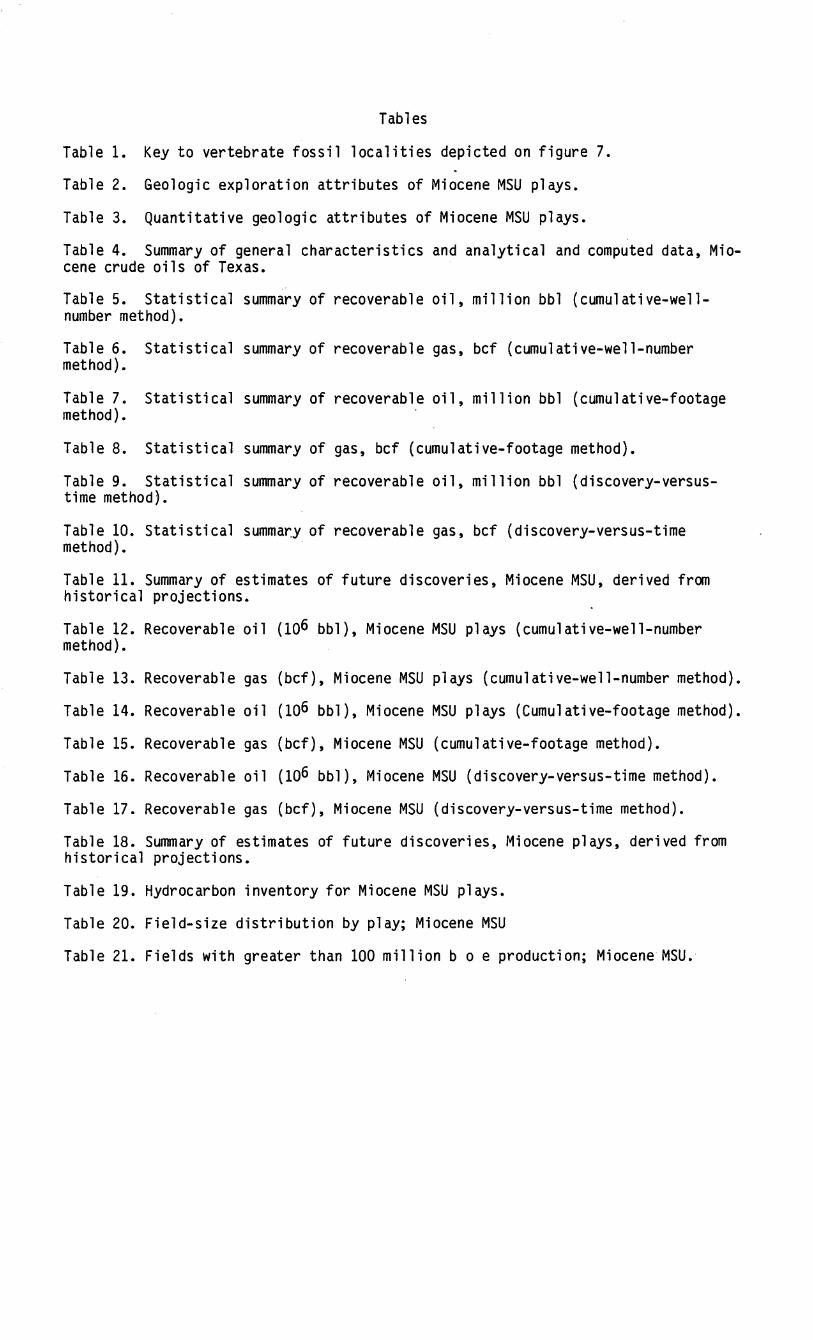
Tables
Table 1. Key to vertebrate fossil localities depicted on figure 7.
Table 2. Geologic exploration attributes of Miocene MSU plays.
Table 3. Quantitative geologic attributes of Miocene MSU plays.
Table 4. Summary of general characteristics and analytical and computed data, Miocene crude oils of Texas.
Table 5. Statistical summary of recoverable oil, million bbl (cumulative-wellnumber method).
Table 6. Statistical summary of recoverable gas, bcf (cumulative-well-number method).
Table 7. Statistical summary of recoverable oil, million bbl (cumulative-footage method).
Table 8. Statistical summary of gas, bcf (cumulative-footage method).
Table 9. Statistical summary of recoverable oil, million bbl (discovery-versustime method).
Table 10. Statistical summa~y of recoverable gas, bcf (discovery-versus-time method).
Table 11. Summary of estimates of future discoveries, Miocene MSU, derived from historical projections.
Table 12. method).
Table 13.
Table 14.
Table 15.
Table 16.
Table 17.
Recoverable oil
Recoverable gas
Recoverable oil
Recoverable gas
Recoverable oil
Recoverable gas
(106 bbl), Miocene MSU plays (cumulative-well-number
(bcf), Miocene MSU plays (cumulative-well-number method).
(106 bbl), Miocene MSU plays (Cumulative-footage method).
(bcf), Miocene MSU (cumulative-footage method).
(106 bbl), Miocene MSU (discovery-versus-time method).
(bcf), Miocene MSU (discovery-versus-time method).
Table 18. Summary of estimates of future discoveries, Miocene plays, derived from historical projections.
Table 19. Hydrocarbon inventory for Miocene MSU plays.
Table 20. Field-size distribution by play; Miocene MSU
Table 21. Fields with greater than 100 million b 0 e production; Miocene MSU.
ABSTRACT
The Miocene Major Stratigraphic Unit (MSU) of the Texas Coastal Plain is an
off-lapping sedimentary sequence deposited over the continental platform con
structed by Late Oligocene Frio progradation. These Miocene deposits have yielded
nearly 3 billion bbl of oil and 7 trillion ft3 of gas. Correlations with mammalian
and foraminifer zones indicate that the Miocene MSU and its updip equivalents, the
Oakvi lle and Lagarto Formations (Fleming Group), range in age from Early to Late
Medial Miocene (22.5 to 12 m.y.a.). Downdip, the upper Heterostegina and Discorbis
Zones of the Anahuac shale wedge are included as a part of the Miocene MSU.
Regional subsurface study indicates division of the Miocene MSU into six
principal depositional systems: the Cypress fluvial system and San Jacinto delta
system, developed in the Houston Embayment; the Moulton streamplain and Indianola
barr i er-strandp 1 a i n-l agoon system across the San Marcos Arch; and the Santa Cruz
fluvial system and Rosita delta system located in the Rio Grande Embayment. Inte
gration of regional studies of depositional systems, their facies suites, struc
tural styles, and character of produced hydrocarbons permitted delineation of 10
hydrocarbon production-exploration plays. The play forms the basic analytical unit
in characterization of hydrocarbon production histories, predictions of future
discoveries, and the placement of potential resources in a geographic-stratigraphic
context.
The Miocene MSU lacks entirely, or contains only negligible volumes of ther
mally mature source rocks. Thus, all Miocene MSU hydrocarbons are exotic, having
been derived either by upward migration from older formations, or by lateral, updip
migration from offshore marine Miocene units. Based on three historical evaluation
methods employed in this study, the Miocene MSU contains between 250 and 1360
million boe of undiscovered, conventionally producible hydrocarbons.

INTRODUCTION
General Statement
The onshore Miocene Major Stratigraphic Unit (MSU) of the Texas Coastal Plain
(pl. 1) is an extensive aggradational-progradational wedge of interfingering
fluvial, deltaic and marine sediments. This wedge, which averages 121 km (75 mj)
in width, and which reaches a maxium thickness of more than 2286 m (7500 ft), has
produced more than 4 bill ion boe of hydrocarbons making it a significant Gulf
Coast reservoir. Throughout this report, natural gas is converted to barrel-of-oil
(boe) equivalents on an approximate Btu basis of 1 bbl = 6 Mcf.
A long history of exploration and production has combined to make the Miocene
MSU a mature exploration target which probably has yielded approximately 70 percent
of its recoverable hydrocarbon reserves. Even so, the remaining fraction of undis
covered petroleum is an important natural resource. Relatively shallow drilling
depths of 610 to 3658 m (2000 to 12,000 ft), the variety of potential structural
and stratigraphic traps, and the potential of multiple pay zones add to the attrac
tiveness of this regional play.
2

Objectives
The objectives of this report are (1) to compile a geologic base necessary for
a hydrocarbon resource assessment of the product i ve onshore Miocene MSU of the
Texas Gulf Coastal Plain, (2) to integrate the geologic framework analyses, histor
ical finding rates and reservoir/source facies volumetrics as a basis for defini
tion and quantitative resource evaluation of exploration production plays, and (3)
to assess the potential undiscovered hydrocarbons of the Miocene MSU. The play,
which is the integral subdivision of production in this study, is a moderately
homogeneous segment of the MSU that is delineated on the basis of its character
istic structural, depositional and production parameters.
Methodology
Component steps in this study are (1) regional del ineation, subdivision and
stratigraphic analysis of the Miocene MSU, (2) completion of an inventory of known
hydrocarbon distribution, (3) compilation and interpretation of the Miocene MSU
geologic framework, (4) del ineation and quantitative evaluation of exploration
plays, and (5) determination of hydrocarbon production history and probable undis
covered recoverable reserves.
A grid of 24 dip and 2 strike sections (fig. 1) modified from those of Dodge
and Posey (1981) served as a base for stratigraphic and regional delineation of the
Miocene MSU. Supplementary control was derived from several hundred infi 11 logs.
To stratigraphically characterize the genetic subdivisions of the Miocene MSU,
correlations were made using conventional outcrop and subsurface terminology.
The data base for the hydrocarbon inventory was derived largely from annual reports
of the Railroad Commission of Texas and bulletins of the American Association of
Petroleum Geologists. The resultant inventory provides information on reservoirs
of all Miocene MSU fields (Appendix) that have produced more than 1 million bbl of
3

liquid equivalent hydrocarbons and includes year of discovery, number of producing
wells, depth, thickness and hydrocarbon gravity of producing zones, cumulative
production of oil, condensate, casing head gas, and non-associated gas, and calcu
lated reserves of hydrocarbons.
Geologic framework studies included preparation of regional isopach, structure
and sand distribution maps, and del ineation of depositional systems and their
component facies. Also investigated were factors controlling reservoir and poten
tial source rock quality.
Exploration plays serve to place into a geographic context an integrated
picture of geologic controls and hydrocarbon production for the Miocene MSU.
Resource assessment was related to ten exploration plays. For each play,
limiting factors and variables such as drilling density, depth range, reservoir
character and structural style were evaluated. Historical finding rates and volu
metric extrapolations were used to calculate ranges of possible undiscovered hydro
carbons. Geologically defined plays, such as employed in this study, should serve
as an effective approach to an accurate and functional method of hydrocarbon
resource evaluation and should assist in identification and evaluation of potential
areas for future exploration.
STRATI GRAPHY
General Statement
The stratigraphic position of the Miocene MSU and its component operational
units A and B is depicted and related to the Late Cenozoic stratigraphic framework
of the Texas Coastal Plain in figures 2 and 3.
The Miocene MSU, as employed in this report, is essentially a stratigraphic
equivalent of the Miocene Fleming Group as defined by Plummer (1932). Operational
Unit A correlates closely with the Oakville Formation, and Operational Unit B is
4

I-"~ )
\. t
U1
) \
/ .; .~
'A >
~~
'. '. f'~ "
'-~
/' o ~ _0 L • !
2 ~ P
t·
;'--------~ I ~ -, . -. .. , . , "
t'"
t..: JoI., \:.. L. "'I :'''',~l ICt--J
""" .. \I .... ~ oJ.. ~f"I.. ..... ~'\,IiI .....
"" L..J.:!_ - ........ ~ ..... 'l( "".)
... \",r.1\ ~_\\ \~~ .
~ ~ .... 1 .... 4\."' ....... t""", I tEd.!.!!' I.)
til r~~'" .•• ~. c4~.~"'- ~y"''''~,'~. 00 ':;'",1.\ d, .. ( .. , - cJ....('."",-,-,"",- .. ",~'uo,.l, ,,10'\..
Figure 1. Regional correlation sections and depositional sUb-basins.
rrl
,;.
" .. ' . ...
I

JIilGE ~
.,m.V-) iE.pOCH ;:ORMAT/ON R. 0 .
0 ~ PL.EISTO-
la.a.A\J MO ~ T ~ Q. o ~
f;.£WE \0. 0
L..I $$lE '" ~ l~
PL.\ 0- G-AL.V E S,ON c..aN£ 1------
-5' , -
w GOLI~b/ ~ ~ WI '- L..I S ..J
to- W I---
"2 J a: -W ~ Q. lU
U ~ ~
. 15 LAG-,QRTO 0 "- p(
0 \!> . - ).. \b
. ~ J < . ~ -OA-K'VI L.L~ ~ 2.CJ ~
1u 1.li --J , ~~ u....
1----lu ~~ ([ :? ~
25' UJ ~
~l v 0 0 ~ ~ 0 - ::r Q ()
I.!) Ci <l: )..~ - It. I- 'Q\!) ...J a: ;) 0 : U ~.
Figure 2. Formal Late Cenozoic lithostratigraphic units; Texas Coastal Plain.
6

""-J
[...,./
('~ J'~
c...~ ~ .~a C€.IJ f£
t-,Jo+ +0 $c.a..1 e.
~~ /
o
Marginulinpsi, Senni lac rimatd
Bi'jenerina A/Rangia mic ... oJohsoni
Bigenerina humble; ,Amphistegina B
Discorbis boJivarensis
S iphonina davi s i Discorbis
I Hetet"ostegina Marginulina Cibic ides haLzardi
Figure 3. Generalized dip-section showing stratigraphic relationships of Miocene MSU Operational Unit A and B; Texas Coastal Plain.
(X)
" (f-\
... \
f,.
r ·0. I 0
J A
)
·r ~. " .. ~
I I l , ,
,,'t. ___ ~_1 " I
-<
t ~
~ '\ '\. ,; '.~ -.. , ··1·- .... __ -J \ # .... ~.,_I_-'. '1 '. . ., . ..'.... \ ...... b ". ~
~ \·~;:x~·ft:r:·~··~~, : f~., . ., . , .. /.. " ~:~.. " .. ,..J-~',. ' •••••
. ~~ .. ~~'.
/ 'iI"'\. ''''.}f'' \0 .... )
." .. 1' ............... _ "'.Q~_ "'~ 0"" t 0("'''
o .. .0 I • !
? .H ,0 • ".S ........ s:.. •.• _ • I .. C.I' L.~ ( ....... "''') ' __ h.,. (u-.\)
, i i /fill ·IJ· \I.. rD'" ..... ~ l' EJ. Gut; • .J. r.t.."..., ....... -81 f'Lro~ .... \ , .. ,. • .....o.~,t. ...... ... ~ r:iJ 0 .. '''''\'''''' f', ..... " •• -... rr:-t v ... J..· ', ............. 0 ........ "''- .... .A-t ~ f""""'j f'".r_ ...... ·--. I
/' "'t".,l,P \._:" J. Vf1'U A ... ~ .. ·~ / , .... , ... \'" V-I".,.l~ C .. V ....... ft' ...... )
~~.
Q o_ .... ~ / fH.-.fl ... tI~~.I' ..... )', <.al,I'lf h •• ", _ __ if" ,I ,;1' .... (1,,1. ,-,.",./ .. , .. S ... ·," •• ·'·I)
---
.,,10. I t",.c. ...... u~.t'o .... ttlAJs..c:.."t
P .. "",,..O .... L- .. 1o
Figure 4. Miocene-Pliocene outcrops; updip limit upper Anahuac shale wedge, and Amphistegina B shoreline.
approximately equivalent to the Lagarto Formation. Together the outcropping Oak
ville and Lagarto Formations are conventionally considered to record the total
time-span of the Miocene Epoch (Rainwater, 1966; Tipsword, 1963; Wi lmarth, 195]).
Evidence developed as a product of this investigation indicates that the post
Lagarto Goliad and Willis Formations, assigned to the Pliocene Epoch by the u.s.
Geological Survey (Wi lmarth, 195]), are at least in part Miocene in age.
Delineation of the Miocene MSU was based primarily on electric log interpreta
tions. In the shallow subsurface log-determined contacts were carefully projected
to the outcrop (fig. 4), and these correlated with conventional stratigraphic
subdivisions. In the deeper subsurface correlations were related to laterally
extensive and distinctive progradational sand bodies, transgressive shale units,
and to available paleontologic control. Downdip basal Miocene sands grade into and
i nterf i nger with the D i scorb i s and upper Heterosteg i na Zones of the widespread,
transgressive Anahuac mudstone wedge. The top of the Miocene MSU coincides updip
with the base of thick sands of the overlying Goliad/Willis depositional sequence.
Downdip the upper boundary is placed at the top of a progradational sequence super
jacent to the Amphistegina B transgressive shale (fig. 3). Division of the Miocene
MSU into two operational units (A and B) was based, in large part, on carefully
correlated log patterns, and a generally upward-fining trend indicated in strike
oriented stratigraphic cross-sections. Paleontologic control downdip appears to
place the boundary between Operational Units A and B near the upper occurrence of
Discorbis bol ivarensis and thus approximately at the contact of the Golbigerin
atella insueta and Golbigerinita dissimilis planktonic foraminifer zones.
I n an effort to p I ace the Miocene MSU and its operat i ona 1 un i ts ina modern
stratigraphic context, a correlation chart (fig. 5) was prepared. This chart
relates the Texas Late Cenozoic 1 ithostratigraphic units to Texas' land mammal
zones, the standard North American land mammal stages, to an interhemispherical
9

planktonic foraminifer zonation, to the northwest Gulf of Mexico benthonic
foraminifer zones, to a geochronometric scale, and to the European stages.
The correlation chart is largely an interpretative summarization of published,
and unpub I i shed sources. The most pert i nent of these sources, listed by category,
are: geochronometric scale (Berggren and Van Couvering, 1974; MacFadden and Webb,
1982), planktonic foraminifer zonation (Beard and others, 1976; Beard, Sangree and
Smith, 1982; Kennett and Srinivasan, 1983; Lamb, personal communication, 1983; Lamb
and Beard, 1972; Stainforth and others, 1975; and Van Couvering and Berggren,
1977), benthonic foraminifer zonation (Ellisor, 1940, 1944; Lamb, personal communi-
cation, 1983; Rainwater, 1966; and Tipsword, 1963), molluscan zones (Oall, 1913;
Ellisor, 1936; Fisk, 1940; Gardner, 1940; Harris, 1895; and Stenzel and Turner,
1944), and mammalian zonation (MacFadden and Webb, 1982; Patton, 1969; Quinn, 1955;
and Wi I son, 1956).
Anahuac Formation
The Anahuac Formation was named in 1944 by the Houston members of the American
Association of Petroleum Geologists' Geologic Names and Correlation Committee
(Houston Geological Society, 1954 a-c). The formation had been referred to for the
previous 28 years as the "Middle Oligocene," or by its three paleontological zones,
the Oiscorbis, the Heterostegina, and the Marginul ina (Appl in and others, 1925).
Ell isor (1944) defined and described the Anahuac Formation. She designated
the Anahuac Oi I Field, five mi les east of the town of Anahuac, Chambers County,
Texas, as the type local ity; and she selected for description and type section,
sample interval -5890 to -6984 ft in the HORC Middleton #1 discovery well.
Ellisor described the Anahuac as follows:
The Anahuac at the type 1 oca 1 i ty in the Humb leO i 1 and Refining Company's Middleton #1 consists of dark, greenish-gray, slightly micaceous calcareous shale with very fine partings of sand. Lenses of sand and calcareous sand are interlaminated with shale.
The electrical log shows a well defined lithologic pattern of shale with sand lenses between two essentially sandy units.
1 0

I' Iq O~ Jill
.5 ~ \I
10
t;lfLVl&srD ,., ,., Fo ..... TIOtol"
~--
1.1 h < ........... ----+-----1
GDL.IAD /'WILLIS
'f- FQ Iffl\ 4'7" -l-O N If.
-fl;L.AAE-\&J D .. ." ...... •
zS'
~ lJJ V o
WZ.I
1 N'.
P2.1 6/ol.o ... ~I; ... I 0,.. ..... • ~i __
~::...J .. fII..,.-,!~ .. ,~:.:. .. ': ... ,,_.......... ...s .. p ...... ~
u<s-lc /1"':'_ Ie
~ .. r'hOa .. ';-..... !Sc~~_~~~
........ "' ... 'Q.
-;-~,,/vJ-.. .. l. {..:~,'cwl~
~Z-.......... ;_ .. ..... s~ .. , .. -r~,~ ...... ~-~
(H ... ~~.)
..... ., .. " ..... ;" .. "'-..... I&.(. -c: .. ; ...... JI .... ~.:t -'iJ.I" ...... S~;..~ j:l ... ".; ••• ~:._ a ~ R.~.I.s ~ (_"-1) 0,.-.., ... 1 ....... ..1"-
c ..... • ......... : ........ ; .. ... J.~~ .• U') t!H'+rIl..,.~i .. ~ . -. 1'IoIa ...... ""', ................... .,.i ~ s,,.".";"'''' 1Ii&.';',4C4. . v .
! &".e.e~'-;. C .......... " .... tl) HahI>.",J.;..,~_~
..... ~;_i_ ~:,r:=!'!:."'" ~._c. ..
e;~ic." •• s ......... J.: ,t\.~f~ • .,I;"-- -e~ .......
Figure 5. Estimated calibration and correlation of Texas Late Cenozoic biostratigraphic and lithostratigraphic units and paleontological markers.
11

The Formation is divided into three faunal units, the Discorbis, the Heterostegina, and the Marginul ina zones. Because the Discorbis zone is very sandy in some areas the contact with the Fleming is difficult to determine on the electrical log. Also in the basal Fleming downdip, brackish-water and lignitic shale lenses are interlaminated with the sands. In these shale lenses are oysters, ostracodes, Rota 1 i a beccar ii, 0 i scorb is subauracana var. dissona, reworked Cretaceous material and here and there one or two species of the Discorbis zone. Some paleontologists include these beds in the Discorbis zone.
Around some of the salt domes, as already stated, the facies of the Heterostegina zone is a reef limestone. In some areas, the Heterostegina zone is principally sand. The Marginul ina zone is predominantly shale with lenses of sand.
Cushman (1918 and 1921) identified Anahuac Heteostegina specimens as
~ antillea, a species characteristic of the Middle Oligocene West Indian Antigua
Formation. When Howe (1933) placed the Anahuac and Catahoula Formations of Louisi-
ana in the Miocene, the controversy concerning the age of the Anahuac was
initiated. Gravell and Hanna (1937) assigned the names H. texana and ~ israelskyi
to the forms previously named Heterostegina anti Ilea by Cushman, however, these
authors, on the basis of associated species of Lepidocycl ina, assigned a Late
Oligocene age to the Heterostegina Zone. The observation made by Gravell and Hanna
in 1937 that the age of the Anahuac could not be resolved until general agreement
was reached concerning placement of the Oligocene-Miocene boundary remains equally
true today.
It is apparent that Ellisor initially defined the Anahuac Formation properly
as a lithostratigraphic unit, that is, a unit defined on the basis of lithic
characteristics and stratigraphic position (North American Commission on Strati-
graphic Nomenclature, 1983). Subsequently Ellisor, in her reference to three
foraminifer-based subdivisions of Anahuac sediments, tacitly cast these deposits in
the role of a biostratigraphic entity constrained explicitly, therefore by
paleontologically-defined bounds. Boundaries of biozones and lithic units can, of
course, coincide, at least locally, where biotic and lithic character are strongly,
and more-or-less equally controlled by the same set of primary environmental para-
12

meters. This situation seems to apply to the typical Anahuac mudstone facies and
the apparently concomitant Marginulina, Heterostegina, and Discorbis Interval Zones
found beneath the lower Texas Coas ta 1 P I a i n. Upd i p, however, the typ i ca 1 Anahuac
facies grades to sand-dominant units best referred to the Frio or the lower Miocene
Unit A of this study. These sandy facies commonly retain the characteristic
"Anahuac" zona I foss i 1 s.
In this study the author has attempted to restrict appl ication of the name
Anahuac to Late Oligocene/Early Miocene shelfal mudstones representing the Hetero
steg i na and D i scorb i s I nterva I Zones. The interpreted strat i graph i c re 1 at i onsh i p
of the Anahuac mudstone wedge and the Frio and '~akvill~' (Unit A) sand facies in a
part of south Texas is illustrated in figure 6.
Maximum Anahuac transgression coincides with deposition of sediments of the
Heterostegina Interval Zone, and was in response to a regional cl imatic warming
trend. During this episode orbitoid foraminifers moved into the Gulf from the
Caribbean, and coral reefs formed on the flanks of salt domes as far north as
Houston, Texas (Ellisor, 1926). Deposits of the succeeding Discorbis Interval Zone
record a lesser transgressive-regressive cycle (Holcomb, 1964).
Fleming Group
The term Fleming Group (Plummer, 1932) is adopted in this report to include
strata of the Oakville, Lagarto and Fleming Formations, as well as the subsurface
Miocene Major Stratigraphic Unit (MSU) and its operational units A and B.
Oakville Formation
The name Oakville was applied by Dumble (1894) to "Miocene" grits, coarse
sandstone, and clay exposed a long the Nueces River at Oakv i I Ie, Live Oak County,
Texas (Wi Imarth, 195]). As defined by Dumble, the Oakvi I Ie included al I strata
between the Frio Clay and the overlying Pliocene deposits. It was Dumble's opinion
that this sequence correlated with the lower half of Kenedy's Fleming Beds of east
13

I-' ~
\ij
< 10 u o -
J ,/ .t}
'? ,0 ~.' Q
bJ ~ hJ \.J o ~ -.J o
~
(
~ 30 tt'\4
L- E ~\J--
FORfV\AT/O '" 5 t' 'P h 0 Y\ ; \1\ CL do-v; 5 ~
--~ AWAi-tu!lC SHAL£ WEDGE
~ Q SRND FRC(£S
"" A'" A I-J U A c.. /1
!5 AND' FACIE-S
FR.' 0 Fa R IY\ A-T 10 N
D i.5 c..o ~ b is Z o'ne-I
I-Iefe..r-o 5+e q /¥] Cc -te)(.a./h.<3::
B Q ) .IV I Y\ CL p~ r- Cd-
Ma..l-cr,'n U/I~CC ;d{'omoJ.-ph~
M II \/0... 9 ,. n (A.. -/-a.....
M. hOW~l
---~
c,bic~Je.s ho..z2 a..l-d('
Figure 6. Stratigraphic relationship of the Oakville, Anahuac, and Frio Formations, Kenedy County, Texas.

Texas. Bai ley (1926) included the basal Oakvi lIe beds of Dumble in his Gueydan
Formation (=Catahoula Formation), and Plummer (1932) redefined the type Oakville to
include all Miocene strata above the Catahoula and below the Lagarto Formation.
Plummer's definition of the Oakville Formation is currently employed by the USGS.
The vertebrate fossil assemblage (fig. 7, and table 1) of the Oakville Formation is
called the Garvin Gully Fauna for Garvin Gully, 4 km (2.5 mil north of Navasota,
Grimes County, Texas (Wilson, 1956). Quinn (1955) placed this fauna in the
Arikareean North American Land Mammal Stage (NALMS) and considered it sl ightly
older than the Early Miocene Thomas Farms Fauna of Florida. Patton (1969), based
on a re-study of Texas Neogene mammals, reassigned the Garvin Gully Fauna to the
Hemingfordian NALMS. Currently the Early Hemingfordian Stage is included in the
Early Miocene (Berggren and Van Couvering, 1974; and MacFadden and Webb, 1982)
stratigraphically below the Burkeville Fauna of the Lagarto Formation.
Based on the paleontological evidence the Oakville Formation and Operational
Unit A are considered in this report to represent a geochronometric age of 18 to 21
my (fig. 5).
Downdip approximate marine equivalents of the Oakville Formation included in
Operat i ona I Un itA of th is study appear to encompass, from the base upward, the
upper Globorotalia kugleri, Globigerinita dissimilis and Globigerinita stainforthi
Planktonic Foraminifer Zones (fig. 5). These planktonic zones in turn coincide,
approximately, with the stratigraphic interval between the upper Heterostegina zone
below to the Discorbis bolivarensis benthonic foraminifer datum above.
FI em i ng Format ion
Kenedy used the name '~leming bed~' for exposures of clays, sands, and sandy
clays best represented near the railroad station at Fleming In Tyler County, Texas.
The sequence as mapped by Kenedy (1892) in northern Tyler and Polk Counties
included all deposits above the Jackson and below the Pleistocene (Weeks, 1945),
15
....... 0"1
.I.:
.1
)
,/ + .~
';. l
\ • .......,e·\.. '. ., \ ... , ., \t?(" , .
)'. }. . v 1, ... •
... • • 4
't I \ \ '," L r~"'---"'--~ ;(' ~. '> I ---_ --, ,
-' ' <, /--,__ I ',-- I .. -, t ' " ..., - _/ t - - - I • - - - /
,-' " -,'" I', ~ '- , -- ' "'~ "', -----< , ~~~.~~~~~ • .JIC:::-. ... ...,....d ' "
, i,' " '" ....... ::---_J \ _I.J .. ,,", .... ,. r ~ ~ Q,
," 'y' ',,\ ~ •• '~ _l----.\..-') ,,,~, 'i" .'i .. 1" '--.{
1 I, ~. (.! e.. '.1 • l
, ',' ,t f •
, .. "
, .
/ ? '" ~Q
••• !t •• ~ ......... -• f .. l.1I ~.'\ l· .... "''l , ........... ,. (..., .• \)
~ o ..... f'
["rl-··~"'"
rn t.j..I .... "' ...... f .... _
III L-r-." < .... ~ "'\" .• ~ I!C ,.I~ '"to';., .... ... 1iIJ b-·~.II. to .. ... (jC w .... - c:;.4.~ ..... ~ t ... ,.,.d '.c.li .... .
'-...
I J
~', J ,
-," '''''',
// ~/ .. ~'\ {r~ oJ ,'1 \J- __
Figure 7. Areal distribution of Miocene-Pliocene mammalian faunas.
;. ~, .,~
...

Table 1. Key to vertebrate fossil localities depicted on figure 7.
Hap no. UTBEG no. County Location
1 31160 Newton Near Burkeville 2 31087 Tyler Near Town Bluff 3 31057 Polk Near Moscow 4 31183 Polk Near Goodrich 5 31200 Polk Near Goodrich 6 31219 San Jacinto Near Cold Spring 7 31191 San Jacinto Near Cold Spring 8 31243 San Jacinto Near Point Blank 9 31190 San Jacinto Near Point Blank
10 31242 San Jacinto Near Point Blank 11 30873 Walker Aiken Hill 12 40071 Grimes Near Navasota 13 40070 Gr imes Sommers Pit 14 31272 Washington Near Chappe 11 Hi 11 15 40067 Washington Hidalgo Bluff 16 40068 Washington Near Carmine 17 31259 Fayette Near LaGrange 18 31278 Fayette Near Amandsville 19 31273 Lavaca Near Shiner 20 31262 De Witt Near Concrete 21 30896 Bee Near Berclair 22 31132 Bee Near Normanna 23 31080 Bee Near Berclair 24 31170 Bee Near Normanna 25 30936 Li ve Oak Near George West 26 30904 Live Oak Near George West 27 31089 Duval Palangana Dome 28 30895 Gol iad Goliad State Park 29 Hardin Saratoga field 30 40539 Austin S. F. Austin State Park 31 40193 De Wi tt Near Hochheim 32 40224 San Jacinto Near Point Blank 33 40262 Gonzales Near Shiner
17
thus including, as presently defined, the Catahoula and Willis Formations. Kenedy
first published a description of the section near Fleming, now regarded as the type
section for the Fleming Formation, in 1903 (Hayes and Kenedy).
Lagarto Formation
The name Lagarto was applied by Dumble (1894) to a calcareous clay bed exposed
above his Lapara Sand unit on Lagarto Creek, Live Oak County, Texas (Wilmarth,
195]). Plummer (1932) noted that a thick clay deposit, stratigraphically posi
tionedbetween the Oakville Formation below, and Dumble1s Lapara Sand above, had
become known to most geologists as the Lagarto Clay. To clarify the resultant
stratigraphic confusion, Plummer restricted the name Lagarto to the clay immedi
ately below the Lapara Sand of Dumble, and designated as the type locality for the
emended Laga rto Format i on, outcrops on the B renham-Hous ton highway wes t of the
Brazos River in Washington County, Texas. Subsequently Dumble1s Lapara Sand and
Lagarto Creek clay beds (the original Lagarto Clay) were assigned as members of the
Go I i ad Format ion.
Two stratigraphically distinct vertebrate faunas occur in the Lagarto Forma
tion (fig. 5). The lower of these is termed the Burkeville Fauna (Table 1) and the
upper, the Cold Spring Fauna (Wilson, 1956). The Cold Spring Fauna, named for Cold
Spring, near Navasota, Grimes County, is placed in the middle Barstovian NALMS
(Patton, 1969) and is thus of Late Early Miocene to Early Medial Miocene age.
Recently MacFadden and Skinner (1981) reported the earliest (approximately 15 my)
occurrence of a hipparion horse from an apparent Cold Spring assemblage near the
Trinity River in San Jacinto County.
The Burkevi II e Fauna is named for Burkevi II e, Newton County, Texas (W i I son,
1956). Deposits of the Lagarto Formation (=Upper Fleming Formation) at this loca
lity are of particular stratigraphic importance because they contain both ter
restrial mammals and brackish-water invertebrate fossils permitting correlation of
18

outcrops with subsurface marine equivalents. Important studies of the Burkeville
beds include those of Dall (1913), Hesse (1942), Stenzel, Turner and Hesse (1944),
and Floyd, Miller and Berry (1958).
Presence of the gastropod Potamides matsoni Dall establ ishes correlation of
the Burkeville beds with the subsurface Potamides matsoni Zone of Ellisor (1936)
and with the Caster Creek Member of the Louisiana Fleming Formation (Fisk, 1940).
The Burkeville vertebrate fauna is correlated with the late Hemingfordian
(Patton, 1969) and is thus of Late Earl y Miocene age.
Downdip marine facies of Operational Unit B, approximately equivalent to the
outcropping Lagarto Formation, I ie between the Discorbis Bolivarensis benthonic
foraminifer datum below and the Bigenerina humblei benthonic foraminifer datum
above (fig. 2).
Go I i ad Format ion
Howeth and Martyn (1932) used the name "Goliad Sandstone Formation" for
PI iocene beds exposed along the San Antonio River in Gol iad County, Texas. The
U.S. Geological Survey (Wilmarth, 1957) adopted the name "Goliad Sand" to include
all Pliocene beds below the Lissie Formation (Pleistocene) and above the Lagarto
Clay as restricted by Plummer (1932). The outcrop belt (fig. 4), as mapped by
Barnes (1968 to 1976) extends from Stark and Hidalgo Counties in southwest Texas
into Lavaca County where Goliad and Willis outcrops occur in close proximity. In
current usage the Gol iad Formation is subdivided into three members which, in
ascending stratigraphic order, are the Lapara Sand, Lagarto Creek, and Labahia
(PI ummer, 1932).
Most Go I i ad vertebrate foss i I s or i g i nated f rom the Lapara Member (W i I son,
1956) and this assemblage was referred to as the Lapara Creek Fauna by Quinn
(1955). The Lapara Creek Fauna (figs. 5 and 7) is correlated with the Clarendonian
19

NALMS (Quinn, 1955, and Patton, 1969) and is thus Late Medial to Early Late Miocene
(12 to 9 mya) in age. Stratigraphic downdip projection of the lower Goliad-Willis
sequence during the present study, and by Solis (1981) indicates that marine facies
of this interval coincide, at least in part, with the Globoratalia menardi Plank
tonic Foraminifer Zone (Late Medial Miocene).
No vertebrate foss i 1 s are known from the Lagarto Creek Member; however, a
sparse assemblage from the Labahia Member has been assigned to the Hemphi 11 ian
North American Mammal Stage which originally was considered to be of Pliocene age
(Wilson, 1956; Patton, 1969). More recently it has been shown that the Hemphillian
is of Late Miocene to Early PI iocene age (Berggren and Van Couvering, 1974; and
MacFadden and Webb, 1982); thus it appears that the Labahia Member probably strad
dles the Miocene/Pliocene boundary. The stratigraphically intermediate Lagarto
Clay Member, bracketed by Late Miocene depos i ts above, and Late Med i aIM i ocene
deposits below, must logically be assigned to the Late Miocene. From available
evidence, therefore, it seems apparent that the Goliad Formation ranges in age from
Late Medial Miocene to possibly Early Pliocene. The precise stratigraphic rela
tionship of marine equivalents of the Labahia Member to the Galveston Formation has
not been determined.
Doering (1935) noted that a close relationship existed between the Willis and
Goliad Formations. Plummer (1932) considered both units to be of the same age, but
thought that the Wi 11 is was, in part, sl ightly younger than the Gol iad. He also
pointed out that where the two units occur together in the same area they are
difficult to differentiate. The stratigraphic position of both the Will is and
Goliad Formations between basal Pleistocene units above and the Lagarto Formation
below strongly suggests that they represent facies of a single contemporaneous
stratigraphic unit of Late Miocene to Pliocene age (fig. 5).
20
Wi II is Formation
The name Willis (fig. 2) was employed by Doering (1935) for sands and gravelly
ands of probable Pliocene age exposed near the town of Willis, Montgomery County,
Texas. Doering (1956) reassigned these deposits to the Citronelle Formation which
he then considered to be of early Pleistocene age. The Willis sands of Doering
were included by Plummer (1932) in his Citronelle Group and considered by him to be
of Pliocene age, but slightly younger than most of the Goliad Formation. Willis
deposits of the type area in Montgomery County are classified as lower Pleistocene
by Barnes (1968) and shown by him to stratigraphically lie between the Pleistocene
Bentley Formation above and the Fleming Formation.
Fossils are apparently unknown from Willis sediments; however, for reasons
explained in the above discussion for the Goliad Formation, it appears logical to
consider the Willis Formation an essentially contemporaneous eastern facies of the
Goliad, and thus to be of Late Medial Miocene to at least Early Pliocene age.
Galveston Formation
The designation "Galveston Formation" (fig. 2) has been appl ied by the author
(OuBar and others, 1980) to a brackish-water to marine sequence of fossiliferous
fine sand and clay mapped along the coast of the northwestern Gulf from South Marsh
Island, Louisiana, to Mexico. The type section for these deposits is the -1320 to
-3030 ft sample interval of the Humble Oil and Refining Company #1 Ostermeyer well
located on Galveston Island approximately 10 km (6 mil southwest of the city of
Galveston. In the type area the Galveston is unconformably overlain by the Early
Pleistocene "Williana Formation" and rests unconformably on sediments included in
the Late Miocene Rangia microjohnsoni Zone. This interval coincides closely with
the Evangel ine Aquifer of Baker (1978). Fossils representative of the interval
were first reported by G. D. Harris (1895), who mistakenly assigned the lower part
21

of the interval to the Miocene. Study of the contained molluscan assemblages
demonstrates that the Galveston Formation correlates with the Pl iocene Jackson
Bluff and Tamiami Groups of Florida (OuBar and others, in press). To determine the
stratigraphic relationship of the Galveston deposits with their outcropping equiva
lents, a dip-oriented stratigraphic section based on electric logs and well samples
was prepared. This section demonstrates that the Galveston interval correlates
with the upper Willis Formation as mapped by Barnes (1968b) in Montgomery County,
48 km (30 mil northwest of Houston. This evidence supports the view that the upper
part of the Willis and probably the Labahia Member of the Goliad Formation are of
Pl i ocene age.
GEOLOG I C FRAMEWORK
The Miocene MSU was deposited upon the continental platform constructed by the
earlier Frio progradation. This style of sedimentation differs from that of the
Frio for which the depocenter was located along the Texas coast. Miocene depocen
ters (fig. 8) progressively shifted eastward so that the Early Miocene depocenter
layoff southwestern Louisiana and later depocenters off southeastern Louisiana
(Ra i nwater, 1966).
The three major structural provinces of the Texas Coastal Plain are, from
northwest to southeast, the Houston Embayment, the San Marcos Platform and the Rio
Grande Embayment (pl. 1). These broadly defined provinces, with their respective
structural styles, have importantly influenced the character of Miocene deposition.
In the Rio Grande Embayment and across the San Marcos Platform salt and salt
related structures are rare or absent. In this province growth fault belts and
associated anticlines, clay ridges and clay diapirs are the major structures
(Bishop, 1978 and Bruce, 1973). In the Houston Embayment salt diapirism and
associated faulting, and salt withdrawal basins are most characteristic (Bebout and
others, 1978, Bruce, 1973 and Jackson, 1982).
22
I I
l I I
, \ I I
I
~ \ I
\ } ,..
\ i~tt ~ £ . • ~
, .12
I
Figure 8. Principal Miocene depocenters based on isopach maps constructed from subsurface well control. (After H. O. Woodbury and others, 1973).
23
Three fault-defined subbasins are recognized in the Rio Grande and San Marcos
structural provinces (fig. 1). The updip subbasin is characterized by faulting
related to the Vicksburg Flexure (Gregory, 1966). These faults generally have
Miocene displacements of less than 122 m (400 ft) affecting only strata of the
lower Miocene Unit A. Growth faults of the Frio Flexure characterize subbasin II.
Unit A strata are displaced up to 305 m (1,000 ft) by some of these faults, whereas
faulting of Unit B strata is less common and displacements are usually less than
91 m (300 ft). Subbas i n I II, the upd i p marg i n of wh i ch extends a long the lower
Texas Coastal Plain, is dominated by the Miocene fault belt. Faults of this trend
dislocate the entire Miocene MSU and downdip they contribute to a dramatic section
expansion. These subbasins do not extend as clearly defined entities into the salt
dome province of the Houston Embayment.
DEPOSITIONAL SYSTEMS
General Statement
The Miocene MSU was subdivided into six regionally distinct but geologically
integrated depos i tiona 1 systems (p 1. 8). Different i at i on of these systems was
based on analysis of net sand, sand percent and facies maps and the vertical
distribution of log facies as represented by key log dip sections (p1s. 10 to 13).
Procedures adopted to recognize and del ineate these genetic units followed the
approach of Fisher and McGowen (1967) and Galloway, Hobday and Magara (1982).
Facies relationsips across the depositional systems are depicted in four key
stratigraphic dip sections (pIs. 10 through 12) and two regional facies maps
(p1s. 7 and 8).
Two extens i ve progradat i ona 1 bod i es, des i gnated the San Jac into and Ros ita
Systems, occur centered in the Houston and Rio Grande embayments respectively
(pI. 9). The San Jacinto delta system is characterized by relatively small,
24

coalescing wave-influenced and wave-dominated delta lobes (pIs. 7,8,10 and 11)
fed by mixed-load streams of the adjacent Cypress fluvial system which carried fine
to coarse sands, si Its and clay (Spradl in, 1980). Much of the sand contributed to
this system, as mapped in east Texas, appears to have been transported along strike
from deltaic counterparts in adjacent Louisiana. Delta lobes of the northeastern
part of the Rosita delta system were similar to those of the San Jacinto delta
system but were fed by bed-load and mixed-load streams of the Santa Cruz fluvial
system. To the southwest ancestral counterparts of the Rio Grande River con
structed larger and more clearly vertically stacked deltaic lobes.
Located between the two structurally-controlled fluvial-deltaic complexes was
an area across the San Marcos Platform termed the Moulton Streamplain and the
adjacent shoreward-located Indianola barrier-strandplain-bay system. Streams of
the Moulton Streamplain were small, commonly ephemeral, and, for the most part,
transported fine sands and muds. Small delta lobes prograded into the adjacent
lagoons, which developed behind a Gulfward I ine of barriers and strandplain
systems. Sands of the barrier and strandplain were derived primarily from strike
transported sands of adjacent depocenters; however, it is probable that wave
reworking of the small bayhead deltas provided a minor secondary sand source.
Cypress Fluvial System
The Cypress Fluvial System lies northeast of the Moulton Streamplain. This
area is more than 298 km (185 mi) wide, and extends in subsurface beneath the
Miocene Texas Coastal Plain 64 to 80 km (40 to 50 mi). Sand isolith, sand percent
and facies maps (pIs. 3 through 8) indicate the contemporaneous existence of four
main mixed-load fluvial channel systems. These are, (from west to east) the
Burton, Penn, Polk, and Tyler Axes (pl. 9). These axes enter the coastal plain in
Washington, Grimes, Polk and Tyler Counties respectively. Although it is apparent
25

that channel shifting was commonplace the axes of the four systems remained gener
ally constant throughout deposition of the Miocene MSU. As pointed out by Spradlin
(1980) the downdip decrease in sinuosity of sand isolith patterns, and the decrease
in thin sands in the floodplain facies indicate presence of well-developed levees
along major channels.
The channel-fill/floodplain complex which represents the Burton axis is
approximately 64 km (40 mi) wide. Along the axis sand distribution is character
ized by several dip-oriented moderately sinuous dendritic sand belts generally 3 to
8 km (2 to 5 mi) wide. The system enters the Miocene Coastal Plain in Washington
County and merges with the San Jacinto Delta System near the Ft. Bend-Brazoria
County line, and thus follows closely the present course of the Brazos River. Sand
content in updip channel-fill facies reaches 60 to 70 percent, however, downdip the
range is typically 30 to 50 percent. Net sand thickness for channel-fill deposits
ranges from 61 to 152 m (200 to 500 ft) for both Units A and B. Sand content for
floodplain facies is typically 20 to 30 percent and net sand thickness is 30 to 91
m (100 to 300 ft). Channel-fi I 1 sand units up to 15 m (50 ft) occur vertically
stacked and amalgamated.
Miocene MSU sands at the outcrop along the Burton Axis are calcilithic with
greatest percentage of carbonates and coarse sand in Unit A (Ragsdale, 1960).
That part of the Tyler Axis which occupies the easternmost section of the
Cypress Fluvial System is approximately 153 km (95 mi) wide, however, an additional
segment of the system occurs in adjacent Louisiana. The system is located in parts
of San Jacinto, Polk, Tyler, Jasper, Newton, Liberty, and Hardin Counties. Sand
isolith belts are 3 to 10 km (2 to 6 mi) wide, and represent various courses of the
M i oc e n e an c est r a 1 N e c h e san d Sa bin e R i ve r s. S i mil art 0 the Pen n Ax is, m u I tip I e
dip-oriented sand belts of the Tyler Axis are moderately sinuous, forming dendritic
patterns updip and basinward bifurcating belts downdip.
26
Sand content of channe l-f ill i so 1 i ths common 1 y is 40 to 60 percent, and sand
content for floodplain facies is 25 to 50 percent in Unit A and 30 to 40 percent in
Un i t B. Net sand th i cknesses for channe l-f ill i so 1 i ths are 152 to 213 m (500 to
700 ft) for both Un itA and Un i t B. Channe l-f ill sand un i ts are most typ i ca 11 y 6
to 12 m (20 to 40 ft) thick, however, some sand units, especially updip facies,
reach 30 m (100 ft) or more in thickness. Commonly several cycles of channel-fill
occupy the same drainage course producing vertically stacked and amalgamated
sequences. Sand content of floodplain facies is 25 to 50 percent for Unit A and 30
to 40 percent for Unit B. Flood basin net sand thickness ranges from 30 to 152 m
(100 to 500 ft) for Unit A and 61 to 152 m (200 to 500 ft) for Unit B.
Although rivers of this axis del ivered a substantial sediment load to the
adjacent Gul f, deltas were strongl y wave-dom i nated and bas inward progradat i on of
the Miocene fluvial system during deposition of Unit B in this area was only 16 km
(10 mj) or less.
The Penn Axis (pl. 9), the largest and most complex component of the Cypress
Fluvial System is approximately 105 km (65 mi) wide and represents various
positions of the San Jacinto and Trinity Rivers. Multiple dip-oriented sand
isoliths are moderately sinuous, are arranged dendritically updip, and form
basinward bifurcating belts downdip.
Major sand belts are generally 5 to 16 km (3 to 10 mi) wide, however, a
maximum width of approximately 24 km (15 mi) is attained at the conjunction of
several isol iths in north-central Harris County. Sand content for channel-fi 11
trends ranges upward to 80 percent in updip facies, whereas in downdip facies a
range of 20 to 40 percent is characteristic. Net sand thickness is 91 to 152 m
(300 to 500 ft) in Unit A and 91 to 274 m (300 to 900 ft) in Unit B. Sand content
for floodplain facies is typically 20 to 40 percent, and net sand thickness ranges
f~om 30 to 152 m (100 to 500 ft). Numerous thin sandstone units incorporated in
the floodplain facies represent tributary channel-fill deposits, and crevasse and
27

splay facies. Sand units of major channels, commonly 12 to 18 m (40 to 60 ft)
thick, occur in vertically stacked and commonly amalgamated sequences. As observed
by Galloway and others (1982), the intermediate sand content, restriction of sand
to laterally isolated belts and internal features of these sand isoliths suggest
deposition by flashy, coarse-mixed-Ioad to distal bed-load rivers.
Rivers of the Burton Axis, similar to those of the Penn Axis, built small
coalescing deltas where they discharged into the Gulf. In this manner the Penn and
Burton systems prograded Gulfward more than 32 km (20 mi) during deposition of the
Miocene Operational Unit B.
Dominant structures of the Cypress Fluvial System are growth faults and
numerous salt diapirs, with associated radial faults, and salt withdrawal basins.
The system coincides in large part with Play VIII (pl. 14), the most prol ific
hydrocarbon producing region of the Texas Coastal Plain.
Mou 1 ton Streamp 1 a i n System
In the middle of the Texas Miocene Coastal Plain, between the Cypress and
Santa Cruz Fluvial Systems, is an area 121 to 161 km (75 to 100 mj) wide designated
the Moulton Steamplain by Galloway, Henry and Smith (1982). This mudrich area
contains several relatively thin and narrow dip-oriented sand tracts. Net sand
thickness in these tracts ranges from 30 m (100 ft) at outcrop to 152 m (500 ft)
downdip. Sand content is greatest (50 to 60 percent) updip in the outcrop and
shallow subsurface. Net sand thickness for floodplain areas is 30 to 92 m (100 to
300 ft) for Unit A and 61 to 122 m (200 to 400 ft) for unit B. Sand content in
this facies is characteristically 20 to 30 percent for both units.
The sand-rich trends encased in finer-grained sediment indicate that deposition
in this part of the Coastal Plain was characterized by small, ephemeral, primarily
mixed-load streams subject to flooding (Galloway, Henry, and Smith, 1982).
28

Following the Early Miocene transgression the Moulton Streamplain was advanced
Gulfward across the Vicksburg Flexure by construction of coalescing bayhead deltas,
and subsequent fluvial progradation. Later, during depositon of Unit B, the
strandplain system was prograded an additional 16 to 32 km (10 to 20 mi) Gulfward
overriding bayhead delta and lagoonal facies of Unit A.
Galloway, Henry, and Smith (1982) described outcropping fluvial sands of the
Moulton streamplain as moderate to well-sorted, coarse to very fine sand, and
sparse granule conglomerate and pebbly sand which occur as lenticular channel-fill
units ranging from 10 to 25 ft (3-7 m). Well logs show that in subsurface most of
the sand bodies are less than 9 m (30 ft) thick, that they are commonly vertically
stacked, but rarely amalgamated. Intercalated floodplain sediments between
channel-fill units range up to 61 m (200 ft) thick. Interbedded with both channel
fill and floodplain sediments are numerous thin (less than 10 ft) sandstone bodies
which represent crevasse and splay facies and small tributary channel-fills.
The gently coastward dipping sediments of the Moulton Streamplain are crossed
by numerous growth faults associated with the Vicksburg and Frio Flexures. Numer
ous hydrocarbon fields of plays VI and VI I (pl. 14) produce from these sediments.
Santa Cruz Fluvial System
The Santa Cruz Fluvial System is at least 306 km (190 mi) wide and it extends
in subsurface beneath the Texas Coastal Plain a maximum distance of approximately
97 km (50 mi). It is traversed by three major fluvial complexes. These are, from
south to north, the Hebbronvi lIe Axis, George West Axis, and the New Davey Axis
(pl. 9). Each of the axes was delineated and named by Galloway, Henry, and Smith
(1982) •
The Hebbronville, largest of the three drainage systems, is the Miocene repre
sentative of the modern Rio Grande. Within Texas, the Hebbronville channel-fill
complex is more than 129 km (80 mi) wide, and a part of this system extends for an
29

undetermined distance into Mexico. Along the axis, sand distribution is character
ized by multiple dip-oriented, slightly sinuous, anastomosing, basinward bifurcat
ing belts most commonly 5 to 11 km (3 to 7 mj) wide. Isol ith trends for Unit A
display a generally southeastward orientation whereas those of Unit B possess a
stronger eastward orientation.
Sand content for major channel-fi 11 trends is 40 to 80 percent and 10 to 40
percent for floodplain facies. Net sand thickness ranges from 91 to 305 m (300 to
1000 ft) for both units A and B. Individual channel sand units are generally 6 to
15 m (20 to 50 ft) thick and commonly occur vertically stacked and amalgamated.
The George West Axis constitutes the locus of a major river on the Texas
Coastal Plain which appears to represent deposition of an ancestral Neches River.
Galloway, Henry, and Smith (1982) suggested that the George West and Hebbronville
axes are elements of an ancestral, single large, extrabasinal river system (Rio
Grande) and that the George West axis shifted southward during the early Miocene.
Based on study of sand isolith and sand percent maps (pIs. 3 through 6) the George
West and Hebbronville axes appear to have mainta(ned their relative positions and
identities throughout deposition of the Miocene MSU.
The George West Axis is physically similar to the Hebbronville Axis; however,
it is somewhat less extensive, possesses fewer major dip-oriented sand trends, and
the system probably del ivered less sediment to the Gulf than the Hebbronville
System.
Width of George West sand belts is 3 to 10 km (2 to 6 mil for Unit A and 3 to
16 km (2 to 10 mil for Unit B. Sand content of major sand isol iths is 40 to 60
percent, and net sand thickness is 61 to 213 m (200 to 700 ft) for Unit A and 122
to 213 m (400 to 700 ft) for Unit B. Sand unit thickness most commonly falls in
the range of 6 to 15 m (20 to 50 ft) with unit-thickness more than 23 m (75 ft)
relatively rare. Vertical stacking and amalgamation of these units is most common
30

in updip facies. Floodplain facies most commonly contain 30 to 40 percent sand,
and 30 to 107 m (100 to 350 ft) net sand thicknesses.
As pointed out by Galloway, Henry, and Smith (1982) the George West and most
likely the Hebbronville systems were characterized by bed-load streams.
The New Davey Fluvial Axis was described by Galloway, Henry, and Smith (1982)
as a major Oakvi lIe River. The system, which is much smaller, and less complex
than the Hebbronville and George West Systems (pl. 9) has been shown in this study
to be better developed in Unit A than Unit B. The principal sand belts are located
in parts of Karnes, De Witt, Goliad, Refugio, Victoria, and Calhoun Counties. The
major dendritically arranged sand belts generally are 3 to 8 km (2 to 5 mj) wide.
Sand content of major channel-f ill trends ranges from 40 to 60 percent, and sand
isol ith thickness is 61 to 213 m (200 to 700 ft) for Unit A and 122 to 213 m (400
to 700 ft) for Un it B. Average sand content for f 1 oodp 1 a i n fac i es is 30 to 40
percent and isol ith thickness is 30 to 107 m (100 to 350 ft) for Unit A and 61 to
107 m (200 to 350 ft) for Unit B. Approximately 40 percent of the channel-fill
sand units are 6 to 15 m (20 to 50 ft) thick, and approximately 15 percent are
thicker than 15 m (50 ft). Commonly, especially in updip facies, these sands occur
vertically stacked in sequences 61 m (200 ft) or more in thickness. Intercalated
and encasing facies include floodplain mudstones and thin crevasse splay facies.
Dominant structures of the Santa Cruz Fluvial System are growth faults of the
Vicksburg and Frio Flexures. Primary hydrocarbon production is associated with
downdip parts of the George West and New Davey Axes.
San Jacinto Delta System
The San Jacinto Delta System extends 322 km (200 mi) along strike from Mata
gorda County into Newton County, and for an undetermined distance into western
Louisiana. Most typical and extensive onshore delta development is centered in
Chambers, Jefferson and Orange Counties; the offshore, most distal parts of the
31

delta were not mapped as they are not included within the bounds of this study.
The boundary with the Indianola Barrier/Strandplain/Lagoon System is gradational
through a coastwise distance of at least 48 km (30 mi). The updip boundary with
the Cypress Fluvial System shifted during deposition of Miocene MSU through a zone
up to 48 km (30 mil wide in response to transgressive and regressive marine
fluctuations.
Shifting distributaries of the Cypress Fluvial System constructed multiple
coalescing delta lobes into the adjacent Gulf. These deltas, subjected to strong
destructive wave energy probably developed geometrically arcuate morphology as
illustrated by Fisher and others (1969).
Updip proximal deltaic sectors include an intricate complex of vertically and
laterally interfingering and overlapping facies, including marsh-lagoon, distribu
tary mouth bar, and various backbarrier sand facies. Such sequences reach a thick
ness of 366 m (1200 ft) and display variable sand content ranging from 30 to 50
percent. Galloway, Henry, and Smith (1982) pointed out that these facies are
difficult to distinguish except on the basis of their position relative to equIva
lent seaward facies, and to some degree to the extent of strike continuity of some
backbarrier facies. Proximal deltaic deposits occur in a significantly narrower
be 1 t than those of Un itA.
Gulfward blocky, strike-oriented deltaic sandstones are interpreted as
destructional bar and strandplain facies developed most representatively during
transgress ions. The fac i es I s the product of strong wave and longshore current
mod i f i cat i on of contemporaneous 1 y prograd i ng upd i p, arcuate deltas. Much of the
sand of this facies appears to have been transported westward from contemporaneous
de 1 ta lobes developed in western Lou i s i ana. Th I ckness of the vert i ca 11 y stacked,
blocky sand sequences ranges up to 396 m (1300 ft). Galloway and others (1982) in
explanation of similar thick sequences of the Frio Houston Delta suggested that
32

they are, in part, the product of transgressive reworking, and subsequent aggrada
tion of strandplain and destructional bar sands.
Delta front and prodelta/shelf facies are most characteristic of the lower,
downdip part of Unit A, but also occur as thin wedges interbedded with destruc
tional barrier and strandplain sequences in Unit B, and Upper Unit B (pls. 7
and 8).
Prodelta and shelf facies form vertically continuous sequences of mudstone
which cannot be accurately separated on log characteristics alone. The lower,
thicker parts of such sequences are properly included in the Discorbis and upper
Heterostegina Zones of the Anahuac Formation and overlying mudstones are classified
as prodeltaic facies. The mudstone wedge gradually thickens basinward, but where
crossing major growth faults thickness increase is commonly dramatic. Delta-front
facies are characterized by upward coarsening sequences that are generally less
than 91 m (300 ft) thick.
Dominant structures are regional growth faults, salt diapirs, and associated
sediment uplift and faulting. Contemporaneous fault displacement and initiation of
new faults served to accentuate the strike-orientation of the deltaic sand bodies.
Major hydrocarbon accumulation, dominantly oil, is primarily structurally
trapped with stratigraphic traps relegated to a secondary role. Traps occur on
both upthrown and downthrown sides of growth faults and in association with salt
produced structures. Thick, porous and permeable sands of the distal delta do not
serve as major reservoirs because they lack effective impermeable seals.
Indianola Barrier/Strandplain/Lagoon System
The San Jacinto Delta System grades southwestward Into the Indianola Barrier/
Strandp 1 a in/Lagoon System. The 1 atter system extends from southwestern Brazor ia
County to northeastern Nueces County, a distance of approximately 209 km (130 mil.
The System thus coincides with the updip, sand-poor, contemporary Moulton Stream-
33

plain and it lies immediately basinward of the Frio Greta/Carancahua Barrier/
Strandplain System of Galloway an'd others (1982). The Indianola System shifted
basinward more than 40 miles during deposition of the Miocene MSU, however, verti
cal upbuilding of sands was the dominant depositional pattern. The massive barrier/
strandplain sands, attaining a thickness in excess of 305 m (1000 ft) in Unit A and
610 m (2000 ft) in Unit B form an arcuate belt which curves seaward as it crosses
the San Marcos Platform. In Unit A these elongate sands overlie up to 274 m
(900 ft) of progradational delta front sediments, and more than 609 m (2000 ft) of
shelf and slope mudrocks. Along the basinward margin of the barrier/strandplain
trend these sands are interbedded with wedges of delta front, shelf and barrier
front facies. Along the updip margin of this trend these sands grade into and
interfinger with a variety of backbarrier, lagoonal, and fluvio-deltaic sediments.
The array of backbarrier facies, in turn, grade into and interfinger with fluvial
channel and floodplain/marsh facies.
The core of the thick sand trend is composed of elongated, vertically stacked
sand units up to 46 m (150 ft) thick. Sequences of these vertically stacked blocky
sand units with total thickness up to 305 m (1000 ft) are judged to represent
aggradational barrier deposits. The barrier trend of Unit A is oriented essen
tially parallel to the present shorel ine (pl. 7), and the Miocene depositional
strike. Unit B barriers form a wider, more complex trend with a north-south
orientation somewhat obl ique to the Miocene depositional strike. The dominant
barrier/strandplain sand source was provided by southwestward long-shore drift of
wave-destroyed deltas of the Penn and Burton stream systems. Streams of the Moulton
Streamplain delivered only comparatively minor quantities of sediment to the lagoon
system which lay landward of the barrier system. Sand content for the barrier/
strandplain complex ranges from 30 to 60 percent, and net sands are 900 to 1500
feet thick for Unit A and 305 to 701 m (1000 to 2300 ft) for Unit B.
34
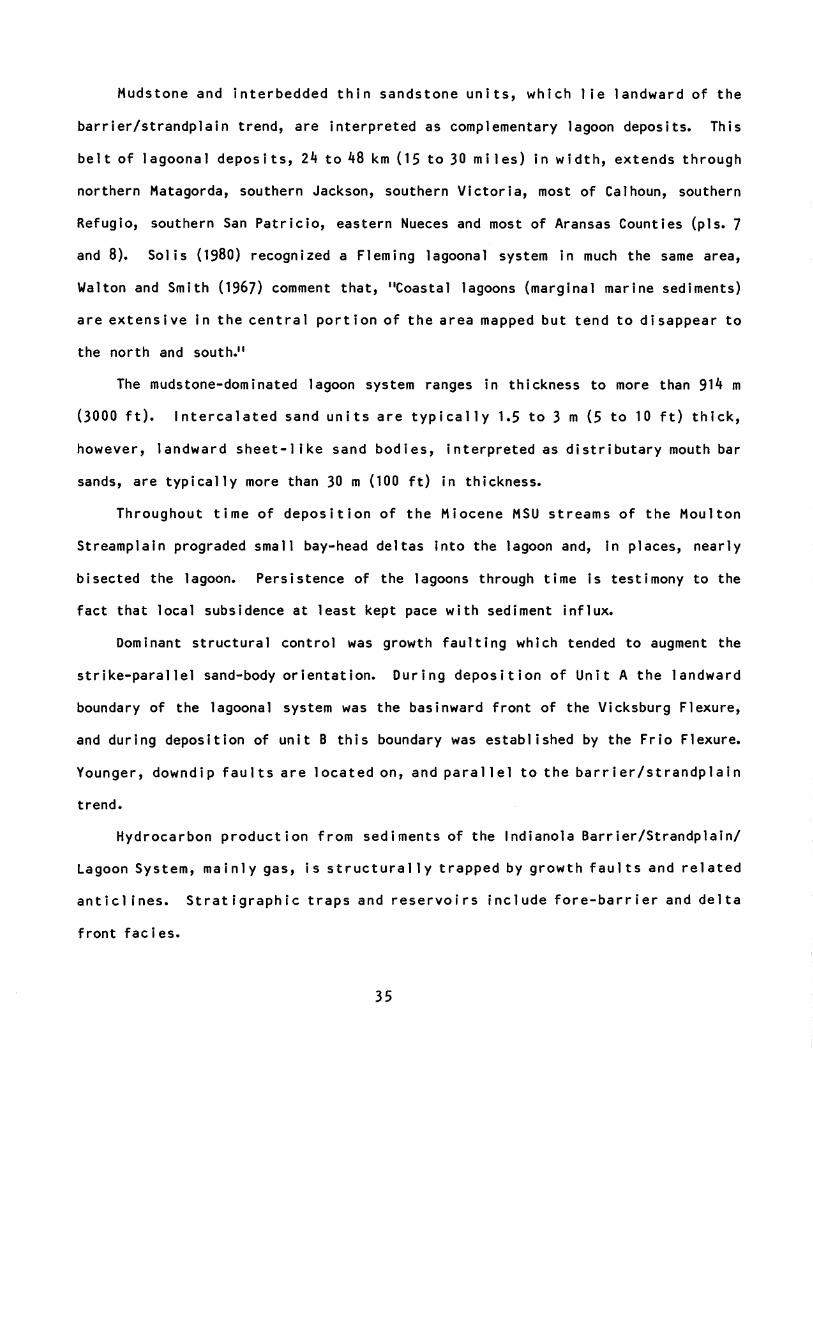
Mudstone and interbedded thin sandstone units, which I ie landward of the
barrier/strandplain trend, are interpreted as complementary lagoon deposits. This
belt of lagoonal deposits, 24 to 48 km (15 to 30 miles) in width, extends through
northern Matagorda, southern Jackson, southern Victoria, most of Calhoun, southern
Refugio, southern San Patricio, eastern Nueces and most of Aransas Counties (pIs. 7
and 8). Solis (1980) recognized a Fleming lagoonal system in much the same area,
Walton and Smith (1967) comment that, "Coastal lagoons (marginal marine sediments)
are extensive in the central portion of the area mapped but tend to disappear to
the north and south."
The mudstone-dominated lagoon system ranges in thickness to more than 914 m
(3000 ft). Intercalated sand units are typically 1.5 to 3 m (5 to 10 ft) thick,
however, landward sheet-l ike sand bodies, interpreted as distributary mouth bar
sands, are typically more than 30 m (100 ft) in thickness.
Throughout time of deposition of the Miocene MSU streams of the Moulton
Streamplain prograded small bay-head deltas into the lagoon and, in places, nearly
bisected the lagoon. Persistence of the lagoons through time is testimony to the
fact that local subsidence at least kept pace with sediment influx.
Dominant structural control was growth faulting which tended to augment the
strike-parallel sand-body orientation. During deposition of Unit A the landward
boundary of the lagoonal system was the basinward front of the Vicksburg Flexure,
and during deposition of unit B this boundary was established by the Frio Flexure.
Younger, downdip faults are located on, and parallel to the barrier/strandplain
trend.
Hydrocarbon production from sediments of the Indianola Barrier/Strandplain/
Lagoon System, mainly gas, is structurally trapped by growth faults and related
anticl ines. Stratigraphic traps and reservoirs include fore-barrier and delta
front fac i es.
35

Rosita Delta System
The Rosita Delta System extends 330 km (205 mil along strike from Refugio
County, Texas, and for an unmapped additional distance into adjacent Mexico. In
southwest Texas the delta sequence has a maximum mapped dip-oriented width of
105 km (65 mil and a recorded thickness of more than 1829 m (6000 ft). Offshore
segments were not included in this study. Northward along strike the system grades
into the Indianola Barrier-Strandplain-Lagoon System. A northward shift in the
bounday between those two systems following deposition of Unit A correlates with a
corresponding shift of the New Davey fluvial axis. The updip boundary with the
Santa Cruz Fluvial System shifted through a zone up to 80 km (50 mil wide partly in
response to transgressive and regressive fluctuations, but also in part to varia
tions in major stream courses of the Santa Cruz Fluvial System.
The southwestern segment of the delta system is largely the product of the
migrating channels of the Hebbronville fluvial axis. Northward, streams of the
George West and New Davey axes constructed smaller, coalescing delta lobes similar
to those of the San Jacinto System. Configuration and sand-body patterns indicate
that these deltas were wave-modified to strongly wave-dominated and that wave
eroded sands were dispersed southwestward by littoral drift.
Adjacent to the Santa Cruz Fluvial System proximal deltaic deposits form a
coastwise elongate belt up to 48 km (30 mj) wide. This depositional complex is
composed of a variety of interfingering overlapping and vertically stacked facies
including delta plain, upward-fining channel sands, splay-channel fill, blocky
laterally persistent channel-mouth bars, and to the northeast, lagoonal mudstones
and relatively thin sand units which formed in association with shifting and tem
porary barrier sand bodies. Mixed aggradational and progradational log patterns
are characteristic for this facies suite. Sand content along this belt is most
commonly 20 to 40 percent, but ranges upward to 80 percent in parts of Hidalgo,
36

Willacy, and Cameron Counties. Net sand also increases to the southwest; the
thickness reaches 518 m (1700 ft) in Unit A and 701 m (2300 ft) in Unit B.
Gulfward deltaic deposits are characteristically thick, strike-oriented des
tructional bar, barrier and strandplain sand bodies displaying blocky to serrate,
or funnel-shaped log responses. Combined characteristics of these sediments
suggest a high-energy system involving strong wave activity, storm-induced currents
and we ll-estab 1 i shed 1 i ttora 1 dr i ft systems. Sand un its 15 to 30 m (50 to 100 ft)
thick occur vertically stacked and commonly amalgamated, or separated only by thin
mudstone units. Sand content in this facies reaches 80 percent in the southwest,
but elsewhere is typ i ca 11 y 30 to 50 percent. Net sand th i ckness is greatest in
Cameron County where maxima of 518 m (1700 ft) and 640 m (2100 ft) are recorded for
Units A and B respectively. This trend is reversed for the Unit B sequence in
extreme southwestern Cameron County where both sand percent and net sand decrease
in a Gulfward direction. Here, and elsewhere along the lateral extent of the
system, the strike-oriented sand-bodies of Unit A overl ie 91 to 152 m (300 to
500 ft) of progradational, generally upward coarsening delta front deposits.
Delta-front sand units, including splay sands, thin fringe sands, and distributary
mouth bars are usually less than 15 m (50 ft) thick and occur vertically stacked
with shelf mudstone interbeds up to 30 m (100 ft) or more thick. These delta-front
facies rest, in downdip areas, on a thick sequence of shelf mudstone much of which
represents the Anahuac Formation. Downdip Unit B destructional bar and strandplain
sands are usually interbedded with relatively thin (less than 91 m, 300 ft) delta
front and shelf facies wedges.
The maximum Anahuac transgressive episode triggered by regional, or perhaps
worldwide, climatic warming, and represented by sediments of the Heterostegina
Interval Zone, initiated Miocene marine deposition along the entire Texas coast.
Concurrent progradation of the Rosita Delta System more effectively neutralized the
37

effect of this transgression than elsewhere along the coast, with the result that,
except in Cameron County, Anahuac shelf mudstones do not extend more than 8 to
24 km (5 to 15 mi) inland of the present coast line.
Dominant structures are growth faul ts and associated rollover anticl ines.
Thick, stacked, strike-oriented porous sands have not served as good hydrocarbon
reservoirs due to lack of effectively impermeable seals. Faulted sequences of
delta front facies composed of thinner sands and thicker interbedded mudstones
provide potentially excellent reservoirs.
HYDROCARBON PRODUCTION
General Statement
The Miocene MSU has produced nearly 3.0 bill ion bbl of oil and 7 trill ion
cubic feet of gas for a total of more than 4 bill ion boe of hydrocarbons. Included
in this total are hydrocarbons from fields discovered and developed during the
early part of the century as well as fields discovered, especially in downdip
coastal areas, during the past decade. Collectively Miocene MSU hydrocarbon pro
duction includes 30 counties, and 250 fields in shallow nearshore waters (pl. 14).
The hydrocarbon data base employed in this study was derived from fields
conta i n i ng more than 1 mill ion boe (Append i x). It is est i mated that these fie 1 ds
contain 95 percent of the known reserves of the Miocene MSU. This estimate is
consistent with the general observation that in other basins of the world most
hydrocarbons are produced from the large pools. It seems probable that errors
introduced by deleting smaller fields are less important than those introduced by
the incomplete records of early production for the largest, most prolific fields.
Geology of Hydrocarbon Plays
Each of the 10 Miocene MSU plays is characterized by a unique combination of
structural style, sedimentary facies suites, and hydrocarbon production. Thus,
38
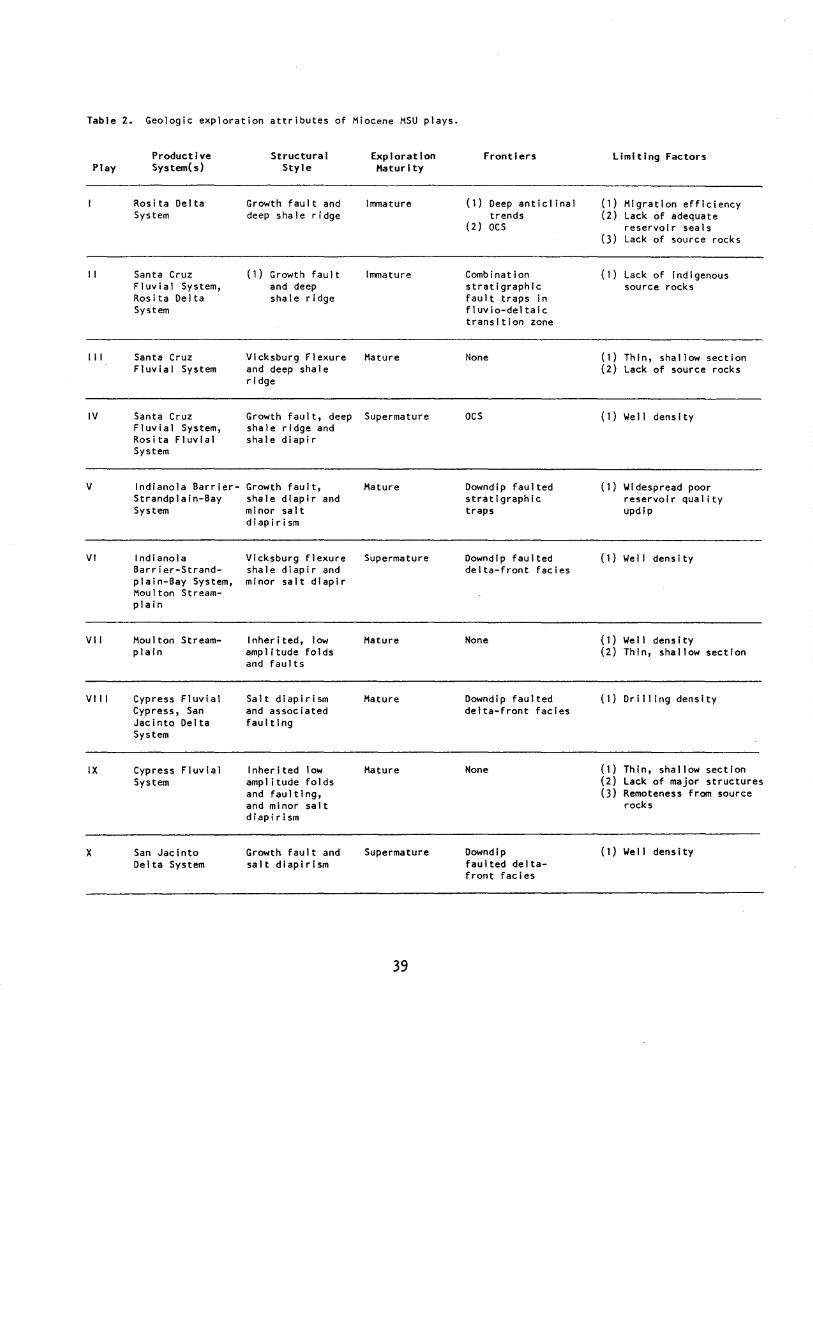
Table 2. Geologic exploration attributes of Miocene MSU plays.
Play
II
III
IV
V
VI
VII
VI II
IX
X
Productive System(s)
Ros i ta De Ita System
Santa Cruz Fluvial System, Rosita Delta System
Santa Cruz Fluvial System
Structural Style
Growth fault and deep shale ridge
(1) Growth fault and deep shale ridge
Vicksburg Flexure and deep shale rIdge
Exploration Maturity
Immature
Inmature
Mature
Santa Cruz Fluvial System, Rosita Fluvial System
Growth fault, deep Supermature shale ridge and shale diapir
Indianola Barrler- Growth fault, Strandplain-Bay shale dlapir and System minor salt
diapirism
Indianola Barrier-Strandplain-Bay System, Moulton Streamplain
Moulton Streamplain
Cypress Fluvial Cypress, San Jacinto Delta System
Cypress FluvIal System
San Jacinto Delta System
VIcksburg flexure shale diapir and minor salt dlaplr
Inherited, low amplitude folds and faults
Salt diapirism and associated faultIng
Inherited low amplitude folds and faulting, and minor salt diapirIsm
Growth fault and salt diapirism
Mature
Supermature
Mature
Mature
Mature
Supermature
39
FrontIers
(1) Deep anticlinal trends
(2) OCS
Combination stratigraphIc fault traps in fluvio-deltaic transition zone
None
OCS
Downdip faulted stratigraphic traps
Downdlp faulted delta-front facies
None
Downdlp faulted delta-front facIes
None
Downdip faulted deltafront facies
LImitIng Factors
(1) Migration efficiency (2) Lack of adequate
reservoir seals (3) Lack of source rocks
(1) Lack of Indigenous source rocks
(1) Thin, shallow section (2) Lack of source rocks
(1) Well density
(1) WIdespread poor reservoir quality updlp
(1) Well density
(1) Well density (2) Thin, shallow section
(1) DrillIng density
(1) ThIn, shallow sectIon (2) Lack of major structures (3) Remoteness from source
rocks
( 1) We 11 dens i ty

Table 3. Quantitative geologic attributes of Miocene MSU plays.
Rock Volume Structure >-oIJ
III-IC C:-IC
III Q)-Cl Q) "ON c: L.. - III ~ - E
Q) oIJ L.. III - ....... - E 0 Q) III N ~ Q) Q) ~ 4- c.. 4- - ~-- -- c:- Q)- c: Q) 4- IU o IU o u
E 0('1'\ 0('1'\ C:('I'\ oIJ 0 oIJ c: 04- Q) Q) > .- oIJ .- 0·- C:oIJ c: 0 L.."O L.."O Cl~
E III E oIJ E Q) III Q)oIJ III L.. Q) Q) Q) IU->- IU ~- "0- 111_ U"O U III Q) 0 .!J oIJ .!J c.. L.. IU Q) U c: "0 L.. c: L.."O
_ . ..., E- E c.. Q)
- L.. 0 IU ~ Q) IU Q) ~ .- IU ~ IU ~ IU > Q.. c( a::: V) x: Q..III 0.:. E X:E ZIII Z E c(
2,501 2,960 1,158 1,802 39.1 60.9 143 ° 65 0.03
II 3,546 2,640 1,192 1,448 45.3 54.7 191 2 113+ 0. 11 ~ 0
III 4,199 1,366 554 812 40.6 59.4 209 ° 21+ 1. 13
IV 2,373 1,731 672 1,059 38.8 61.2 194 ° 27 3.01
V 4,075 3,518 1,342 2,176 38.1 61.9 364 66 1.24
VI 2,891 1,623 522 1,101 32.6 67.4 345 74 1.85
VII 2,915 1,077 408 669 33.8 66.2 148 29+ 1.49
VIII 6,953 4,481 1,801 2,680 42.0 58.0 352 58 102 1.22
IX 3,080 1,012 478 534 47.2 52.8 minimal 6 not 0.93 mapped
X 3,321 3,167 1,568 1,599 49.5 50.5 76 19 42 1.50
Totals 35,864 23,575 9,695 13 ,880 2022+ 88 539+
** <0.5/mi 2 = immature; 0.5-1.5/mi 2 = mature; >1.5/mi 2 = supermature
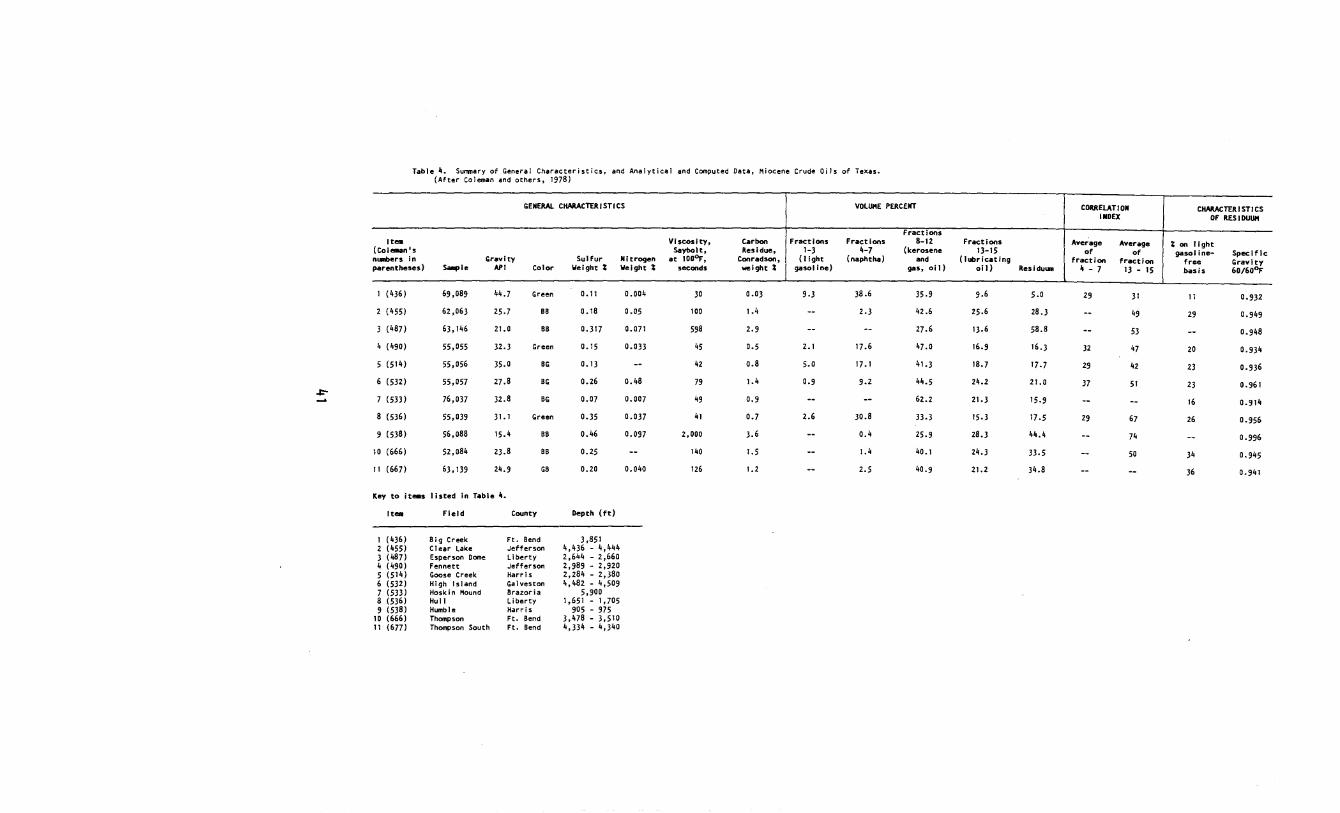
~
Table 4. SUlTlllary of General Characteristics, and Analytical and Computed Data, Miocene Crude Oils of Texas. (After Coleman and others, 1978)
GENERAL CHARACTER I STI CS VOlUl1E PERCEIrT
Fractions It ... Viscosity, Carbon Fractions Fract ions 8-12
(Coll1!11NJn l s Saybolt, Residue, 1-3 4-7 (kerosene nwabers in Gravity Sulfur Nitrogen at 100or, Conradson, (I ight (naphtha) and parentheses) SaIople API Color Weight ~ Weight ~ seconds weight ~ 90501 ine) gas, oil)
(436) 69,089 44.7 Green 0.11 0.004 30 0.03 9-3 38.6 35.9
(455) 62,063 25.7 BB 0.18 0.05 100 1.4 2.3 42.6
3 (487) 63,146 21.0 BB 0.317 0.071 598 2.9 27.6
(490) 55,055 32.3 Green 0.15 0.033 45 0.5 2.1 17.6 47.0
5 (514) 55,056 35.0 BG 0.13 42 0.8 5.0 17.1 41.3
(532) 55,057 27.8 BG 0.26 0.48 79 1.4 0.9 9.2 44.5
(533) 76,037 32.8 BG 0.07 0.007 49 0.9 62.2
(536) 55,039 31.1 Green 0.35 0.037 41 0.7 2.6 30.8 33.3
9 (538) 56,088 15.4 BB 0.46 0.097 2,000 3.6 0.4 25.9
10 (666) 52,084 23.8 BB 0.25 140 1.5 1.4 40.1
11 (667) 63,139 24.9 GB 0.20 0.040 126 1.2 2.5 40.9
Key to ite.s I isted in Table 4.
It ... Field County Oepth (ft)
( 436) Big Creek Ft. Bend 3,851 2 (455) C I ear Lake Jefferson 4,436 - 4,444 3 (487) Esperson Dome Li berty 2,644 - 2,660 4 (490) Fennett Jefferson 2,989 - 2,920 5 (514) Goose Creek Harr i s 2,284 - 2,380 6 (532) High Island Ga 1 veston 4,482 - 4,509 7 (533) Hosk i n Mound Brazod a 5,900 8 (536) Hull Liberty 1,651 - 1,705 9 (538) Humble Harr i 5 905 - 975
10 (666) Thompson Ft. Bend 3,478 - 3,510 11 (677) Thompson South Ft. Bend 4,334 - 4,340
CORRELATION CHARACTER I STI CS INOEX OF RES I OUUI1
Fractions Average Average = on light 13-15 of of ga501 ine- Specific
( lubricating fraction fraction free Gravity oil) Residu ... 4 - 7 13 - 15 basis 60/6oor
9.6 5.0 29 31 11 0.932
25.6 28.3 49 29 0.949
13.6 58.8 53 0.948
16.9 16.3 32 47 20 0.934
18.7 17.7 29 42 23 0.936
24.2 21.0 37 51 23 0.961
21.3 15.9 16 0.914
15.3 17.5 29 67 26 0.956
28.3 44.4 74 0.996
24.3 33.5 50 34 0.945
21.2 34.8 36 0.941
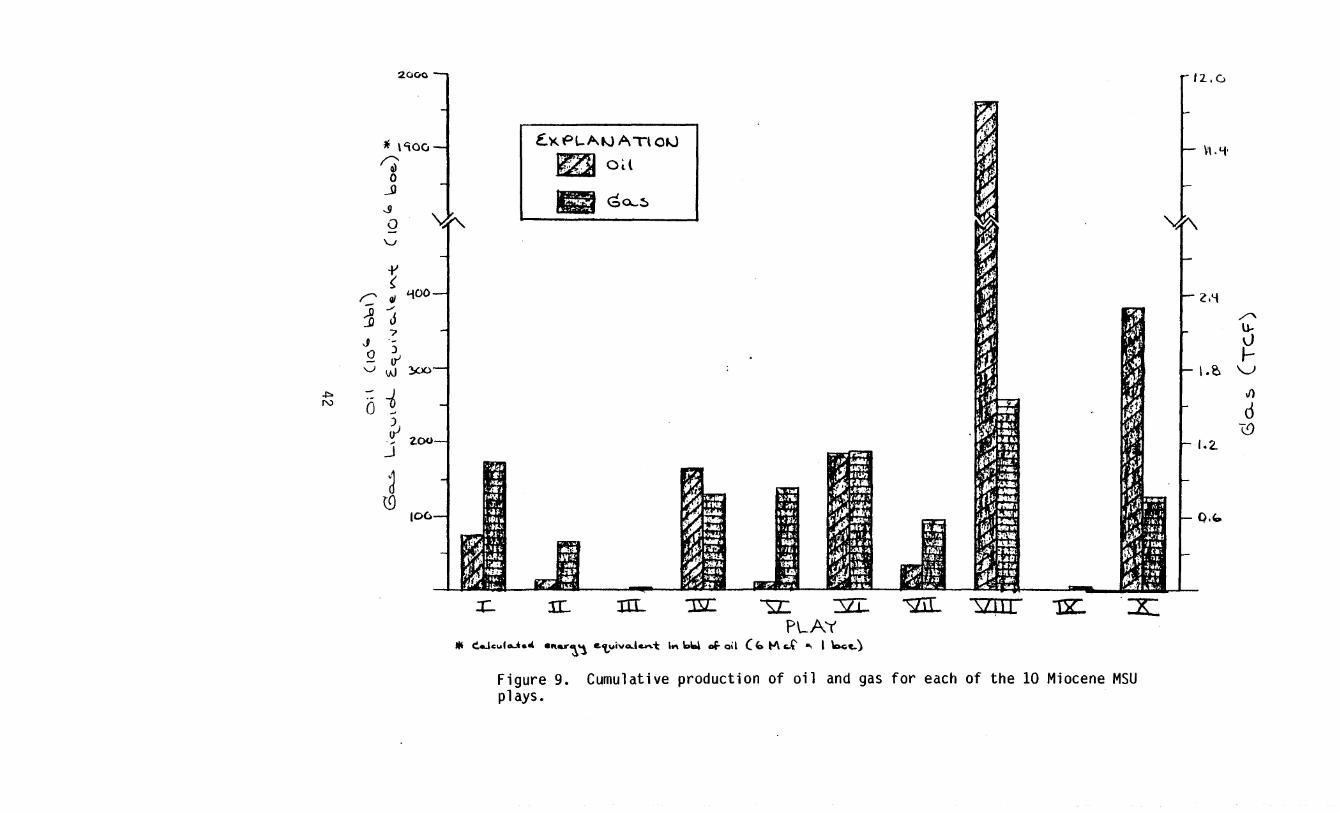
20 ClO
*\, )C,
~ o
.JI -.9 0
v
r r' IJI - ./
~ J
00 'i
7 -J '-) 0 IY VvJ 00
~ :: ~ N o __ ~ ., z.oo
--1
d (0
to()
f.'K PLA~ AT' at..)
m all
• G<4...~
::c.. lL m... "E: '.Q: ::szr:. "'SZIL "IX:. :x: PLAY
... eeJculoJ." ."U'~~ &'tujv....t~t I~ \:oW oi- oil ('" tJ\ "t .. I k.c.t..)
Figure 9. Cumulative production of oil and gas for each of the 10 Miocene MSU plays.
2.G
\:\.'-t'
v-t /"' U-v J-
I.~ \.....)
J)
d '0
1.2.
Q.b

such a subdivision of the Miocene MSU sedimentary prism permits systematic and
meaningful evaluation of the relationships between hydrocarbon occurrence and
geologic control. Geologic exploration attributes for each play are summarized in
tables 2 and 3; crude oil analyses are presented in table 4. Cumulative production
of oil and gas by play is shown on figure 9.
Play
Play I (pl. 14) is a gas-prone division which lies within a distal part of the
Rosita Delta System. The play, which has been sparsely explored, has a drilling
density of only 0.03 well/mile2 (table 3). Dominant facies include thick
strandplain and destructional barrier sands and thinner delta front sand facies.
Sandstone percentages of 40 to 70 characterize much of the play, and net sand
values range to 518 m (1700 ft) in each of the delineated operational units.
Thick, porous stacked sands (6-15 per 305 m, 1000 ft) are abundant but due to lack
of effective shale seals may not constitute high-quality reservoirs. Thinner delta
front sands, intercalated with relatively thick shales are potentially excellent
reservoirs. Downdip mudrocks, in part Miocene and in part of Frio age, are poten
tial hydrocarbon source rocks, however, according to Galloway and others (1982),
the hydrocarbon source quality of the Frio mudrocks is poor.
Major structures are growth faults with associated roll-over anticlines and
deep shale ridges. The top of the Miocene MSU lies between -762 to -1067 m (-2500
and -3500 ft), and total thickness of the unit is approximately 1219 to 2286 m
(4000 to 7500 ft). Greatest sediment thickness occurs in southern Cameron County.
Play I I
Play I I is a poorly explored gas-prone division with few fields and a drilling
density of only 0.11 wells/mi 2 (pl. 14 and table 3). The play corresponds to a
downdip section of the Santa Cruz fluvial system, and proximal delta facies of the
Rosita delta system (pl. 9). Potential reservoir facies include thick, elongated,
43
strandplain sands, distributary mouth bars, and channel-fill sands. Potential for
stratigraphic traps is especially high in the transitional zone between deltaic and
fluvial systems, where interfingering of sand and shale units should be at a
maximum for the play.
Sand percentages are generally 30 to 50 percent, but range to 70 percent in
predominantly deltaic environments. Net sand values for each operational unit are
most commonly 152 to 274 m (500 to 900 ft) but reach 518 to 701 m (1700 to 2300 ft)
where associated with major growth faults. Mudrocks comprise slightly more than 50
percent of total play volume but are thermally immature, therefore hydrocarbon
sources are confined to downdip, offshore Miocene mudrocks, or to underlying older
units.
Dominant structures are growth faults, deep-seated anticlinal ridges. Hydro
carbons should be associated with faulting, anticlinal rollovers, and stratigraphic
traps. Top of the Miocene MSU occurs between -305 and -610 m (-1000 and -2000 ft)
and thickness of the unit ranges from 762 to 1676 m (2500 to 5500 ft).
Play III
Play III, a large, gas-prone division (pl. 14), extends along the entire updip
breadth of the Santa Cruz fluvial system. The play is characterized by minor gas
production (fig. 9), and by a drilling density of 1.13 wells/mi 2 (table 3).
Miocene mudstones of this play are thermally immature, and underlying Frio mud
stones (Galloway and others, 1982) have undergone inadequate thermal maturation for
oil generation.
Sand percentages for each operational unit are variable, ranging from 10 to 50
percent for floodplains and 50 to 80 percent for dip-oriented fluvial sand belts.
Net sand values for each operational unit are 30 to 91 m (100 to 300 ft) for
floodplains, whereas major fluvial sands range from 91 to 213 m (300 to 700 ft).
44

Stacked and amalgamated channel-fi 11 sands encased in finer floodplain sediments
constitute the primary reservoir rocks.
The Vicksburg Flexure extends across Play III, however, fault displacement of
Miocene sediments along the flexure seems minimal and basically confined to
Operational Unit A. Two salt diapirs occur in Brooks County. The top of Miocene MSU
occurs between -152 and -305 m (-500 and -1000 ft), and thickness of the unit is 457
to 610 m (1500 to 2000 ft).
Play IV
Play IV is a heavily explored oil-prone play (table 2) which also has produced
significant quantities of gas. It corresponds to a downdip part of the Santa Cruz
fluvial system and the northwestern part of the Rosita delta system.
Potential reservoir facies are similar to those described for Play II. The
transitional area between updip fluvial and downdip deltaic systems is relatively
broad (16 to 24 m, 10 to 15 mil and was the site of considerable fluvial prograda
tion during deposition of Operational Unit B. It is in this intermediate zone,
where growth faults of the Frio Flexure are common, and where the Anahuac shale
wedge is absent, that hydrocarbon production is concentrated. It appears that the
ultimate hydrocarbon source is from the underlying Frio, or older units.
Traps are rol lover anticlines, growth faults with closure on the upthrown
block, and sandstone pinchouts.
Top of the Miocene MSU occurs at -457 to -762 m (-1500 to -2500 ft), and total
thickness of the unit ranges from 762 to 1829 m (2500 to 6000 ft).
Play V
Play V is a gas-prone province that coincides with the downdip part of the
Indianola Barrier-Strandplain-Lagoon System. It is a maturely explored play with a
drilling density of 1.24 wells/mi 2 (table 3).
45
Dominant facies include thick barrier and strandplain strike-oriented sands
behind which lie a variety of backbarrier-lagoon sand and mudstone deposits. Back
barrier sands, such as washover fan facies, which pinch out into bay mudstones
provide excellent stratigraphic traps (Geehan, Grimes, and Swanson, 1983). Thicker
barrier and strandplain bodies may be relatively unproductive because they commonly
1 ack effect i ve sea 1 s.
Generally, bay facies are characterized by 15 to 30 percent sand content, and
sand units are thin. Barrier and strandplain facies are characterized by 50 to 75
percent sand. Net sands along barrier trends range to 640 m (2100 ft) in Opera
tional Unit Band 396 m (1300 ft) in Operational Unit A as compared to 91 to 274 m
(300 to 900 ft) for backbarrier counterparts.
Growth faults and associated anticl inal folding are the chief structural
traps. As pointed out by McCarthy (1970), displacements along faults in coastal
Calhoun and Matagorda Counties cause gentle anticl inal closures which trap gas.
Source of the hydrocarbons of this play are presumably both offshore, downdip
Miocene mudstone, and underlying Frio, and possibly older units. Top of the
Miocene MUS occurs at -610 to -1371 m (-2000 to -4500 ft), and total thickness is
1219 to 1676 m (4000 to 5500 ft).
Play VI
Play VI, a significant producer of both gas and oil (fig. 9), has a well
density of 1.84 wells/mi 2• The play extends across the downdip section of the
Moulton Streamplain, includes a part of the Santa Cruz fluvial system, and incor
porates a narrow, updip strip of the Indianola Barrier-Strandplain Lagoon system.
Reservoir facies include relatively thin, but stacked channel-fill sands,
wh i ch occur interconnected with permeable sheet and sp 1 ay fac i es. These systems
are encased in generally thick impermeable floodplain mudstones. Bay deposits,
largely confined to Operational Unit A, are characterized by thin sand units inter-
46

bedded with thicker mudstones, low sand percentages (15 to 25 percent), and low
hydrocarbon production.
Growth faults of the Vicksburg Flexure are the dominant structures of the
play. Five shale diapirs are mapped in Jackson and Calhoun Counties
(Bishop, 1977).
Contained hydrocarbons are not indigenous to the play sediments. The thin
updip edge of the Anahuac Shale underlies much of the play, but apparently because
of heavy faulting did not prevent migration of Frio and possibly older hydrocarbons
updip into Miocene reservoirs.
Top of the Miocene 1 ies at -305 to -610 m (-1000 to -2000 ft), and thickness
of the unit is 610 to 1219 m (2000 to 4000 ft).
PlayVl1
Play VII is gas-prone with 1 imited oil production (fig. 9). The play, which
extends across the updip part of the Moulton Streamplain, has a supermature drill
ing density of 1.85 wells/mi 2 (table 3).
Reservoir facies are similar to those described for Play VI, however, in Play
VI I major sand belts are thicker and broader. Sand percentages reach 65 to 70
percent in these belts and net sands range from 30 to 183 m (100 to 600 ft) for
each operational unit. Sand content in the broad floodplain areas is generally 25
to 40 percent.
Major growth faults are primarily confined to the downdip part of the play.
Updip from the faulted zone, the Anahuac shale wedge is absent, and thus there is
no apparent obstruction to upward migration of Frio and older unit hydrocarbons
into Miocene reservoir facies. Top of the Miocene MSU lies at -157 to -457 m (-500
to -1500 ft), and total Miocene MSU thickness is 152 to 762 m (1500 to 2500 ft).
Play VI II extends across the downdip one-half of the Cypress fluvial system,
and into the San Jacinto delta system (pl. 9). This play, the most prol ific
47
producer of Miocene 0 i 1 and gas, has a we 11 dens i ty of 1.22/m i 2 (tab 1 e 3). Reser
voir facies include multistoried channel-fill sands, high-porosity, wave-reworked
deltaic sands, and the delta front sands of Operational Unit A. The Anahuac shale
wedge underlies the entire play. Fluvial facies are most extensive in Operational
Unit B, where channel-fill facies are broader and thicker than in the lower unit.
Likewise barrier and strandplain facies of Unit B are thicker and more extensive
than those of Un itA.
Dominant structures are growth faults and numerous salt diapirs with
associated sediment uplift, Heterostegina coral reefs (Cantrell, 1959; Ellisor,
1926), and faulting.
Top of the Miocene MSU occurs between depths of -305 to -1372 m (-1000 to
-4500 ft), and tota I th i ckness (p 1. 2) of the un it ranges from 762 to 1372 m (2500
to 4500 ft).
Play IX
Play IX is an unimportant gas producer which extends across the breadth of the
Cypress Fluvial system. Drilling density is 0.93 wells/mi 2, primarily as a product
of exploration for deeper targets (table 3).
Major structures are absent within the play therefore hydrocarbons are most
likely to be stratigraphically trapped. The lack of major structures and thermally
mature source rocks combine to make the play unattractive for Miocene hydrocarbon
exploration. Top of the Miocene MSU lies at -152 to -305 m (-500 to -1000 ft) and
total thickness of the unit ranges from 457 to 610 m (1500 to 2000 ft).
Play X
Play X, confined to the San Jacinto delta system, has produced relatively
large quantities of oil and gas (fig. 9). Drilling density for the play is 1.50
wells/mi 2 (table 3).
48

The proportion of sandstone is high, amounting to 49 percent (table 3). Res-
ervoir facies include thick, stacked progradational and aggradational destructional
barrier and strandplain units and thinner progradational delta front sands.
Miocene mudstones of the play are probably all thermally immature, however,
thermally mature source rocks do occur in the underlying Frio and in the offshore
Miocene. Traps include faulted anticl ines above deep salt diapirs (Rieter, 1959)
and growth faults. Stratigraphic traps are most characteristic of the delta front
facies.
The top of the Miocene MSU 1 ies between -762 to -1219 m (-2500 and -4000 ft)
and total thickness ranges from 1219 to 1829 m (4000 to 6000 ft).
EVALUATION OF REMAINING RESOURCE POTENTIAL
Miocene MSU Source Rock Quality
Resource evaluation methods involving contemporaneous source rock quality do
not have application to the Miocene MSU. Available evidence strongly supports the
view that the Texas onshore Miocene MSU lacks entirely, or contains a negligible
volume of thermally mature hydrocarbon source rocks. Dow (1978) defined a source
bed as:
••• a un i t of rock that has generated and expe 11 ed 0 i 1 or gas, in sufficient quantity to form commercial accumulations. Must meet minimum criteria of organic richness, kerogen type and thermal maturity.
On the basis of vitrinite reflectance (Ro) values, a technique commonly
applied to assess the petroleum maturation level, Dow (1978) delineated the
probable oi I-generating interval (0.6 to 1.35 percent Ro) in the Louisiana Gulf
Coast (fig. 10). He concluded that Louisiana Gulf Coast hydrocarbon production,
including that of the Miocene, is from thermally immature progradational facies,
which overlie older thermally mature slope and rise facies. Young and others
49
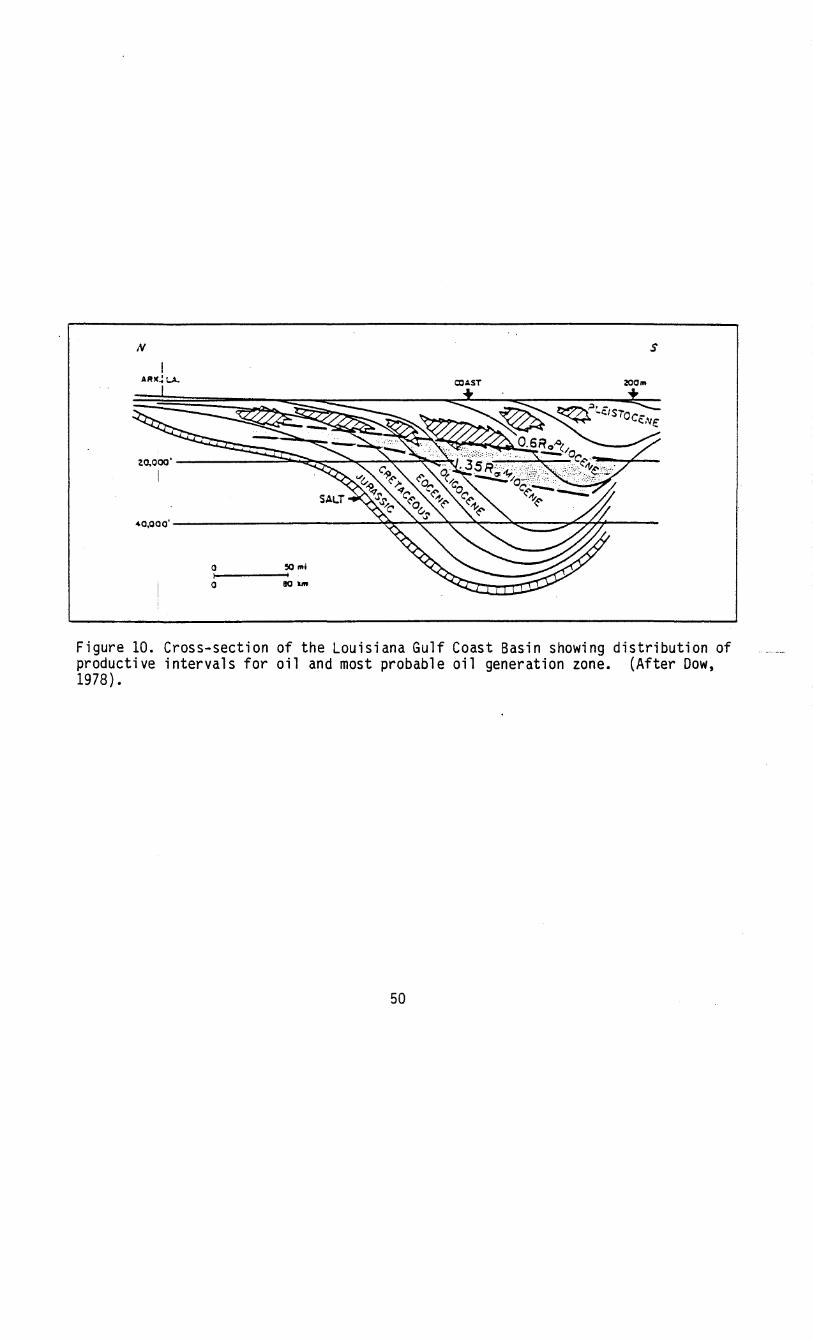
N s
ARK~U. COAST zoo ...
z~ooo'----------~~~~~~--~~~~ I
40,000' --------------------~::._~--"~~::_~:::::::::=;:::;:o"'777----
o ~ ... i I I o eo km
Figure 10. Cross-section of the Louisiana Gulf Coast Basin showing distribution of productive intervals for oil and most probable oil generation zone. (After Dow, 1978) •
50

KEROGEN MATURATION PROFILE
}}:I I I I "H{1i" \] CRE~ACEOU~ 5. OOO·I--""I
(1977) demonstrated that offshore Gulf Coast oils average 8.7 m.y. older than their
reservoirs. This, if true, suggests that most oil of the Texas Miocene MSU
originated from rocks of the Vicksburg Stage.
Dow presented composite profiles of vitrinite reflectance for the Cretaceous
through Plio-Pleistocene in the Louisiana Gulf Coast. According to this plot (fig.
11) the temperature which corresponds to the minimum requirements for inception of
oil-generation (0.6 Ro) is approximately 2900 F for the upper Miocene, and 2650 F for
the lower/middle Miocene. This stated temperature range occurs in Louisiana at
depths of 12,000 to 13,500 feet. Virtually none of the onshore Texas Miocene MSU
deposits occur where the temperature reaches or exceeds 265 0 F. It may be noted
that even through hydrocarbon generation can begin early in the thermal history of
a sedimentary sequence, commercial quantities probably are not expelled from the
source rocks until the principal phase of generation is attained (Dow, 1978;
Momper, 1978; and Ronov, 1958).
Both in the Rio Grande and Houston Embayment areas the Miocene deltaic
sediment accumulation rate was only 152 to 213 m (500 to 700 ft/m.y.). The
relatively low Miocene rate is partly the product of the sediment-spreading effect
of persistent wave-reworking, and massive coast-wise sediment transport. In such
high-energy environments the organic material would have been intensively degraded.
Degradation can seriously impair by hydrogen reduction, the generating capability,
and can revise upward the minimum quantity of organic material needed for
hydrocarbon expulsion (Momper, 1978; Ibach, 1982).
The only detailed source of organic geochemical data for the Texas Miocene MSU
is that presented by Brown (1979) for the DOE/GCO Pleasant Bayou nos. 1 and 2 wells
in Brazoria County. In both of these wells the Miocene lies above the oil
maturation interval where down-hole temperature exceeds 2350 F and vitrinite
reflectances are at least 0.5 Ro. Brown concluded that, with the exception of an
anomalous, very thin interval near 2137 m (7000 ft), the entire evaluated section,
52

Figure 12. Location and boundaries of Railroad Commission of Texas (RRC) Districts 2, 3, and 4.
53

tTl .j:::.
,,/'--- )~~ y
/' .. '- \~%-'
. \+C€"{..~"~l , --, / -. + .. ~ ~ )
/~~O\~ y(TRINl,/,' '''':;.- «'
, J~ r-T ' ' ,/' .,. I '" ,WALKER '1'\, POlJ(' ,/ '\. 'a' ~ \ TYLER
/\~URLESOH ,"'( ~ t>-J .................. SA~ / ~ LEE 'J-' l..J \:::3@},~
/,.:S:'~):;':: .'"" BOA <fu"AOAL~\. _7 .. .: . • R \ L.?··"7:'<i:·~9~I!!'~UU:.? h- I'- - GONZALES }{, ............ ~
! -'_(WilSON : ... I ATASCOSA'
\of GU
Of ~E.
,,0 .,.'
N
, o ..... I o .. _
EXPLANATION Hum .... ef Well,
I::::::! 0- Z4' E2:3 z:,o-4t9
0 500-.99
1,,:,>11000-,499 §"@l'5OO-1999 mmm z000-Z499 ~ Z:IOO- 2999
.. 3000-
Figure 13. Total number of wells drilled in each county of RRC Districts 2, 3, and 4.
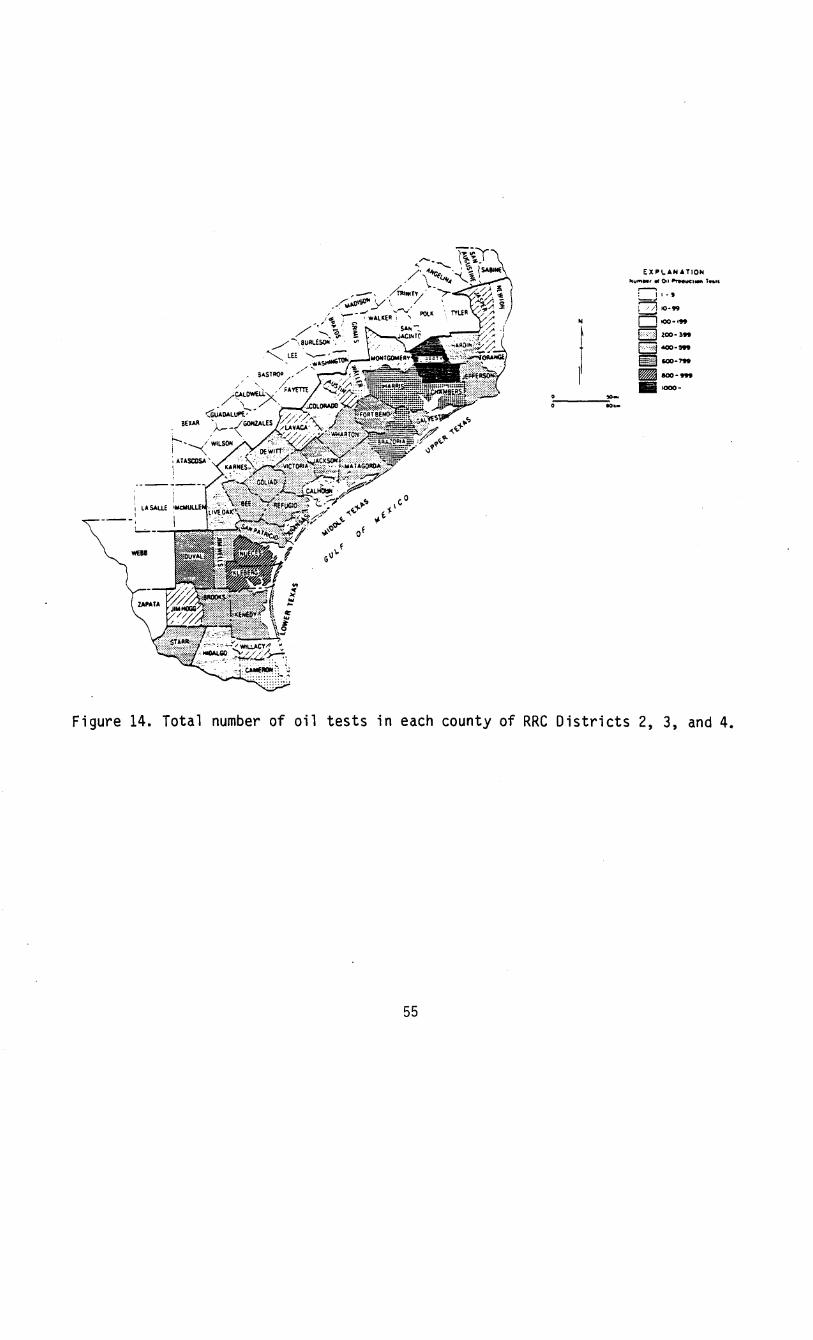
EXPlANATION
N
I ::-----:::
Figure 14. Total number of oil tests in each county of RRC Districts 2, 3, and 4.
55

£U'\. ... N ... TION
N
I !---~::
Figure 15. Total number of gas tests in each county of RRC Districts 2, 3, and 4.
56

,. <: o le <: o ... ... )C
1M
I~
".
1966
,. ,.
I /
/ .i
I
." .l c.' .,"
~.' .,<.. / ~,,/ ,. ,.
i ,.
197'0 1980
Figure 16. Historical changes of drilling density (mi 2 per exploratory well) for RRC Districts 2, 3, and 4. (After H. O. Woodbury and others, 1973).
57

including the Frio, is thermally immature, and that it has no significant potential
for generating producible quantities of either liquid or gaseous hydrocarbons.
Evaluation Methods
In this study three historical approaches, discussed in detail by Galloway and
others (1982), were employed to evaluate ultimate discovered and undiscovered
hydrocarbons of the Texas Miocene MSU. These methods, br i ef 1 y descr i bed be low,
were used to evaluate both the Texas Railroad Commission Districts 2, 3 and 4, and
the ten (fig. 12) delineated exploration plays. Figures 13, 14 and 15 show the
areal distribution of the total numbers of weI Is and of oil and gas production
tests in the study area. Change in average density for each district is shown in
figure 16.
The first evaluation method plots discovery rate against the cumulative number
of exploratory wells. This method defines the limit of the number of exploratory
wells to be dri lIed in an area (j.e., 1 well/mi 2). On this basis it is possible
to estimate the ultimate number of wells to be drilled in an area. A disadvantage
to the method is that fluctuations in economic conditions are not considered.
The second method plots amounts of discovered oil and gas per footage drilled
by exploratory wells each year against cumulative footage of exploratory wells
(Davis, 1958; Zapp, 1961 and 1962). This method, in addition to limiting drilling
density, considers economic factors. As concluded by White and Gehman (1979)
extrapolations have the advantage of being tied directly to the realities of
experience.
Comparative Results
Estimates of remaining hydrocarbons using the three described evaluation
methods, are summarized for Texas Railroad Commission Districts in tables 5 through
11, and for the 10 plays in table 12 through 19.
58

Table 5. Statistical summary of recoverable oil, million bbl (cumulative-well-number method). (Modified from Galloway, Hobday and Magara, 1982)
\T1 \.0
Location
Dist. 2 All formations (11,000 mi 2) Miocene (% of above)
Dist. 3 All formations (30,000 mi 2) Miocene (% of above)
Dist. 4 All format ions (21,000 mi 2) Miocene (% of above)
Dist. 2, 3, 4 All formations Total Miocene (% of above)
* Source: API, 1978 ** Source: AAPG (1943-1978)
* Oil discovery before 1942
1,884
6,663
2,078
10,625
** Total Oil discovery oil discovery
1942-1977 by 1977
662 2,546 183 (7.2)
907 7,570 2,393 (31.6)
979 3,057 261 (8.5)
2,548 13,173 2,837 (21.5)
Oil to be discovered up to a drill density Total
of 0.5 mi 2/well recoverable
50 2,596 4 (7.2) 187 (7.2)
410 7,980 130 (31.6) 2,522 (31.6)
169 3,226 14 (8.5) 275 (8.5)
629 13,802 148 (23.5) 2,984 (21.6)

Table 6. Statistical summary of recoverable gas, bcf (cumulative-well-number method). (Modified from Galloway, Hobday and Magara, 1982)
Location
Dist. 2 All formations (11,000 mi 2) Miocene (% of above)
Dist.3 All formations (30,000 mi 2) Miocene (% of above)
Dist. 1t All formations (21,000 mi 2) Miocene (% of above)
Dist. 2, 3, 1t All formations Total Miocene (% of above)
Miocene liquid equivalent
Gas discovery before 191t2
12,206
30,564
22,839
65,609
Bcf (0.16667 mill bbl) = million bbl Bcf
'" o
Gas discovery 191t2-1977
12,857
22,640
26,543
62,040
Total gas discovery
by 1977
25,063 1,057 (4.2)
53,204 3,744 (7.0)
49,382 2,275 (4.6)
127,649 7,076 (5.5)
1,179 mi 11 ion bb 1
Gas to be discovered up to a drill density
of 0.5 mi2/well Total
recoverable
3,159 28,222 133 (4.2) 1,190 (4.2)
93,750 146,954 6,563 (7.0) 10,307 (7.0)
9,051 ,58,433 416 (4.6) 2,691 (4.6)
105,960 233,609 7,112 (6.7) 14, 188 ( 6. 1)
1,185 2,364 mi 11 ion bb 1 mi 11 ion bb 1

Table 7. Statistical summary of recoverable oil, million bbl (cumulative-footage method). (Modified from Galloway, Hobday and Magara, 1982)
Location
Dist. 2 All format ions (11,000 mi 2) Miocene (% of above)
Dist. 3 A 11 format ions (30,000 mi 2) Miocene (% of above)
Dist. 4 All formations (21,000 mi 2) Miocene (% of above)
Dist. 2, 3, 4 All formations Total Miocene (% of above)
0'
Oil discovery before 1942
1,884
6,663
2,078
10,625
Oil discovery 1942-1917
662
907
979
2,548
Total oil discovery
by 1917
2,546 183 (] .2)
7,570 2,393 (31.6)
3,057 261 (8.5)
13,173 2,837 (21.5)
Oil to be discovered up to exploratory footage
of 15,000 ft/_i 2
83 6 (] .2)
553 175 (31.6)
265 23 (8.5)
901 204 (22.6)
Total recoverable
2,629 189 (7.2)
8,123 2,568 (31.6)
3,322 284 (8.5)
14,074 3,041 (21.6)

Table 8. Statistical summary of recoverable gas, bcf (cumulative-footage method). (Modified from Galloway, Hobday and Magara, 1982)
Gas discovery Location before 1942
Dist. 2 All formations 12,206 (11,000 mi 2) Miocene (% of above)
Dist. 3 All formations 30,564 (30,000 mi 2) Miocene (% of above)
Dist. 4 All formations 22,839 (21,000 mi 2) Miocene (% of above)
Dist. 2, 3, 4 All formations 65,609 Total Miocene (% of above)
Miocene liquid equivalent
Bcf (0.16667 mill bbl) = million bbl
C1' N
Bcf
Total Gas discovery gas discovery
1942-1977 by 1977
12,857 25,063 1,057 (4.2)
22,640 53,204 3,744 (7.0)
26,543 49,382 2,275 (4.6)
62,040 127,649 7,076 (5.5)
1,179 mi 11 ion bbl
Gas to be discovered up to exploratory Total
footage of 15,000 ft/mi2 recoverable
4,618 29,681 194 (4.2) 1,251 (4.2)
103,927 157,131 7,275 (7.0) 11,019 (7.0)
15,116 64,498 695 (4.6) 2,970 (4.6)
123,661 251,310 8,164 (6.6) 15,240 (6.0)
1,361 2,540 million bbl mi 11 ion bbl

0" w
Table 9. Statistical summary of recoverable oil, million bbl (discovery-versus-time method). (Modified from Galloway, Hobday and Magara, 1982)
Total oil discovery Oil to be Total
Location by 1977 discovered recoverable
Dist. 2 All formations 2,546 482 3,028 Miocene (% of above) 183 (] .2) 35 (7.2) 218 (] .2)
Dist. 3 A 11 format ions 7,570 1,172 8,742 Miocene (% of above) 2,393 (31.6) 370 (31.6) 2,763 (31.6)
Dist. 4 A 11 format ions 3,057 573 3,630 Miocene (% of above) 261 (8.5) 49 (8.5) 310 (8.5)
Dist. 2, 3, 4 All format ions 13,173 2,227 15,400 Total Miocene (% of above) 2,837 (21.5) 454 (20.4) 3,291 (21.4)

C1' -'='"
Table 10. Statistical summary of recoverable gas, bcf (discovery-versus-time method). (Modified from Galloway, Hobday and Magara, 1982)
Total Gas to be Location gas discovery discovered
Dist. 2 All formations 25,063 4,727 Miocene (% of above) 1,057 (4.2) 199 (4.2)
Dist. 3 All formations 53,204 6,550 Miocene (% of above) 3,744 (].o ) 459 (7.0)
Dist. 4 All formations 49,382 18,720 Miocene (% of above) 2,275 (4.6) 861 (4.6)
Dist. 2, 3, 4 All formations 127,649 29,997 Total Miocene (% of above 7,076 (5.5) 1,519 (5.1)
Miocene liquid 1,179 253 equivalent mill ion bb 1 mill ion bb 1
Bcf (0.16667 mill bbl) = million bbl Bcf
Total recoverable
29,790 1,256 (4.2)
59,754 4,203 (].o )
68,102 3,136 (4.6)
157,646 8,595 (5.5)
1,432 mi 11 ion bb 1

Table 11. Summary of estimates of future discoveries, Miocene MSU, derived from historical projections. (Modified from Galloway, Hobday and Magara, 1982)
Cumulative Cumulative Discovery well number footage time
Oil (million bbl)
Dist. 2 4 6 35
Dist. 3 130 175 370
Dist. 4 14 23 49
Total 148 204 454
Gas {bcf}
Dist. 2 133 194 199
Dist. 3 6,563 7,275 459
Dist. 4 416 695 861
Total 7,112 8,164 1,519
Liqu i d 1,185 1,361 253 equivalent mill ion mi 11 ion mi 11 ion
boe boe boe
65

Estimates of remaining oil for the Texas Railroad Commission districts are
highest with the discovery-time method, next highest with the cumulative-footage
method, and lowest with the cumulative well method. The amount estimated by the
first method is a possible maximum, that by the second method a probable amount,
and that by the third a possible minimum. The highest estimate for remaining gas
is by the cumulative-footage method in Districts 3 and 4, and by the discovery-time
method for District 2. The lowest estimate for all districts is by the cumulative
well number method.
The estimated amounts of remaining gas projected by the cumulative-footage and
cumulative well methods for District 3 are probably due to recent improved gas
discovery rates for that district. Such projections into the future of high
discovery rates could be Inaccurate and misleading. It seems probable that for
District 3 the discovery-time method provides a more realistic estimate of
remaining gas.
The estimates of remaining oil for each play are highest with the discovery
time method, and lowest with the cumulative well-number method. Estimates of
remaining gas are notably high by the cumulative-footage and the cumulative-well
methods for plays 6 through 10. The area of these six plays approximately
coincides with that of the Texas Railroad Commission District 3 and, therefore, the
explanation for the optimistic estimate is the same as for that district.
CONCLUSIONS
Integration of regional studies of the Miocene MSU depositional systems and
structural character with a comprehensive compilation of contained hydrocarbons has
permitted differentiation of 10 distinct hydrocarbon-producing plays. Each play is
characterized by a unique combination of facies suites, structural and strati
graphic traps, reservior characteristics, and hydrocarbon production histories.
66

Table 12. Recoverable oil (106 bbl) in Miocene MSU plays. (Cumulative-well-number method)
Total % of Oil to be discovered Total Discovery Dist. up to dril1
2density recoverable
by 1977 Total of 0.5 mi /well oil
Dist. 2 (All Miocene) 182.88 (100%) 4.00 186.88
Play 111* 0.00 0.00 0.00 Play v* 4.83 2.6 0.10 4.93 Play VI* 148.68 81.3 3.25 151.93 Play VII* 29.37 16. 1 0.65 30.02
Dist. 3 (All Miocene) 2,293.30 (100%) 130.00 2,522.30
Play v* 6.56 0.3 0.39 6.95 Play VI* 32.92 1.4 1.82 34.74 Play VII* 7.62 0.3 0.39 8.01 Play VIII 1,936.17 82.0 106.60 2,069.77 Play IX <0.01 0.00 < 0.01 Play X 383.02 16.0 20.80 403.82
Dist. 4 (All Miocene) 260.94 (100%) 14.00 274.94
Play I 75.25 28.8 4.03 79.28 Play II 12.51 4.8 0.67 13.18 Play 111* 0.30 0.1 0.01 0.31 Play IV 167.22 64.1 8.97 176.19 Play v* 0.49 0.2 0.03 0.52 Play VI* 7.67 3.0 0.42 8.09
* Partial total where Plays overlap RR Districts
67

Table 13. Recoverable gas (bcf) in Miocene MSU plays. (Cumulative-well-number method)
Total % of Gas to be discovered Total Discovery Dist. up to dri11
2density recoverable
by 1977 Total of 0.5 mi /we11 gas
Dist. 2 (All Miocene) 1,057.00 (100%) 133.00 1,190.00
Play 111* 8.34 0.8 1.06 9.40 Play v* 93.87 8.9 11.84 105.71 Play VI* 828.96 78.4 104.27 933.23 Play VII* 125.83 11.9 15.83 141.66
Dist. 3 (All Miocene) 3,743.89 (100%) 6,563.00 10,306.89
Play v* 675.23 18.0 1,181. 34 1,856.57 Play VI* 271.09 7.2 472.54 743.63 Play VII* 452.76 12. 1 794.12 1,246.88 Play VIII 1,560.67 41.7 2,736.77 4,297.44 Play IX 25.04 0.7 45.94 70.98 Play X 759.10 20.3 1,332.29 2,091.39
Dist. ,. (A11 Miocene) 2,274.93 (100%) 416.00 2,690.93
Play I 1,001.09 44.0 183.04 1,184.13 Play II 388.86 17.0 71. 14 460.00 Play 111* 17.71 0.8 3.32 21.03 Play IV 781.58 34.4 143.10 924.68 Play v* 62.43 2.7 11.23 73.66 Play VI* 23.26 1.0 4.16 27.43
* Partial total where plays overlap RR Districts
68

Table 14. Recoverable oil (106 bbl) in Miocene MSU plays. (Cumulative-footage method)
Total % of Oil to be discovered Total Discovery Di st. up to exploratory recoverable by 1977 Total footage of 15,000 ft/mi 2 oi I
Dist. 2 (All Miocene) 182.88 (100%) 6.00 188.88
Play 111* 0.00 0.00 0.00 Play v* 4.83 2.6 0.15 4.98 Play VI* 148.68 81.3 4.88 153.56 Play VII* 29.37 16. 1 0.97 30.34
Dist. 3 (All Miocene) 2,293.30 (100%) 175.00 2,568.30
Play v* 6.56 0.3 0.53 7.09 Play VI* 32.92 1.4 2.45 35.37 Play VII* 7.62 0.3 0.53 8.15 Play VIII 1,963.17 82.0 143.50 2,106.67 Play IX < 0.01 0.00 < 0.01 Play X 383.02 16.0 28.00 411.02
Dist. 4 (All Miocene) 260.94 (100%) 23.00 283.94
Play I 75.25 28.8 6.62 79.37 Play II 12.51 4.8 1. 10 13.61 Play II 1* 0.30 O. 1 0.02 0.32 Play IV 167.22 64.1 14.74 181.96 Play v* 0.49 0.2 0.05 0.54 Play VI* 7.67 3.0 0.69 8.36
* Partial total where Plays overlap RR Districts
69

Table 15. Recoverable gas (bcf) in Miocene MSU plays. (Cumulative-footage method)
Total % of Gas to be discovered Total Discovery Dist. up to exploratory recoverable by 1977 Total footage of 15,000 ft/mi 2 gas
Dist. 2 (All Miocene) 1,057.00 (100%) 194.00 1,251.00
Play 111* 8.34 0.8 1.55 9.89 Play v* 93.87 8.9 17 .27 111.14 Play VI* 828.96 78.4 152.10 981.06 Play VII* 125.83 11.9 23.08 148.91
Dist. 3 (All Miocene) 3,743.89 (100%) 7,275.00 11,018.89
Play v* 675.23 18.0 1,309.50 1,984.73 Play VI* 271.09 7.2 523.80 794.89 Play VII* 452.76 12. 1 880.27 1,333.03 PI ay VIII 1,560.67 41.7 3,033.67 4,594.34 Play IX 25.04 0.7 50.93 75.97 Play X 759.10 20.3 1,476.83 2,235.93
Di st. 4 (All Miocene) 2,274.93 (100% ) 695.00 2,969.93
Play I 1,001.09 44.0 305.80 1,306.89 Play II 388.86 17.1 118.85 507.71 Play III * 17.71 0.8 5.56 23.27 Play IV 781.58 34.4 239.08 1,020.66 Play v* 62.43 2.7 18.76 81.19 Play VI* 23.26 1.0 6.95 30.21
* Partial total where plays overlap RR Districts
70

Table 16. Recoverable oil (106 bbl) in Miocene MSU plays. (Discovery-versus-time method)
Total % of Total Discovery Dist. Oil to be recoverable by 1977 Total discovered oi 1
Dist. 2 (All Kiocene) 182.88 (100%) 35.00 217.88
Play 111* 0.00 0.00 0.00 Play v* 4.83 2.6 0.91 5.74 Play VI* 148.68 81.3 28.46 177.14 Play VII* 29.37 16. 1 5.63 35.00
Dist. 3 (All Kiocene) 2,293.30 (100%) 370.00 2,763.30
Play v* 6.56 0.3 1. 11 7.67 Play VI* 32.92 1.4 5.18 38.10 Play VII* 7.62 0.3 1. 11 8.73 Play VIII 1,963. 17 82.0 303.40 2,266.57 Play IX < 0 .01 0.00 <0.01 Play X 383.02 16.0 59.20 442.22
Di st. 4 (All Kiocene) 260.94 (100%) 49.00 309.94
Play I 75.25 28.8 14. 11 86.86 Play II 12.51 4.8 2.35 14.86 Play III * 0.30 O. 1 0.05 0.35 Play IV 167.22 64.1 31.41 198.63 Play v* 0.49 0.2 0.10 0.59 Play VI* 7.67 3.0 1.47 9.14
* Partial total where plays overlap RR Districts
71
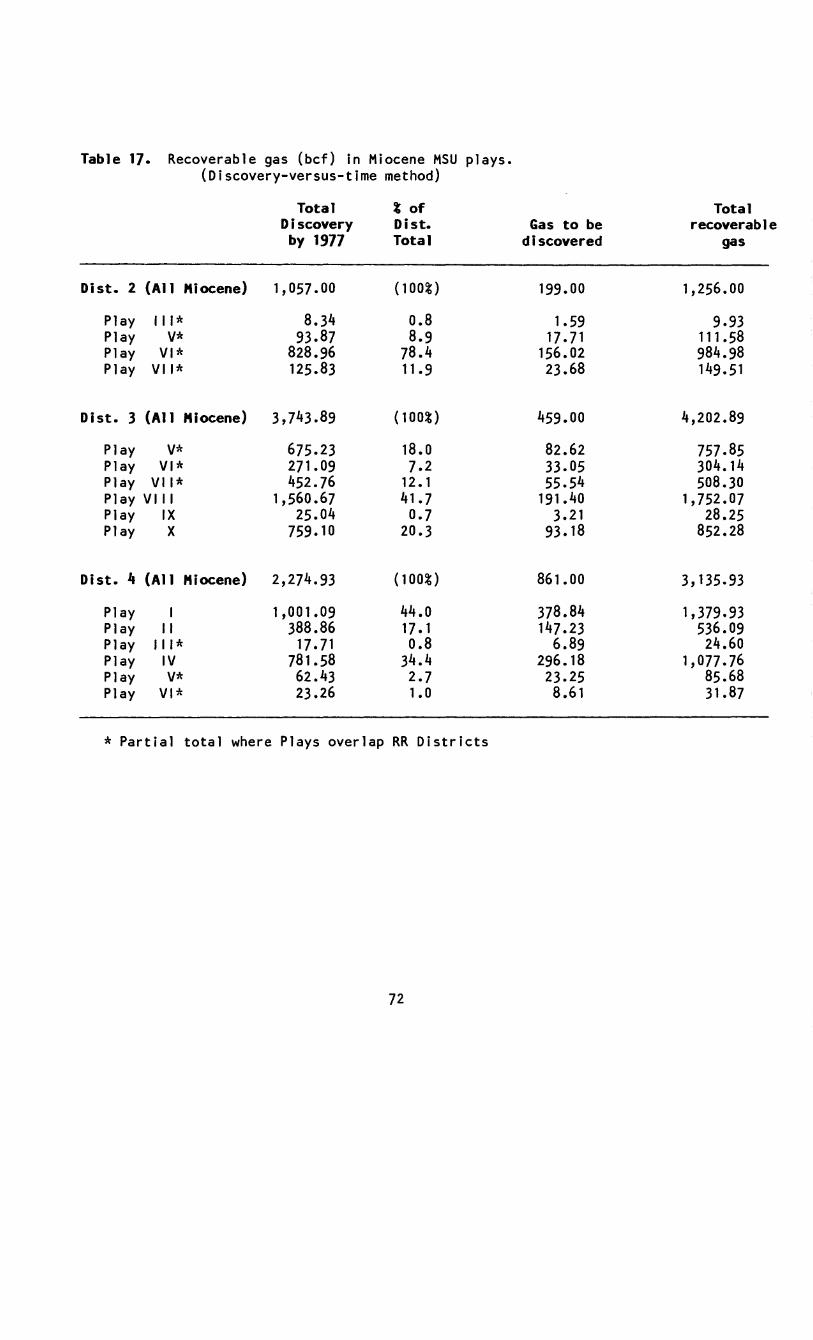
Table 17. Recoverable gas (bcf) in Miocene MSU plays. (Discovery-versus-time method)
Total % of Total Discovery Dist. Gas to be recoverable
by 1977 Total discovered gas
Dist. 2 (All Kiocene) 1,057.00 (100%) 199.00 1,256.00
Play 111* 8.34 0.8 1.59 9.93 Play v* 93.87 8.9 17.71 111 .58 Play VI* 828.96 78.4 156.02 984.98 Play VII* 125.83 11.9 23.68 149.51
Oist. 3 (All Kiocene) 3,743.89 (100%) 459.00 4,202.89
Play v* 675.23 18.0 82.62 757.85 Play VI* 271.09 7.2 33.05 304.14 Play VII* 452.76 12.1 55.54 508.30 Play VIII 1,560.67 41.7 191.40 1,752.07 Play IX 25.04 0.7 3.21 28.25 Play X 759.10 20.3 93.18 852.28
Oi st. 4 (All Kiocene) 2,274.93 (100%) 861 .00 3,135.93
Play I 1,001.09 44.0 378.84 1,379.93 Play II 388.86 17. 1 147.23 536.09 Play II 1* 17.71 0.8 6.89 24.60 Play IV 781.58 34.4 296.18 1,077.76 Play v* 62.43 2.7 23.25 85.68 Play VI* 23.26 1.0 8.61 31.87
* Partial total where Plays overlap RR Districts
72
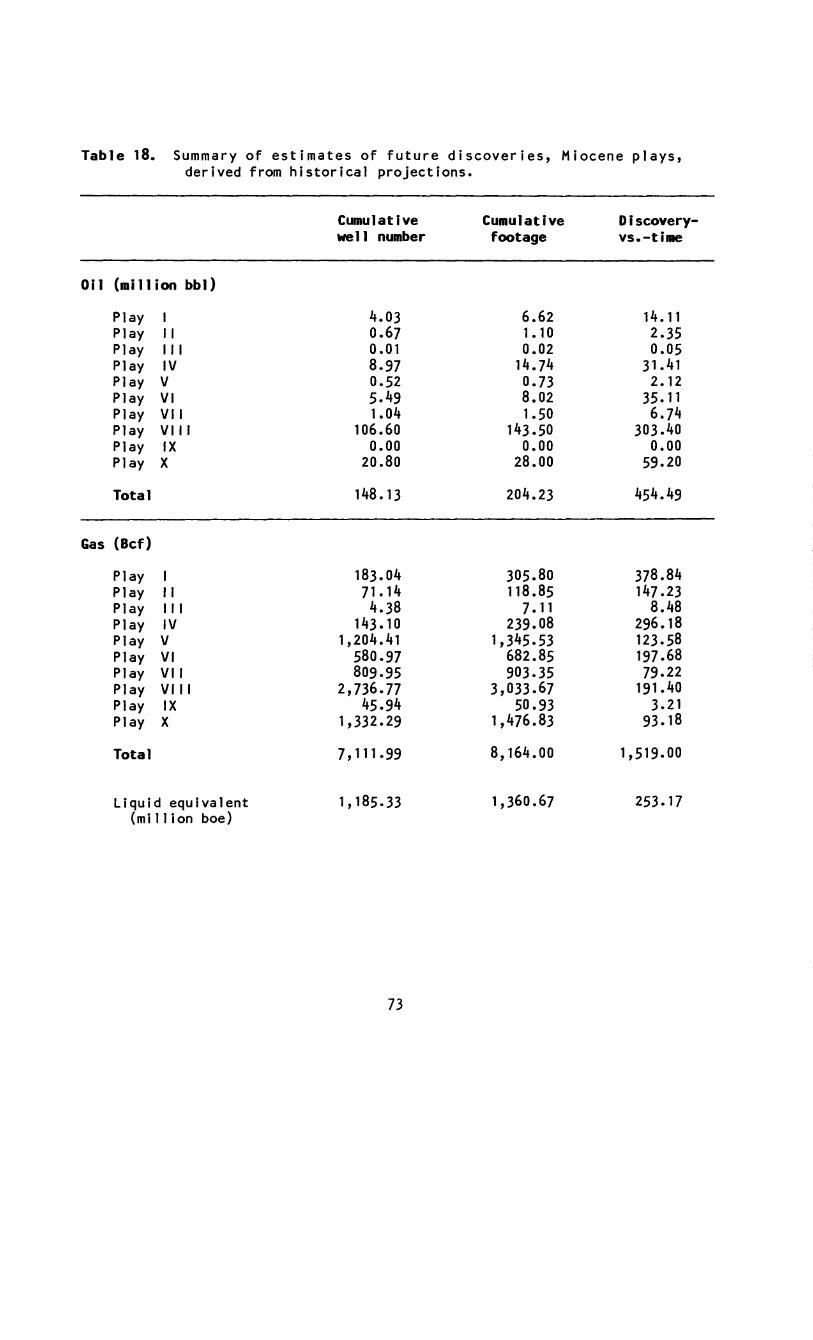
Table 18. Summary of estimates of future discoveries, Miocene plays, derived from historical projections.
Cumulative Cumulative Diseovery-well number footage vs.-time
Oil (mi 11 ion bbJ)
Play I 4.03 6.62 14. 11 Play II 0.67 1 .10 2.35 Play III 0.01 0.02 0.05 Play IV 8.97 14.74 31.41 Play V 0.52 0.73 2.12 Play VI 5.49 8.02 35.11 Play VII 1.04 1.50 6.74 Play VIII 106.60 143.50 303.40 Play IX 0.00 0.00 0.00 Play X 20.80 28.00 59.20
Total 148.13 204.23 454.49
Gas (Bef)
Play I 183.04 305.80 378.84 Play II 71.14 118.85 147.23 Play III 4.38 7. 11 8.48 Play IV 143.10 239.08 296.18 Play V 1,204.41 1,345.53 123.58 Play VI 580.97 682.85 197.68 Play VII 809.95 903.35 79.22 Play VIII 2,736.77 3,033.67 191.40 Play IX 45.94 50.93 3.21 Play X 1,332.29 1,476.83 93.18
Total 7,111.99 8,164.00 1,519.00
Liquid equivalent 1,185.33 1,360.67 253.17 (million boe)
73

Table 19. Hydrocarbon inventory for Miocene MSU plays.
Play
Play
Play " Play III
Play IV
Play V
Play VI
Play VII
Play VIII
Play IX
Play X
Total
Oi I (106 bbJ)
75
13
0
167
12
189
35
1,963
0
383
2,837
Cumulative Production
Gas (103 ""cf)
1,001
389
26
782
832
1,123
578
1,561
25
759
7,076
Gas Jiqui d equ&valent (10 boe)*
167
65
4
130
139
187
96
260
4
127
1,179
*Calculated energy equivalent in bbl of oil (6 Mcf = 1 boe)
74
Total hydro,arbons
(10 boe)
242
78
4
297
151
376
131
2,223
4
510
4,016
Average boe gas bb I oi I
2.2
5.0
N/A
0.8
11.6
1.0
2.7
0.1
N/A
0.3
0.4

Table 20. Field size distribution by play; Miocene MSU.
Play
II
III
IV
V
VI
VII
VIII
IX
X
Totals
Total number
of fields
13
8
2
26
25
30
24
43
3
27
201
Number of fields with cumulative production (1977) of:
1-15 mi II ion boe
11
7
2
19
22
24
22
16
3
17
143
75
15-100 mi 11 ion boe
0
7
3
5
2
20
0
9
48
> 100 mi 11 ion boe
0
0
0
0
0
7
0
10

Table 21. Fields with >100 million boe production; Miocene MSU.
~p
number
152
127
66
107
178
182
176
134
203
210
Cumulative (1977) product i on*
Field (million boe)
Thompson 447.23
Hastings 295.03
Willamar 169.26
Tom O'Connor 152.50
Humble 147.38
Webster 146.99
Goose Creek 140.21
West Columbia 133.83
Spindletop 106.43
Hull 102.32
*Many of these fields also produce from other horizons. Only Miocene production is shown.
76

The Miocene MSU has produced approximately 2.8 bill ion bbl of oil, and
7 trillion ft 3 of gas in existing fields of 1 million boe or larger. On an energy
equ i va 1 ency bas i s the Miocene has produced 2.5 times as much 0 i 1 as gas. Tota 1
Miocene production is approximately 25 percent that reported for the Frio MSU
(Galloway and others, 1982). That hydrocarbons are not uniformly distributed
throughout the Miocene MSU is demonstrated by the observation that 67 percent of
the total production has been derived fom two plays (#8 and #10).
Fields of Play I are characteristically gas producers, and future discoveries
in the area likewise will be predominately gas-dominated. One field, the Willamar,
in Hi da 1 go County, has produced 99.8 percent of a 11 the 0 i 1, 56.4 percent of the
gas, and 75 percent of the total hydrocarbon of the play. The low drilling density
for the play, 0.03 wells/mi 2, suggests that further exploration should yield many
more small fields and perhaps several large fields. Source of hydrocarbons in the
strata of this play presumably is from underlying Frio or older strata; however,
lateral updip migration from offshore Miocene mudstones cannot be discounted.
Thick, elongate strandplain sand bodies probably have poor reservoir potential due
to the lack of effective seals. Seaward of these deposits thinner delta front
sands encased in relatively thick shelf mudstones should provide excellent
hydrocarbon reservoirs.
Play II has been a moderate producer of gas and relatively minor quantities of
oi 1. The play includes nine fields with cumulative production exceeding 1 x 10⁶
boe, has been a moderate producer of both 0 i 1 and gas. A 1 though the area has a
supermature well density of 3.01/mi 2, significant future production should derive
from infill wells and possibly from downdip coastally located delta-front sands
associated with growth-faulting. It seems probable that gas will dominate future
discoveries, especially in coastal areas.
Play V has been, and probably will remain a predominantly gas-producing pro
vince. Drilling density has reached the stage of maturity and 28 fields each have
77

cumulative production in excess of 1 x 10⁶ boe. Infill wells should provide
cont i nued product i on, and new fields may be discovered downd i p, espec i ally where
backbarrier washover facies occur associated with growth faulting and rollover
anticlines. Additional small fields might be discovered in the transitional belt
between the updip fluvial, and downdip deltaic systems.
Play VI has produced relatively large and approximately equal amounts of oil
and gas (fig. 9). The play includes one field, the Tom O'Connor, which has
produced more than 150 x 106 boe, six fields with 15 x 106 boe, and 30 with
1 x 10⁶ boe each. Well density for the play is high (1.85 wells/mi 2) and
prospects for new large fields seem very slight. Infill wells and future small
field discoveries should provide continued significant production.
Play VII has been a moderate producer of gas and of minor amounts of oil. The
play, which has a dri 11 ing density of 1.49 wells/mi 2, includes 24 fields with of
more than 1 x 10⁶ boe each, and 2 fields with cumulative production of more than
15 x 10 6 boe each. Eighty-two percent of all the oil of the play has been
produced from four fields (#82 Cordele, #83 Cordele S/SE, #108 Colletto Creek, and
#149 Moore's Orchard). It seems probable that future discoveries in this play will
be predominately gas. It is unlikely that many, if any, additional large fields
will be discovered, but new, small fields and additional infill wells should
provide significant reserves in the future.
Play VI II has produced 70 percent of the total Miocene MSU oil and 22 percent
of the total gas. The play includes 7 fields (table 21) each with cumulative
production of more than 100 x 106 boe. The giant fields account for 69 percent of
the oil, 57 percent of the gas, and 67 percent of the cumulative play production.
Hydrocarbon traps occur arranged vertically around salt domes, and most such traps
have been discovered. Most new oil and gas will be discovered by infill wells with
78

the best possibility for new fields confined to downdip coastal areas. Production
from future discoveries should continue to be overwhelmingly oil.
Play IX, with a well density of 0.93 wells/mi 2, has three gas fields with
cumulative production each of more than 1 x 10 6 boe. Lack of major structures,
thinness of the sedimentary section, and remoteness from high-quality source rocks
combine to indicate that only minor quantities of hydrocarbons, primarily gas,
remain to be discovered in this play.
Play X has produced large quantities of oil and important amounts of gas
(table 19). The play includes 10 fields with cumulative production in excess of 15
x 106 boe and one with production in excess of 100 x 106 boe (Spindletop-/, #203).
The latter fie 1 d and two others (# 163 and #23]) have accounted for 64 percent of
the oil production and two fields (#186 and #190) have produced 43 percent of the
gas for this play. It is probable that all the major fields have been discovered.
Best prospects would appear to be deeper offshore delta front reservoirs. Based on
the three historical evaluation methods employed in this study (table 18) the
Miocene MSU contains between 250 and 1360 million boe of undiscovered,
conventionally producible hydrocarbons. These figures represent an extrapolation
of current trends that have prevailed for many years. Prediction of new major
discoveries that could significantly alter the projected figures is essentially
impossible (Ryan, 1973). From the evidence reviewed above such new discoveries are
most probable in Play I 'and offshore areas of Plays VIII and X. Search for new
sources of hydrocarbons in the maturely explored Miocene MSU should follow the
recommendations of Halbouty (1980).
79
-
ACKNOWLEDGMENTS
This research was partially funded by the U.S. Geological Survey, Department
of the Interior, under USGS Grant No. 14-08-0001-G-707. R. A. Morton (Bureau of
Economic Geology) reviewed the report and made constructive observations which
enhanced the quality of the report. James L. Lamb, consulting micropaleontologist
(Houston, Texas), provided data essential to accurate correlation of Anahuac
benthonic foraminifer zones with world wide planktonic zones. Muriel E. Hunter,
Independent Geologist (Tallahassee, Florida), freely shared her knowledge of
various aspects of Texas Coastal Plain, Late Cenozoic stratigraphy and
constructively and spiritedly evaluated the authors stratigraphic interpretations.
Research Assistants Elizabeth M. Andrews, and David C. Noe meticulously and
dil igently contributed to the compilation and synthesis of much of the data
employed in this study. To these persons the author in indebted.
80

REFERENCES
American Petroleum Institute, 1978, Reserves of crude oil, natural gas liquids, and natural gas in the United States and Canada as of December 31, 1977: Wash i ngton, D.C., v. 32, 5 p.
Applin, E. R., Ellisor, A. C., and Kniker, H. T., 1925, Subsurface stratigraphy of the coastal plain of Texas and Louisiana: American Association of Petroleum Geologists Bulletin, v. 9, no. 1, p. 79-122.
Bailey, T. L., 1926, The Gueydan, a new Middle Tertiary formation from the southwestern coastal plain of Texas: The University of Texas Bulletin n. 2645, 187 p.
Barnes, V. E., project director, 1968, Beaumont sheet: The University of Texas at Austin, Bureau of Economic Geology, Geologic Atlas of Texas, Harold Norman Fisk Memorial Edition.
1968, Houston sheet: The University of Texas at Austin, Bureau of Economic Geology, Geologic Atlas of Texas, scale 1:250,000, Paul Weaver Memorial Ed it ion, repr i nted 1982.
1968, Palestine Sheet: The University of Texas at Austin, Bureau of Economic Geology, Geologic Atlas of Texas, scale 1:250,000, Sidney Powers Memorial Edition.
1974, Austin Sheet: The University of Texas at Austin, Bureau of Economic Geology, Geologic Atlas of Texas, scale 1:250,000, Frances Luther Whitney Memorial Edition.
1974, Seguin sheet: The University of Texas at Austin, Bureau of Economic Geology Geologic Atlas of Texas, scale 1:250,000, Donald Clinton Barton Memorial Edition, reprinted 1979.
1975, Beeville-Bay City sheet: The University of Texas at Austin, Bureau of Economic Geology Geologic Atlas of Texas, scale 1:250,000, Alexander Deussen Memorial Edition.
1975, Corpus Chr i st i sheet: The Un i vers i ty of Texas at Aust i n, Bureau of Economic Geology Geologic Atlas of Texas, scale 1:250,000, Alva Christine Ellisor Memorial Edition.
__ ~_ 1976, Crystal City-Eagle Pass sheet: The University of Texas at Austin, Bureau of Economic Geology Geologic Atlas of Texas, scale 1:250,000, Dolan Hoye Eargle Memorial Edition.
1976, Laredo sheet: The University of Texas at Austin, Bureau of Economic Geology, Geologic Atlas of Texas, scale 1:250,000, Julia Ann Gardner Memorial Edition.
1976, McAllen-Brownsville sheet: The University of Texas at Austin, Bureau of Economic Geology, Geologic Atlas of Texas, scale 1:250,000, Arthur Carleton Trowbridge Memorial Edition.
81

Baker, E. T., Jr., 1978, Stratigraphic and hydrogeologic framework of part of the coastal plain of Texas: U.S. Geological Survey Open-file Report 77-712, 32 p.
Barton, D. C., 1930, Deltaic coastal plain of southeast Texas: Geological Society of America Bulletin, v. 41, no. 3, p. 359-382.
Beard, J. H., Sangree, J. B., and Sm i th, L. A., 1982, Quaternary chronology, paleoclimate, depositional sequences, and eustatic cycles: American Association of Petroleum Geologists Bulletin, v. 66, no. 2, p. 158-169.
Bebout, D. G., Loucks, R. G., and Gregory, A. R., 1978, Frio sandstone reservoirs in the deep subsurface along the Texas Gulf Coast: their potential for production of geopressured-geothermal energy: The University of Texas at Austin, Bureau of Economic Geology Report of Investigations No. 91, 93 p.
Berggren, W. A., and Van Couvering, J. A., 1974, The Neogene: Palaeogeography, Palaeoclimatology, and Palaeoecology, v. 16, 216 p.
Bishop, R. S., 1977, Shale diapir emplacement in south Texas: Laward and Sherriff examples: Gulf Coast Association of Geological Societies Transactions, v. 27, p. 20-21.
--::-~_ 1978, Mechanism for emplacement of piercement diapirs: American Association of Petroleum Geologists Bulletin, v. 62, no. 7, p. 1561-1583.
Bishop, R. S., Gehman, H. M., Jr., and Young,A., 1983, Concepts for estimating hydrocarbon accumulation and dispersion: American Association of Petroleum Geologists Bulletin, v. 67, no. 3, p. 337-348.
Blow, W. H., 1969, Late Middle Eocene to Recent planktonic foraminifera biostratigraphy: International Conference on Planktonic Microfossils, 1st Geneva (196]) Proceedings, v. 1, p. 199-422.
Brown, S. W., 1979, Hydrocarbon source facies analysis, Department of Energy and Crude Oil Company Pleasant Bayou No.1 and No.2 wells, Brazoria County, Texas,.l!!. Dorfman, M. H., and Fisher, W. L., Eds., Proceedings, fourth U.S. Gulf Coast geopressured-geothermal energy conference: research and development, v. 1, p. 132-152.
Bruce, D. H., 1973, Pressured shale and sediment deformation mechanism for development of regional contemporaneous faults: American Association of Petroleum Geologists Bulletin, v. 57, no. 6, p. 878-886.
Cantrell, R. B., Montgomery, J. C., and Woodward, A. E., 1959, Heterostegina reef on Nash and other piercement salt domes in northwestern Brazoria County, Texas: Gulf Coast Association of Geological Societies Transactions, v. 9, p. 59-62.
Coleman, H. J., Shelton, E. M., Nichols, D. T., and Thompson, C. J., 1978, Analyses of 800 crude oils from United States oilfields: Technical Information Center, United States Department of Energy, Report BETC/RI-78/14, 447 p.
Cushman, J. A., 1921, Amer i can spec i es of Opercu 1 ina and Heterosteg ina: U.S. Geological Survey Professional Paper 128-E, p. 125-137.
82
1918, Some Pliocene and Miocene Foraminifera of the coastal plain of the United States: U.S. Geological Survey Bulletin 676, 100 p.
Dailly, G. C., 1976, A possible mechanism relating progradation, growth faulting, clay diapirism and overthrusting in a regressive sequence of sediments: Bulletin of Canadian Petroleum Geology, v. 24, p. 92-118.
Dall, W. H., 1913, On a brackish water Pl iocene fauna of the southern coastal plain: U.S. National Museum Proceedings, v. 46, p. 225-237.
Davis, W., 1958, A study of the future productive capacity and probable reserves of the U.S.: Oil and Gas Journal, February 24, p. 105-119.
Doering, J. A., 1935, Post-Fleming surface formations of coastal Texas and south Louisiana: American Association of Petroleum Geologists Bulletin, v. 19, no. 5, p. 651-688.
--~ 1958, Citronelle age problem: American Association of Petroleum Geologists
Bulletin, v. 42, no. 4, p. 764-786.
Dodge, M. M., and Posey, J. S., 1981, Structural cross-sections, Tertiary forma-tions, Texas Gulf Coast: The University of Texas at Austin, Bureau of Economic Geology, 6 p., 32 pls.
Dow, W. G., 1978, Petroleum source beds on continental slopes and rises: American Association of Petroleum Geologists Bulletin, v. 62, no. 7, p. 1584-1606.
DuBar, J. R., DuBar, S. S., Ward, L. W., Blackwelder, B. W., Abbott, W., and Huddlestun, F. P., 1980, Cenozoic biostratigraphy of the Carol ina outer coastal plain, in Frey, R. W., ed., Excursions in southeastern geology, v. 1., Geological Society of America, 1980 Annual Meeting, Atlanta, Georgia, p. 179-236.
DuBar, J. R., Blackwelder, B. W., and DuBar, S. S., Stratigraphic revision of some Miocene, Pliocene and Pleistocene marine deposits of Florida, U.S. Geological Survey Profess i ona 1 Paper (i n press).
Dumble, E. T., 1894, Cenozoic deposits of Texas: Journal of Geology, v.2, p.549-567.
Ell isor, A. C., 1926, Coral reefs in the 01 igocene of Texas, American Association of Petroleum Geologists Bulletin, v. 10, no. 10, p. 976-985.
1936, Potamides matsoni Zone of Texas: American Association of Petroleum Geologists Bulletin, v. 20, no. 4, p. 494-495.
1940, Subsurface Miocene of southern Louisiana, American Association of Petroleum Geologists Bulletin, v. 24, no. 3, p. 435-475.
1944, Anahuac Formation, American Association of Petroleum Geologists Bulletin, v. 28, no. 9, p. 1355-1375.
Fisher, W. L., Brown, L. F., Jr., Scott, A. J., and McGowen, J. H., 1969, Delta systems in the exploration for oil and gas: a research colloquium, The University of Texas at Austin, Bureau of Economic Geology, 212 p.
83
Fisher, W. L., and McGowen J. H., 1967, Depositional systems in the Wilcox Group of Texas and their relationship to occurrence of oil and gas: Gulf Coast Association of Geological Societies Transactions, v. 17, p. 105-125.
Fisk, H. N., 1940, Geology of Avoyelles and Rapides Parishes: Louisiana Geological Survey Bulletin 18, 240 p.
Floyd, D. N., Miller, T. H., and Berry, W. B. N., 1958, Miocene paleoecology in the Burkeville area, Newton County, Texas: Gulf Coast Association of Geological Societies, v. 8, p. 157-165.
Galloway, W. E., 1975, Process framework for describing the morphologic and stratigraphic evolution of deltaic depositional systems, in M. L. Broussard, ed., Deltas: Houston Geological Society, p. 87-98. -
Galloway, W. E., Henry, C. D., and Smith, G. E., 1982, Depositional framework, hydrostratigraphy, and uranium mineralization of the Oakville Sandstone (Miocene), Texas Coastal Plain: The University of Texas at Austin, Bureau of Economic Geology Report of Investigations no. 113, 51 p.
Galloway, W. E., Hobday, D. K., and Magara, K., 1982, Frio Formation of the Texas Gulf Coast Basin--depositional systems, structural framework, and hydrocarbon origin, migration, distribution, and exploration potential: The University of Texas at Austin, Bureau of Economic Geology Report of Investigations no. 122, 78 p.
Gardner, J. A., 1940, New Rangia from Upper Miocene of western Gulf Province: American Association of Petroleum Geologists Bulletin, v. 24, no. 3, p. 476-477.
Geehan, G. W., Grimes, T. P., and Swanson, D. C., 1983, Exploration and development of lobate backbarrier facies sandstones: Gulf Coast Association of Geological Societies Transactions, v. 33, p. 101-107.
Gregory, J. E., 1966, A lower 01 igocene delta in the subsurface of southeastern Texas: Gulf Coast Association of Geological Societies Transactions, v. 16, p. 227-241.
Gravell, D. W., and Hanna, M. A., 1937, The Lepidocycl ina texana horizon in the Heterostegina zone, upper Oligocene of Texas and Louisiana: Journal of Paleontology, v. II, no. 6, p. 517-529.
Halbouty, M. T., 1967, Salt domes Gulf region United States and Mexico: Gulf Publishing Co., Houston, Texas, 425 p.
1980, Methods used, and experience gained, in exploration for new oi 1 and gas fields in highly explored (mature) areas: American Association of Petroleum Geologists Bulletin, v. 64, no. 8, p. 1210-1222.
Harris, G. D., 1895, Neocene Mollusca of Texas, or fossils from the deep well at Galveston: Bulletins of American Paleontology, v. 1, no. 3, p.85-115.
Hayes, C. W., and Kennedy, W., 1903, Oil fields of Texas-Louisiana Gulf Coastal Plain: U.S. Geological Survey Bulletin no. 212, 174 p.
84

Hesse, C. J., 1942, A prel iminary report on the Miocene vertebrate faunas of southeast Texas: Proceedings of the Texas Academy of Science, v. 26, p. 157-179.
Holcomb, C. W., 1964, Frio Formation of south Texas: Gulf Coast Association of Geological Societies Transactions, v. 14, p. 23-33.
Houston Geological Society, 1954a, Cross-sections, upper Gulf of Texas, four strike and two dip sections: Houston Geological Society Study Group Report.
1954b, Stratigraphy of the upper Gulf Coast of Texas and strike and dip cross-sections, upper Gulf Coast of Texas, Study Group Report, 1953-54, 25 p.
1954c, Study group cross-section and stratigraphic review project in Texas Upper Gulf Coast: Houston Geological Society Study Group Report.
Howe, H. V., 1933, Review of tertiary stratigraphy of Louisiana: American Association of Petroleum Geologists, v. 17, p. 613-655.
Howeth, I. K., and Martyn, P. F., 1932, The Gol iad Sandstone Formation of southwest Texas: manuscript presented at the annual meeting of the San Antonio Geological Society, Corpus Christi, Feb. 17, 1932.
Hubbert, M. K., 1967, Degree of advancement of petroleum exploration in United States: American Association of Petroleum Geologists Bulletin, v. 67, no. 11, p. 2207 -2227.
Ibach, L. E. J., 1982, Relationship between sedimentation rate and total organic carbon content in ancient marine sediments: American Association of Petroleum Geologists Bulletin, v. 66, no. 2, p.170-188.
Jackson, M. P. A., 1982, Fault tectonics in the East Texas Basin, The University of Texas at Austin, Bureau of Economic Geology Geological Circular 82-4, 31 p.
Kennedy, W., 1892, A section from Terrell, Kaufman County, to Sabine Pass on the Gulf of Mexico, Texas Geological Survey Annual Report 3, p. 43-125.
Kennett, J. P., and Srinivasan, M. S., 1983, Neogene planktonic Foraminifera: Hutchinson Ross Publishing Company, Stroudsburg, Pennsylvania, 265 p.
Kiatta, H. W., 1971, The stratigraphy and petroleum potential of the lower Miocene, offshsore Galveston and Jefferson Counties, Texas, Gulf Coast Association of Geological Societies Transactions, v. 21, p. 257-270.
Lamb, J. L., and Beard, J. H., 1972, Late Neogene planktonic foraminifers in the Caribbean, Gulf of Mexico, and Italian stratotypes, University of Kansas Paleontological Institute, Paleontological Contributions, Article 57 (Protozoa), 67 p.
MacFadden, B. J., and Skinner, M. F., 1981, Earliest Holarctic Hipparian, Cormohi arion goorlsl n. sp. (Mammalia, Equidae), from the Barstovian (Medial Miocene Texas Gulf Coastal Plain: Journal of Paleontology, v. 55, no. 3, p. 619-627.
85

MacFadden, B. J., and Webb, S. D., 1982, The succession of Miocene (Arikareean through Hemphi 11 ian) terrestrial mammal ian local ities and faunas in Florida, in Scott, T. M., and Upchurch, S. B., eds., Miocene of the southeastern Un i ted States: Florida Bureau of Geology, Special Publication no. 25, p. 186-199.
McCarthy, J. A., 1970, The Miocene trend of Calhoun and Matagorda Counties, Texas: Gulf Coast Association of Geological Societies Transactions, v. 20, p. 163-176.
Momper, J. A., 1978, Oil migration limitations suggested by geological and geochemical considerations, ~ Physical and chemical constraints on petroleum migration: American Association of Petroleum Geologists Continuing Education Course Note Ser i es no. 6, p. B 1-B60.
North American Commission on Stratigraphic Nomenclature, 1983, North American stratigraphic code: American Association of Petroleum Geologists, v. 67, no. 5, p. 841-875.
Patton, T. H., 1969, Miocene and Pl iocene artiodactyls Texas Gulf Coastal Plain: Bulletin of the Florida State Museum, v. 14, no. 2, p. 115-226.
Plummer, F. B., 1932, Cenozoic systems of Texas, in The geology of Texas, v. 1: The University of Texas at Austin Bulletin 3232:-p. 519-818.
Quinn, J. H., 1955, Miocene Equidae of the Texas Gulf region: The University of Texas at Austin, Bureau of Economic Geology Bulletin 5516, p. 5-90.
Ragsdale, J. A., 1960, Petrology of Miocene Oakville Formation, Texas Coastal Plain: The University of Texas at Austin, M.S. thesis, 196 p.
Railroad Commission of Texas, 1978, Annual Report of the Oil and Gas Division: Austin, Texas, 613 p.
Rainwater, E. H., 1966, Miocene of the Gulf Coastal Plain of the United States: Proceedings of 2nd West African Micropaleontology Colloquium (Ibadan, 1965), p. 141-162.
Reiter, J. 0., 1959, Review of Hitchcock Field, Galveston County, Texas: Gulf Coast Association of Geological Societies Transactions, v. 9, p. 63-70.
Ronov, A. B., 1958, Organic carbon in sedimentary rocks (in relation to the presence of petroleum): Geochemistry, v. 5, p. 510-536.
Ryan, J. T., 1973, An analysis of crude-oil discovery rate in Alberta: Bulletin of Canadian Petroleum Geology, v. 21, p. 219-235.
S co tt , A. J., and F ish e r, W. L., 1 969, Del t a s y s t ems, and del t a i c de p 0 sit ion, .l!:!. Fisher, W. L., Brown, L. F., Jr., Scott, A. J., and McGowen, J. H., leaders, Delta systems in the exploration for oil and gas: a research colloquium, The University of Texas at Austin, Bureau of Economic Geology, p. 10-29.
Solis, R. F., 1980, Late Tertiary and Quaternary depositional systems in the subsurface of central coastal Texas--Regional geology of the coastal aquifer and potential 1 iquid-waste repositories: The University of Texas at Austin, Bureau of Economic Geology Report of Investigations no. 108, 89 p.
86
Spradlin, S. D., 1980, Miocene fluvial systems: Southeast Texas: The University of Texas at Aust in, Master's thes i s, 139 p.
Sta i nforth, R. M., Lamb, J. L., Luterbacher, H., Beard, J. H., and Jeffords, R. M., 1975, Cenozoic planktonic foraminiferal zonation and characteristics of index forams: University of Kansas Paleontological Contributions, Article 62, 425 p.
Stenzel, H. B., and Turner, F. E., 1944, A Miocene invertebrate fauna from Burkevi lIe, Newton County, Texas, American Journal of Science, v. 242, n. 6, p. 289-308.
Stenzel, H. B., Turner, F. E., and Hesse, C. J., 1944, Brackish and non-marine Miocene in southeastern Texas, American Association of Petroleum Geologists Bulletin, v. 28, no. 7, p. 977-1011.
Tipsword, H. L., 1963, Tertiary Foraminifera in Gulf Coast petroleum exploration and development, in Geology of the Gulf Coast and central Texas: Houston Geological Societytfuidebook, Annual Meeting, Houston, Texas, 1962, p. 16-57.
Tipsword, H. L., Fowler, W. A., Jr., and Sorrell, B. J., 1971, Possible future petroleum potential of Lower Miocene-Ol igocene western Gulf Basin, in Cram, I. H., Future petroleum provinces of the United States, their geo~gy and potential, v. 2: American Association of Petroleum Geologists Memoir No. 15, p. 836-854.
Van Couvering, J. A., and Berggren, W. A., 1977, Biostratigraphical basis of the Neogene time sca 1 e, in Kaufman, E., and Haze 1, J., eds., Concepts and methods of b i ostrat i graphy: Dowden, Hutch inson and Ross, I nc.,Stroudsburg, Pennsylvania, p. 283-306.
Walton, W. R., and Smith, W. T., 1969, Ancient coastal lagoons, in Castanares, A. A., and Phleger, F. B., eds., Coastal lagoons, a symposium,Universidad Nacional Autonoma de Mexico, p. 237-248.
Weeks A. W., 1945, Oakville, Cuero, and Goliad Formations of Texas Coastal Plain between Brazos River and Rio Grande: Amer i can Assoc i at i on of Pet ro 1 eum Geologists Bulletin, v. 29, no. 12, p. 1721-1732.
White D. H., 1980, Assessing oil and gas plays in facies-cycle wedges: American Association of Petroleum Geologists Bulletin, v. 64, no. 8, p. 1158-1178.
White, D. H., and Gehman, H. M., 1979, Methods of estimating oil and gas resources: American Association of Petroleum Geologists Bulletin, ~ 63, no. 10, p. 2183-2192.
Wilmarth, M. G., 1957, Lexicon of geologic names of the United States, Part 1, A-L, part 2, M-Z, U.S. Geological Survey Bulletin 896, 2396 p.
Wilson, J. A., 1956, Miocene formations and vertebrate biostratigraphic units, Texas Coastal Plain: American Association of Petroleum Geologists Bulletin, v. 40, no. 9, p. 2233-2246.
87

Woodbury, H. 0., Murray, I. B., Jr., Pickford, P. J., and Akers, W. H., 1973, Pliocene and Pleistocene depocenters outer continental shelf, Louisiana and Texas: American Association of Petroleum Geologists Bulletin, ~ 57, no. 12, p. 2428-2439.
Young, A., Monaghan, P. H., and Schweisberger, R. T., 1977, Calculation of ages of hydrocarbons in oils--physical chemistry applied to petroleum geochemistry: American Association of Petroleum Geologists Bulletin, v. 61, p. 573-600.
Zapp, A. D., 1961, World petroleum resources, in Domestic and world resources of fossil fuels, radioactive minerals, and geothermal energy: Prel iminary reports prepared by members of the U. S. Geological Survey for the Natural Resources Subcommittee of the Federal Science Council, November 28, 1961 (unpubl ished).
1962, Future petroleum producing capacity of the United States: U. S. Geological Survey Bulletin 1142-H, 36 p.
88

APPENDIX
89

APPENDIX
MIOCENE FIELD INVENTORY BY RAILROAD DISTRICT AND COUNTY
District County Number Field
4 Aransas Fulton Beach
2 Halfmoon Reef
Brooks 3 Alta Mesa
3.5 Carl Peters
Cameron 4 Boory
5 Ho lly Beach
6 Luttes
7 Padre Island
8 Parks Farm
9 Port Isabel W
10 San Martin
11 Three Islands E
12 Vista Del Mar
Duval 13 Sejita E
Hidalgo 14 Hidalgo W
Kenedy 15 Cabazos
16 Monte Pasture
17 Murdock Pass
18 Murdock Pass W
19 Penascal
21 Potrero Lopena S
22 Ri ta
23 San Jose
90

District County Number Field
4 Kenedy 24 Sarita
25 Sti llman
4 Kleberg 26 Chevron
27 Alazan
28 Alazan N
29 Hinojosa
30 Kingsville
32 Lobo
Nueces 33 Agua Dulce
34 Baldwin
35 Clara Driscoll
36 Cody
37 Corpus Christi
38 Flour Bluff
39 London/London Gin
40 Luby
41 McGregor
42 Minnie Bock
43 Nueces Bay
44 Petronilla
45 Ramada
46 Saxet
47 Turdey Creek
48 Viola
48.5 Chapman Ranch
91

District County Number Field
4 San Patricio 49 Odem
50 Plymouth
51 Portilla
52 Reymet
53 Sinton N
54 Sinton W
55 Taft
56 Taft W
57 White Point
Wi llacy 58 Arroyo Colorado
59 Chess
60 Harena
61 King Ranch W
62 La Sara
63 Paso Real
64 Raymondsville
66 Willamar
2 Bee 67 Blanconia
Calhoun 68 Heyser
69 Jay Welder
70 Matagorda Bay
71 Playa
72 Powderhorn E
73 Powderhorn WISE
92

District County Number Field
2 Calhoun 74 Saluria
75 Sherman Offshore
76 Six-Sixty
77 Steamboat Pass
Go 1 i ad 78 C 1 i P
Jackson 80 Carmichael
81 Coll ier
82 Cordele
83 Cordele S/SE
84 Cordele W
85 Francitas
86 Granado
87 Hornberger
88 Mayo
89 Morales
90 Navidad
91 West Ranch
Lavaca 92 Borchers
93 Hope
94 Morales N
95 Speaks
Refugio 96 Bonnie View
97 Fagan
98 Greta
99 Huff
100 La Rosa
93

District County Number Field
2 Refugio 101 Lake Pasture
102 Lake Pasture W
103 Refugio Heard
104 Refugio New
105 Refugio Old
106 Refugio-Fox
107 Tom O'Connor
Victoria 108 Coletto Creek
109 Coletto Creek S/SW
110 Cologne
111 Garcitas Creek
112 Kay Creek
113 McFaddin
114 McFaddin N
115 Nursery S
116 Pridham Lake
117 Salem
118 Te lferner
119 Victoria
3 Brazoria 121 Bastrop Bay
122 BR Blk 386-5
123 Cowtrap
124 Damon Mound
125 Danbury Dome/Danbury
126 Freeport
94
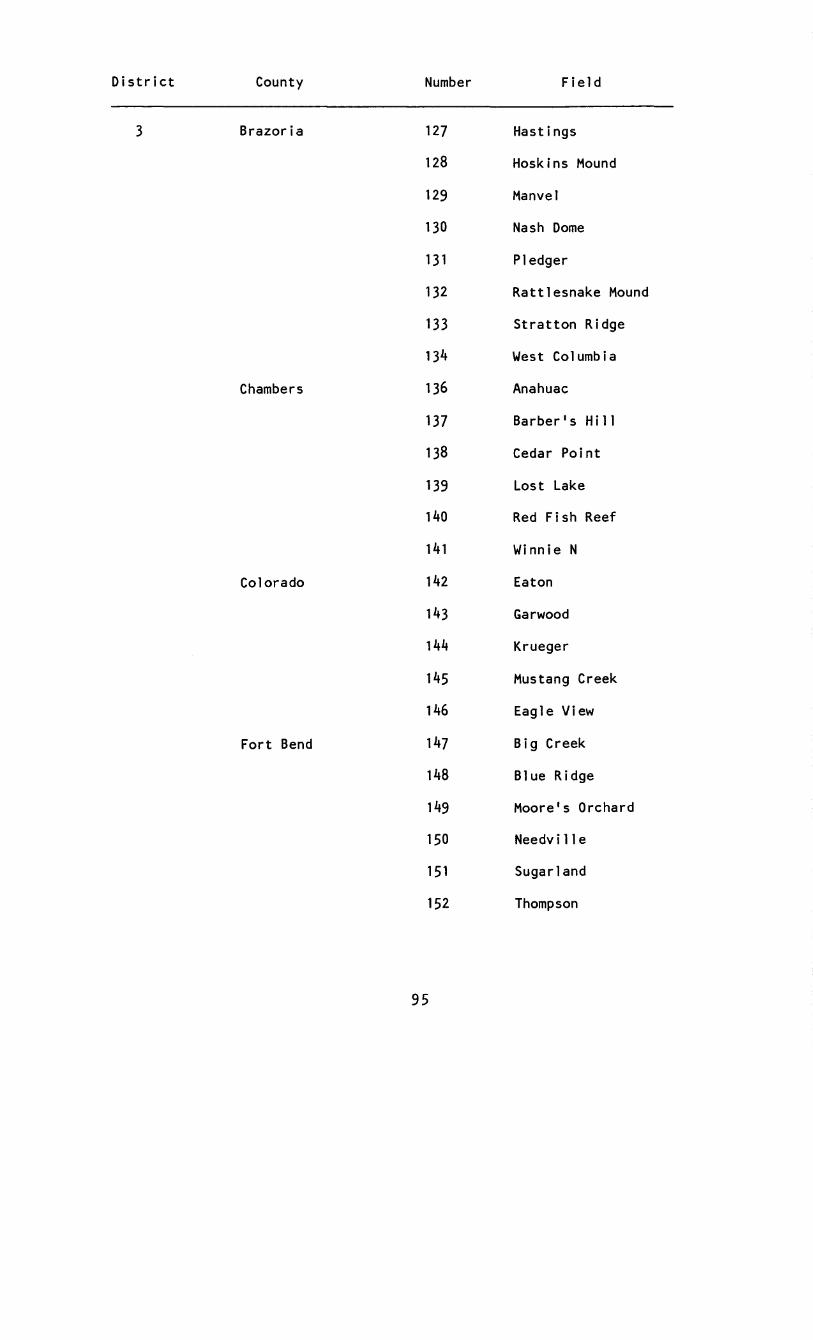
District County Number Field
3 Brazoria 127 Hastings
128 Hoskins Mound
129 Manvel
130 Nash Dome
131 Pledger
132 Rattlesnake Mound
133 Stratton Ridge
134 West Columbia
Chambers 136 Anahuac
137 Barberis Hi 11
138 Cedar Point
139 Lost Lake
140 Red Fish Reef
141 Winnie N
Colorado 142 Eaton
143 Garwood
144 Krueger
145 Mustang Creek
146 Eagle View
Fort Bend 147 Big Creek
148 Blue Ridge
149 Moorels Orchard
150 Needville
151 Sugarland
152 Thompson
95

District County Number Field
3 Galveston 153 Blk.176-5
155 Caplen
156 Crystal Beach
160 Galveston Bay W
161 Gs. Blk. 310-L
162 Galveston Island
162.5 Gs. Bl k. 102-L
163 High Island
164 Hitchcock
165 Lafittes Gold
166 Point Bolivar N
167 Shipwreck
168 Teichman Point
Hardin 169 Batson Old
170 Saratoga
171 Sour Lake
171.5 Arriola
Harris 172 Clear Lake
173 Clinton
174 Deckers Prairie S
175 Dyersdale
176 Goose Creek
177 Houston S
178 Humble
179 Olcott
96

District County Number Field
3 Harris 180 Pierce Junction
181 Tomball
182 Webster
(High Island) 183 H. I. Blk. 10L
184 Blk. 14L
185 Blk. 19S
186 Blk. 24L
187 Blks. 30, 30L
188 Blk. 52m
189 Blk. 129
190 Blk. 140L
3 Jefferson 192 AmelIa
193 Beaumont
194 Beaumont W
195 Big Hill
196 Clam Lake
197 Fannett
199 La Belle
200 Lovells Lake
201 McFaddin Ranch
202 Sabine Pass
203 Spindletop
204 Stowell
204.5 McFaddin Beach
97

District County Number Field
3 Li berty 205 Dayton N
206 Esperson Dome
207 Hankamer
209 Hankamer SE
210 Hu 11
211 Li berty S
212 Moss Bluff
Matagorda 213 Blk. 368-L
214 Blk. 369-L
216 Br. Blk. 405
217 Br. Blk. 440
218 Br. Blk. 445
219 Br. Blk. 446
220 Br. Blk. 519-S
221 Collegeport
222 Colorado Delta
223 Cove
224 El Gordo
226 Kain
227 Markham
228 Matagorda Bay
229 01 i ver Pte
230 Oyster Lake
231 Oyster Lake W
232 Rusty
233 Sargent S
98

District County Number Field
3 (Matagorda) 234 Blk. 485-L
235 Blk. 582-5
Montgomery 236 Conroe
Orange 237 Orange
238 Port Neches
Wharton 239 Blue Basin
240 Boling
241 Duffy
242 Hi II i e
244 Hutchins
245 Lane City
246 Li ss i e
247 Louise
248 Louise N
249 Magnet Withers
250 New Taiton
251 Popp
252 Prasifka
253 Spanish Camp
254 Trans-Tex
255 Hungerford
99