Knut Wicksell, Lectures on Political Economy - Volume II Money

MINSKY MEETS WICKSELL: USING THE WICKSELLIAN MODEL
TO UNDERSTAND THE TWENTY-FIRST CENTURY BUSINESS CYCLE
Charles L. Weise
Department of Economics
Gettysburg College
(http://www.gettysburg.edu/academics/economics/char_weisehomepage/charles_weise.dot)
Robert J. Barbera
Chief Economist, ITG
May 2008
Forthcoming in Giuseppe Fontana and Mark Setterfield (eds.), Macroeconomic Theory and
Macroeconomic Pedagogy, Basingstoke and New York, Palgrave Macmillan.

1
The recent turmoil in U.S. financial markets presents undergraduate macroeconomics
instructors with an opportunity to link dry textbook presentations to exciting and important real
world events. Speculative excess and panic in financial markets, vulnerability of the banking
system, widening credit spreads, the Fed’s difficulty in managing long-term risky interest rates,
and its use of unconventional open market operations are topics that have been discussed
extensively in the financial press. Unfortunately, the IS-LM model that is still the centerpiece of
most Intermediate Macroeconomics and Money and Banking textbooks is not well-suited for an
analysis of such topics. IS-LM takes the money supply rather than the interest rate as the target
for monetary policy and makes no distinction between short and long, risk-free and risky interest
rates. The Romer (2000) model, variants of which have appeared in some recent textbooks (e.g.
Taylor, 2003; Frank and Bernanke, 2004; DeLong and Olney, 2006), rectifies the first of these
problems but at great expense. By assuming that the Federal Reserve controls the key interest
rate, the Romer model has monetary policy directly affecting investment, thereby abstracting
entirely from the banking and financial sector. Thus a great virtue of the IS/LM framework, its
depiction of monetary policy as a tool that acts through the financial system, is lost. On two
counts we would submit that the loss is unacceptable. First, financial markets/banking system
developments have played a central role in unfolding U.S. and global macroeconomic
developments over the past twenty years. Second, the ascendance of financial economics in the
world of economic theory, over the past twenty years, is undeniable. This, in turn, argues for a
larger—not smaller—place for banks and asset markets in an ideal intermediate macro
framework.
This paper demonstrates how a variant of the Wicksellian model in Weise (2007) can be
used to help students understand recent events in financial markets and the macroeconomy. In

2
the process, it introduces students to some of the insights of financial economics and some of the
key arguments made by Hyman Minsky as to the centrality of finance in the generation of
business cycles. Basic financial economy notions concerning yield curve and credit spread
theories are key drivers in the model and thus render discussions of these concepts central rather
than ancillary. We do not attempt a complete formalization of Minsky’s theories (for a recent
treatment see Bellofiore and Ferri, 2001); instead, we integrate one key Minskyan concept – the
evolution of perceptions of risk over the business cycle as reflected in credit spreads – into the
Wicksellian model and draw out the implications for the macroeconomy and the challenges
facing the Federal Reserve. Echoing Weise (2007), the paper places financial market dynamics
between Fed controlled overnight rates and the risky real rates that drive investment. In addition,
by adding Minsky’s insights about risk appetites, the model is able to explain periodic sharp
shifts in Fed policy in a fashion that is missing from more traditional approaches.
1. A Minskyan interpretation of recent financial market crises
Referring to the recession of 2001, Paul Krugman (2002) wrote ―this is not your father’s
recession – it’s your grandfather’s recession.‖ By this he meant that the 2001 recession (and by
extension the likely recession of 2008) was not triggered by interest rate increases intended to
reduce inflation as was typical of post-Great Depression recessions. Rather, today’s recessions
are driven by the kind of investment boom and bust cycle that produced repeated ―panics‖ in the
nineteenth and early twentieth centuries. Seeking a way of understanding the current financial
market crisis-cum-recession, a number of authors (e.g. Kregel, 2007; Leamer, 2007; Whalen,
2007; Wray, 2007) have argued for a reconsideration of the works of Hyman Minsky. As
Barbera and Weise (2008) argue, the Federal Reserve’s success in eliminating inflation as an
important destabilizing influence in the U.S. economy since the early 1980s has laid bare the

3
financial sources of business cycles of the kind described by Minsky (1975) and elsewhere.
Minsky’s ideas are worth incorporating into undergraduate macroeconomics courses.
The core of Minsky’s theory is the ―financial fragility hypothesis,‖ according to which
financial institutions’ tolerance for taking risky positions in asset markets evolves over time,
affecting firms’ financing decisions and the level of investment. In Minsky’s model, the level of
investment by a firm is constrained by the net cash flow generated by its assets and liabilities and
its ability or willingness to borrow to finance investment. Firms and prospective lenders adopt
conventions that guide the optimal ratio of external (debt) financing to internal financing. These
conventions reflect perceptions of risk or what Minsky refers to as the appropriate ―margin of
safety.‖ When confidence is high, firms want to rely more heavily on external versus internal
finance, and therefore increase purchases of capital goods. When confidence is low, firms want
to reduce external finance and so reduce the pace of investment.
Minsky (1986) describes the typical phases of a finance-led business cycle. In the early
stages of recovery from a recession, memories of previous financial calamity heighten the
perception of risk by borrowers and lenders. Firms leave themselves a large ―margin of safety‖
by reducing debt and financing most of their investment internally. What external financing they
do is in the form of ―hedge financing‖: the purchase of assets that generate sufficient income to
cover interest payments and amortize the debt. As recovery persists and leads to expansion,
perceptions of risk are reduced and firms begin to increase the amount of debt used to finance
investment. In this phase borrowing takes the form of ―speculative financing,‖ in which the
income generated by the purchased assets is sufficient to cover interest payments alone. As the
expansion endures, perceptions of risk fall further. A high level of leverage becomes the norm,
the purchase of new assets being financed by ―ponzi borrowing,‖ under which the firm’s ability

4
to make interest payments and pay down the debt is contingent on rising prices of its purchased
assets. At some point during the expansion, some event will inevitably cause realized profits to
fall short of expectations, causing firms to increase their perception of risk and pull back on
investment. The result is a cumulative process in which profits fall, perceptions of risk increase,
firms purge their balance sheets of debt, asset prices fall, and the economy sinks into a deep
recession.
Minsky’s template aptly characterizes the internet boom and bust of 1997-2001 and the
housing market boom and bust of 2003-2008. The internet bubble of the 1990s began with real
productivity-enhancing innovations that sparked a stock market and investment boom. These are
shown in Figure 1. The boom accelerated as borrowers and speculators took advantage of new
markets for exotic financial derivatives and money poured into hedge funds and other loosely
regulated entities. Interest rate increases followed by a slowdown in growth in 2000 popped the
bubble, causing stock markets to crash and nonresidential investment to nosedive, and the
economy fell into recession in early 2001. The housing market bubble emerged out of the ashes
of the recession as the Fed maintained a low interest rate policy and savers, stung by losses in the
stock market, searched for higher-yielding assets elsewhere. Rising housing prices attracted
speculative and then ponzi borrowing in the form of innovative mortgage contracts such as no
down payment mortgage loans, adjustable rate mortgages, and 2/28 adjustable rate loans with
―teaser‖ rates. The availability of cheap finance created a boom in housing construction as shown
in Figure 2. As the housing boom began to cool off at the end of 2006, housing price increases
failed to match expectations and borrowers who had counted on being able to refinance on the
basis of higher home values were unable to do so. Beginning in 2007, households and lenders

5
sought to deleverage their positions in the housing market, resulting in a tightening of lending
standards, foreclosures, a steep drop in residential investment, and (possibly) another recession.
The housing boom and bust carried with it a Minskyan boom-bust cycle in other financial
markets. The securitization of home mortgages during the boom period and the overly optimistic
estimates of likely default rates provided a cheap form of financing for a number of speculative
activities in the business sector. The proliferation of mortgage-backed securities, collateralized
debt obligations, conduits, and structured investment vehicles facilitated an increase in leverage
in the business sector as a whole. The collapse of the housing market called into question the
value of mortgage-backed securities and led to a deleveraging process that has pushed asset
prices down and caused liquidity to dry up in certain sectors of the financial system, worsening
the threat of recession.
2. Minsky modifies Wicksell
Minsky’s story of evolving attitudes toward risk and the consequent asset market
imbalances and crashes can be taught in an undergraduate macroeconomics class using a version
of Weise’s (2007) Wicksellian macroeconomic model. The centerpiece of Minsky’s financial
instability hypothesis is that there is a consistent pattern to the perception of risk over the course
of a business cycle. The original version of the Wicksellian model abstracted from considerations
of risk. In this paper we add a risk premium or credit spread as an additional wedge between the
Federal Reserve’s monetary policy instrument and the market interest rates relevant for the
determination of aggregate demand. This model modification allows us to provide a much more
realistic description of both the late 1990s technology boom and the more recent housing boom
and bust. More importantly, the model does three things. It exposes the difficulties the Fed now
faces as it tries to respond to the current financial crisis. It offers a rationale for the

6
unconventional market interventions to which the Fed has resorted in recent months. Lastly, it
reveals an asymmetry in recent Fed policy that may have contributed to the violence of recent
asset market upheavals.
When we discuss the risk premium in the context of the Wicksellian model, we have in
mind something like the difference between the yields on Baa corporate bonds and ten-year U.S.
Treasury notes. Figure 3 shows that, consistent with Minsky’s theory, recessions (shown as
shaded areas) tend to coincide with sharp increases in this credit spread while the credit spread
plunges during recoveries. Importantly, the spread has a clear tendency to continue to shrink as
expansion endures. At times, however, financial market turmoil not associated with recession
generates dramatic spread widening. Spreads soared during the 1987 stock market crash, the
Mexican peso crisis of 1994-95, and the collapse of Long Term Capital Management in 1998. In
each of these cases the Federal Reserve responded with lower interest rates and expanded access
to the discount window. Spreads tightened thereafter. Clearly monetary policymakers are quite
sensitive to major swings in spreads. Statements by Fed officials make it equally clear that these
reactions are linked to concerns about risk assessments.
Our model makes an important distinction between perceptions of risk in our model and
the state of expectations of consumers and investors. Perceptions of risk, represented by the risk
premium, refers to the subjective probability assigned to adverse events: technically, in Minsky’s
theory, the probability that the cash flow generated by the firm’s assets will be insufficient to
make payments required by the firm’s liabilities. More generally, the risk premium reflects
considerations of liquidity preference, which is a concept inseparable from broader conceptions
of financial risk. Thus sharp shifts in credit spreads at once reflect changing attitudes about risk
and shifting sentiments about liquidity needs. In an uncertain environment, firms will seek to

7
weight their asset holdings towards more liquid assets such as Treasury securities so that they are
in a position to cover shortfalls in cash flow. During a crisis, the demand for safe securities
relative to more risky securities rises as firms try to stay (or become) liquid, driving the risk
premium up.
Whereas risk reflects in a sense the variance of asset returns, the state of expectations
refers to the expected value of future returns on a firm’s assets or the profitability of investment.1
The risk premium as we define it enters into the cost of capital for the firm, while the state of
expectations affects the demand for investment at a given cost of capital. Of course, during
booms and busts the risk premium and state of expectations tend to move together: optimism
about rates of return goes hand in hand with conviction that bad outcomes are only a remote
possibility. But Minsky, insightfully, distinguishes between mean expectations and concerns
about potential for disappointment. In Minsky’s framework consumer and business expectations
may well remain rational over the course of an expansion. But even amidst steady mean
expectations, fear of disappointment recedes as an expansion matures—and as such risk appetites
grow. Thus it is essential that we model these two concepts separately.
The Wicksellian model with credit risk consists of three equations.
TS curve: rt = (ft-Etπt+1++)+(1-)rt*+ηt (1)
IS curve: yt = -(rt-rt*)+ut (2)
AS curve: t = Ett+1+yt+vt (3)
1 Consider, for example, an asset that pays $95 with probability one-half and $105 with probability one-half. Its
expected payoff is $100 and the variance of its payoff is 25. An improvement in the state of expectations is an
increase in the expected payoff that does not affect the variance. For example, if the possible payoffs rise to $100
and $110, the expected payoff is now $105 while the variance is unchanged. A decrease in risk is a decline in the
variance that does not affect the mean. For example, if the possible payoffs are $99 and $101, the expected payoff is
still $100 while the variance has fallen to 1.
8
The IS and AS curves are consistent with widely-used linearized versions of the New Keynesian
model. The IS curve says that the output gap (yt) is negatively related to the deviation of the real
long-term risky interest rate (rt) from the Wicksellian natural rate of interest (rt*), defined as the
real risky interest rate consistent with full employment in the absence of temporary demand
shocks, plus a demand shock (ut). The AS curve says that the inflation rate πt is determined by
expectations of future inflation, the output gap (yt), and a price shock (vt).
The term structure (TS) curve determines the real long-term risky interest rate (rt). A
complete derivation of this equation is provided in the Appendix. The TS curve embodies the
expectations theory of the term structure of interest rates, according to which long-term rates are
a weighted average of current and expected future short-term rates. The first term is the federal
funds rate (ft) adjusted for expected inflation (Etπt+1), the term premium (τ), and the average risk
premium (σ). This is meant to represent the ―short end‖ of the yield curve. The second term
represents the ―long end‖ end of the yield curve, which is anchored by the Wicksellian natural
rate of interest (rt*). The real long-term risky interest rate is a weighted average of these two
terms plus a stochastic risk premium shock (ηt). The coefficient ω can be interpreted as the
length of time (expressed as a fraction of the term of the long-term bond) during which short-
term rates are expected to depart from their long-run equilibrium values. As such, we can
interpret ω as the ―persistence‖ of monetary policy decisions. In the Appendix, ω is defined as
the length of the ―period‖ during which shocks occur and monetary policy decisions are made,
expressed as a fraction of the term of the long-term bond.
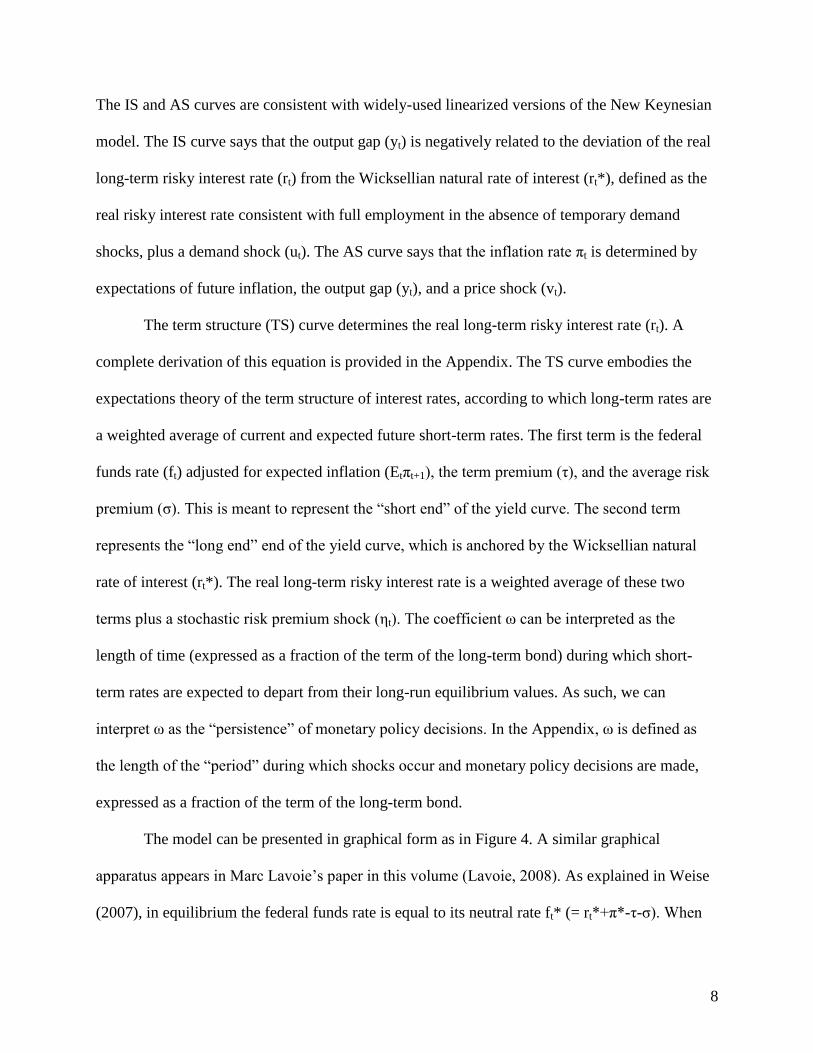
The model can be presented in graphical form as in Figure 4. A similar graphical
apparatus appears in Marc Lavoie’s paper in this volume (Lavoie, 2008). As explained in Weise
(2007), in equilibrium the federal funds rate is equal to its neutral rate ft* (= rt*+π*-τ-σ). When

9
the federal funds rate is at this level and there are no risk premium, demand, or price shocks, the
real interest rate is equal to the Wicksellian natural rate, the output gap is zero, and inflation is at
its long-run average or target rate (π*). If the Federal Reserve reduces the federal funds rate, the
real interest rate falls along the TS curve. The reduction in the real rate is less than one-for-one
because the long end of the yield curve is anchored by the Wicksellian natural rate. The decline
in the real interest rate increases output along the IS curve, which causes inflation to rise along
the AS curve. If expectations are adaptive, deviations of inflation from the target level in one
period may cause the AS and TS curves to shift in later periods, generating interesting dynamics.
These are discussed in detail in Weise (2007) but are not considered here for reasons given
below.
There are four types of shocks that can shift the curves in Figure 4. The first three are risk
premium shocks (ηt), which shift the TS curve; price shocks (vt), which shift the AS curve; and
temporary spending shocks (ut), which shift the IS curve. The fourth type of shock is a shock to
the Wicksellian natural rate of interest. The natural rate of interest is generated by the process
rt* = rt-1*+zt (4)
A nonzero realization of zt is interpreted as a permanent spending shock that changes the long-
run equilibrium interest rate consistent with full employment. For example, in the loanable funds
model with output fixed at the full employment level, a decrease in savings or an increase in
investment demand results in a higher equilibrium interest rate. Thus a nonzero realization of zt
shifts the IS curve, and because the IS curve is expected to remain in its new position for the
indefinite future, the TS curve shifts as well.
The important events of the internet and housing boom and bust can be represented by
shocks to the natural rate of interest and the risk premium. The story can be told without

10
reference to the inflation rate, so we omit the aggregate supply component of the model in the
analysis that follows.
Consider first a shock to the risk premium (ηt), shown in Figure 5. A rise in perceptions
of risk in the financial sector causes borrowers and lenders to reassess the ―margin of safety‖
associated with debt finance. Perceiving a higher probability of bad outcomes on loans (an
increase in the variance around expected future cash flows), lenders offer less favorable
borrowing terms on loan contracts, including higher interest rates on loans subject to default risk.
The TS curve shifts up and the real long-term risky interest rate rises for any given federal funds
rate (from r* to r1). This stimulates a lower level of investment and output – the output gap falls
from 0 to y1 along the IS curve. If the Fed’s objective is to stabilize the output gap around zero,
the appropriate response is to reduce the federal funds rate one-for-one with the reduction in the
risk premium. Likewise a tightening of credit spreads that lowers risky rates requires a higher
federal funds rate. As we show below, the Federal Reserve seems to have failed to appreciate this
implication of the model during the internet and housing bubble periods.
The effect of a positive shock to the Wicksellian natural rate of interest (zt>0) is shown in
Figure 6. The IS curve shifts to the right such that the output gap is zero at the new higher natural
rate r**. If the real long-term interest rate stays at r* the output gap rises to y1. Because the
increase in expenditures is expected to be long-lasting, however, the expected future interest rate
rises to r** which pushes the current long-term interest rate up. But since the short end of the
yield curve is held down by the Fed’s choice of federal funds rate, the long rate rises less than
one-for-one with the rise in the natural rate. Graphically, the TS curve shifts up part way towards
r**. If the federal funds rate stays at f* the long-term interest rate rises to r1, causing output to
fall back to y1 along the new IS curve. The difference between y1’ and y1 is a measure of the

11
―crowding out‖ effect of spending shocks brought on by automatic changes in long-term interest
rates. The net effect of the expenditures shock is to increase output. If the Fed wants to stabilize
the output gap around zero it needs to increase the federal funds rate to the new neutral rate, f**.
3. Booms and crashes
The story of the internet bubble in the late 1990s and the housing boom and bust in recent
years can be told in terms of shocks to expenditures and the risk premium. The canonical
speculative boom begins to be formed after a period of steady growth. As memories of previous
recessions and financial crises recede, borrowers’ and lenders’ tolerance for taking risky
positions in asset markets increases: the risk premium (ηt) falls. At the same time, forces real and
imagined contribute to a feeling of optimism about the profitability of new investment,
stimulating an increase in investment expenditures and asset prices. The rise in asset prices
stimulates a higher level of consumption. The increase in investment and consumption
constitutes an increase in expenditures that is perceived as long-lived, so zt takes a positive value.
Figure 7 shows the effects of these shocks. The positive expenditures shock shifts the IS
curve to the right and pushes the TS curve up towards the dashed line shown in the TS graph. At
the same time, however, the Minskyan shift in risk tolerance shifts the TS curve down. The net
effect is a shift in the TS curve from TS0 to TS1. As a result, the interest rate, rather than
increasing as it would in the event of a pure expenditures shock, falls to r1 while the output gap
rises to y1. The result is an economic boom fed by low borrowing costs.
The collapse of the bubble causes this process to reverse, as shown in Figure 8. We begin
with interest rates at r1 and output at y1. A break in investors’ psychology, perhaps brought about
by concerns about inflation or an increase in interest rates, causes the new economy attitudes to
disappear. Firms and households reduce expenditures, shifting the IS curve back to IS0. At this

12
point a ―soft landing‖ seems plausible: the output gap is moving toward zero on its own and a
slight increase in interest rates driven by a reversal of the earlier reduction in credit spreads will
finish the job. But in 2000 and again in 2007, attitudes toward risk swing violently in the
direction of pessimism. As firms seek to reduce their leverage, prices of risky assets plummet
and credit spreads widen dramatically. The TS curve shifts past its original level (TS0) up to TS2.
Now if the federal funds rate remains at f*, the real risky interest rate rises to r2 and the economy
falls into recession with an output gap of y2.
4. The complications for monetary policy
The Minskyan perspective exposes the complications the boom-bust cycle poses for
monetary policy. Suppose following the positive expenditures shock shown in Figure 7, the Fed
considers a monetary policy response without accounting for the effect of the rising risk
premium. Policymakers operating in a conventional New Keynesian, rational expectations
framework would interpret the expenditures shock as consumers’ and investors’ rational
response to a revision of growth expectations. They would understand that the equilibrium real
interest rate had risen to r**. Their intuition would be confirmed when the yield on ten-year
Treasuries rose. Counting on the stabilizing effect of the increase in the ten-year (risk-free) rate,
they would calculate that a modest increase in the federal funds rate from f* to f** would be
sufficient to restore the economy to full employment. Output would continue to rise, however,
despite the Fed’s attempts at tightening. Only a much more aggressive policy that accounts for
the effect of rising risk appetites – increasing the federal funds rate to f1 in Figure 7 – would be
sufficient to keep the economy from overheating. Likewise, during the Minskyan bust in Figure
8, the Fed must ease dramatically by reducing the federal funds rate to f2. If the Fed ignores the

13
movement in credit spreads it will under react, reducing the federal funds rate to f*, and
economic deterioration will accelerate.
This model can explain some recent puzzles in the Fed’s conduct of monetary policy: the
Fed’s aggressive response to economic contraction in 2001 and 2007-08 and its failure more
aggressively to combat the housing bubble in 2003-05. It is commonplace among economists and
Fed watchers and in undergraduate economics courses to explain monetary policy decisions with
reference to the Taylor (1993) rule. Taylor’s original rule was
ft = (r*+πt,12)+.5*(πt,12-2)+.5*yt (5)
where the real value of the neutral federal funds rate is assumed to equal 2, the inflation target is
also equal to 2, πt,12 is the inflation rate over the previous 12 months, and yt is the output gap. In
unemployment gap form with an Okun’s coefficient of 2, the Taylor rule is
ft = (2+πt,12)+.5*(πt,12-2)-(ut-u*) (6)
where ut is the unemployment rate and u* is the natural rate of unemployment. The model
described above suggests modifying the Taylor rule by adjusting the neutral federal funds rate to
changes in the Wicksellian natural rate of interest and shocks to the risk premium. That is, the
Fed should follow a Taylor rule of the form
ft = (rt*-τ-σ+πt,12)+.5*(πt,12-2)-(ut-u*)-ηt (7)
as in the Appendix. Here the term rt*-τ-σ is the neutral real federal funds rate, which Taylor
assumed to be equal to two and which we now take to vary with variation in the Wicksellian
natural rate. The last term says that the Fed should offset shocks to the risk premium one-for-one
with changes in the federal funds rate.
Operationalizing this Taylor rule requires estimates of rt*, τ, δ, and ηt. For τ and σ we use
the average (over the period 1960-2008) values of the difference between the yields on ten year

14
U.S. Treasury securities and the federal funds rate and the difference between the yields on Baa
corporate bonds and ten year U.S. Treasuries, respectively. A simple back-of-the-envelope
computation of the Wicksellian natural rate as perceived by participants in financial markets is
the five-year forward rate implied by yields on five year and ten year U.S. Treasury Inflation-
Protected Securities (TIPS) plus the average risk premium on Baa corporate bonds. The risk
premium shock ηt is the Baa-Treasury spread minus the average spread from 1960 to 2008.
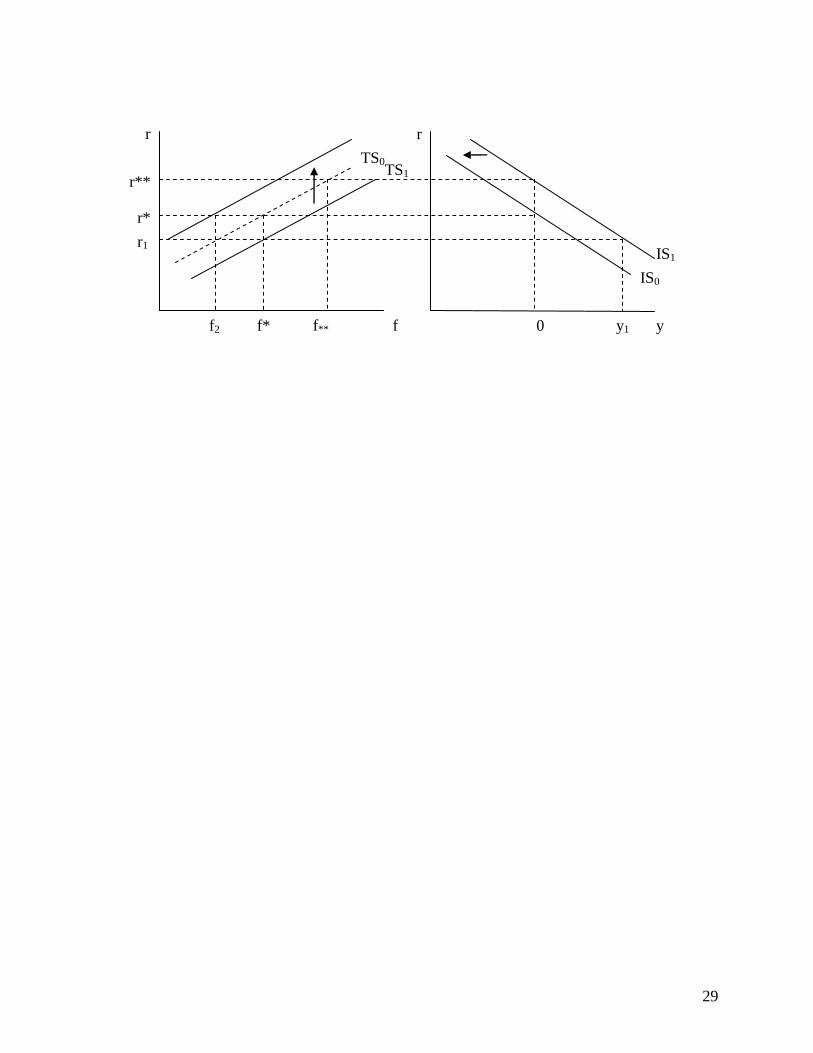
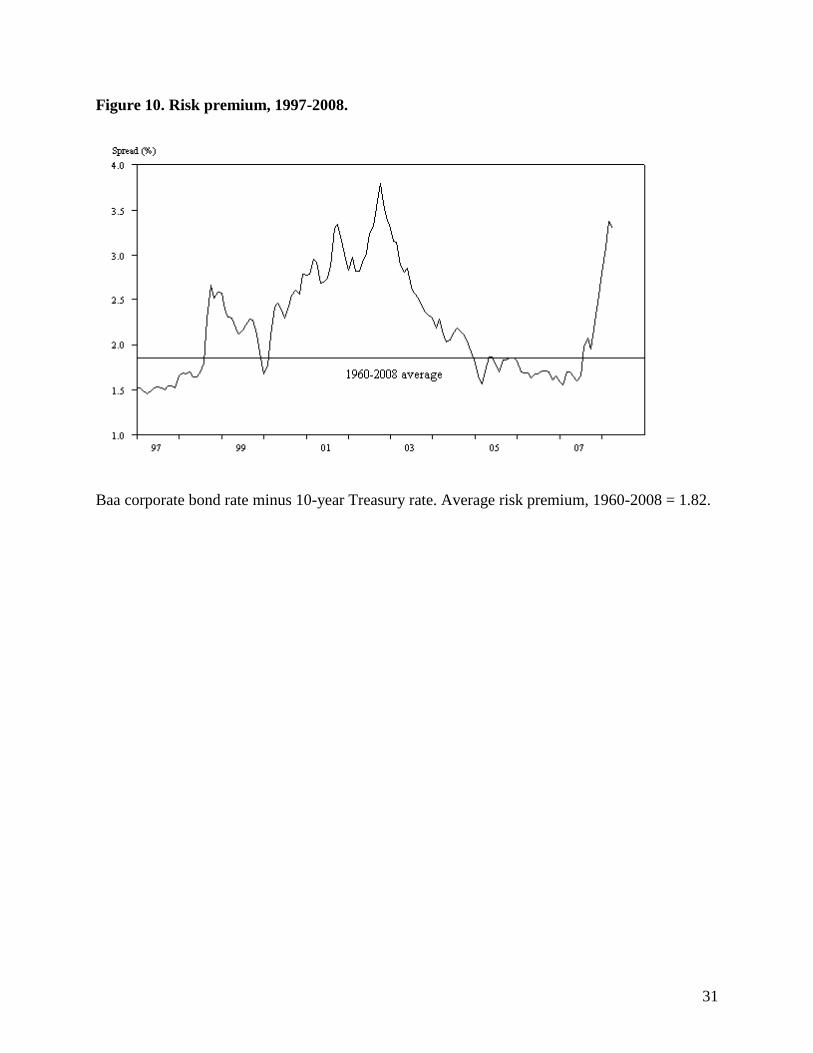
Figures 9 and 10 show the evolution of our estimate of the Wicksellian natural rate and
the risk premium shock for the period 1997-2008 (the period for which TIPS yields are
available). Figure 9 shows an increase in the estimated natural rate of interest during the ―new
economy‖ boom of the late 1990s followed by a substantial decline from 2000 to 2005. There is
a slight increase during the housing boom of 2005-07 followed by another sharp drop beginning
in the middle of 2007. In our model these movements are interpreted as fluctuations in the state
of expectations among investors that produce shifts in the IS curve. Figure 10 shows a sharp
increase in the risk premium during the 1998 LTCM crisis, a return to ―normal‖ boom levels in
1999, and then an increase coinciding with the stock market crash of 2000 and the recession of
2001. The risk premium peaks in mid-2003, declining to near-1990s levels during the 2005-2007
housing boom. The financial crisis of 2007 brings about another sharp increase. In our model
these movements are interpreted as changes in perceptions of risk that shift the TS curve.
Figure 11 compares the actual monthly federal funds rate with the rate predicted by two
alternative versions of the Taylor rule described above. The first assumes that the Fed follows a
conventional Taylor rule, ignoring risk premia while adjusting the neutral federal funds rate to
changes in its estimate of the natural rate of interest. The second is the (Minskyan) Taylor rule
recommended by our model, according to which the Fed adjusts the neutral federal funds rate

15
one for one with shocks to the risk premium. The conventional Taylor rule cannot explain the
Fed’s aggressive interest rate reductions in 2001 to 2003 or in 2007-08. The Minskyan Taylor
rule, by contrast, tracks the movements in the actual federal funds rate fairly well during these
periods. The Minskyan Taylor rule prescribes a more aggressive tightening in 1998-2000 and
2003-05 than does the conventional Taylor rule. Neither rule, however, captures actual Fed
policy during these periods. In both instances the Fed delayed raising the federal funds rate for
several months after the Minskyan Taylor rule recommended a tightening, and then increased
rates at a more modest pace than recommended by the rule. This analysis exposes an asymmetry
in the Fed’s response to changes in the risk premium: the Fed has acted aggressively to combat
financial stress in periods of rising risk premia, but it has been slow to raise interest rates in
response to signs of financial excess.
5. Unconventional monetary policy actions
Sharp increases in the risk premium during financial crises have the potential to present
the central bank with a familiar problem, that of a liquidity trap. In models that abstract from the
risk premium, a liquidity trap is a rather exotic situation in which the real interest rate associated
with full employment is so low that even a federal funds rate of zero cannot achieve it. In
particular, if we ignore the risk premium a liquidity trap occurs when the real interest rate
consistent with full employment is less than τ-Etπt+1. For example, suppose that the term
premium is 0.8 (the average over the 1960-2008 period) and inflation is expected to be 2.5
percent, so that τ-Etπt+1 = -1.7 percent. If a leftward shift in the IS curve creates a situation in
which the real interest rate consistent with full employment is less than -1.7 percent, the Fed will
not be able to reduce the federal funds rate far enough to achieve full employment and the
economy will be in a liquidity trap. A spike in the risk premium makes a liquidity trap much

16
more likely. In ordinary times with a risk premium of 1.8 (the 1960-2008 average), a liquidity
trap occurs if the real interest rate consistent with full employment falls below τ+σ-Etπt+1 = 0.1
percent. In early 2008 the Baa-ten year Treasury spread rose to 3.4 percent, raising the risk of a
liquidity trap if the real interest rate consistent with full employment fell below 1.7 percent.
Precisely this concern drove the Federal Reserve to introduce a number of new lending
facilities in early 2008 that constitute a dramatic break from standard operating procedure. Using
these facilities, namely the Term Auction Facility, the Term Securities Lending Facility, and the
Primary Dealer Credit Facility, the Fed has rapidly replaced the Treasury securities on its
balance sheet with agency debt (mortgage-backed securities). This maneuver is analogous to a
central bank’s using sterilized intervention to support its currency: the Fed lends reserves to the
banking system taking agency debt as collateral, then offsets these purchases with sales of
Treasury securities to prevent the aggregate level of reserves from rising, which would threaten
its federal funds target. In the Minsky-adjusted Wicksellian model, the Fed is attempting to act
directly on the risk premium in addition to lowering the federal funds rate. The Fed likewise
attempts to affect the risk premium when it makes dramatic policy moves or statements. Of
course, the literature on sterilized interventions suggests that the Fed’s ability to manipulate the
risk premium is severely limited because of the size of the market and the limited resources of
the central bank. While the Minsky-adjusted Wicksellian model shows how the Fed’s policies
would work if successful, students can be made aware of the limitations in practice.
6. Conclusion
We have not attempted in this paper to formalize some of the most important elements of
Minskyan analysis. Wray and Tymoigne’s paper in this volume (Wray and Tymoigne, 2008)
present a more thorough analysis of Minsky’s theories. We do not address Minsky’s arguments

17
concerning the endogeneity of attitudes toward risk. Minsky argued that there is a natural
tendency for risk aversion to diminish as memories of previous financial calamity recede. Hence
expansion sows the seeds of the financial crisis that brings it to an end. In modeling the risk
premium as a stochastic variable we have done some violence to Minsky’s theory in this respect.
Another important point in Minsky’s work is that increased leverage during expansions increases
the financial sector’s vulnerability to small disappointments of expectations. When growth in
profits falls short of expectations in a highly leveraged economy, there can be a dramatic
transition from boom to bust as firms seek to unwind their positions, driving down asset prices
and reducing tolerance of risk. We have not attempted to model this nonlinear process.
Nevertheless, the framework described here can be used to introduce undergraduate
students to the complications that considerations of risk pose for macroeconomists and
macroeconomic policymakers, opening the door for discussion of the finer points of Minskyan
theory at an intuitive level. In doing so the framework can help students understand the important
and exciting events occurring in the U.S. economy today.

18
References
Barbera, Robert J. and Weise, Charles L. (2008), ―A Minsky/Wicksell Modified Taylor Rule,‖
paper presented at the 17th
Annual Hyman P. Minsky Conference, April 17, 2008.
Bellofiore, Riccardo and Ferri, Piero, eds. (2001), The Economic Legacy of Hyman Minsky
(Vols. 1 and 2), Edward Elgar.
DeLong, J. Bradford and Olney, Martha L. (2006), Macroeconomics, 2nd
Edition, Boston:
McGraw-Hill Irwin.
Frank, Robert H. and Bernanke, Ben S. (2004), Principles of Economics, 2nd Edition, Boston,
MA: McGraw-Hill Irwin.
Kregel, Jan (2007), ―The natural instability of financial markets,‖ Levy Economics Institute
Working Paper No. 523 (December).
Krugman, Paul (2002), ―My economic plan,‖ New York Times (October 4).
Lavoie, Marc (2008), ―Taming the New Consensus: Hysteresis and Some Other Post-Keynesian
Amendments,‖ Macroeconomic Theory and Macroeconomic Pedagogy, Palgrave Macmillan.‖
Leamer, Edward E. (2007), ―Housing is the business cycle,‖ Federal Reserve Bank of Kansas
City (October).
Minsky, Hyman P. (1975), John Maynard Keynes, New York: Columbia University Press.
Minsky, Hyman P. (1986), Stabilizing an Unstable Economy, Twentieth Century Fund Report,
New Haven and London: Yale University Press.
Romer, David (2000), ―Keynesian macroeconomics without the LM curve,‖ Journal of
Economic Perspectives 14, 2 (Spring), 149-169.
Taylor, John B. (1993), ―Discretion versus policy rules in practice,‖ Carnegie-Rochester Series
on Public Policy 39, 195-214.

19
Taylor, John B. (2003), Principles of Macroeconomics, 4th Edition, Boston, MA: Houghton-
Mifflin.
Weise, Charles L. (2007), ―A simple Wicksellian macroeconomic model,‖ The B.E. Journal of
Macroeconomics: Vol. 7: Iss. 1 (Topics), Article 11.
Whalen, Charles J. (2007), ―The U.S. credit crunch of 2007,‖ Levy Economics Institute Public
Policy Brief No. 92.
Wray, L. Randall (2007), ―Lessons from the subprime meltdown,‖ Levy Economics Institute
Working Paper No. 522 (December).
Wray, L. Randall and Tymoigne, Eric (2008), ―The Financial Theory of Investment,‖
Macroeconomic Theory and Macroeconomic Pedagogy, Palgrave Macmillan.‖

20
Appendix: derivation of the TS curve with credit risk
This appendix shows that the TS equation in the paper is consistent with a standard New
Keynesian, rational expectations macroeconomic model. Define * to be the length of a period
in months. According to the expectations theory of the term structure of interest rates modified to
incorporate a term premium , in period t an n-month risk-free bond has a yield
it = (*/n)[ft+
1*/n
1s
stt fE ]+ (A1)
Let =*/n. Then the yield becomes
it = [ft+
1/1
1s
stt fE ]+ (A2)
Let Rt = it-Ett+1 be the ex ante real rate of interest on the risk free bond. Substituting in the
equation above, we have
Rt = [(ft-Ett+1)+Et
1/1
1s
1stst )f( ]+ (A3)
The real risky long-term interest rate is
rt = Rt+t (A4)
where t = +ηt is the risk premium, which gives us
rt = [(ft-Ett+1)+Et
1/1
1s
1stst )f( ]+++ηt (A5)
Suppose the Fed follows a Taylor rule of the form
ft = (rt*+Ett+1--)+(t-*)+yt-ηt (A6)
The rest of the economy is described by conventional New Keynesian IS and AS curves and an
equation describing the evolution of the Wicksellian natural rate of interest.
yt = -(rt-rt*)+ut (A7)

21
t = Ett+1+yt+vt (A8)
rt+1* = rt*+zt (A9)
We assume ut, vt, ηt, and zt are mean zero i.i.d. shocks.
Now we compute the rational expectations equilibrium. Since the shocks are all i.i.d. and
there are no lagged endogenous variables in any of the equations, the model is actually a static
one. We guess that Ett+1 = * and then verify that this guess is correct at the end. Substituting
* for Ett+1 in the equations above gives us
yt = -(rt-rt*)+ut (A10)
t = *+yt+vt (A11)
rt = [(ft-*)+Et
1/1
1s
st *)f( ]+++ηt (A12)
ft = (rt*+*--)+(t-*)+yt-ηt (A13)
Next update all the equations one period and take time t expectations. From the AS curve we
know that Etyt+1=0, so from the Taylor rule equation we have Etft+s = rt*+*--. Substituting
this into the term structure equation gives us
rt = (ft-*)+(1-)(rt*+*--)+++ηt (A14)
and rearranging we have
rt = (ft-*++)+(1-)rt*+ηt (A15)
which is the TS curve in the text.
We can verify that in fact Ett+1=* by substituting the Taylor rule equation into the TS
curve to get
rt = rt*+(t-*)+yt-(1-)ηt (A16)
Then substituting this into the IS curve gives us

22
yt = -((t-*)+yt-(1-)ηt+ut (A17)
tttt u1
1
1
)1(*)(
1y
(A18)
Substituting this equation into the AS curve and rearranging gives us
t-* = ttt v1
1u
11
)1(
(A19)
from which it follows that Ett+1 = *.

23
Figure 1. The 1990s technology boom and bust.

24
Figure 2. The 2000s housing boom and bust.

25
Figure 3. Credit spreads (BAA corporate bond rate minus 10-year Treasury rate), 1960-
2008.
0
1
2
3
4
60 65 70 75 80 85 90 95 00 05
Shaded areas are NBER recession dates.

26
Figure 4. The Wicksellian (TS-IS-AS) model.
r
f
r*
f*
TS
r
y
IS
0
y
AS

27
Figure 5. The effect of a risk premium shock (increase in ηt).
Figure 6. The effect of a natural interest rate shock (increase in zt).
r
f
r*
f*
TS
r
y
IS
0
r**
y1 y1’ f**
r1
r
f
r*
f*
TS0
r
y
IS
0
TS1
r1
y1 f1

28
Figure 7. A Minskyan boom
Figure 8. A Minskyan bust
r
f
r*
f*
TS0
r
y
IS0
0
TS1
r1
y1 f2
IS1
f**
r2
y2
r
f
r*
f*
TS0
r
y
IS0
0
TS1
r1
y1 f**
IS1
r**
f1
29
r
f
r*
f*
TS0
r
y
IS0
0
TS1
r1
y1 f2
IS1
r**
f**

30
Figure 9. Estimated natural rate, 1997-2008.
Wicksellian natural rate: rt* = 2*10-year U.S. Treasury TIPS yield – 5-year U.S. Treasury TIPS
yield + 1.82
31
Figure 10. Risk premium, 1997-2008.
Baa corporate bond rate minus 10-year Treasury rate. Average risk premium, 1960-2008 = 1.82.

32
Figure 11. Federal funds rate and Taylor rule with and without response to risk premium
shock, 2003-2008.
Taylor rule (no response to risk premium): ftTR
= (rt*+πt,12-τ-σ)+0.5(πt,12-π*)-(ut-u*)
Taylor rule (with response to risk premium): ftTR*
= (rt*+πt,12-τ-σ)+0.5(πt,12-π*)-(ut-u*)+ηt
rt* = Wicksellian natural rate (2*10-year U.S. Treasury TIPS yield – 5-year U.S. Treasury TIPS
yield + σ)
σ = average risk premium (Baa corporate bond rate minus 10-year Treasury rate, 1960-2008) =
1.82
πt,12 = year over year core CPI inflation rate
τ = average term premium (10-year Treasury rate minus federal funds rate, 1960-2008) = 0.84
π* = target inflation rate = 2
u* = natural rate of unemployment = 5
ηt = risk premium shock (Baa corporate bond rate minus 10-year Treasury rate)-σ