Minority ethnic groups population update from the 2011 Census · Minority ethnic groups –...
43
1 Minority ethnic groups – population update from the 2011 Census Key points Overall, NI has seen an increase in both the population born outside the UK/ROI and the population of non-White ethnic background. The 2011 Census counted 80,760 individuals born outside the UK/ROI and 31,113 individuals of non-White ethnic background (4.5% and 1.72% of the total NI population, respectively). Nonetheless, a lower ME population was counted for both markers in NI than in Scotland (6.5%, 4%) and in England and Wales (12.7%, 14%). The composition of the ME community in NI still remains different to the composition of the BME communities in England and Wales and Scotland which may limit the transferability of research findings from Great Britain to NI. However, one similarity to the GB context that seems to have emerged in NI as well is the disadvantage of women of Pakistani and Bangladeshi background in relation to their economic position. Foreign-born and non-White ethnic individuals had a younger age profile, ie larger proportion aged 16-64, than the UK/ROI born and White ethnic group. Both Belfast and Southern HSCT area had the largest proportion of foreign born individuals (6.1% each), with clusters being the Dungannon, Craigavon, Belfast, Newry and Mourne, and Ballymena LGDs. Belfast HSCT area was also the most ethnically diverse (3.44%) location. Higher proportions of foreign born and ethnic minority people were qualified to degree level than their UK/ROI born and White counterparts, the exceptions being individuals from the Accession countries, the Bangladeshi and Black Other group (reporting a higher rate of other qualifications). Overall, economic activity and employment were higher among the foreign-born and non-White ethnic groups. However, unemployment disproportionately affected ethnic minority women and men in the Black ethnic group. Looking after the home/family was the more commonly identified status among women of non-White ethnic background. Pakistani and Bangladeshi women seemed to be particularly disadvantaged.
Transcript of Minority ethnic groups population update from the 2011 Census · Minority ethnic groups –...
1
Minority ethnic groups – population
update from the 2011 Census
Key points
Overall, NI has seen an increase in both the population born outside the UK/ROI and the
population of non-White ethnic background. The 2011 Census counted 80,760
individuals born outside the UK/ROI and 31,113 individuals of non-White ethnic
background (4.5% and 1.72% of the total NI population, respectively). Nonetheless, a
lower ME population was counted for both markers in NI than in Scotland (6.5%, 4%)
and in England and Wales (12.7%, 14%).
The composition of the ME community in NI still remains different to the composition of
the BME communities in England and Wales and Scotland which may limit the
transferability of research findings from Great Britain to NI. However, one similarity to the
GB context that seems to have emerged in NI as well is the disadvantage of women of
Pakistani and Bangladeshi background in relation to their economic position.
Foreign-born and non-White ethnic individuals had a younger age profile, ie larger
proportion aged 16-64, than the UK/ROI born and White ethnic group.
Both Belfast and Southern HSCT area had the largest proportion of foreign born
individuals (6.1% each), with clusters being the Dungannon, Craigavon, Belfast, Newry
and Mourne, and Ballymena LGDs. Belfast HSCT area was also the most ethnically
diverse (3.44%) location.
Higher proportions of foreign born and ethnic minority people were qualified to degree
level than their UK/ROI born and White counterparts, the exceptions being individuals
from the Accession countries, the Bangladeshi and Black Other group (reporting a higher
rate of other qualifications).
Overall, economic activity and employment were higher among the foreign-born and
non-White ethnic groups. However, unemployment disproportionately affected ethnic
minority women and men in the Black ethnic group. Looking after the home/family was
the more commonly identified status among women of non-White ethnic background.
Pakistani and Bangladeshi women seemed to be particularly disadvantaged.

2
In terms of occupation, those born in Other non-EU countries and those of Asian
background were over-represented among the professional occupations, those born in
the EU Accession countries and from the Black Other ethnic group were over-
represented among process, plant and machine operatives and elementary occupations.
Among all usual residents aged 3 and over, 50,376 individuals did not have English as a
main language (excluding Irish speakers). Of these, over 14,000 people reported poor
English proficiency (cannot speak it well or at all; 28.5%); this was particularly common
among those who had Chinese, an Eastern European language or Portuguese as their
main language. Not having English as a main language and lower English proficiency
were disadvantageous for women in relation to economic activity, employment and
unemployment.
Both foreign-born and non-White ethnic people reported having higher rates of very
good/good health and lower rates of long-term health problems/disability that limit day-to-
day activities than the UK/ROI born and White population.

3
Glossary
EU countries before 2004 accession:
Austria, Belgium, Denmark, Finland, France, Germany, Greece, Ireland, Italy, Luxembourg, Netherlands, Portugal, Spain, Sweden and United Kingdom These are also referred to as old EU member states/countries.
EU Accession countries 2004 onwards:
Several European countries joined the EU in 2004 – this includes the A8 countries (countries with low per capita income) and Malta and Republic of Cyprus (countries with a per capita income closer to the EU average). In 2008, Bulgaria and Romania also joined the EU (referred to as A2 countries).
A8 countries: Poland, Lithuania, Slovakia, Latvia, Czech, Estonia, Hungary, Slovenia
A2 countries: Bulgaria, Romania All together are referred to as EU Accession countries.
Ethnic group Definition of groups for NI Census can be found here: http://www.ons.gov.uk/ons/guide-method/measuring-equality/equality/ethnic-nat-identity-religion/ethnic-group/index.html#1
Ethnic group – Mixed White and Black Caribbean White and Black African White and Asian Any other Mixed / Multiple ethnic background, please describe
Ethnic group – Other Arab Any other ethnic group, please describe
HSCT Health and Social Care Trust
LGD Local Government District
Access to the 2011 Census information
The main source of data in this HIB is the 2011 Census and detailed information can be
found at the NISRA website http://www.ninis2.nisra.gov.uk/public/Theme.aspx (searches can
be restricted to Ethnicity, identity, religion and language in ‘Subset’).
A specific summary report Detailed characteristics for Northern Ireland on ethnicity, country
of birth and language (NISRA, 2013a) can also be accessed on the website:
http://www.nisra.gov.uk/Census/2011_results_detailed_characteristics.html

4
Content
Page
Introduction 6
Overall figures for NI and comparison to the 2001 Census 7
Comparing NI to Great Britain 9
ME/migrant population by HSCT area 11
Age structure of the ME community 15
Highest level of qualification achieved 17
Economic activity 18
Occupation 21
Main language and English proficiency 23
Perceived health 27
Long-term health problems/disability 30
References 33
Appendix 1 34
Appendix 2 43
Figures and maps Page
Figure 1. Components of population change in NI: 1981/82 – 2011/12 6
Figure 2: Proportion of country of birth by continent for foreign-born individuals 8
Figure 3. Country of birth and age group: percentages (%) 16
Figure 4. Ethnic group and age group: percentages (%) 16
Figure 5. Proportion of highest qualification achieved by country of birth (%) 17
Figure 6. Proportion of highest qualification achieved by broad ethnic group (%) 18
Figure 7. Occupation by broad ethnic group 23
Figure 8. English proficiency among those whose main language is not English
(aged 3+) by HSCT
24
Figure 9. Economic activity and English proficiency: overall and by gender (%) 26
Figure 10. Rates of employment and unemployment and English language
proficiency (%)
27
Figure 11. Very good or good health among working age adults (16-64 years) 30
Map 1. Migration from EU Accession countries: proportion settled by ward in NI 14
5
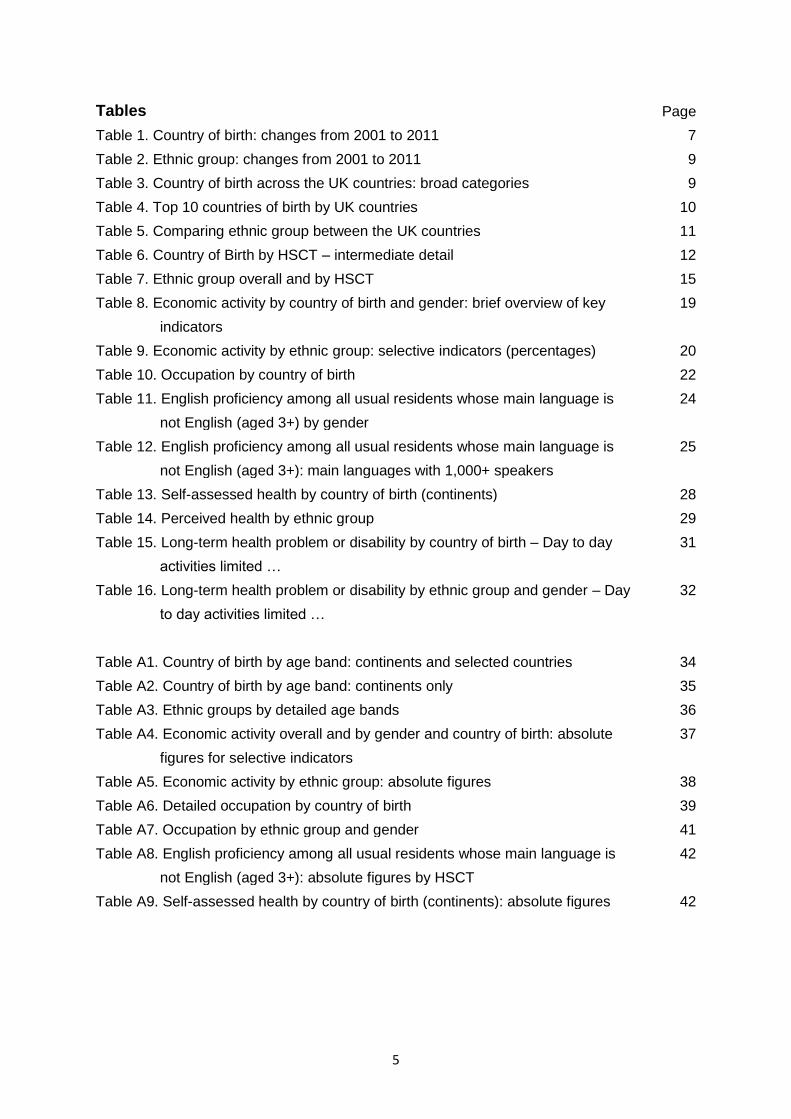
Tables Page
Table 1. Country of birth: changes from 2001 to 2011 7
Table 2. Ethnic group: changes from 2001 to 2011 9
Table 3. Country of birth across the UK countries: broad categories 9
Table 4. Top 10 countries of birth by UK countries 10
Table 5. Comparing ethnic group between the UK countries 11
Table 6. Country of Birth by HSCT – intermediate detail 12
Table 7. Ethnic group overall and by HSCT 15
Table 8. Economic activity by country of birth and gender: brief overview of key
indicators
19
Table 9. Economic activity by ethnic group: selective indicators (percentages) 20
Table 10. Occupation by country of birth 22
Table 11. English proficiency among all usual residents whose main language is
not English (aged 3+) by gender
24
Table 12. English proficiency among all usual residents whose main language is
not English (aged 3+): main languages with 1,000+ speakers
25
Table 13. Self-assessed health by country of birth (continents) 28
Table 14. Perceived health by ethnic group 29
Table 15. Long-term health problem or disability by country of birth – Day to day
activities limited …
31
Table 16. Long-term health problem or disability by ethnic group and gender – Day
to day activities limited …
32
Table A1. Country of birth by age band: continents and selected countries 34
Table A2. Country of birth by age band: continents only 35
Table A3. Ethnic groups by detailed age bands 36
Table A4. Economic activity overall and by gender and country of birth: absolute
figures for selective indicators
37
Table A5. Economic activity by ethnic group: absolute figures 38
Table A6. Detailed occupation by country of birth 39
Table A7. Occupation by ethnic group and gender 41
Table A8. English proficiency among all usual residents whose main language is
not English (aged 3+): absolute figures by HSCT
42
Table A9. Self-assessed health by country of birth (continents): absolute figures 42
6
Introduction
The Public Health Agency (PHA) has a major role to play in reducing health and social
wellbeing inequalities in Northern Ireland (NI) and minority ethnic (ME)/migrant communities
have been identified as one of the more vulnerable groups in society. Any approach to
protect and improve the health and social wellbeing of minority ethnic communities across
Northern Ireland must be informed by a rounded understanding of the composition of these
communities.
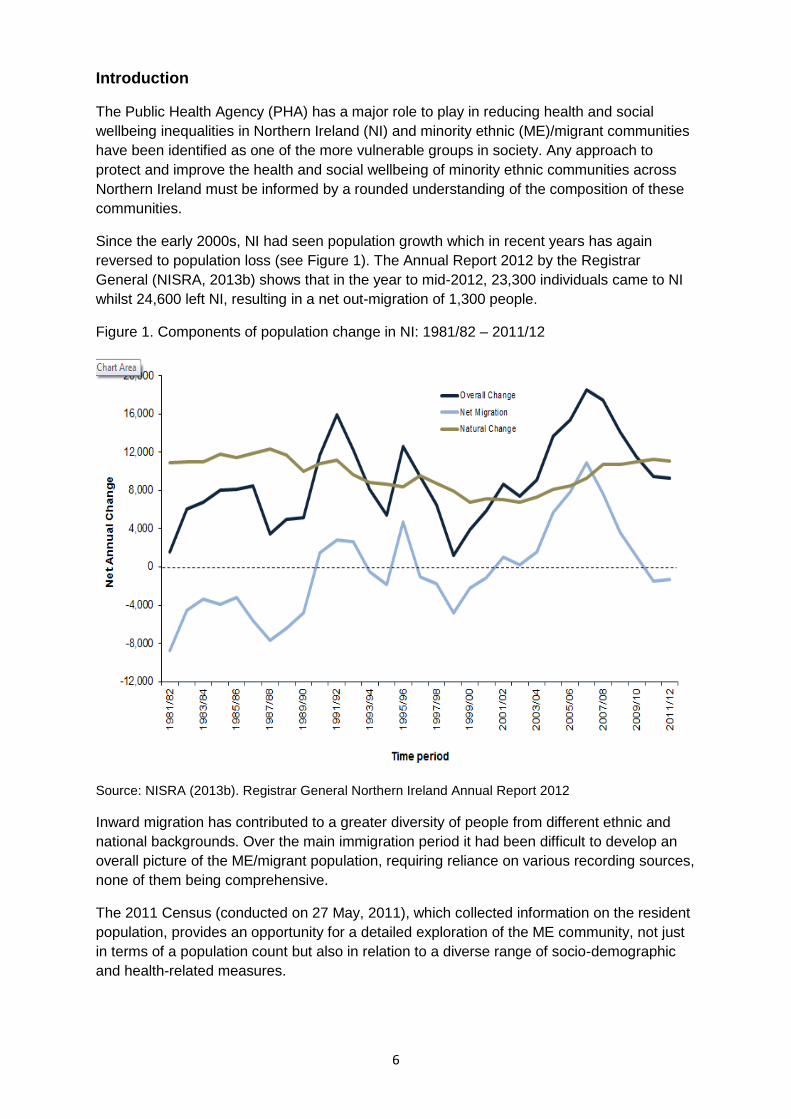
Since the early 2000s, NI had seen population growth which in recent years has again
reversed to population loss (see Figure 1). The Annual Report 2012 by the Registrar
General (NISRA, 2013b) shows that in the year to mid-2012, 23,300 individuals came to NI
whilst 24,600 left NI, resulting in a net out-migration of 1,300 people.
Figure 1. Components of population change in NI: 1981/82 – 2011/12
Source: NISRA (2013b). Registrar General Northern Ireland Annual Report 2012
Inward migration has contributed to a greater diversity of people from different ethnic and
national backgrounds. Over the main immigration period it had been difficult to develop an
overall picture of the ME/migrant population, requiring reliance on various recording sources,
none of them being comprehensive.
The 2011 Census (conducted on 27 May, 2011), which collected information on the resident
population, provides an opportunity for a detailed exploration of the ME community, not just
in terms of a population count but also in relation to a diverse range of socio-demographic
and health-related measures.

7
In NI, the ethnic group measure primarily focuses on non-White people of Asian, Black,
Mixed or Other origin, with the exception of Irish Travellers as an indigenous White minority
ethnic group.1 However, the broad White category does not differentiate sufficiently between
the various White migrant groups that arrived in NI, particularly since 2004. Therefore,
country of birth was also requested from residents completing the 2011 Census. This is
particularly useful for first-generation migrants. Other measures to explore the multi-cultural
composition of a population include first/main language, religion and national
identity/passport held. Overall, the variety of indicators shows the complexity of the
ethnic/migrant dimension.
This briefing focuses on the published information on ME/migrant communities using
the country of birth, ethnic group, and, to a lesser degree, main language measures of
the 2011 Census that are available on the NISRA website
http://www.nisra.gov.uk/Census/2011_results_detailed_characteristics.html.
Further detailed information such as breakdowns by smaller areas as well as by age groups
and other characteristics can be accessed via this link. Due to the wealth of data available,
only a summary of statistics is provided. Some variation in figures is possible as not all
individuals completed all Census questions.
Please note that no statistics on Irish Travellers are reported here as a separate Briefing had
been published and the population numbers in the Census appear to underestimate the true
population size when compared to the findings from the All Ireland Traveller Health Study.
Overall figures for NI and comparison to the 2001 Census
The 2011 Census counted an overall population of 1,810,863 people (887,323 males,
923,540 females) in NI; of these 80,760 (40,567 males, 40,193 females) were born outside
the UK, ROI, Channel Islands and Isle of Man (referred to as born outside the UK/ROI or
foreign-born hereafter). Those born outside the UK/ROI represent 4.5% of the overall
population (4.6% of all males, 4.4% of all females). This reflects an increase in those born
outside the UK/ROI compared to the 2001 Census when 30,559 were recorded as foreign-
born, which represented 1.8% of the total population.
Table 1. Country of birth: changes from 2001 to 2011
Census year
NI total
Other EU countries Elsewhere
N % N %
2001 1,685,267 10,355 0.6 20,204 1.2
2011 1,810,863 45,290 2.5 35,331 2.0 Source: NISRA; 2001 Census figures
http://www.nisra.gov.uk/Census/2001%20Census%20Results/Key%20Statistics/KeyStatisticstoOutput
AreaLevel.html
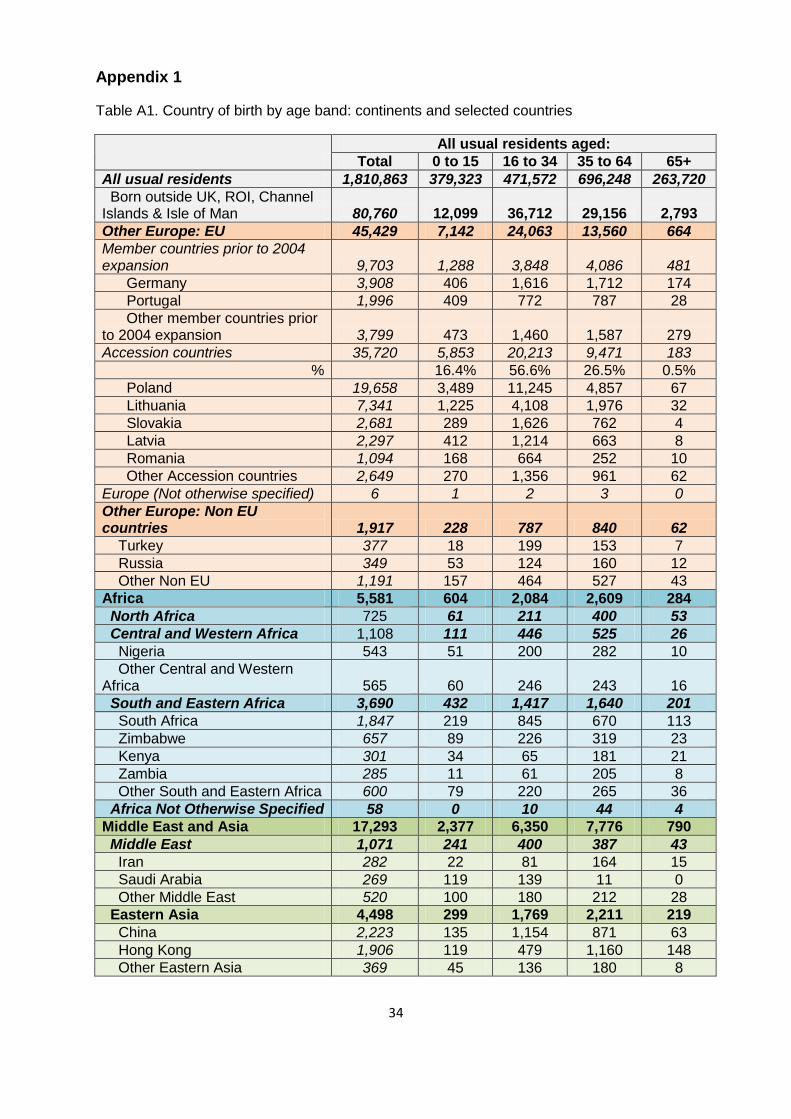
Over half (45,429; 56.3%) of the foreign-born individuals in 2011 were born in an EU
member state; this group had the largest increase which was more than four-fold since 2001
(see Table 1). The foreign-born population originating from all non-EU countries had nearly
doubled since the 2001 Census, rising from 20,204 people to 35,331. The largest group
1 http://www.ons.gov.uk/ons/guide-method/measuring-equality/equality/ethnic-nat-identity-
religion/ethnic-group/index.html#1

8
were 17,293 individuals born in the Middle East and Asia, followed by 6,999 from North
America and Caribbean, 5,581 from Africa, 2,468 from Antarctica and Oceania, 1,917 from
non-EU European countries, and fewer from South America (875) and Central America (194;
for a very detailed break-down, highlighting selected countries, please see Table 6 further
below). Figure 2 shows the distribution of country of birth by continents for all foreign-born
individuals.
Figure 2: Proportion of country of birth by continent for foreign-born individuals
The 2011 Census also identified 31,113 individuals of non-White ethnic background,
representing 1.72% of the population in NI. This was more than double the non-White ethnic
population that was reported in the 2001 Census: 14,279 individuals representing 0.85% of
the population. Within the non-White ethnic groups, people from Chinese (6,303), Indian
(6,198), and mixed background (6,014) formed the largest groups in 2011. This pattern is
similar to 2001, though figures were lower then.
Among the broad ethnic categories, the strongest increase was seen within the Black ethnic
group, a three-fold increase since 2001. Using the more detailed ethnic groups, the by far
largest increase was seen among Other Asians (almost 26-fold, primarily driven by those
born in the Philippines see Table 6), followed by Black African and Indian individuals.

9
Table 2. Ethnic group: changes from 2001 to 2011
Ethnic group
2001 Census
2011 Census
Increase from 2001 to 2011 (fold)
All usual residents 1,685,267 1,810,863 White Total 1,670,988 1,779,750 Asian Total 6,824 19,130 2.8
Chinese 4,145 6,303 1.5
Indian 1,567 6,198 4.0
Pakistani 666 1,091 1.6
Bangladeshi 252 540 2.1
Other Asian 194 4,998 25.8
Black Total 1,136 3,616 3.2
Caribbean 255 372 1.5
African 494 2,345 4.7
Other 387 899 2.3
Mixed
3,319 6,014 1.8
Other
1,290 2,353 1.8
Total non-white 14,279 31,113 2.2
Total % non-white 0.85 1.72 Source: NISRA; 2001 Census figures
http://www.nisra.gov.uk/Census/2001%20Census%20Results/Key%20Statistics/KeyStatisticstoOutput
AreaLevel.html
Comparing NI to Great Britain
The 2011 Census also permits a comparison of the BME/migrant population across the UK
(Table 3). Despite the recent increases in the migrant community in NI, it still has the lowest
non-UK/ROI born population: 4.5% versus 12.7% in England and Wales and 6.5% in
Scotland. However, when focusing on those born in ROI, unsurprisingly, NI has the higher
proportion.
Table 3. Country of birth across the UK countries: broad categories
NI England & Wales Scotland
Total 1,810,863 56,075,912 5,295,000
Born in N % N % N %
UK 1,692,270 93.5 48,570,902 86.6 4,900,000 93.0
ROI 37,833 2.1 407,357 0.7 23,000 0.5
Non-UK/ROI 80,760 4.5 7,097,653 12.7 346,000 6.5 Sources: ONS (2013), National Records of Scotland (2013)
There were differences between the UK regions regarding the top ten countries of birth, with
the pattern in NI being quite different from Great Britain (GB, Table 4). NI showed more
Eastern European countries and less so the familiar pattern of Asian or even African
countries as known from the GB context. Those born in the Top 10 countries of birth make
up nearly two-thirds (65%) of all non-UK/ROI born individuals in NI but only 44% in England
in Wales and 54% in Scotland, suggesting greater diversity among foreign-born individuals
in GB, particularly in England.
10
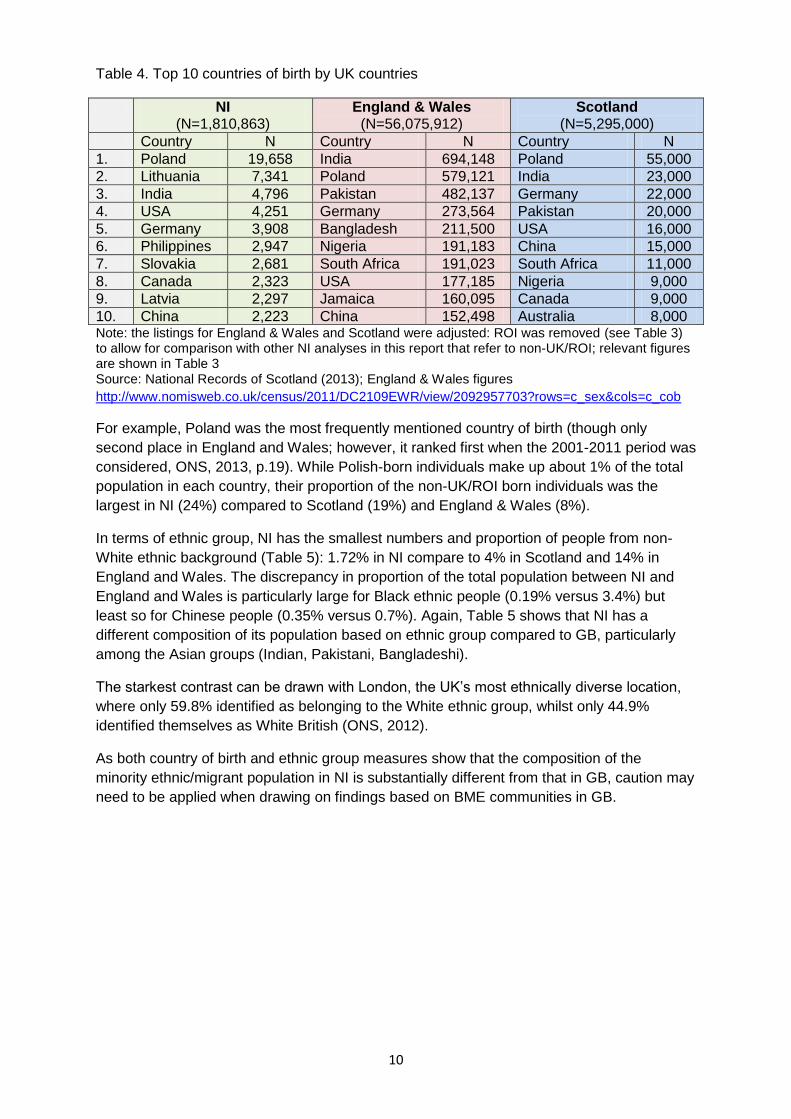
Table 4. Top 10 countries of birth by UK countries
NI (N=1,810,863)
England & Wales (N=56,075,912)
Scotland (N=5,295,000)
Country N Country N Country N
1. Poland 19,658 India 694,148 Poland 55,000
2. Lithuania 7,341 Poland 579,121 India 23,000
3. India 4,796 Pakistan 482,137 Germany 22,000
4. USA 4,251 Germany 273,564 Pakistan 20,000
5. Germany 3,908 Bangladesh 211,500 USA 16,000
6. Philippines 2,947 Nigeria 191,183 China 15,000
7. Slovakia 2,681 South Africa 191,023 South Africa 11,000
8. Canada 2,323 USA 177,185 Nigeria 9,000
9. Latvia 2,297 Jamaica 160,095 Canada 9,000
10. China 2,223 China 152,498 Australia 8,000 Note: the listings for England & Wales and Scotland were adjusted: ROI was removed (see Table 3) to allow for comparison with other NI analyses in this report that refer to non-UK/ROI; relevant figures are shown in Table 3 Source: National Records of Scotland (2013); England & Wales figures
http://www.nomisweb.co.uk/census/2011/DC2109EWR/view/2092957703?rows=c_sex&cols=c_cob
For example, Poland was the most frequently mentioned country of birth (though only
second place in England and Wales; however, it ranked first when the 2001-2011 period was
considered, ONS, 2013, p.19). While Polish-born individuals make up about 1% of the total
population in each country, their proportion of the non-UK/ROI born individuals was the
largest in NI (24%) compared to Scotland (19%) and England & Wales (8%).
In terms of ethnic group, NI has the smallest numbers and proportion of people from non-
White ethnic background (Table 5): 1.72% in NI compare to 4% in Scotland and 14% in
England and Wales. The discrepancy in proportion of the total population between NI and
England and Wales is particularly large for Black ethnic people (0.19% versus 3.4%) but
least so for Chinese people (0.35% versus 0.7%). Again, Table 5 shows that NI has a
different composition of its population based on ethnic group compared to GB, particularly
among the Asian groups (Indian, Pakistani, Bangladeshi).
The starkest contrast can be drawn with London, the UK’s most ethnically diverse location,
where only 59.8% identified as belonging to the White ethnic group, whilst only 44.9%
identified themselves as White British (ONS, 2012).
As both country of birth and ethnic group measures show that the composition of the
minority ethnic/migrant population in NI is substantially different from that in GB, caution may
need to be applied when drawing on findings based on BME communities in GB.

11
Table 5. Comparing ethnic group between the UK countries
Population figures Percentage of total population
NI
England & Wales Scotland % NI % E&W
% Scotland
All 1,810,863 56,075,912 5,295,000 White total 1,779,750 48,209,395 5,084,000 98.28 86.0 96.0
Asian total 19,130 4,213,531 141,000 1.06 7.5 2.7
Chinese 6,303 393,141 34,000 0.35 0.7 0.6
Indian 6,198 1,412,958 33,000 0.34 2.5 0.6
Pakistani 1,091 1,124,511 49,000 0.06 2.0 0.9
Bangladeshi 540 447,201 4,000 0.03 0.8 0.1
Other 4,998 835,720 21,000 0.28 1.5 0.4
Black total 3,616 1,864,890 36,000 0.19 3.4 0.7
African 2,345 989,628 30,000 0.02 1.8 0.6
Caribbean 372 594,825 3,000 0.13 1.1 <0.1
Other 899 280,437 3,000 0.04 0.5 <0.1
Mixed/multiple ethnic 6,014 1,224,400 20,000 0.33 2.2 0.4
Other 2,353 563,696 14,000 0.13 1.0 0.3
Arab
230,600 9,000
0.4 0.2
Other
333,096 5,000
0.6 0.1
All non-White 31,113 7,866,517 211,000 1.72% 14.0% 4.0% Source: England & Wales figures http://www.nomisweb.co.uk/census/2011/LC2101EW/view/2092957703?rows=c_ethpuk11&cols=c_sex ; percentage ONS (2012) Scotland figures and percentage: National Records of Scotland (2013, p.12)
ME/migrant population by HSCT area
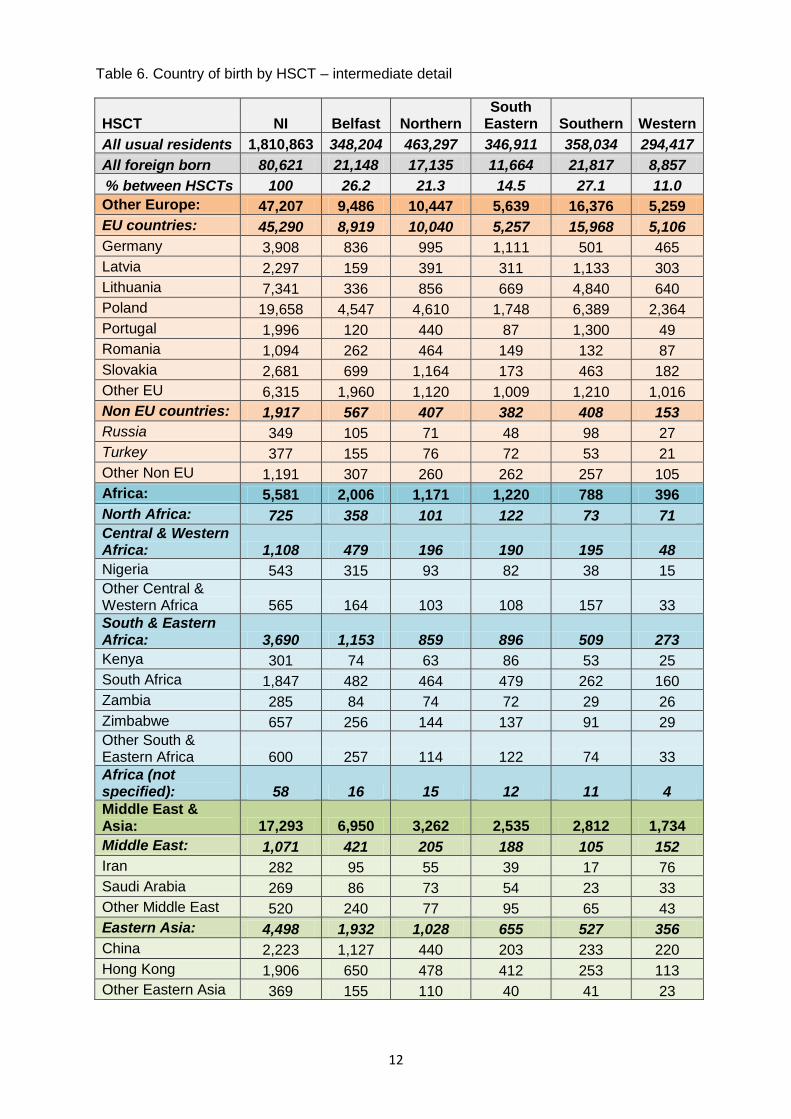
There was also variation in which HSCT area specific foreign-born individuals settled (see
Table 6). Overall, the highest proportion of those born outside UK/ROI settled in the
Southern HSCT area (27.1%), followed by Belfast (26.2%), the Northern (21.3%), the South
Eastern (14.5%) and Western (11.0%) HSCT areas. However, BHSCT and SHSCT have the
highest proportion of foreign born individuals out of their respective populations (6.1% each),
higher than the NI average of 4.5% (NHSCT 3.7%, SEHSCT 3.4%, WHSCT 3.0%). Table 6
provides more country-specific detail.
The high proportion of foreign-born individuals in the Southern HSC Trust area was driven
by migrants from EU countries, particularly from A8 countries (one-third of Polish, two-thirds
of Lithuanian, and half of the Latvian populations in NI, see Map 1), and from Portugal (two-
thirds of all Portuguese in NI).
Those born in the Middle-East and Asia (40%), Africa (36%) and non-EU Europe (29%) were
primarily living in Belfast, while those from South America lived in Belfast (29%) and the
Southern HSCT area (29%). Migrants from Antarctica & Oceania settled mainly in the
Belfast, Northern and South Eastern HSCT area (a quarter each).
Overall, Belfast had the most diverse foreign-born population and the largest share of most
continents, except for EU-born individuals (20%), while the Western Trust area had the
lowest share of migrants from most continents, except for those from Central America (18%),
with the lowest being migrants from Africa and South America (7%).
12
Table 6. Country of birth by HSCT – intermediate detail
HSCT NI Belfast Northern South
Eastern Southern Western
All usual residents 1,810,863 348,204 463,297 346,911 358,034 294,417
All foreign born 80,621 21,148 17,135 11,664 21,817 8,857
% between HSCTs 100 26.2 21.3 14.5 27.1 11.0
Other Europe: 47,207 9,486 10,447 5,639 16,376 5,259
EU countries: 45,290 8,919 10,040 5,257 15,968 5,106
Germany 3,908 836 995 1,111 501 465
Latvia 2,297 159 391 311 1,133 303
Lithuania 7,341 336 856 669 4,840 640
Poland 19,658 4,547 4,610 1,748 6,389 2,364
Portugal 1,996 120 440 87 1,300 49
Romania 1,094 262 464 149 132 87
Slovakia 2,681 699 1,164 173 463 182
Other EU 6,315 1,960 1,120 1,009 1,210 1,016
Non EU countries: 1,917 567 407 382 408 153
Russia 349 105 71 48 98 27
Turkey 377 155 76 72 53 21
Other Non EU 1,191 307 260 262 257 105
Africa: 5,581 2,006 1,171 1,220 788 396
North Africa: 725 358 101 122 73 71
Central & Western Africa: 1,108 479 196 190 195 48
Nigeria 543 315 93 82 38 15
Other Central & Western Africa 565 164 103 108 157 33
South & Eastern Africa: 3,690 1,153 859 896 509 273
Kenya 301 74 63 86 53 25
South Africa 1,847 482 464 479 262 160
Zambia 285 84 74 72 29 26
Zimbabwe 657 256 144 137 91 29
Other South & Eastern Africa 600 257 114 122 74 33
Africa (not specified): 58 16 15 12 11 4
Middle East & Asia: 17,293 6,950 3,262 2,535 2,812 1,734
Middle East: 1,071 421 205 188 105 152
Iran 282 95 55 39 17 76
Saudi Arabia 269 86 73 54 23 33
Other Middle East 520 240 77 95 65 43
Eastern Asia: 4,498 1,932 1,028 655 527 356
China 2,223 1,127 440 203 233 220
Hong Kong 1,906 650 478 412 253 113
Other Eastern Asia 369 155 110 40 41 23

13
HSCT NI Belfast Northern South
Eastern Southern Western
Southern Asia: 6,042 2,454 1,252 946 666 724
Bangladesh 360 165 26 125 30 14
India 4,796 2,013 980 702 479 622
Pakistan 620 192 163 80 120 65
Other Southern Asia 266 84 83 39 37 23
South East Asia: 5,625 2,129 769 734 1,496 497
Philippines 2,947 1,427 408 424 386 302
East Timor 894 1 28 0 848 17
Malaysia 705 392 120 91 57 45
Thailand 469 133 101 89 78 68
Singapore 274 67 67 81 28 31
Other South East Asia 336 109 45 49 99 34
Central Asia: 57 14 8 12 18 5
North America & Caribbean: 6,999 1,779 1,422 1,452 1,203 1,143
Canada 2,323 632 561 599 340 191
United States of America 4,251 1,016 770 743 811 911
Caribbean 314 88 79 90 30 27
Other N America & Caribbean 111 43 12 20 22 14
Central America: Total 194 50 38 43 28 35
South America: Total 875 250 158 154 252 61
Antarctica & Oceania: 2,468 627 634 621 358 228
Australia 1,750 465 461 377 276 171
New Zealand 584 149 158 143 79 55
Other Antarctica & Oceania 134 13 15 101 3 2
Other 4 0 3 0 0 1 Note: This table excludes UK, ROI, other Ireland and Channel Islands as country of birth.
Migrants from specific countries of birth seemed to cluster in a few Local Government
Districts (LGDs):
Poland: Belfast (4,124), Craigavon (2,140), Newry & Mourne (1,902), Dungannon
(1,396), Ballymena (1,094)
Lithuania: Dungannon (1,923), Craigavon (1,094)
India: Belfast (1,786)
Philippines: Belfast (1,129)
China: Belfast (1,029)
Portugal: Craigavon (719), Dungannon (488)
East Timor: Dungannon (699).

14
Based on the 2011 Census, Map 1 provides an even more detailed picture of the settlement
(by wards) of migrants born in the EU Accession countries 2004 onwards. This suggests that
migrants from EU Accession countries primarily settled in rural areas, particularly in the
Southern HSCT area, refining the information provided in Table 6. As rural areas have
smaller populations, the settlement of migrants from EU Accession countries
disproportionately affected population composition in these areas. For example, England
and Wales also reported a widely dispersed Polish population with some concentration in
agricultural areas (ONS, 2013). In addition, some wards within Belfast also show a higher
proportion of this migrant group. Detailed figures per ward area can be accessed via the
interactive maps provided on NINIS:
http://www.ninis2.nisra.gov.uk/InteractiveMaps/Census%202011/Country%20of%20Birth%2
0KS204NI/atlas.html
Map 1. Migration from EU Accession countries: proportion settled by ward in NI
Source: 2011 Census, NISRA interactive maps
http://www.ninis2.nisra.gov.uk/InteractiveMaps/Census%202011/Country%20of%20Birth%20KS204N
I/atlas.html
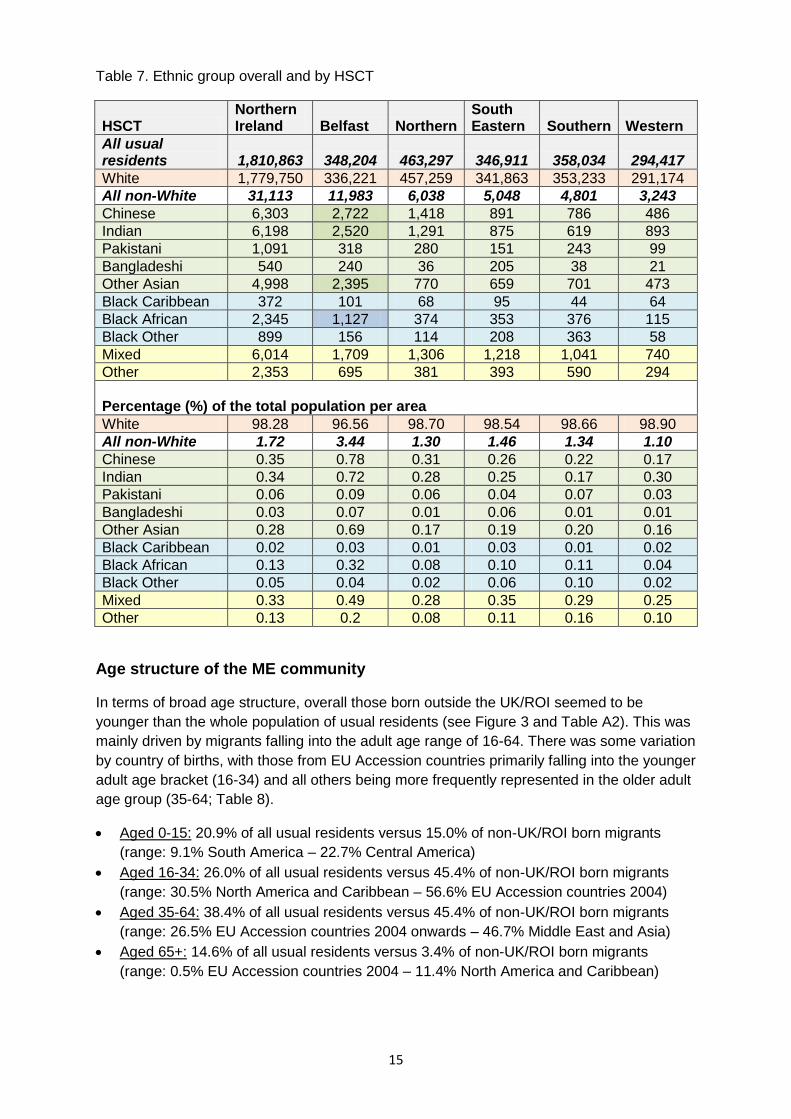
Table 7 presents the population data for ethnic group by HSCT. Belfast HSCT area had the
largest proportion of non-White ethnic groups with 11,983 individuals, representing 3.44% of
its total population, which reflects two to three times the non-White ethnic population
compared to the other Trust areas. Belfast HSCT also had higher numbers across almost all
ethnic groups, particularly Chinese, Indian, Other Asian, and Black African, except for Black
Other who were more likely to live in Southern HSCT and South Eastern HSCT.
In contrast, the Western HSCT area had the lowest number and proportion of non-White
ethnic groups overall (3,243 and 1.10%, respectively) and lowest numbers and proportions
across most ethnic groups except for Indian, Black Caribbean and Other.
15
Table 7. Ethnic group overall and by HSCT
HSCT Northern Ireland Belfast Northern
South Eastern Southern Western
All usual residents 1,810,863 348,204 463,297 346,911 358,034 294,417
White 1,779,750 336,221 457,259 341,863 353,233 291,174
All non-White 31,113 11,983 6,038 5,048 4,801 3,243
Chinese 6,303 2,722 1,418 891 786 486
Indian 6,198 2,520 1,291 875 619 893
Pakistani 1,091 318 280 151 243 99
Bangladeshi 540 240 36 205 38 21
Other Asian 4,998 2,395 770 659 701 473
Black Caribbean 372 101 68 95 44 64
Black African 2,345 1,127 374 353 376 115
Black Other 899 156 114 208 363 58
Mixed 6,014 1,709 1,306 1,218 1,041 740
Other 2,353 695 381 393 590 294
Percentage (%) of the total population per area
White 98.28 96.56 98.70 98.54 98.66 98.90
All non-White 1.72 3.44 1.30 1.46 1.34 1.10
Chinese 0.35 0.78 0.31 0.26 0.22 0.17
Indian 0.34 0.72 0.28 0.25 0.17 0.30
Pakistani 0.06 0.09 0.06 0.04 0.07 0.03
Bangladeshi 0.03 0.07 0.01 0.06 0.01 0.01
Other Asian 0.28 0.69 0.17 0.19 0.20 0.16
Black Caribbean 0.02 0.03 0.01 0.03 0.01 0.02
Black African 0.13 0.32 0.08 0.10 0.11 0.04
Black Other 0.05 0.04 0.02 0.06 0.10 0.02
Mixed 0.33 0.49 0.28 0.35 0.29 0.25
Other 0.13 0.2 0.08 0.11 0.16 0.10
Age structure of the ME community
In terms of broad age structure, overall those born outside the UK/ROI seemed to be
younger than the whole population of usual residents (see Figure 3 and Table A2). This was
mainly driven by migrants falling into the adult age range of 16-64. There was some variation
by country of births, with those from EU Accession countries primarily falling into the younger
adult age bracket (16-34) and all others being more frequently represented in the older adult
age group (35-64; Table 8).
Aged 0-15: 20.9% of all usual residents versus 15.0% of non-UK/ROI born migrants
(range: 9.1% South America – 22.7% Central America)
Aged 16-34: 26.0% of all usual residents versus 45.4% of non-UK/ROI born migrants
(range: 30.5% North America and Caribbean – 56.6% EU Accession countries 2004)
Aged 35-64: 38.4% of all usual residents versus 45.4% of non-UK/ROI born migrants
(range: 26.5% EU Accession countries 2004 onwards – 46.7% Middle East and Asia)
Aged 65+: 14.6% of all usual residents versus 3.4% of non-UK/ROI born migrants
(range: 0.5% EU Accession countries 2004 – 11.4% North America and Caribbean)

16
Figure 3. Country of birth and age group: percentages (%)
Similarly, Figure 4 (Table A3) shows that non-White ethnic minorities have a younger age
profile than the total White population.
Figure 4. Ethnic group and age group: percentages (%)
Aged 0-15: About 1 in 5 White (21%) people fell into this age band, with the similar
proportions among Other ethnic (21%) and Chinese (19%) people. However, this age
band was lowest among Black Caribbean individuals (9%) and more prevalent in the
other ethnic groups, ranging from 1 in 4 among Black Africans to over half of the Mixed
group. Exploring the more detailed age breakdown (Table A3) shows that there were
particularly high numbers among 0-4 year olds of Indian (almost half of all Asians aged
0-4) and of Mixed ethnic ( a quarter of the group) background.
Aged 16-34: Just over one quarter of White people were of young adult age, while a
higher proportion of people from Asian, African and Other ethnic background fell into it.

17
Aged 35-64: About 2 in 5 White people were in the older adult age range which is
roughly similar among Asian, African and Other ethnic groups. More people of Black
Caribbean (50%) and Other Asian (43%) background but fewer of mixed ethnic
background (17%) fell into this age band.
Aged 65+: While in the White population 15% were aged 65 and older, only 3% of
Asians, 1% of Africans, 1% of Mixed ethnic persons, and 5% of the Other ethnic group
fell into this age band.
Highest level of qualification achieved
Those 16 and over were asked to report on the highest level of qualification achieved (Figure
5; please see Appendix 2 for definition of qualification levels). Those born in the UK/ROI had
the highest proportion of no qualifications (30%) and the lowest proportion of Level 4 or
higher qualifications (23%)2, the latter being broadly equivalent to degree level or higher
qualifications. In contrast, two in five people born outside the EU countries (ie in Other
countries) and almost one third of those born in the old EU member states had a Level 4 or
higher qualification. A large proportion (41%) among those from the EU Accession countries
reported to have other qualifications (eg possibly due to not being able to identify the
equivalent qualification in the UK system); 18% identified to be qualified at degree level or
higher.
Figure 5. Proportion of highest qualification achieved by country of birth (%)
Note: Definition of qualification levels provided in Appendix 2
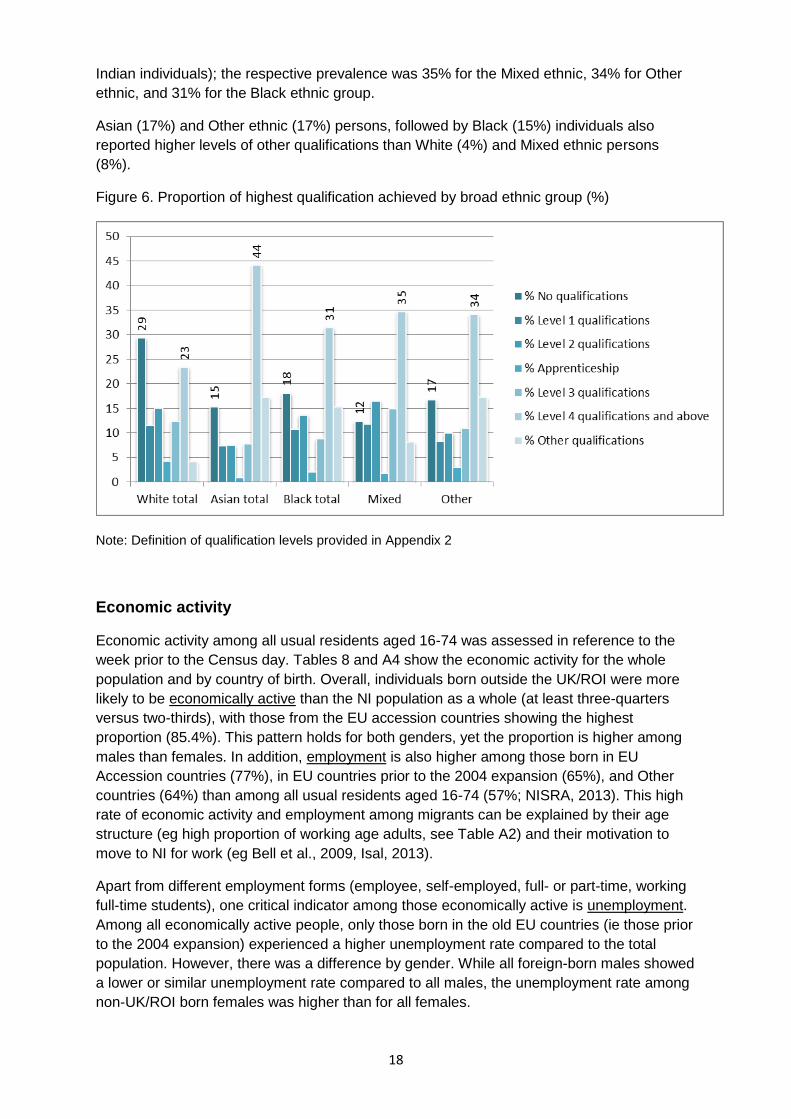
A similar picture emerged also for ethnic group (Figure 6). The White ethnic group showed
the highest level of no qualifications (29%) and the lowest proportion of Level 4 or higher
qualifications (23%). Individuals born in Asia had the highest proportion of degree level
qualifications or higher (44%, varying between 19% among Bangladeshi and 62% among
2 In fact, this high level of no qualifications was more common among the NI born (30%) and ROI-born (31%)
individuals than among the GB born individuals (eg England born 20%). Both GB born (eg England: 29%) and ROI born (32%) individuals had higher proportion of Level 4+ qualifications than NI born people (23%; NISRA, 2013).
18
Indian individuals); the respective prevalence was 35% for the Mixed ethnic, 34% for Other
ethnic, and 31% for the Black ethnic group.
Asian (17%) and Other ethnic (17%) persons, followed by Black (15%) individuals also
reported higher levels of other qualifications than White (4%) and Mixed ethnic persons
(8%).
Figure 6. Proportion of highest qualification achieved by broad ethnic group (%)
Note: Definition of qualification levels provided in Appendix 2
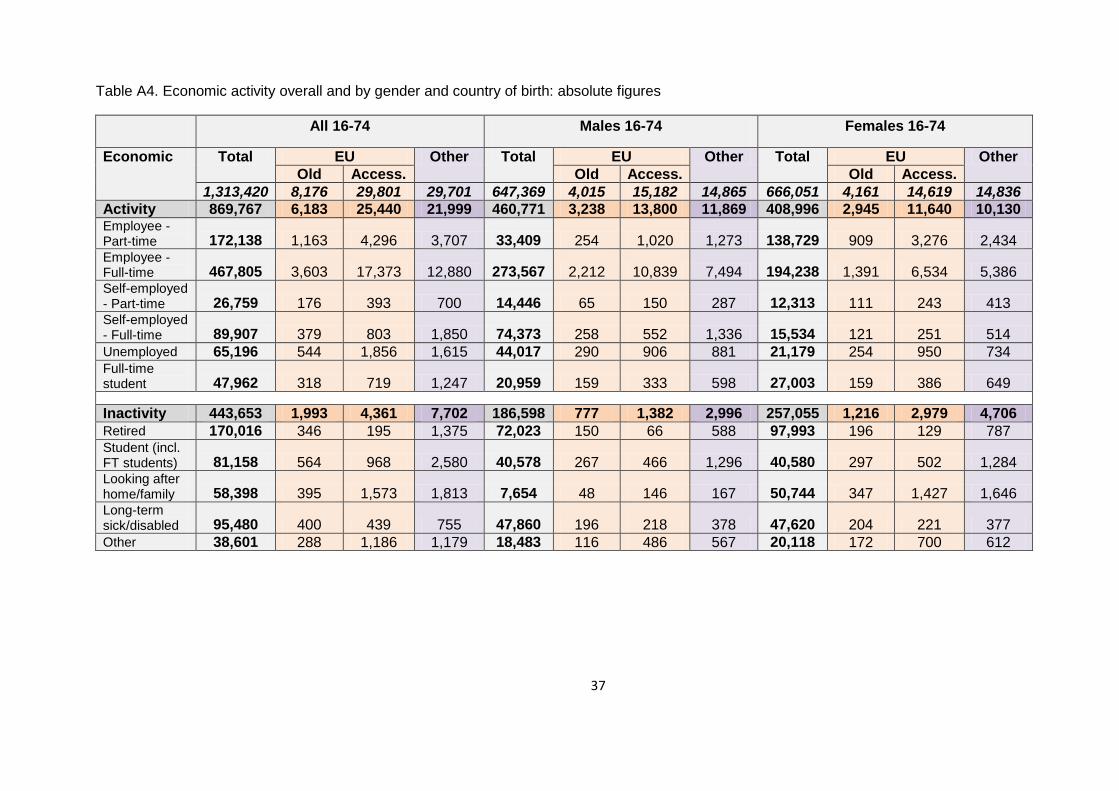
Economic activity
Economic activity among all usual residents aged 16-74 was assessed in reference to the
week prior to the Census day. Tables 8 and A4 show the economic activity for the whole
population and by country of birth. Overall, individuals born outside the UK/ROI were more
likely to be economically active than the NI population as a whole (at least three-quarters
versus two-thirds), with those from the EU accession countries showing the highest
proportion (85.4%). This pattern holds for both genders, yet the proportion is higher among
males than females. In addition, employment is also higher among those born in EU
Accession countries (77%), in EU countries prior to the 2004 expansion (65%), and Other
countries (64%) than among all usual residents aged 16-74 (57%; NISRA, 2013). This high
rate of economic activity and employment among migrants can be explained by their age
structure (eg high proportion of working age adults, see Table A2) and their motivation to
move to NI for work (eg Bell et al., 2009, Isal, 2013).
Apart from different employment forms (employee, self-employed, full- or part-time, working
full-time students), one critical indicator among those economically active is unemployment.
Among all economically active people, only those born in the old EU countries (ie those prior
to the 2004 expansion) experienced a higher unemployment rate compared to the total
population. However, there was a difference by gender. While all foreign-born males showed
a lower or similar unemployment rate compared to all males, the unemployment rate among
non-UK/ROI born females was higher than for all females.
19
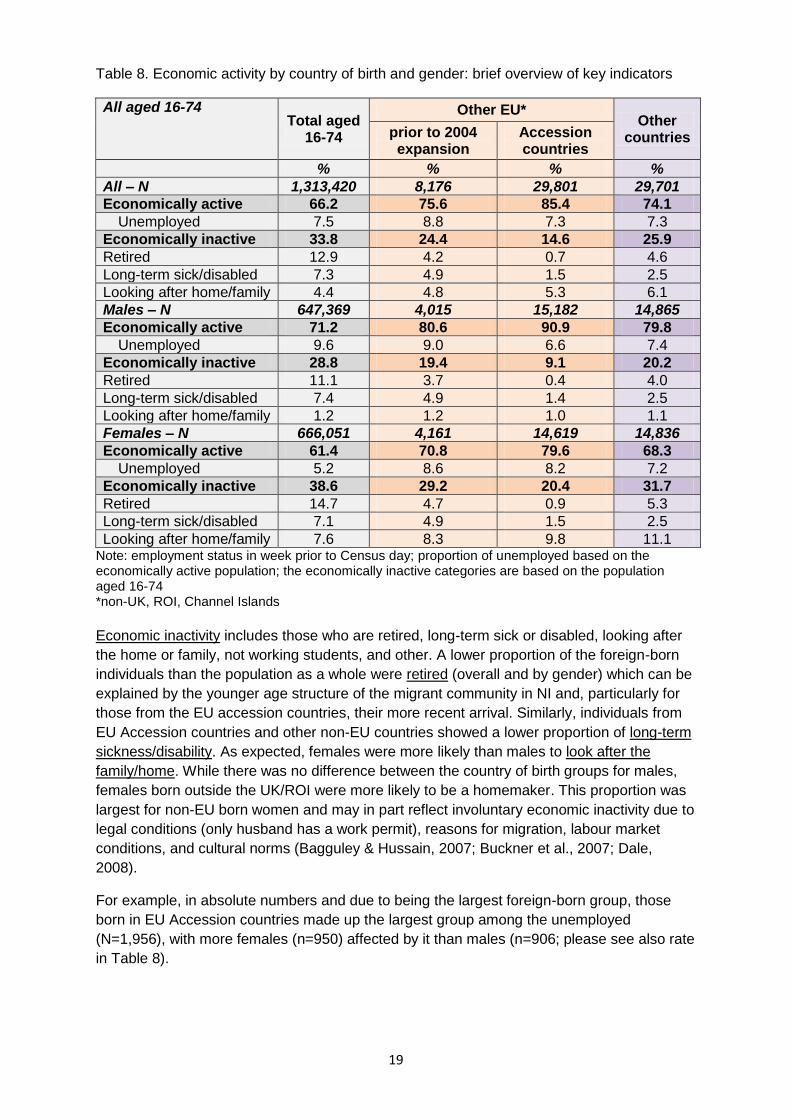
Table 8. Economic activity by country of birth and gender: brief overview of key indicators
All aged 16-74 Total aged
16-74
Other EU* Other
countries prior to 2004 expansion
Accession countries
% % % %
All – N 1,313,420 8,176 29,801 29,701
Economically active 66.2 75.6 85.4 74.1
Unemployed 7.5 8.8 7.3 7.3
Economically inactive 33.8 24.4 14.6 25.9
Retired 12.9 4.2 0.7 4.6
Long-term sick/disabled 7.3 4.9 1.5 2.5
Looking after home/family 4.4 4.8 5.3 6.1 Males – N 647,369 4,015 15,182 14,865
Economically active 71.2 80.6 90.9 79.8
Unemployed 9.6 9.0 6.6 7.4
Economically inactive 28.8 19.4 9.1 20.2
Retired 11.1 3.7 0.4 4.0
Long-term sick/disabled 7.4 4.9 1.4 2.5
Looking after home/family 1.2 1.2 1.0 1.1 Females – N 666,051 4,161 14,619 14,836
Economically active 61.4 70.8 79.6 68.3
Unemployed 5.2 8.6 8.2 7.2
Economically inactive 38.6 29.2 20.4 31.7
Retired 14.7 4.7 0.9 5.3
Long-term sick/disabled 7.1 4.9 1.5 2.5
Looking after home/family 7.6 8.3 9.8 11.1 Note: employment status in week prior to Census day; proportion of unemployed based on the economically active population; the economically inactive categories are based on the population aged 16-74 *non-UK, ROI, Channel Islands
Economic inactivity includes those who are retired, long-term sick or disabled, looking after
the home or family, not working students, and other. A lower proportion of the foreign-born
individuals than the population as a whole were retired (overall and by gender) which can be
explained by the younger age structure of the migrant community in NI and, particularly for
those from the EU accession countries, their more recent arrival. Similarly, individuals from
EU Accession countries and other non-EU countries showed a lower proportion of long-term
sickness/disability. As expected, females were more likely than males to look after the
family/home. While there was no difference between the country of birth groups for males,
females born outside the UK/ROI were more likely to be a homemaker. This proportion was
largest for non-EU born women and may in part reflect involuntary economic inactivity due to
legal conditions (only husband has a work permit), reasons for migration, labour market
conditions, and cultural norms (Bagguley & Hussain, 2007; Buckner et al., 2007; Dale,
2008).
For example, in absolute numbers and due to being the largest foreign-born group, those
born in EU Accession countries made up the largest group among the unemployed
(N=1,956), with more females (n=950) affected by it than males (n=906; please see also rate
in Table 8).

20
Table 9. Economic activity by ethnic group: selective indicators (percentages)
All usual residents 16 to 74
White Asian Black Mixed Other
Total Total Chinese Indian Pakistani Bangla-deshi
Other Asian
Total Carib-bean
African Other
All (N) 1,313,420 1,292,107 14,112 5,023 4,391 771 351 3,576 2,697 333 1,749 615 2,701 1,803
Active 66.2 66.1 72.2 62.0 80.9 64.9 64.4 78.3 73.7 76.0 74.2 71.2 70.2 71.7
Unempl 7.5 7.5 5.3 6.4 4.6 7.6 6.2 4.4 16.9 11.9 19.0 13.5 9.8 10.2
Inactive 33.8 33.9 27.8 38.0 19.1 35.1 35.6 21.7 26.3 24.0 25.8 28.8 29.8 28.3
Retired 12.9 13.1 3.8 5.5 4.0 4.7 1.4 1.4 1.7 2.7 0.7 3.7 2.3 5.1
Home 4.4 4.4 6.3 6.1 5.1 11.7 16.2 5.7 6.2 5.7 6.9 4.4 4.8 4.7
Sick 7.3 7.4 1.5 1.7 1.3 3.1 2.0 1.0 2.5 3.6 2.0 3.3 3.2 4.0
Male 647,369 636,131 7,224 2,625 2,415 452 220 1,512 1,596 189 990 417 1,275 1,143
Active 71.2 71.1 77.4 66.4 85.6 78.5 77.7 82.8 77.8 78.3 79.3 74.1 71.2 75.9
Unempl 9.6 9.6 4.6 5.9 3.4 6.2 2.9 4.5 18.3 11.5 21.9 12.3 10.0 9.3
Inactive 28.8 28.9 22.6 33.6 14.4 21.5 22.3 17.2 22.2 21.7 20.7 25.9 28.8 24.1
Retired 11.1 11.3 3.6 5.1 3.8 4.2 1.4 0.9 1.4 2.6 0.4 3.1 2.9 5.2
Home 1.2 1.2 1.1 1.1 0.8 0.9 3.6 1.1 1.6 1.1 2.2 0.5 1.1 1.1
Sick 7.4 7.5 1.7 1.8 1.5 3.1 2.3 1.3 2.8 3.7 2.4 3.1 3.1 3.4
Female 666,051 655,976 6,888 2,398 1,976 319 131 2,064 1,101 144 759 198 1,426 660
Active 61.4 61.3 66.8 57.2 75.1 45.5 42.0 75.0 67.8 72.9 67.5 65.2 69.3 64.4
Unempl 5.2 5.1 6.1 7.1 6.3 11.0 16.4 4.3 14.5 12.4 14.5 16.3 9.5 12.0
Inactive 38.6 38.7 33.2 42.8 24.9 54.5 58.0 25.0 32.2 27.1 32.5 34.8 30.7 35.6
Retired 14.7 14.9 4.1 5.9 4.2 5.3 1.5 1.8 2.1 2.8 1.2 5.1 1.8 5.0
Home 7.6 7.6 11.8 11.7 10.4 27.0 37.4 9.2 12.7 11.8 12.9 12.6 8.1 10.9
Sick 7.1 7.2 1.3 1.7 1.0 3.1 1.5 0.8 2.1 3.5 1.4 3.5 3.2 5.2
Note: proportion of unemployed based on economically active population; proportion of retired and long-term sick/disabled based on total population; Unempl – unemployed, Home – looking after home/family, Sick – long-term sick/disabled

21
Exploring economic activity by ethnic group (Tables 9 and A5) provides a different
perspective and partially explains the data for the ‘Other’ category within the country of birth
measure. Economic activity was generally higher among the non-White groups than the total
White population, except for the Chinese, Pakistani and Bangladeshi communities, primarily
driven by the lower rate among the females from these communities. Both Indian and Other
Asian males and females had the highest proportion of economic activity.
While, overall, Asian groups had an unemployment rate lower or similar to the total
population, those of Black, Mixed and Other ethnic background experienced higher
unemployment rates. There was some gender variation:
Among men, compared to the White male population (9.6%), all Asian groups had a
lower unemployment rate (range 2.9%-6.2%), while Black, particularly Black African,
men had a higher unemployment rate (range 11.5%-21.9%).
Among women, only Other Asian females (4.3%) had a lower unemployment rate
than all white females (5.2%), with all other ME women having experienced higher
unemployment rates (range 6.3%-16.3%).
Unemployment was lower among women than men in the total White population and
among the Black African group. In contrast, most Asian women (except for Other
Asian), Other Black and Black Caribbean women and Other ethnic women
experienced higher rates of unemployment than their male counterparts. This
differential was particularly pronounced among Bangladeshi and Pakistani women,
although in absolute terms the figures were small.
Among those economically inactive, the rate of retired and long-term sick/disabled
individuals was lower among the non-White than the total White population, overall and for
males and females. All non-White ethnic groups had a higher proportion of females looking
after the home/family than in the total White population, with particularly high rates among
Pakistani and Bangladeshi women.
Please note, for some ethnic groups (particularly Bangladeshi, Pakistani, Black Caribbean
and Black Other) the baseline population figures were small, so some subcategories of
economic (in)activity showed very few individuals (Table A5) and proportions could change
substantially even if there is only a small shift in numbers. Another note-worthy observation
is that among the Chinese population there was a large number of students (n=1,232) which
made up more than half of all Asian students in NI (please see NS SeC data on NISRA’s
Census website).
Occupation
There was variation in the occupation held by individuals by country of birth (Table 10 and
A6). The distribution between the different occupations varied a little between the population
in total and those born in the old EU countries or outside the EU, with one exception:
professional occupations. Almost three in ten of those born in countries outside the EU
worked in a professional occupation, while 20% of those born in the old EU countries and
17% of all usual residents aged 16-74 did.
22
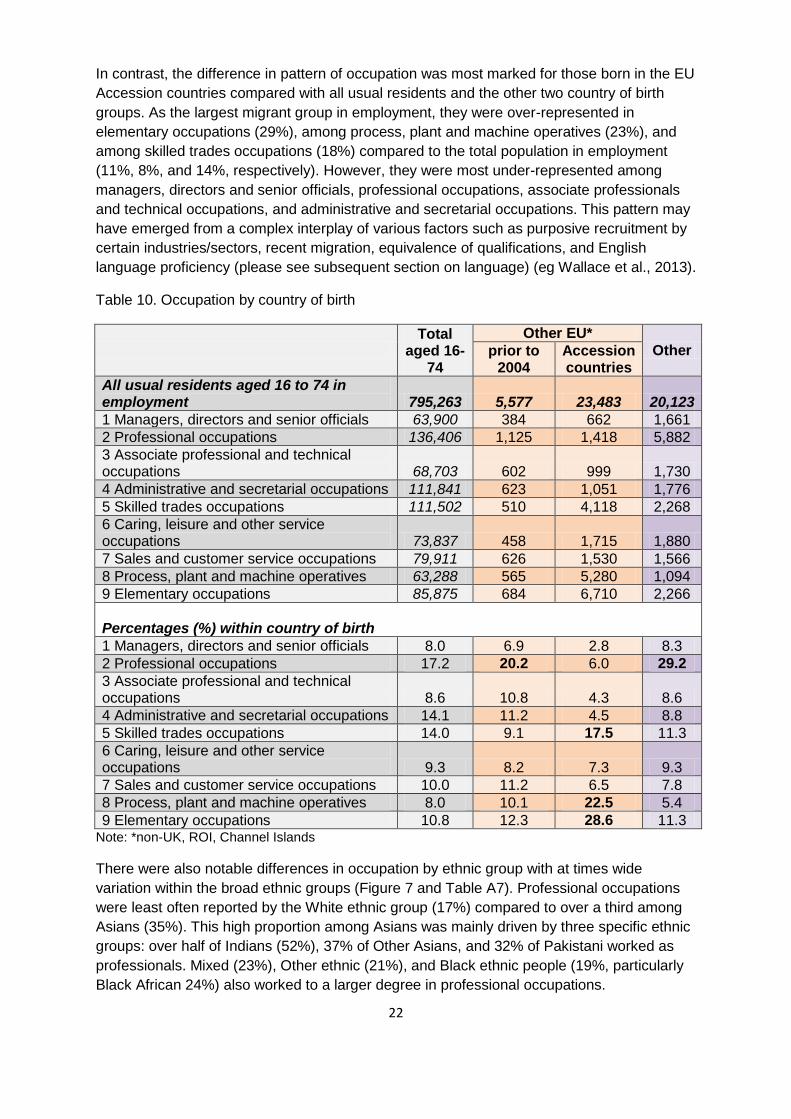
In contrast, the difference in pattern of occupation was most marked for those born in the EU
Accession countries compared with all usual residents and the other two country of birth
groups. As the largest migrant group in employment, they were over-represented in
elementary occupations (29%), among process, plant and machine operatives (23%), and
among skilled trades occupations (18%) compared to the total population in employment
(11%, 8%, and 14%, respectively). However, they were most under-represented among
managers, directors and senior officials, professional occupations, associate professionals
and technical occupations, and administrative and secretarial occupations. This pattern may
have emerged from a complex interplay of various factors such as purposive recruitment by
certain industries/sectors, recent migration, equivalence of qualifications, and English
language proficiency (please see subsequent section on language) (eg Wallace et al., 2013).
Table 10. Occupation by country of birth
Total
aged 16-74
Other EU*
Other prior to 2004
Accession countries
All usual residents aged 16 to 74 in employment 795,263 5,577 23,483 20,123
1 Managers, directors and senior officials 63,900 384 662 1,661
2 Professional occupations 136,406 1,125 1,418 5,882
3 Associate professional and technical occupations 68,703 602 999 1,730
4 Administrative and secretarial occupations 111,841 623 1,051 1,776
5 Skilled trades occupations 111,502 510 4,118 2,268
6 Caring, leisure and other service occupations 73,837 458 1,715 1,880
7 Sales and customer service occupations 79,911 626 1,530 1,566
8 Process, plant and machine operatives 63,288 565 5,280 1,094
9 Elementary occupations 85,875 684 6,710 2,266
Percentages (%) within country of birth
1 Managers, directors and senior officials 8.0 6.9 2.8 8.3
2 Professional occupations 17.2 20.2 6.0 29.2
3 Associate professional and technical occupations 8.6 10.8 4.3 8.6
4 Administrative and secretarial occupations 14.1 11.2 4.5 8.8
5 Skilled trades occupations 14.0 9.1 17.5 11.3
6 Caring, leisure and other service occupations 9.3 8.2 7.3 9.3
7 Sales and customer service occupations 10.0 11.2 6.5 7.8
8 Process, plant and machine operatives 8.0 10.1 22.5 5.4
9 Elementary occupations 10.8 12.3 28.6 11.3 Note: *non-UK, ROI, Channel Islands
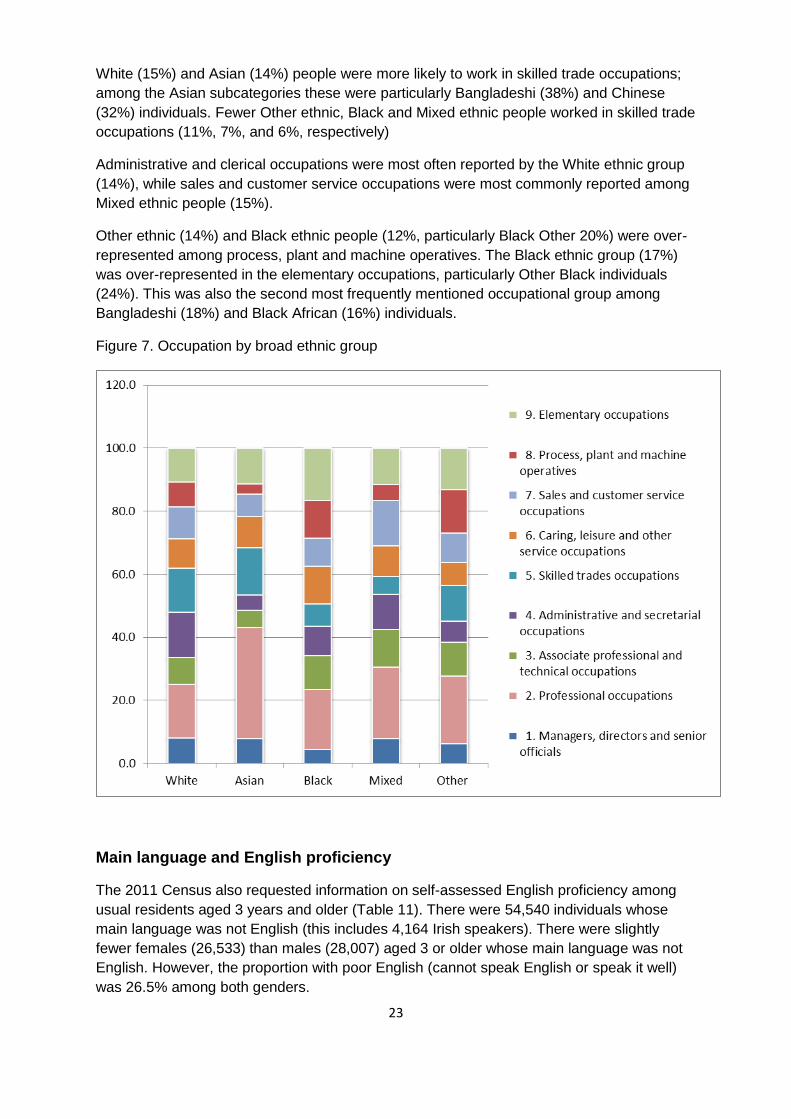
There were also notable differences in occupation by ethnic group with at times wide
variation within the broad ethnic groups (Figure 7 and Table A7). Professional occupations
were least often reported by the White ethnic group (17%) compared to over a third among
Asians (35%). This high proportion among Asians was mainly driven by three specific ethnic
groups: over half of Indians (52%), 37% of Other Asians, and 32% of Pakistani worked as
professionals. Mixed (23%), Other ethnic (21%), and Black ethnic people (19%, particularly
Black African 24%) also worked to a larger degree in professional occupations.
23
White (15%) and Asian (14%) people were more likely to work in skilled trade occupations;
among the Asian subcategories these were particularly Bangladeshi (38%) and Chinese
(32%) individuals. Fewer Other ethnic, Black and Mixed ethnic people worked in skilled trade
occupations (11%, 7%, and 6%, respectively)
Administrative and clerical occupations were most often reported by the White ethnic group
(14%), while sales and customer service occupations were most commonly reported among
Mixed ethnic people (15%).
Other ethnic (14%) and Black ethnic people (12%, particularly Black Other 20%) were over-
represented among process, plant and machine operatives. The Black ethnic group (17%)
was over-represented in the elementary occupations, particularly Other Black individuals
(24%). This was also the second most frequently mentioned occupational group among
Bangladeshi (18%) and Black African (16%) individuals.
Figure 7. Occupation by broad ethnic group
Main language and English proficiency
The 2011 Census also requested information on self-assessed English proficiency among
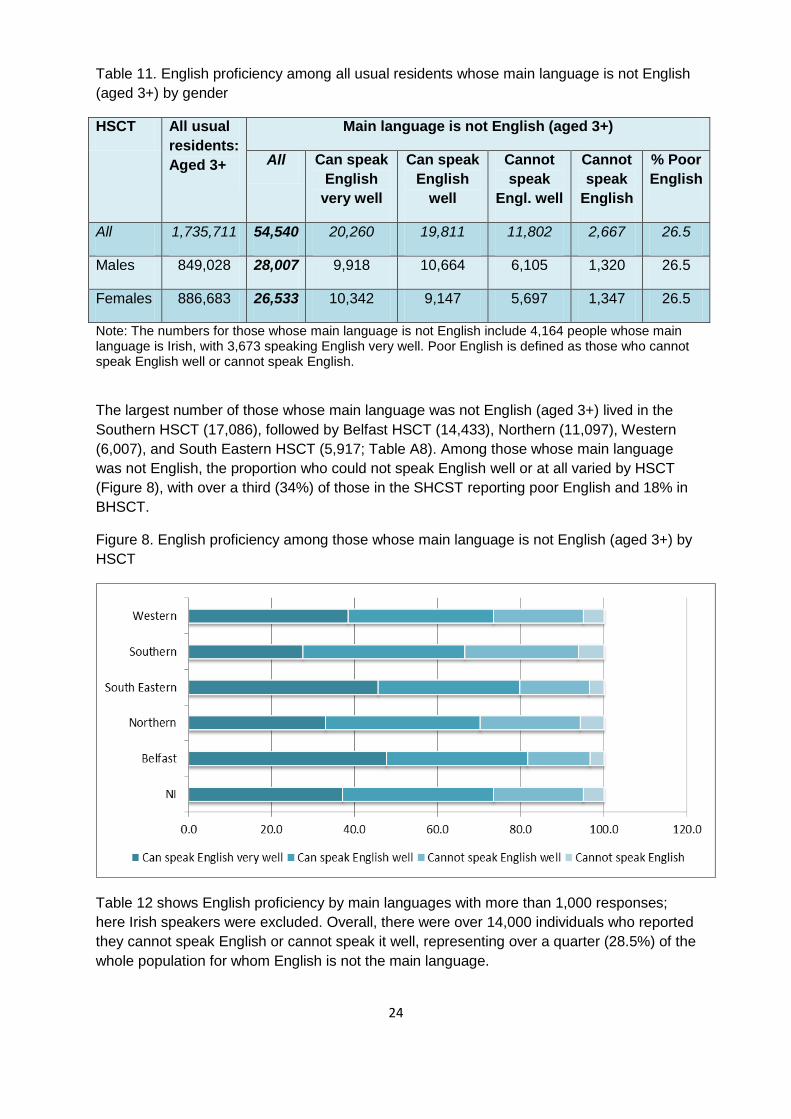
usual residents aged 3 years and older (Table 11). There were 54,540 individuals whose
main language was not English (this includes 4,164 Irish speakers). There were slightly
fewer females (26,533) than males (28,007) aged 3 or older whose main language was not
English. However, the proportion with poor English (cannot speak English or speak it well)
was 26.5% among both genders.
24
Table 11. English proficiency among all usual residents whose main language is not English
(aged 3+) by gender
HSCT All usual
residents:
Aged 3+
Main language is not English (aged 3+)
All Can speak
English
very well
Can speak
English
well
Cannot
speak
Engl. well
Cannot
speak
English
% Poor
English
All 1,735,711 54,540 20,260 19,811 11,802 2,667 26.5
Males 849,028 28,007 9,918 10,664 6,105 1,320 26.5
Females 886,683 26,533 10,342 9,147 5,697 1,347 26.5
Note: The numbers for those whose main language is not English include 4,164 people whose main language is Irish, with 3,673 speaking English very well. Poor English is defined as those who cannot speak English well or cannot speak English.
The largest number of those whose main language was not English (aged 3+) lived in the
Southern HSCT (17,086), followed by Belfast HSCT (14,433), Northern (11,097), Western
(6,007), and South Eastern HSCT (5,917; Table A8). Among those whose main language
was not English, the proportion who could not speak English well or at all varied by HSCT
(Figure 8), with over a third (34%) of those in the SHCST reporting poor English and 18% in
BHSCT.
Figure 8. English proficiency among those whose main language is not English (aged 3+) by
HSCT
Table 12 shows English proficiency by main languages with more than 1,000 responses;
here Irish speakers were excluded. Overall, there were over 14,000 individuals who reported
they cannot speak English or cannot speak it well, representing over a quarter (28.5%) of the
whole population for whom English is not the main language.

25
Table 12. English proficiency among all usual residents whose main language is not English (aged 3+): main languages with 1,000+ speakers
All aged 3+
Polish Lithuan. Portug. Slovak Chinese Tagalog/ Filipino
Latvian Russian Malayalam Hungarian Other
All 50,376 17,731 6,250 2,293 2,257 2,214 1,895 1,273 1,191 1,174 1,008 13,090
Can speak English very well 16,587 4,004 1,280 794 501 357 1,319 320 376 680 272 6,684
Can speak English well 19,397 7,640 2,599 891 947 1,003 551 586 411 405 414 3,950
Cannot speak English well 11,760 5,006 2,000 489 687 683 23 323 351 78 287 1,833
Cannot speak English 2,632 1,081 371 119 122 171 2 44 53 11 35 623
% per proficiency level
Can speak English very well 32.9 22.6 20.5 34.6 22.2 16.1 69.6 25.1 31.6 57.9 27.0 51.1
Can speak English well 38.5 43.1 41.6 38.9 42.0 45.3 29.1 46.0 34.5 34.5 41.1 30.2
Cannot speak English well 23.3 28.2 32.0 21.3 30.4 30.8 1.2 25.4 29.5 6.6 28.5 14.0
Cannot speak English 5.2 6.1 5.9 5.2 5.4 7.7 0.1 3.5 4.5 0.9 3.5 4.8
Note: This excludes those who reported Irish/Gaelic as their main language. Lithuan. – Lithuanian; Portug. – Portuguese; Malayalam is spoken in the Indian state of Kerala
26
These larger main languages identify primarily (Eastern) European languages, in line with the
country of births figures. Among the three large Asian main languages, very few Tagalog/Filipino
(1.3%) and Malayalam (7.5%) speakers could not speak English well or at all (these were from
jurisdictions where English is among the official languages). The proportion of poor English
proficiency was substantially higher among the European language speakers, ranging from 26.5%
among Portuguese speakers to 37.9% among Lithuanian speakers (generally about one-third
among Eastern Europeans). However, the highest proportion of poor English speakers was among
the Chinese speakers (38.5%); for all other languages the average was fewer than one in five.
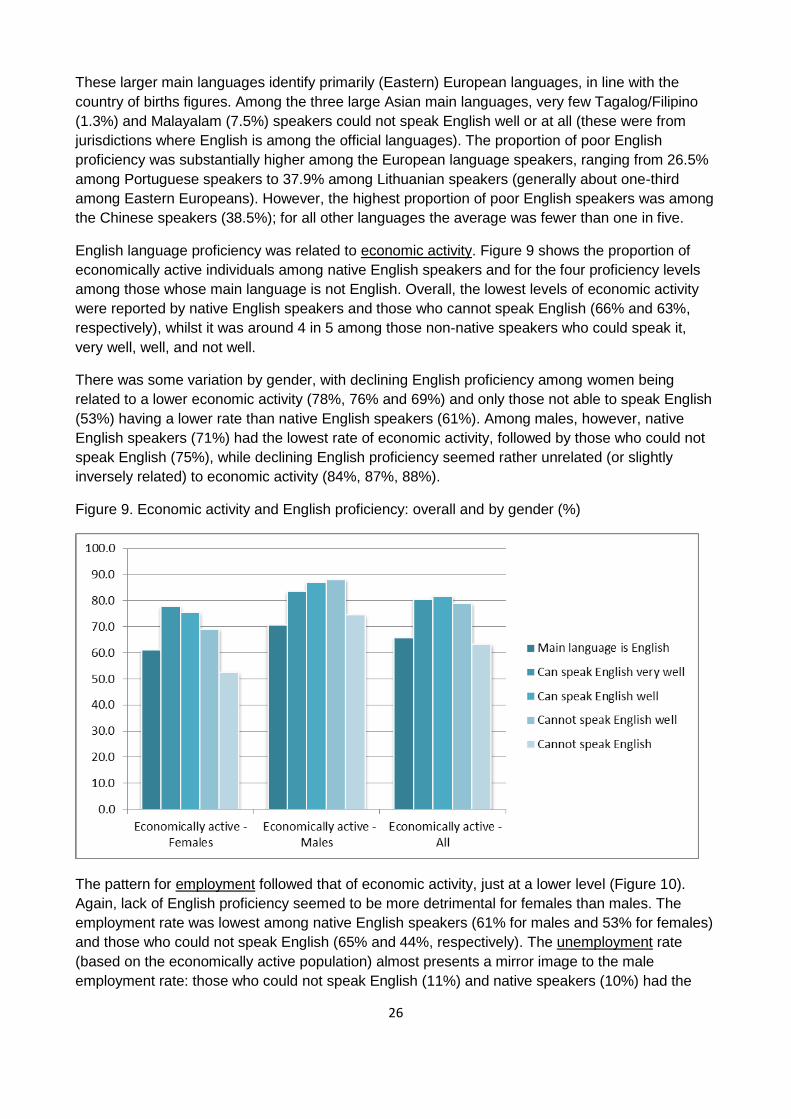
English language proficiency was related to economic activity. Figure 9 shows the proportion of
economically active individuals among native English speakers and for the four proficiency levels
among those whose main language is not English. Overall, the lowest levels of economic activity
were reported by native English speakers and those who cannot speak English (66% and 63%,
respectively), whilst it was around 4 in 5 among those non-native speakers who could speak it,
very well, well, and not well.
There was some variation by gender, with declining English proficiency among women being
related to a lower economic activity (78%, 76% and 69%) and only those not able to speak English
(53%) having a lower rate than native English speakers (61%). Among males, however, native
English speakers (71%) had the lowest rate of economic activity, followed by those who could not
speak English (75%), while declining English proficiency seemed rather unrelated (or slightly
inversely related) to economic activity (84%, 87%, 88%).
Figure 9. Economic activity and English proficiency: overall and by gender (%)
The pattern for employment followed that of economic activity, just at a lower level (Figure 10).
Again, lack of English proficiency seemed to be more detrimental for females than males. The
employment rate was lowest among native English speakers (61% for males and 53% for females)
and those who could not speak English (65% and 44%, respectively). The unemployment rate
(based on the economically active population) almost presents a mirror image to the male
employment rate: those who could not speak English (11%) and native speakers (10%) had the

27
highest rate. In contrast, among females, those with English as the main language (5%)
experienced the lowest unemployment rate whilst there was a linear increase in unemployment
rate with decreasing English proficiency (6%, 8%, 11%, 14%). Thus, females who could not speak
English had almost three times the level of unemployment than female native English speakers.
As a note of caution, it needs to be remembered that the proficiency levels are not equally
distributed among the non-native English speakers; those who could not speak English were only
about 1,000 individuals each among 23,000 males and 22,000 females of working age whose main
language was not English.
Figure 10. Rates of employment and unemployment and English language proficiency (%)
a) Employment rates
b) Unemployment rates
Note: the four graduations of ability to speak English encompass all usual residents aged 16-74 whose main
language is not English
Further detail on those whose main language was not English can be found in the by NISRA
(2013a) published statistical bulletin on the 2011 Census.
Perceived health
The 2011 Census questionnaire also asked how good or bad individuals thought their health was
in general (Table 13 and A9). In the total population, about four in five stated their health was very
good or good (79.5%), while 5.6% reported it to be bad or very bad; the remaining 14.9% reported
their health was fair. Overall, more foreign-born individuals reported to have very good/good health
(89.5%) and fewer had very bad/bad health (2.2%). There was some variation between the

28
different countries of births, with the most positive reports of health coming from those born in EU
Accession countries (92.4%), Central America (91.2%), South America (90.4%) and Antarctica and
Oceania (89.7%). The strongest contrast can be seen in among those born in Central America:
over two-thirds stated to have very good health and no-one reported very bad health (please note
the very small base population).
However, perceived general health needs to be considered with caution as it is a very subjective
self-assessment and may reflect selective migration (only the healthiest migrated) as well as
cultural bias of what makes good or bad health. More importantly, the ratings of perceived health
reflect the younger age structure of migrants as the reporting of worse health increases with age
(NISRA, 2013a).
Table 13. Self-assessed health by country of birth (continents)
Total Very good
Good Fair Bad Very bad
N % % % % %
All usual residents 1,810,863 47.7 31.8 14.9 4.4 1.2
UK, ROI, Islands 1,730,103 47.6 31.5 15.2 4.6 1.2
All foreign born 80,760 50.8 38.7 8.2 1.8 0.4
Other Europe: EU 45,429 48.4 42.4 7.3 1.6 0.4
Member countries prior to 2004 expansion 9,703 49.9 34.8 11.2 3.2 0.9
Accession countries 2004 onwards 35,720 48.0 44.4 6.2 1.1 0.3
Other Europe: Non EU countries 1,917 50.8 36.8 10.0 1.8 0.7
Africa 5,581 55.5 32.2 9.2 2.6 0.6
Middle East and Asia 17,293 52.6 36.4 9.1 1.5 0.4
North America and Caribbean 6,999 54.3 30.9 11.4 2.7 0.8
Central America 194 68.0 23.2 6.7 2.1 0.0
South America 875 57.5 32.9 7.0 2.1 0.6
Antarctica and Oceania 2,468 59.3 30.4 7.8 2.1 0.3 Note: Other excluded as only n=4
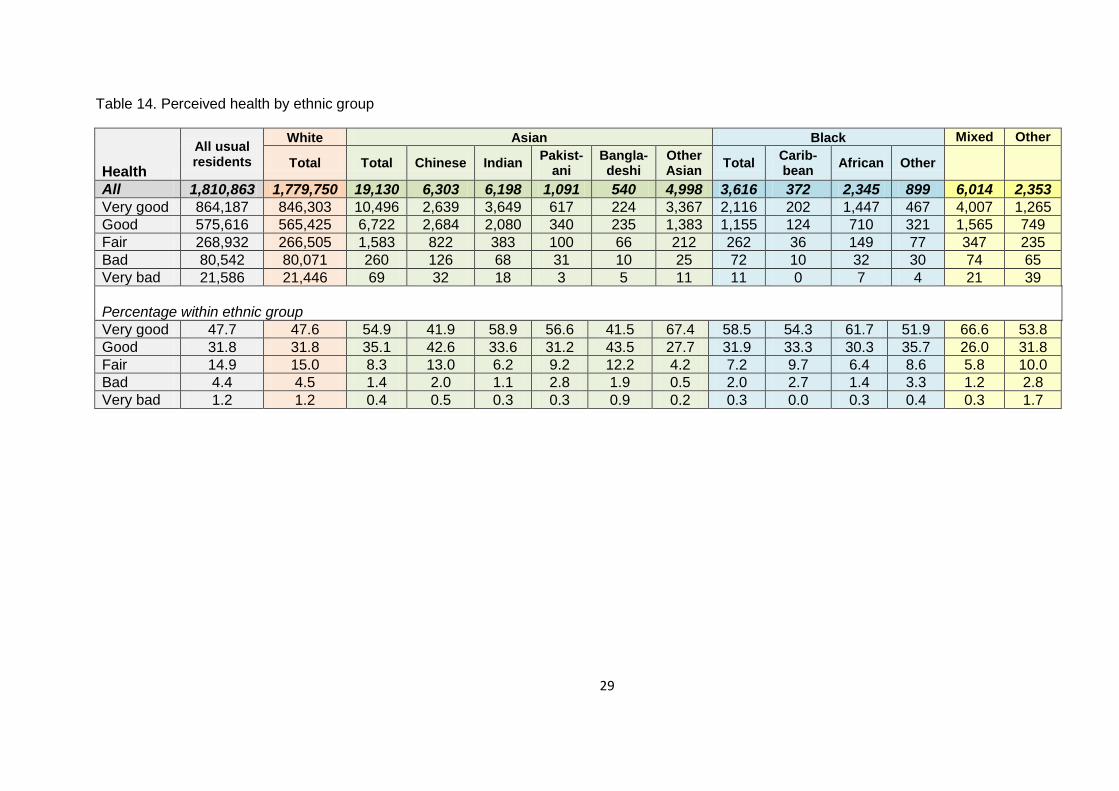
In terms of general health (Table 14), all non-White groups reported higher levels of very good or
good health, ranging from 84.5% among Chinese to 95.1% among Other Asian individuals,
compared to the White population (79.5%). Higher levels of very good health were reported by
almost all non-White groups; the two exceptions – Chinese and Bangladeshi – showed lower levels
than White ethnic people but were more evenly split between very good and good health.
The reverse pattern was shown for very bad or bad health which was more commonly reported by
the White ethnic group (5.7%) and was lowest among all non-White ethnic groups (range from
0.7% among Other Asians to 4.5% among Other ethnic). However, those from Other ethnic
background reported to have the highest proportion of very bad health (1.7% versus 1.2% for
White ethnic).
29
Table 14. Perceived health by ethnic group
Health
All usual residents
White Asian Black Mixed Other
Total Total Chinese Indian Pakist-
ani Bangla-deshi
Other Asian
Total Carib- bean
African Other
All 1,810,863 1,779,750 19,130 6,303 6,198 1,091 540 4,998 3,616 372 2,345 899 6,014 2,353
Very good 864,187 846,303 10,496 2,639 3,649 617 224 3,367 2,116 202 1,447 467 4,007 1,265
Good 575,616 565,425 6,722 2,684 2,080 340 235 1,383 1,155 124 710 321 1,565 749
Fair 268,932 266,505 1,583 822 383 100 66 212 262 36 149 77 347 235
Bad 80,542 80,071 260 126 68 31 10 25 72 10 32 30 74 65
Very bad 21,586 21,446 69 32 18 3 5 11 11 0 7 4 21 39
Percentage within ethnic group
Very good 47.7 47.6 54.9 41.9 58.9 56.6 41.5 67.4 58.5 54.3 61.7 51.9 66.6 53.8
Good 31.8 31.8 35.1 42.6 33.6 31.2 43.5 27.7 31.9 33.3 30.3 35.7 26.0 31.8
Fair 14.9 15.0 8.3 13.0 6.2 9.2 12.2 4.2 7.2 9.7 6.4 8.6 5.8 10.0
Bad 4.4 4.5 1.4 2.0 1.1 2.8 1.9 0.5 2.0 2.7 1.4 3.3 1.2 2.8
Very bad 1.2 1.2 0.4 0.5 0.3 0.3 0.9 0.2 0.3 0.0 0.3 0.4 0.3 1.7

30
Focusing only on those of working age (16-64 years), Figure 11 shows a slightly different
picture for perceived general health. Although Bangladeshi individuals reported the third
lowest proportion of very good or good health when considering all ages, they had the lowest
level (79%) among those of working age. In contrast, those from Other Asian, Indian and
Black African background seemed to enjoy the best health.
Figure 11. Very good or good health among working age adults (16-64 years)
Long-term health problems/disability
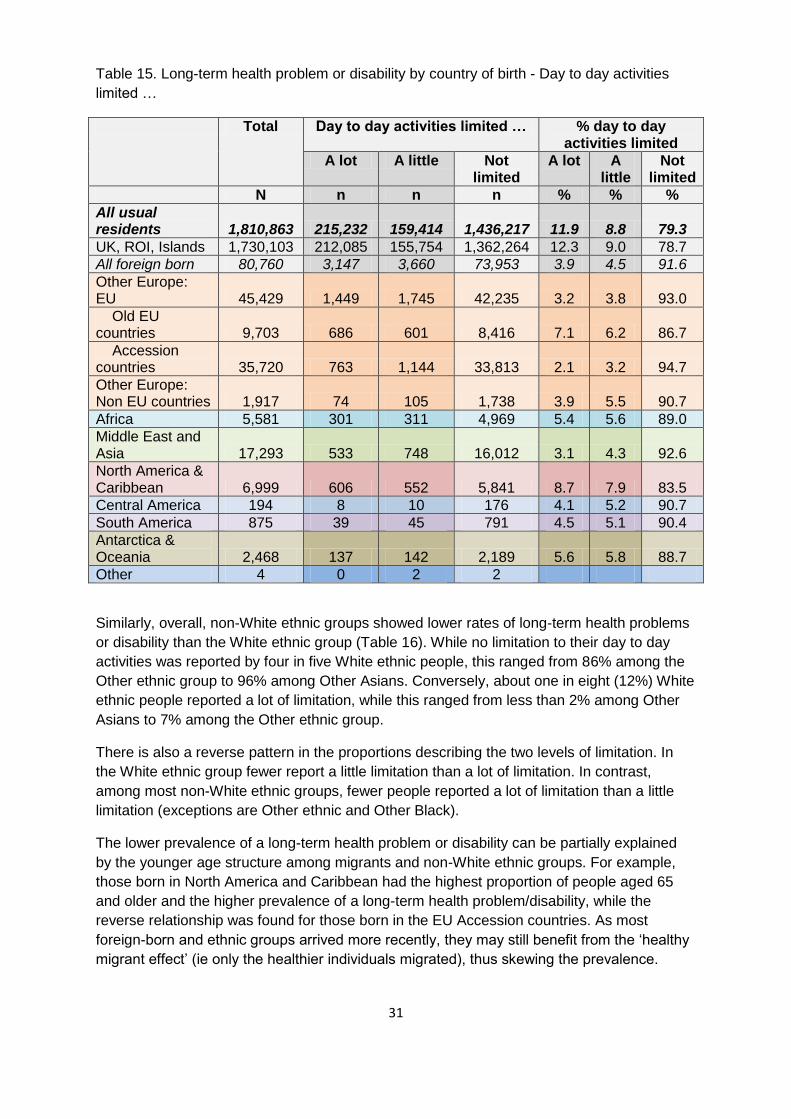
Overall, the pattern of having a long-term health problem or disability between UK/ROI born
and foreign-born individuals was similar to that for general health (Table 15). Those born in
the UK/ROI reported higher levels of their day to day activities being limited a lot (12%) or a
little (9%) but less no limitation (79%) compared to all foreign-born individuals (4%, 5%, and
92%, respectively).
The highest rate of no limitation was reported by those born in EU countries (93%),
especially those born in the EU Accession countries (95%) whilst the lowest rate was
reported by those born in North America and Caribbean (84%). Conversely, those born in
North America and Caribbean reported the highest level of being limited in day to day
activities a lot (9%) and a little (8%) while those from the EU Accession countries reported
the lowest levels (2% and 3%, respectively), followed by those born in the Middle East and
Asia (3% and 4%, respectively).
31
Table 15. Long-term health problem or disability by country of birth - Day to day activities
limited …
Total Day to day activities limited … % day to day activities limited
A lot A little Not limited
A lot A little
Not limited
N n n n % % %
All usual residents 1,810,863 215,232 159,414 1,436,217 11.9 8.8 79.3
UK, ROI, Islands 1,730,103 212,085 155,754 1,362,264 12.3 9.0 78.7
All foreign born 80,760 3,147 3,660 73,953 3.9 4.5 91.6
Other Europe: EU 45,429 1,449 1,745 42,235 3.2 3.8 93.0
Old EU countries 9,703 686 601 8,416 7.1 6.2 86.7
Accession countries 35,720 763 1,144 33,813 2.1 3.2 94.7
Other Europe: Non EU countries 1,917 74 105 1,738 3.9 5.5 90.7
Africa 5,581 301 311 4,969 5.4 5.6 89.0
Middle East and Asia 17,293 533 748 16,012 3.1 4.3 92.6
North America & Caribbean 6,999 606 552 5,841 8.7 7.9 83.5
Central America 194 8 10 176 4.1 5.2 90.7
South America 875 39 45 791 4.5 5.1 90.4
Antarctica & Oceania 2,468 137 142 2,189 5.6 5.8 88.7
Other 4 0 2 2
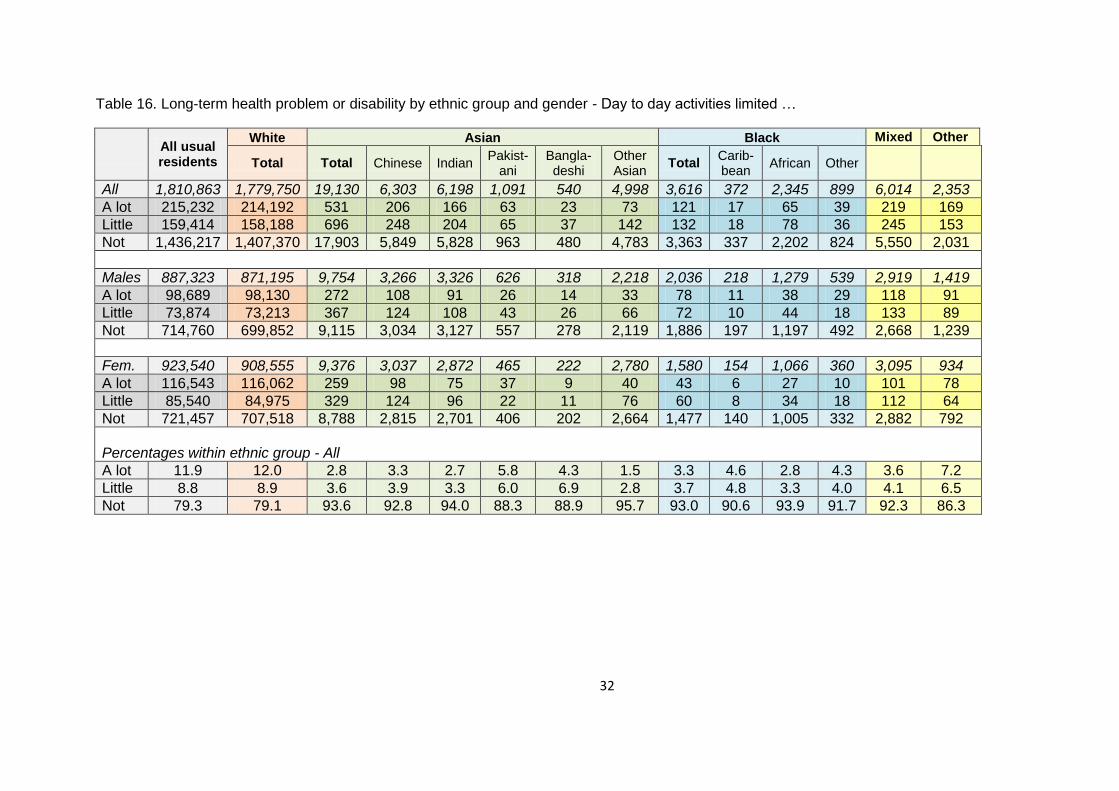
Similarly, overall, non-White ethnic groups showed lower rates of long-term health problems
or disability than the White ethnic group (Table 16). While no limitation to their day to day
activities was reported by four in five White ethnic people, this ranged from 86% among the
Other ethnic group to 96% among Other Asians. Conversely, about one in eight (12%) White
ethnic people reported a lot of limitation, while this ranged from less than 2% among Other
Asians to 7% among the Other ethnic group.
There is also a reverse pattern in the proportions describing the two levels of limitation. In
the White ethnic group fewer report a little limitation than a lot of limitation. In contrast,
among most non-White ethnic groups, fewer people reported a lot of limitation than a little
limitation (exceptions are Other ethnic and Other Black).
The lower prevalence of a long-term health problem or disability can be partially explained
by the younger age structure among migrants and non-White ethnic groups. For example,
those born in North America and Caribbean had the highest proportion of people aged 65
and older and the higher prevalence of a long-term health problem/disability, while the
reverse relationship was found for those born in the EU Accession countries. As most
foreign-born and ethnic groups arrived more recently, they may still benefit from the ‘healthy
migrant effect’ (ie only the healthier individuals migrated), thus skewing the prevalence.
32
Table 16. Long-term health problem or disability by ethnic group and gender - Day to day activities limited …
All usual residents
White Asian Black Mixed Other
Total Total Chinese Indian Pakist-
ani Bangla-deshi
Other Asian
Total Carib-bean
African Other
All 1,810,863 1,779,750 19,130 6,303 6,198 1,091 540 4,998 3,616 372 2,345 899 6,014 2,353
A lot 215,232 214,192 531 206 166 63 23 73 121 17 65 39 219 169
Little 159,414 158,188 696 248 204 65 37 142 132 18 78 36 245 153
Not 1,436,217 1,407,370 17,903 5,849 5,828 963 480 4,783 3,363 337 2,202 824 5,550 2,031
Males 887,323 871,195 9,754 3,266 3,326 626 318 2,218 2,036 218 1,279 539 2,919 1,419
A lot 98,689 98,130 272 108 91 26 14 33 78 11 38 29 118 91
Little 73,874 73,213 367 124 108 43 26 66 72 10 44 18 133 89
Not 714,760 699,852 9,115 3,034 3,127 557 278 2,119 1,886 197 1,197 492 2,668 1,239
Fem. 923,540 908,555 9,376 3,037 2,872 465 222 2,780 1,580 154 1,066 360 3,095 934
A lot 116,543 116,062 259 98 75 37 9 40 43 6 27 10 101 78
Little 85,540 84,975 329 124 96 22 11 76 60 8 34 18 112 64
Not 721,457 707,518 8,788 2,815 2,701 406 202 2,664 1,477 140 1,005 332 2,882 792
Percentages within ethnic group - All
A lot 11.9 12.0 2.8 3.3 2.7 5.8 4.3 1.5 3.3 4.6 2.8 4.3 3.6 7.2
Little 8.8 8.9 3.6 3.9 3.3 6.0 6.9 2.8 3.7 4.8 3.3 4.0 4.1 6.5
Not 79.3 79.1 93.6 92.8 94.0 88.3 88.9 95.7 93.0 90.6 93.9 91.7 92.3 86.3
33
References
Bagguley, P. & Hussain, Y (2007). The role of higher education in providing opportunities for
South Asian women. Joseph Rowntree Foundation.
http://www.jrf.org.uk/publications/role-higher-education-providing-opportunities-south-
asian-women
Bell, J., Caughey, A. Hansson, U., Martynowicz, A. and Scully, M. (2009). Experiences of
migrant workers in Northern Ireland. Institute for Conflict Research, Belfast:
Department for Employment and Learning.
(http://www.delni.gov.uk/a_report_on_the_experiences_of_migrant_workers_in_north
ern_ireland.pdf)
Buckner, L, Yeandle, S., & Botcherby, S. (2007). Moving on up? Ethnic minority women and
work. Ethnic minority women and local labour markets. Manchester: Equal
Opportunities Commission.
http://circle.leeds.ac.uk/files/2012/09/local_labour_markets.pdf.
Dale, A. (2008). Migration, marriage and employment amongst Indian, Pakistani and
Bangladeshi residents in the UK. Manchester: The University of Manchester, CCSR
Working Paper 2008-02 http://www.ccsr.ac.uk/research/documents/2008-02.pdf.
Isal, S. (2013). The experiences of ethnic minority women in Northern Ireland. Prepared for
the Submission to CEDAW. Belfast: NICEM (Northern Ireland Council for Ethnic
Minorities).
National Records of Scotland (2013). 2011 Census: Key Results on population, ethnicity,
identity, language, religion, health, housing and accommodation in Scotland -
Release 2A. Edinburgh: National Records of Scotland.
(http://www.scotlandscensus.gov.uk/en/censusresults/bulletinr2.html)
NISRA (2013a). Census 2011: Detailed characteristics for Northern Ireland on ethnicity,
country of birth and language. Belfast: NISRA.
(http://www.nisra.gov.uk/Census/2011_results_detailed_characteristics.html)
NISRA (2013b). Registrar General Northern Ireland Annual Report 2012. Belfast:
Department of Finance and Personnel.
(http://www.nisra.gov.uk/demography/default.asp4.htm)
ONS (Office for National Statistics) (2012). Ethnicity and national identity in England and
Wales 2011. ONS. (http://www.ons.gov.uk/ons/rel/census/2011-census/key-statistics-
for-local-authorities-in-england-and-wales/rpt-ethnicity.html)
ONS (Office for National Statistics) (2013). Detailed country of birth and nationality analysis
from the 2011 Census of England and Wales. ONS.
(http://www.ons.gov.uk/ons/rel/census/2011-census/detailed-characteristics-for-local-
authorities-in-england-and-wales/country-of-birth---rpt.html)
Wallace, A., McAreavey, R., & Atkin, K. (2013). Poverty and ethnicity in Northern Ireland: An
evidence review. Joseph Rowntree Foundation.
(http://www.jrf.org.uk/sites/files/jrf/poverty-ethnicity-northern-ireland-full.pdf)
34
Appendix 1
Table A1. Country of birth by age band: continents and selected countries
All usual residents aged:
Total 0 to 15 16 to 34 35 to 64 65+
All usual residents 1,810,863 379,323 471,572 696,248 263,720
Born outside UK, ROI, Channel Islands & Isle of Man 80,760 12,099 36,712 29,156 2,793
Other Europe: EU 45,429 7,142 24,063 13,560 664
Member countries prior to 2004 expansion 9,703 1,288 3,848 4,086 481
Germany 3,908 406 1,616 1,712 174
Portugal 1,996 409 772 787 28
Other member countries prior to 2004 expansion 3,799 473 1,460 1,587 279
Accession countries 35,720 5,853 20,213 9,471 183
% 16.4% 56.6% 26.5% 0.5%
Poland 19,658 3,489 11,245 4,857 67
Lithuania 7,341 1,225 4,108 1,976 32
Slovakia 2,681 289 1,626 762 4
Latvia 2,297 412 1,214 663 8
Romania 1,094 168 664 252 10
Other Accession countries 2,649 270 1,356 961 62
Europe (Not otherwise specified) 6 1 2 3 0
Other Europe: Non EU countries 1,917 228 787 840 62
Turkey 377 18 199 153 7
Russia 349 53 124 160 12
Other Non EU 1,191 157 464 527 43
Africa 5,581 604 2,084 2,609 284
North Africa 725 61 211 400 53
Central and Western Africa 1,108 111 446 525 26
Nigeria 543 51 200 282 10
Other Central and Western Africa 565 60 246 243 16
South and Eastern Africa 3,690 432 1,417 1,640 201
South Africa 1,847 219 845 670 113
Zimbabwe 657 89 226 319 23
Kenya 301 34 65 181 21
Zambia 285 11 61 205 8
Other South and Eastern Africa 600 79 220 265 36
Africa Not Otherwise Specified 58 0 10 44 4
Middle East and Asia 17,293 2,377 6,350 7,776 790
Middle East 1,071 241 400 387 43
Iran 282 22 81 164 15
Saudi Arabia 269 119 139 11 0
Other Middle East 520 100 180 212 28
Eastern Asia 4,498 299 1,769 2,211 219
China 2,223 135 1,154 871 63
Hong Kong 1,906 119 479 1,160 148
Other Eastern Asia 369 45 136 180 8

35
All usual residents aged:
Total 0 to 15 16 to 34 35 to 64 65+
Southern Asia 6,042 902 2,344 2,355 441
India 4,796 765 1,865 1,793 373
Pakistan 620 74 221 284 41
Bangladesh 360 21 158 171 10
Other Southern Asia 266 42 100 107 17
South East Asia 5,625 927 1,810 2,801 87
Philippines 2,947 607 720 1,612 8
East Timor 894 69 499 323 3
Malaysia 705 51 299 312 43
Thailand 469 153 157 156 3
Singapore 274 15 22 224 13
Other South East Asia 336 32 113 174 17
Central Asia 57 8 27 22 0
North America and Caribbean 6,999 1,276 2,132 2,796 795
United States of America 4,251 1,078 1,328 1,433 412
Canada 2,323 145 665 1,171 342
Caribbean 314 29 109 143 33
Other North American and Caribbean 111 24 30 49 8
Central America 194 44 68 77 5
South America 875 80 345 400 50
Antarctica and Oceania 2,468 347 882 1,097 142
Australia 1,750 247 625 783 95
New Zealand 584 78 169 291 46
Other Antarctica and Oceania 134 22 88 23 1
Other 4 1 1 1 1
Table A2. Country of birth by age band: continents only
% 0-15 %16-34 % 34-64 % 65+
All usual residents 20.9 26.0 38.4 14.6
Born outside UK, ROI, Channel Islands & Isle of Man 15.0 45.4 36.1 3.4
Other Europe: EU 15.7 53.0 29.8 1.5
Accession countries 2004 onwards 16.4 56.6 26.5 0.5
Other Europe: Non EU countries 11.9 41.1 43.8 3.2
Africa 10.8 37.3 46.7 5.1
Middle East and Asia 13.7 36.7 45.0 4.6
North America and Caribbean 18.2 30.5 39.9 11.4
Central America 22.7 35.1 39.7 2.6
South America 9.1 39.4 45.7 5.7
Antarctica and Oceania 14.1 35.7 44.4 5.8

36
Table A3. Ethnic groups by detailed age bands
All usual residents
White Asian Black Mixed Other
Total Total Chinese Indian Pakist-
ani Bangla-deshi
Other Asian
Total Carib-bean
African Other
All 1,810,863 1,779,750 19,130 6,303 6,198 1,091 540 4,998 3,616 372 2,345 899 6,014 2,353
0-4 124,382 120,441 1,903 382 857 119 62 483 356 10 205 141 1,503 179
5-7 67,662 65,819 965 222 354 65 44 280 179 7 117 55 597 102
8-9 43,625 42,666 508 131 180 32 23 142 77 1 58 18 320 54
10-11 45,453 44,477 530 130 157 29 20 194 91 9 51 31 300 55
12-15 98,201 96,390 919 317 196 65 36 305 205 7 160 38 575 112
16-17 51,440 50,643 434 222 71 38 12 91 78 5 54 19 236 49
18-19 50,181 49,400 450 255 68 26 10 91 67 7 43 17 220 44
20-24 126,013 123,783 1,384 806 227 65 36 250 186 24 105 57 478 182
25-29 124,099 121,119 1,834 689 726 85 51 283 497 61 315 121 365 284
30-34 119,839 116,109 2,552 557 1,091 150 81 673 561 45 384 132 332 285
35-39 122,260 118,633 2,524 540 814 106 56 1,008 504 43 348 113 342 257
40-44 131,848 129,275 1,730 540 476 97 48 569 350 65 211 74 299 194
45-54 248,578 245,765 1,944 856 485 105 44 454 298 61 193 44 285 286
55-64 193,562 192,327 874 414 262 63 8 127 121 19 76 26 98 142
65-74 145,600 145,053 386 144 171 36 5 30 35 3 20 12 46 80
75+ 118,120 117,850 193 98 63 10 4 18 11 5 5 1 18 48
Broad age bands
0-15 379,323 369,793 4,825 1,182 1,744 310 185 1,404 908 34 591 283 3,295 502
16-34 471,572 461,054 6,654 2,529 2,183 364 190 1,388 1,389 142 901 346 1,631 844
35-64 696,248 686,000 7,072 2,350 2,037 371 156 2,158 1,273 188 828 257 1,024 879
65+ 263,720 262,903 579 242 234 46 9 48 46 8 25 13 64 128
Percentages within ethnic group
0-15 20.9 20.8 25.2 18.8 28.1 28.4 34.3 28.1 25.1 9.1 25.2 31.5 54.8 21.3
16-34 26.0 25.9 34.8 40.1 35.2 33.4 35.2 27.8 38.4 38.2 38.4 38.5 27.1 35.9
35-64 38.4 38.5 37.0 37.3 32.9 34.0 28.9 43.2 35.2 50.5 35.3 28.6 17.0 37.4
65+ 14.6 14.8 3.0 3.8 3.8 4.2 1.7 1.0 1.3 2.2 1.1 1.4 1.1 5.4
37
Table A4. Economic activity overall and by gender and country of birth: absolute figures
All 16-74 Males 16-74 Females 16-74
Economic Total EU Other Total EU Other Total EU Other
Old Access. Old Access. Old Access.
1,313,420 8,176 29,801 29,701 647,369 4,015 15,182 14,865 666,051 4,161 14,619 14,836
Activity 869,767 6,183 25,440 21,999 460,771 3,238 13,800 11,869 408,996 2,945 11,640 10,130 Employee - Part-time 172,138 1,163 4,296 3,707 33,409 254 1,020 1,273 138,729 909 3,276 2,434 Employee - Full-time 467,805 3,603 17,373 12,880 273,567 2,212 10,839 7,494 194,238 1,391 6,534 5,386 Self-employed - Part-time 26,759 176 393 700 14,446 65 150 287 12,313 111 243 413 Self-employed - Full-time 89,907 379 803 1,850 74,373 258 552 1,336 15,534 121 251 514 Unemployed 65,196 544 1,856 1,615 44,017 290 906 881 21,179 254 950 734 Full-time student 47,962 318 719 1,247 20,959 159 333 598 27,003 159 386 649
Inactivity 443,653 1,993 4,361 7,702 186,598 777 1,382 2,996 257,055 1,216 2,979 4,706
Retired 170,016 346 195 1,375 72,023 150 66 588 97,993 196 129 787 Student (incl. FT students) 81,158 564 968 2,580 40,578 267 466 1,296 40,580 297 502 1,284 Looking after home/family 58,398 395 1,573 1,813 7,654 48 146 167 50,744 347 1,427 1,646 Long-term sick/disabled 95,480 400 439 755 47,860 196 218 378 47,620 204 221 377 Other 38,601 288 1,186 1,179 18,483 116 486 567 20,118 172 700 612
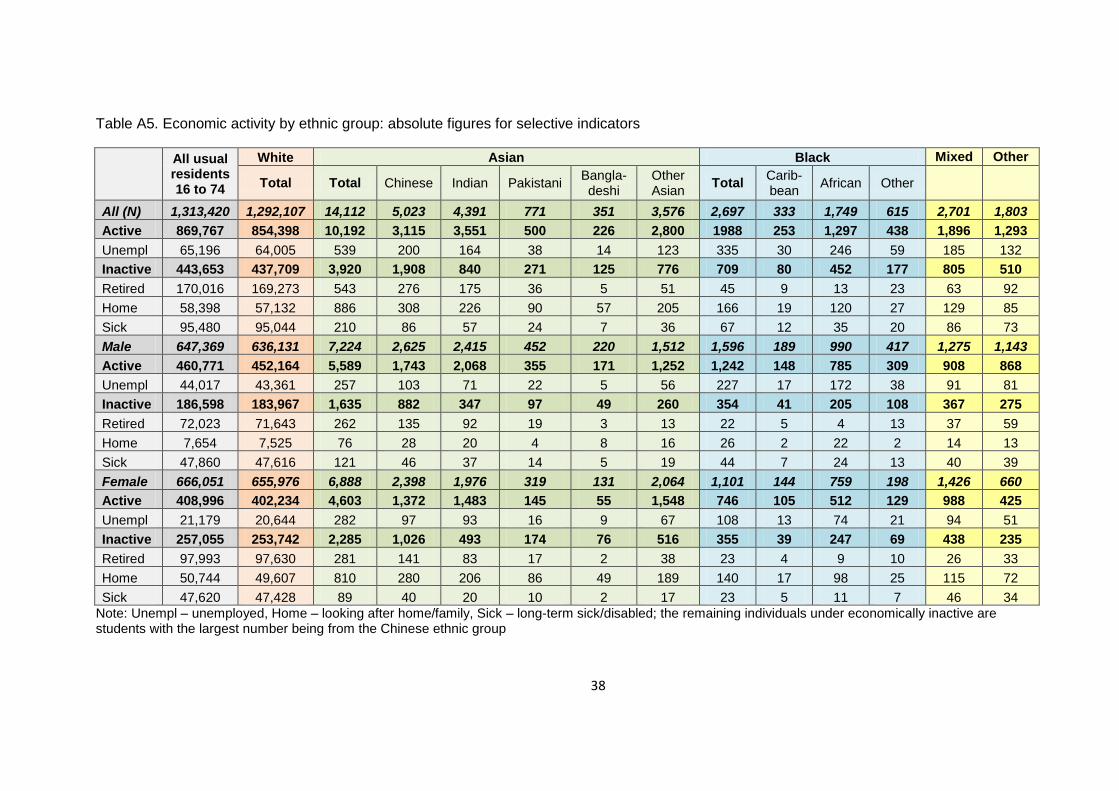
38
Table A5. Economic activity by ethnic group: absolute figures for selective indicators
All usual residents 16 to 74
White Asian Black Mixed Other
Total Total Chinese Indian Pakistani Bangla-deshi
Other Asian
Total Carib-bean
African Other
All (N) 1,313,420 1,292,107 14,112 5,023 4,391 771 351 3,576 2,697 333 1,749 615 2,701 1,803
Active 869,767 854,398 10,192 3,115 3,551 500 226 2,800 1988 253 1,297 438 1,896 1,293
Unempl 65,196 64,005 539 200 164 38 14 123 335 30 246 59 185 132
Inactive 443,653 437,709 3,920 1,908 840 271 125 776 709 80 452 177 805 510
Retired 170,016 169,273 543 276 175 36 5 51 45 9 13 23 63 92
Home 58,398 57,132 886 308 226 90 57 205 166 19 120 27 129 85
Sick 95,480 95,044 210 86 57 24 7 36 67 12 35 20 86 73
Male 647,369 636,131 7,224 2,625 2,415 452 220 1,512 1,596 189 990 417 1,275 1,143
Active 460,771 452,164 5,589 1,743 2,068 355 171 1,252 1,242 148 785 309 908 868
Unempl 44,017 43,361 257 103 71 22 5 56 227 17 172 38 91 81
Inactive 186,598 183,967 1,635 882 347 97 49 260 354 41 205 108 367 275
Retired 72,023 71,643 262 135 92 19 3 13 22 5 4 13 37 59
Home 7,654 7,525 76 28 20 4 8 16 26 2 22 2 14 13
Sick 47,860 47,616 121 46 37 14 5 19 44 7 24 13 40 39
Female 666,051 655,976 6,888 2,398 1,976 319 131 2,064 1,101 144 759 198 1,426 660
Active 408,996 402,234 4,603 1,372 1,483 145 55 1,548 746 105 512 129 988 425
Unempl 21,179 20,644 282 97 93 16 9 67 108 13 74 21 94 51
Inactive 257,055 253,742 2,285 1,026 493 174 76 516 355 39 247 69 438 235
Retired 97,993 97,630 281 141 83 17 2 38 23 4 9 10 26 33
Home 50,744 49,607 810 280 206 86 49 189 140 17 98 25 115 72
Sick 47,620 47,428 89 40 20 10 2 17 23 5 11 7 46 34
Note: Unempl – unemployed, Home – looking after home/family, Sick – long-term sick/disabled; the remaining individuals under economically inactive are students with the largest number being from the Chinese ethnic group

39
Table A6. Detailed occupation by country of birth
All usual residents aged 16 to 74 in employment
Total
EU (non-UK, ROI, Channel Islands)
Other Old EU
countries Accession countries
All 795,263 5,577 23,483 20,123
1 Managers, directors and senior officials 63,900 384 662 1,661
11 Corporate managers and directors 40,385 208 343 742
12 Other managers and proprietors 23,515 176 319 919
2 Professional occupations 136,406 1,125 1,418 5,882
21 Science, research, engineering and technology professionals 25,028 293 432 1,361
22 Health professionals 40,059 272 396 2,808
23 Teaching and educational professionals 36,736 364 253 891
24 Business, media and public service professionals 34,583 196 337 822
3 Associate professional and technical occupations 68,703 602 999 1,730
31 Science, engineering and technology associate professionals 11,038 120 305 335
32 Health and social care associate professionals 8,679 57 130 216
33 Protective service occupations 4,331 53 23 137
34 Culture, media and sports occupations 9,981 115 218 365
35 Business and public service associate professionals 34,674 257 323 677
4 Administrative and secretarial occupations 111,841 623 1,051 1,776
41 Administrative occupations 91,074 529 879 1,471
42 Secretarial and related occupations 20,767 94 172 305
5 Skilled trades occupations 111,502 510 4,118 2,268
51 Skilled agricultural and related trades 19,374 30 202 106
52 Skilled metal, electrical and electronic trades 35,720 178 1,648 433
53 Skilled construction and building trades 35,565 102 783 269
54 Textiles, printing and other skilled trades 20,843 200 1,485 1,460
6 Caring, leisure and other service occupations 73,837 458 1,715 1,880
61 Caring personal service occupations 55,948 333 1,104 1,540
62 Leisure, travel and related personal service occupations 17,889 125 611 340
7 Sales and customer service occupations 79,911 626 1,530 1,566
71 Sales occupations 69,501 421 1,287 1,234

40
Total
EU (non-UK, ROI, Channel Islands)
Other Old EU
countries Accession countries
72 Customer service occupations 10,410 205 243 332
8 Process, plant and machine operatives 63,288 565 5,280 1,094
81 Process, plant and machine operatives 30,626 429 4,371 766
82 Transport and mobile machine drivers and operatives 32,662 136 909 328
9 Elementary occupations 85,875 684 6,710 2,266
91 Elementary trades and related occupations 15,067 150 2,151 301
92 Elementary administration and service occupations 70,808 534 4,559 1,965
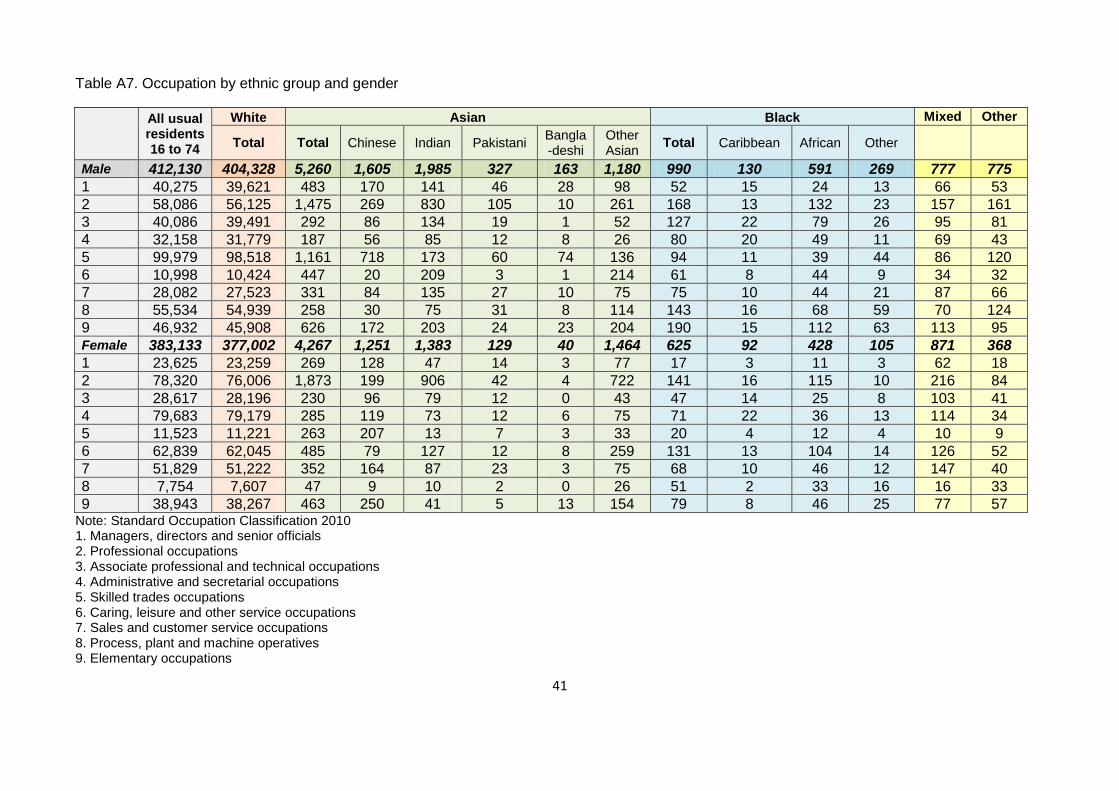
41
Table A7. Occupation by ethnic group and gender
All usual residents 16 to 74
White Asian Black Mixed Other
Total Total Chinese Indian Pakistani Bangla-deshi
Other Asian
Total Caribbean African Other
Male 412,130 404,328 5,260 1,605 1,985 327 163 1,180 990 130 591 269 777 775
1 40,275 39,621 483 170 141 46 28 98 52 15 24 13 66 53
2 58,086 56,125 1,475 269 830 105 10 261 168 13 132 23 157 161
3 40,086 39,491 292 86 134 19 1 52 127 22 79 26 95 81
4 32,158 31,779 187 56 85 12 8 26 80 20 49 11 69 43
5 99,979 98,518 1,161 718 173 60 74 136 94 11 39 44 86 120
6 10,998 10,424 447 20 209 3 1 214 61 8 44 9 34 32
7 28,082 27,523 331 84 135 27 10 75 75 10 44 21 87 66
8 55,534 54,939 258 30 75 31 8 114 143 16 68 59 70 124
9 46,932 45,908 626 172 203 24 23 204 190 15 112 63 113 95 Female 383,133 377,002 4,267 1,251 1,383 129 40 1,464 625 92 428 105 871 368
1 23,625 23,259 269 128 47 14 3 77 17 3 11 3 62 18
2 78,320 76,006 1,873 199 906 42 4 722 141 16 115 10 216 84
3 28,617 28,196 230 96 79 12 0 43 47 14 25 8 103 41
4 79,683 79,179 285 119 73 12 6 75 71 22 36 13 114 34
5 11,523 11,221 263 207 13 7 3 33 20 4 12 4 10 9
6 62,839 62,045 485 79 127 12 8 259 131 13 104 14 126 52
7 51,829 51,222 352 164 87 23 3 75 68 10 46 12 147 40
8 7,754 7,607 47 9 10 2 0 26 51 2 33 16 16 33
9 38,943 38,267 463 250 41 5 13 154 79 8 46 25 77 57 Note: Standard Occupation Classification 2010 1. Managers, directors and senior officials 2. Professional occupations 3. Associate professional and technical occupations 4. Administrative and secretarial occupations 5. Skilled trades occupations 6. Caring, leisure and other service occupations 7. Sales and customer service occupations 8. Process, plant and machine operatives 9. Elementary occupations
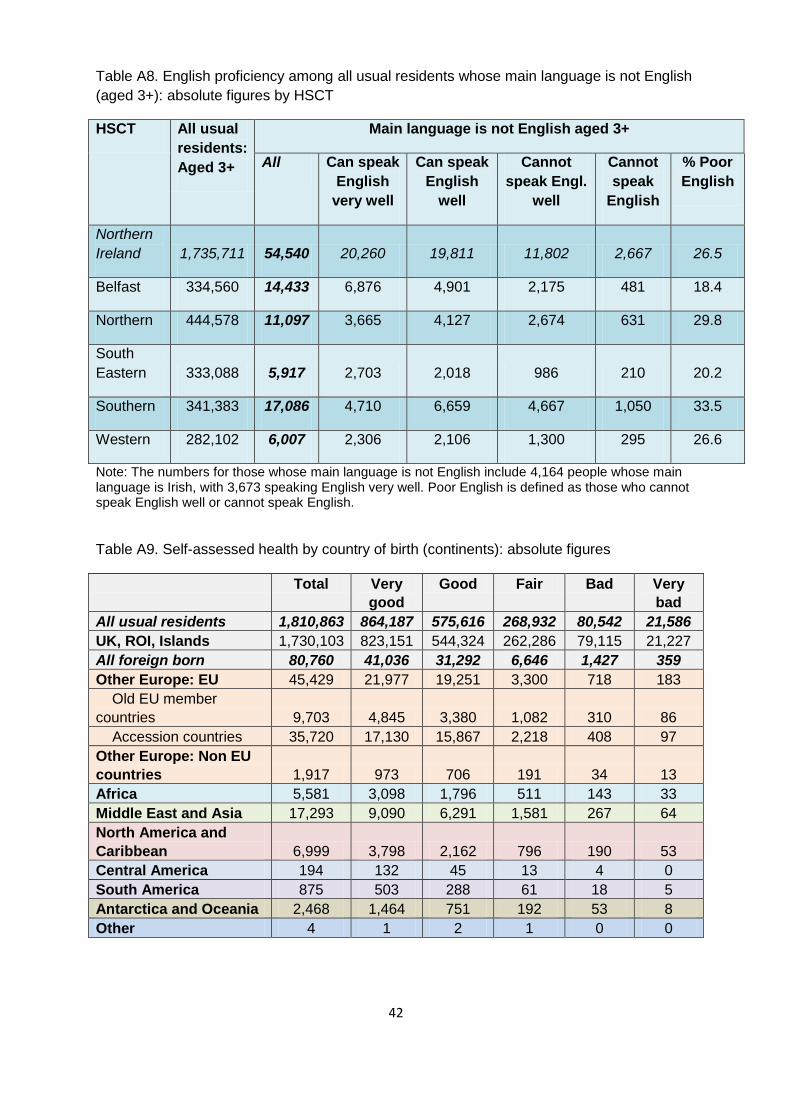
42
Table A8. English proficiency among all usual residents whose main language is not English
(aged 3+): absolute figures by HSCT
HSCT All usual
residents:
Aged 3+
Main language is not English aged 3+
All Can speak
English
very well
Can speak
English
well
Cannot
speak Engl.
well
Cannot
speak
English
% Poor
English
Northern
Ireland 1,735,711 54,540 20,260 19,811 11,802 2,667 26.5
Belfast 334,560 14,433 6,876 4,901 2,175 481 18.4
Northern 444,578 11,097 3,665 4,127 2,674 631 29.8
South
Eastern 333,088 5,917 2,703 2,018 986 210 20.2
Southern 341,383 17,086 4,710 6,659 4,667 1,050 33.5
Western 282,102 6,007 2,306 2,106 1,300 295 26.6
Note: The numbers for those whose main language is not English include 4,164 people whose main language is Irish, with 3,673 speaking English very well. Poor English is defined as those who cannot speak English well or cannot speak English.
Table A9. Self-assessed health by country of birth (continents): absolute figures
Total Very
good
Good Fair Bad Very
bad
All usual residents 1,810,863 864,187 575,616 268,932 80,542 21,586
UK, ROI, Islands 1,730,103 823,151 544,324 262,286 79,115 21,227
All foreign born 80,760 41,036 31,292 6,646 1,427 359
Other Europe: EU 45,429 21,977 19,251 3,300 718 183
Old EU member
countries 9,703 4,845 3,380 1,082 310 86
Accession countries 35,720 17,130 15,867 2,218 408 97
Other Europe: Non EU
countries 1,917 973 706 191 34 13
Africa 5,581 3,098 1,796 511 143 33
Middle East and Asia 17,293 9,090 6,291 1,581 267 64
North America and
Caribbean 6,999 3,798 2,162 796 190 53
Central America 194 132 45 13 4 0
South America 875 503 288 61 18 5
Antarctica and Oceania 2,468 1,464 751 192 53 8
Other 4 1 2 1 0 0
43
Appendix 2
Explanation of highest level of qualification 1. No qualifications: No academic or professional qualifications. 2. Level 1: 1-4 O Levels/CSE/GCSEs (any grades), Entry Level, Foundation Diploma, NVQ level 1, Foundation GNVQ, Basic/Essential Skills. 3. Level 2: 5+ O Level (Passes)/CSEs (Grade 1)/GCSEs (Grades A*-C), School Certificate, 1 A Level/ 2-3 AS Levels/VCEs, Intermediate/Higher Diploma, Intermediate Diploma, NVQ level 2, Intermediate GNVQ, City and Guilds Craft, BTEC First/General Diploma, RSA Diploma. 4. Level 3: 2+ A Levels/VCEs, 4+ AS Levels, Higher School Certificate, Progression/Advanced Diploma, NVQ Level 3; Advanced GNVQ, City and Guilds Advanced Craft, ONC, OND, BTEC National, RSA Advanced Diploma. 5. Level 4+: Degree (for example BA, BSc), Higher Degree (for example MA, PhD, PGCE), NVQ Level 4-5, HNC, HND, RSA Higher Diploma, BTEC Higher level, Foundation degree, Professional qualifications (for example teaching, nursing, accountancy). 6. Other qualifications: Vocational/Work-related Qualifications, Qualifications gained outside the UK (Not stated/ level unknown). This briefing has been produced by Health Intelligence for the use of Public Health Agency
staff. If you would like further information, please contact:
[email protected] or phone 028 90311611