
Policing Minister’s Assessment of Minority Ethnic...
26
Policing Minister’s Assessment of Minority Ethnic Recruitment, Retention and Progression in the Police Service A Paper for the Home Secretary 20 November 2008
-
Upload
doankhuong -
Category
Documents
-
view
218 -
download
1
Transcript of Policing Minister’s Assessment of Minority Ethnic...

Policing Minister’s Assessment of Minority Ethnic Recruitment, Retention and Progression in the Police ServiceA Paper for the Home Secretary20 November 2008


Policing Minister’s Assessment of Minority Ethnic Recruitment, Retention and Progression in the Police Service
1
1.0 Introduction
1.1 You asked me to undertake an assessment of minority ethnic recruitment, retention and progression nationally across the police service. You suggested that the assessment should be done in conjunction with key policing partners.
1.2 In general the police service has come a long way since the Stephen Lawrence Inquiry report (1999) by Sir William MacPherson and the Secret Policeman Programme (2003) which led to an investigation by the former Commission for Racial Equality1 (CRE).
Over the years we have seen positive changes in relation to race equality which have also benefited other equality strands. The positive changes have been due to the commitment of many officers and staff including minority staff support associations and prominent community members such as Doreen Lawrence and other independent Chairs of the Post Lawrence Project Groups.
1.3 It is important to highlight that we are not starting from “point zero” on equality. A lot has been achieved, particularly in terms of improving equality in service delivery, such as improvement in how the service liaises with families of victims of murder, and improved consultation with local communities. Results from the British Crime Survey (BCS 2007/08) show that confidence in the police has risen in minority ethnic communities. Indeed, most minority ethnic groups now have higher confidence that their police are doing a good job than white communities (59% and 52% of people from non-white and white ethnic groups respectively had a high level of confidence in their local police).
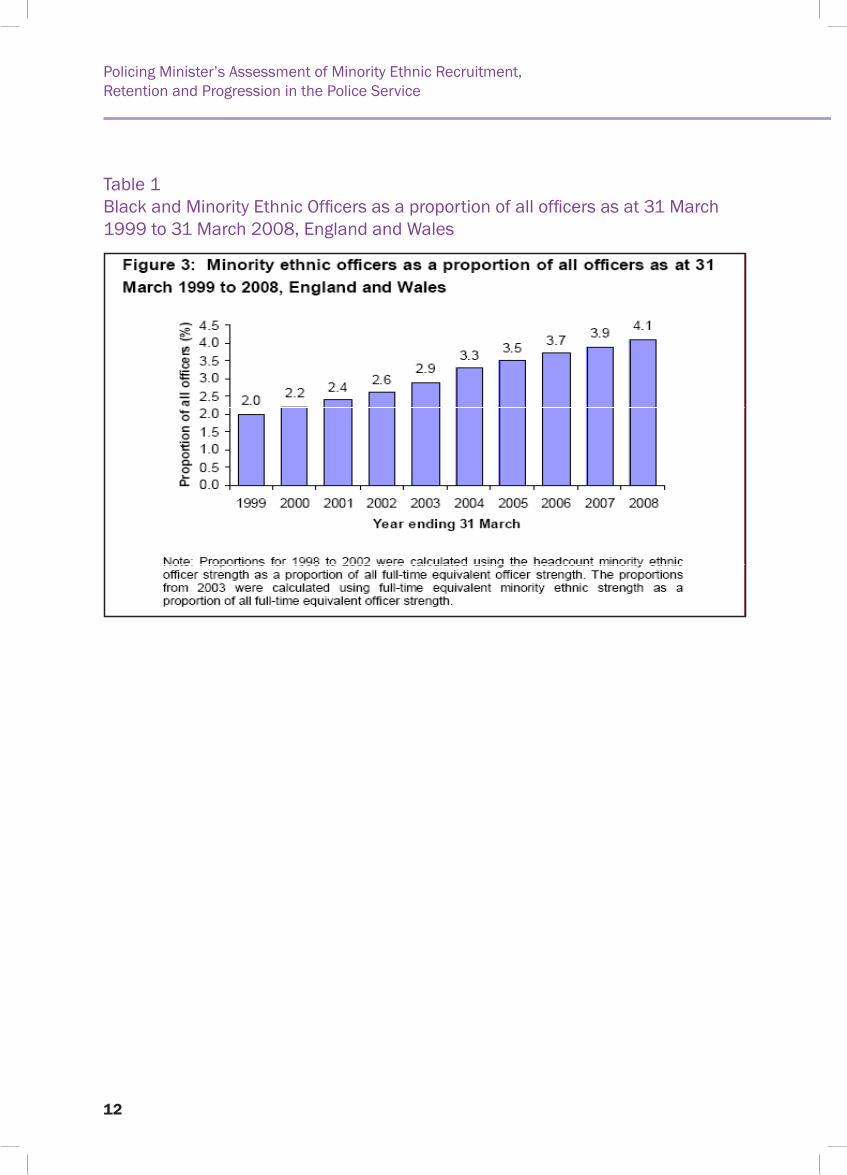
1.4 Within the service there has been significant success in increasing overall minority ethnic representation. For example, there has been a doubling of representation of minority ethnic officers since 1999 (from 2.0% to 4.1%). Another important and marked improvement is in eliminating overt racist language among individual officers resulting in the general removal of racist language from the police service. However, we must listen to the continued calls for improvement especially from those who are affected by “inequality” and recognise a lot still needs to be done.
1.5 The assessment of minority ethnic recruitment, retention and progression has been both helpful and timely in a number of ways. First in the sense it provided a focus on gathering the evidence needed to address the race issues highlighted in the media and the concerns expressed by a number of the minority ethnic representatives that I met during my assessment meetings. Second it is timely, in that the overall ten-year target period for Race Equality Employment targets (introduced by the then Home Secretary, Jack Straw in 1999) comes to an end in 2009. Our Green Paper proposals set out a shift in the current approach to national target setting and performance management generally.
1 The Equality and Human Rights Commission (EHRC) replaced the previous commissions: the Commission for Racial Equality, the Equal Opportunities Commission and the Disability Rights Commission.
Policing Minister’s Assessment of Minority Ethnic Recruitment, Retention and Progression in the Police Service
2
1.6 The Green Paper outlines our vision to have “A police service that has the trust and confidence of all communities and a service that reflects the communities it serves”. We have taken a robust approach to ensure that there is local ownership and accountability. Our approach is based on a partnership between local police authorities, police forces and our diverse communities.
1.7 As you are aware, in the future, there will only be one top down numerical target for forces relating to public confidence, which means there will no longer be a national race employment target set by the Home Office. Section five sets out the process for this change.
1.8 The assessment focuses mainly on police officers. The picture for police staff is better - nationally both minority ethnic police staff strength and recruitment are above the national 7.0% target at 7.4% and 8.1% respectively (Annex A table 7). Minority ethnic Police Community Support Officers accounted for 11.5% of the total number of PCSOs in England and Wales (numbering 1,813). There was an increase of 236 PCSOs (15.0%) in the last 12 months alone. 71.9% of minority ethnic PCSOs (or 1,303) are concentrated in the Metropolitan Police Service.
1.9 Minority ethnic police staff retention is currently better than retention of white police staff, for all but one length of service band (Annex A table 8). It is not possible to assess staff progression as police staff do not have a standardised career path structure and the data is therefore not collected. My focus therefore is on minority ethnic officer recruitment, retention and progression - the current position, the areas for focus, good practice and proposals for a way forward.
1.10 The Government is committed to promoting equality and diversity and this remains a key priority. It is important therefore that we continue to signpost areas for improvement and identify good practice in respect of race and faith, such as research work carried out by the National Association of Muslim Police. I look forward to learning about areas of improvement from a faith perspective. But we must also identify good practice which relates to other diversity strands and continue to work with groups such as the Women in Policing Steering Group and with diversity staff support associations such as the British Association for Women in Policing, the Gay Police Association and the National Disabled Police Association to help build on the good work that these groups already do to help us understand and address issues of inequality.
2.0 Assessment on current position of minority ethnic recruitment, retention and progression
2.1 The assessment is based on Police Service Strength data as at 31 March 2008 and highlights the current position in relation to recruitment, retention and progression of minority ethnic officers.
Representation (Annex A table 1)
2.2 The police service has made steady progress over the last nine years to increase minority ethnic representation in its workforce towards achieving the overall race employment target

Policing Minister’s Assessment of Minority Ethnic Recruitment, Retention and Progression in the Police Service
3
of 7% by 2009. Currently overall minority ethnic representation (strength) stands at 5.6% across the service. The increase of minority ethnic officers to 4.1% represents a doubling in representation, starting from just 2% in 1999.
Recruitment (Annex A table 2)
2.3 Table 2 (Annex A) sets out the national picture on recruitment showing that the minority ethnic officer recruitment rate of 7.2 per cent is just above the national 7.0% target set by the Home Secretary in 1999. However minority ethnic officer strength is well below target at 4.1 per cent.
Assessment of key forces (Annex A Charts 1and 2 (page 20))
2.4 It is important that all forces have balanced representation of minority ethnic officers and staff. However looking nationally at officer numbers, (Annex A Chart 1) four forces are particularly important: the Metropolitan Police Service (MPS); West Midlands; Greater Manchester Police (GMP); and West Yorkshire.
2.5 The low rate of turnover of police officers means that major increases in representation – as are particularly needed to match large minority ethnic populations in the MPS and West Midlands – are very challenging to achieve. The MPS – which needs the biggest rise of all – has done particularly well in raising representation from 3% to 8% over the last nine years. Its recruitment rate of minority ethnic officers is now by some distance the biggest in the country. We need to look at the good practice together with the challenges in these big four and make these a major focus of our work, including gathering and deploying good practice, as part of our communications strategy, and in invitations for police authorities and forces to attend the steering group I propose in my conclusions below.
Retention (Annex A table 3)
2.6 During 2008 the overall retention rate for police officers (total number of officers leaving the service compared to the total officer strength) has remained comparatively low. When compared to typical overall retention in other occupations retention is still strong at 5.5% (also an improvement on last year where the figure was 5.7%).
2.7 The retention target is measured by length of service broken down into specific time bands (0-6 months, 6 months – 2 years, 2-5 years and 5-10 years and over 10 years). The retention target measures the percentage of minority ethnic officers leaving the service through resignation or dismissal each year and compares this with the percentage of white officers leaving under similar circumstances in each of the time bands. Data shows:
National minority ethnic officer retention is currently worse than retention of white officers at • all lengths of service.
The gap is most notable for the officers with less than five years service.•
Separate analysis of retention by forces show that the situation is generally similar across • forces with both high and low minority ethnic officer populations.

Policing Minister’s Assessment of Minority Ethnic Recruitment, Retention and Progression in the Police Service
4
2.8 To help understand the reasons why officers and staff leave the service a standardised national exit interview and questionnaire procedure was introduced early 2006. The first set of available data were analysed last year but the data returns were too incomplete (very few returns from forces and very low numbers) to make generalisations. Data returns this year have improved. Some initial findings relative to police officers are:
Minority ethnic officers leave the service for training and/or career reasons at a rate of more • than double that of their white counterparts (21% as opposed to 9% respectively).
White officers leave the service to take up another job at a rate of more than double that of • their minority ethnic counterparts (30% as opposed to 13% respectively).
2.9 More work needs to be done to look in more detail at: the reasons for leaving; what stage officers and staff leave the service; and what practical interventions can be put in place to retain staff. The HMIC inspection report “Duty Calls” found no evidence of measures to support the achievement of the retention targets beyond the collection of data and ad hoc exit interviews. My proposals to address this are set out in section five.
Progression (Annex A tables 4 and 5)
2.10 The progression targets have been introduced incrementally for different ranks in the period leading up to 2009. Using length of service and rank data provides a more reliable national picture than looking at representation by rank in isolation, since it takes into account the rank that officers with a particular length of service can realistically achieve.
Minority ethnic officer progression is very close to the white officer progression for all length • of service bands assessed.
Evidence on interventions to address barriers to promotion
2.11 An NPIA Rapid Evidence Assessment has to date found no evaluation studies that provide robust evidence on what works in relation to tackling barriers to progression. Furthermore, although there appears to be a reasonable spread of activity to provide support mechanisms for individuals to help them cope with barriers (e.g. mentoring programmes), there is a potential lack of interventions which attempt to remove the organisational and institutional barriers where these exist.
2.12 These emerging findings therefore suggest the need to focus on taking action to tackle any potential organisational and institutional barriers (e.g. any possible lack of line management support for officer career development), accompanied by robust evaluation of the impact of any initiatives.

Policing Minister’s Assessment of Minority Ethnic Recruitment, Retention and Progression in the Police Service
5
3.0 Current work and Good Practice
3.1 From 1 April 2007 the National Policing Improvement Agency (NPIA) took over responsibility for the strategic operational delivery of a representative police workforce. The Home Office continues to support the NPIA and the police service to help maintain the focus needed to strive towards establishing a diverse and representative police service. The assessment shows current work being carried out to improve recruitment, retention and progression of minority ethnic officers and good practice being implemented on a local and national level.
Recruitment
3.2 Work continues with forces to encourage them to use positive action, which is within the scope of current legislation, to support the recruitment, retention and progression of minority ethnic officers and staff in the service. Initiatives vary from force to force but may include targeted advertising, mentoring, familiarisation days, open days and seminars. In addition to this I was also encouraged by some forces that have dedicated outreach posts to help them build sustainable relationships with communities and encourage applications from those groups who are underrepresented in the service.
3.3 In January 2007 the Home Office put in place advice relating to additional recruitment criteria for appointing police officers. The Additional Appointment Criteria encourages forces to consider using additional criteria based on operational need. For example, operationally valuable skills such as proficiency in a second language/ community language and community knowledge or experience as a means of accelerating the appointment of candidates who must first have already passed the national assessment centre. The advice is clear that forces make the case for prioritised appointment or justify prioritisation on the basis of operational need.
3.4 In addition, the Home Office “Breaking Through Action Plan” and the “Positive Action Events Toolkit” which are aimed at improving minority ethnic recruitment in the police service, have been made available to the police service. The policing partners I met have asked for clarity on the difference between ‘positive action’ and ‘positive discrimination’ to confirm which action is legal to use with good practice examples. Some have also asked for guidance on learning the lessons from tribunal cases to help resolve conflict at the earliest possible stage. I have responded positively to these requests at section five.
Retention
3.5 I also acknowledge there has been some good practice and national guidance in relation to strategies and programmes designed to help retain staff within a positive and inclusive working environment. Initiatives include:
The Initial Police Learning and Development Programme• and the Race and the Diversity Learning and Development Programme where race and diversity is embedded throughout the full suite of learning materials and underpinned by a fundamental ‘business case’ that recognises the critical importance of improved and sustained performance in all diversity matters and the internal and external benefits of establishing a culturally diverse workforce.
Policing Minister’s Assessment of Minority Ethnic Recruitment, Retention and Progression in the Police Service
6
The Positive Action Leadership Programme • is designed to encourage staff from under-represented groups to stay in the Police Service and to apply for development opportunities and progression.
3.6 I was also pleased to hear about recent initiatives such as the British Transport Police (BTP) Step-UP short-term experience programme that enables BTP to tailor personal and professional development opportunities for officers and staff including those from under-represented groups.
3.7 Local and National Support Associations. I have heard that a considerable amount of very good work is being carried out by local Black and Muslim Staff Support Associations across the country. These organisations often play an important part in supporting minority ethnic officers in resolving sensitive issues within their forces.
3.8 The National Diversity Staff Support Associations, the Police Federation and the Police Superintendents’ Association, have also played an important part in dealing with retention issues through their participation in equality impact assessment meetings and as our “critical friends” when we and our policing partners are developing policies. I was encouraged by the positive relationship between the National Association of Muslim Police and Black and Minority Superintendents’ Network and our policing partners. In return there has been a constructive dialogue taking place that influences a supportive culture within the forces and at ACPO level.
3.9 I welcome the police authorities and forces recognising the importance of Independent Advisory Groups (IAGs) and the role they play in assisting to tackle issues around recruitment, retention and progression. I was pleased to hear that the majority of local forces and police authorities have set-up and support local IAGs. Local IAGs recently came together to establish a National Independent Advisory Group structured to be able to have an input in national policy development.
Progression
3.10 With regards to progression a number of national initiatives have been put in place to increase leadership capacity at all levels of the service including:
The High Potential Development Scheme (HPDS) - a national leadership development • scheme for the police service. The scheme, which has been revised and re-launched, aims to attract a cadre of individuals who will undertake a focused and structured programme which equips them with the skills to be future police leaders. It provides a structured development opportunity to a small number of high potential constables and sergeants, including access to an accelerated promotion pathway.
The National Senior Careers Advisory Service (NSCAS) - a career development service • specifically designed to support senior officers and staff operating at Superintendent level and above. The primary goal of NSCAS is to enhance leadership capacity and capability to ensure that there is a sufficiently large pool of officers and staff able to meet the growing leadership challenges at the top of the service.

Policing Minister’s Assessment of Minority Ethnic Recruitment, Retention and Progression in the Police Service
7
3.11 We are also proposing to introduce a graduate fast track scheme. Diversity Staff Support Associations would like to see initiatives become more effective to help minority ethnic officers to progress in the police service.
Discipline and Misconduct
3.12 There has been concern from some quarters on the question of whether minority ethnic officers are subject to formal investigation and the disciplinary procedure more than their white colleagues.
3.13 Following recommendations from the former CRE and Morris inquiries the Home Office has developed: a new Code of Ethics known as the Standards of Professional Behaviour to be introduced on 1st December 2008 with specific reference to unlawful or unfair discrimination; and new police officer disciplinary and unsatisfactory performance procedures, based on the ACAS Code of Practice on Disciplinary and Grievance Procedures. These new procedures will also be introduced on 1st December 2008. We will want to look at any issues of disproportionality under the new improved arrangements and the Ministerial Steering Group set out in section five can look at such issues
3.14 A summary of further achievements is attached at Annex C.
4.0 Issues for focus
4.1 Relatively more minority ethnic officers than white officers are leaving within five years of joining the police service. This is a concern which I have addressed in sections 2 and 5.
4.2 Positive Action and Positive Discrimination. As I have highlighted in section three, there is still some confusion and a lack of understanding between positive action and positive discrimination in relation to recruitment, retention and progression. Positive action is acceptable under current race and sex discrimination legislation allowing police forces to develop under-represented officers. Positive discrimination however is not permitted under current legislation. Therefore, recruiting or promoting minority ethnic officers over white officers due to their colour, or background would be unlawful.
4.3 Lack of confidence around selection for senior posts. A number of minority ethnic officers feel that the pre-coaching carried out for some posts disadvantages minority ethnic officers who may wish to apply for a position. This may also discourage some members of minority ethnic communities from applying to the police service in the first place.
4.4 Specialist Roles. National representation of minority ethnic officers in specialist roles is slightly lower than that of white officers. However, perceptions from stakeholders, particularly diversity staff support associations is that under-representation in specialist roles is a matter of concern; a point that has also been highlighted in some of the assessment meetings.
4.5 The HIMC inspection report “Duty Calls” highlighted that most forces had processes for promotion and selection to specialist posts. However, these could be improved with more content and more focus on progression of minority ethnic officers and that some specialist posts were not always subject to the rigours of advertising and open selection processes.

Policing Minister’s Assessment of Minority Ethnic Recruitment, Retention and Progression in the Police Service
8
4.6 Senior Police National Assessment Centre (SPNAC). SPNAC is the process to select the future chief officers of the service. Superintendents and Chief Superintendents who aspire to chief officer rank are eligible to apply. It has been disappointing that only two minority ethnic officers have passed SPNAC in the last four years (both in 2007). A perception of minority ethnic officers is that their white colleagues have an easier journey to obtain their Chief Constable’s support or endorsement to progress to SPNAC. In order for the numbers of minority ethnic officers reaching chief officer rank to be representative of the population of England and Wales, the proportion of minority ethnic officers coming forward to SPNAC and being successful needs to be higher than that for white applicants. (Along the lines achieved by female, as compared to male, applicants in recent years). We will consider these issues in the work being undertaken through the leadership strategy on chief officer development, selection and appointment.
4.7 Race Employment Targets. I understand that the race employment targets have not been popular with all of the representatives that I met for this assessment (although the National Black Police Association (NBPA), the National Association of Muslim Police (NAMP) and the Independent Post Lawrence Group Chairs are supportive of national and local targets). The targets have and do provide confidence and assurance to members of visible minority communities. The Equality and Human Rights Commission has also requested we maintain a national target for the police service. I believe setting local targets in conjunction with local communities is the best way forward to gain local ownership from forces and local communities.
4.8 Her Majesty’s Inspectorate of Constabulary inspection report “Duty Calls” reported recruitment of minority ethnic staff was being taken seriously with good examples of positive action. However, forces inspected were some way off achieving their targets and individual examples of noteworthy good practice needed to be converted into a consistent, corporate approach. Attention was required to progression, training of supervisors and specialists, analysis of data and follow up action, and independent scrutiny of HR processes.
5.0 Proposals for way forward
5.1 As I mentioned in my introduction we are not starting from “point zero” but building on the good work that forces are already doing. Section four identifies some areas of concern which need to be addressed. This section sets out how we can take this forward through the proposals set out below.
5.2 Establish a Ministerial Steering Group. I will establish and chair a steering group. This group will have oversight of issues around recruitment, retention and progression. Initial membership will include the independent chairs of the Post Lawrence Project Groups and key policing partners such as the Police Federation, Diversity Staff Support Associations, the Police Superintendents’ Association, the Association of Chief Police Officers, Association of Police Authorities and the National Policing Improvement Agency. The aim will be to bring together leaders from policing partners and independent community members to oversee the progress of the proposals in this paper. The group will also have an opportunity of inviting local police chief constables and police authority members to share good practice as well as encourage those that need to improve within this area. The group will be reviewed after six months because we want to quickly achieve and maintain additional impetus.
Policing Minister’s Assessment of Minority Ethnic Recruitment, Retention and Progression in the Police Service
9
5.3 The Three - Year Equality, Diversity and Human Rights Strategy. This is a key initiative highlighted in the Policing Green Paper. The strategy is being developed jointly with ACPO and APA with support by NPIA and HMIC. This overarching strategy will underpin key programmes of work and will be instrumental in helping to address the issues highlighted in this assessment. All of our key policing partners have responded positively to the proposed strategy and the work that it will drive forward. There is no single initiative or answer to improve minority ethnic recruitment, retention and progression within the police service. However, I believe the following initiatives will play a positive part in moving the agenda forward.
a) Equality standards for policing. The equality standards are a key component of the strategy. The aim of these standards (currently being developed by the NPIA), will be to assist the service to continue to improve performance and mainstream activity on equality and diversity.
b) Local Targets. The Green Paper asked whether equality standards should include local decisions on the setting of local targets, for example on minority ethnic recruitment, retention and progression on race. ACPO and the APA have welcomed this as have other stakeholders. However, our equality impact assessment on the Green Paper indicates some community stakeholders are worried about the end of national targets. In keeping with our approach on increasing local responsibility, ambitious targets should be selected and set on the most important issues locally. The police authority would set the targets, which should be agreed with the force, and the target setting process must involve police officers, police staff and local communities. As the Green Paper proposes, national oversight would be maintained in particular via the HMIC 2010 workforce inspection’s coverage of equality standards. We should also emphasise nationally the importance we place on ambitious, realistic and consultative target setting.
c) Local Recruitment, Retention and Progression Improvement Plans. Helping forces that need support is going to be the key in taking the recruitment, retention and progression agenda forward. The Steering Group will have further discussions to see how best to help local forces improve. Improvement plans could include initiatives such as:
Recruitment “Buddy”.• System for probationers and informal support from local staff associations and colleagues within the force.
Progression Mentoring. • Each force would have a positive action initiative whereby Sergeants, Chief Inspectors, Superintendents and ACPO ranks provide the opportunity to adopt minority ethnic officers to mentor. This would link to the NPIA People Strategy in developing officers to understand key roles.
Attachment schemes. • These would provide the opportunity for minority ethnic officers to work in specialist roles for a minimal period to develop their experience within different areas. These roles should also include finance, Professional Standards etc.
d) Tripartite Oversight Group on retention and progression and minority ethnic career tracking. I also welcome ACPO work on a retention and progression action plan supported by NPIA and linked to the National Leadership Strategy, approved by the National Policing Board. This includes setting up a Tripartite Oversight Group to oversee the progress and development of minority ethnic chief inspectors and superintendents. The action plan will include two

Policing Minister’s Assessment of Minority Ethnic Recruitment, Retention and Progression in the Police Service
10
key initiatives. The first will be the extension of the National Careers Advisory Service to include minority ethnic chief inspectors and above as we have already outlined in the Green Paper. The second is the creation of a national career development which would encourage talent management throughout the service but in particular track the careers of minority ethnic officers and act as a base where they could seek advice on courses and secondment opportunities.
e) Positive Action Good Practice Guidance. The NPIA should develop in partnership with HO, ACPO, APA and in conjunction with the Equality and Human Rights Commission “Positive Action Good Practice” guidance on recruitment, retention and progression for the police service. This should also take into account the forthcoming extended positive action proposals in the single Equality Bill. There should also be an input from partners such as: the Police Federation, the Diversity Staff Support Associations and Superintendents’ Association.
f) Learning the lessons guidance. It would be helpful to update and circulate to forces the existing guidance “Learning the Lessons from Employment Tribunals” (published in 2004). This guidance is aimed at resolving workplace disputes at the earliest opportunity and highlights the role that Police Authorities, various support associations including the Police Federation and Unison can play in resolving cases. It recommends resolution not confrontation and promotes the sharing of lessons learned and links these to a wider impact on the service.
g) The Senior Police National Assessment Centre. We will consider the issues highlighted around the process of obtaining Chief Constable’s support or endorsement to progress to SPNAC in taking forward police leadership strategy work on chief officer development, selection, and appointment. In my meetings with the NPIA some helpful suggestions have been made which I am keen to explore further through the Ministerial Steering Group.
h) Minority ethnic progression. All work on police promotion and leadership development needs to address issues around minority ethnic progression, for example through the proposed National College of Police Leadership. This applies to progression at all levels of the police service, not just to chief officer ranks.
i) National Exit Interview Data. We also need to examine further the reasons for leaving data from forces’ Annual Data Returns (ADR). We shall look at how it can be improved and lessons learned.
j) Targeted Recruitment Campaign. I will be asking the NPIA to consider exploring possibilities for a targeted recruitment campaign and working with volunteer local forces that need support in attracting people from minority ethnic communities.
k) Communication Strategy. This will include regional force visits by me and members of the Ministerial Steering Group to meet with officers and community representatives to promote our vision for a police service that has trust and confidence of all communities and a service that reflects the communities it serves. In addition to this I am also keen to hold a Recruitment, Retention and Progression Conference in 2009. The conference will bring together policing partners to promote the progress made on this paper and share good practice. The conference could be an opportunity to launch the Learning the Lessons and the Positive Action, Good Practice guidance.

Policing Minister’s Assessment of Minority Ethnic Recruitment, Retention and Progression in the Police Service
11
Annex A
ASSESSMENT STATISTICS
Assessment on current position of black and minority ethnic (BME) recruitment, retention and progression (The following is based on unpublished figures from Home Secretary’s Race Employment Target Report for 2007/8).
Notes
1. Data taken from Home Office Statistical Bulletin (HOSB) 08/08 “Police Service Strength, England and Wales, 31 March 2008”, available online from http://www.homeoffice.gov.uk/rds/pdfs08/hosb0808.pdf.
2. Data are based on full-time equivalent figures that have been rounded to the nearest whole number. Because of rounding there may be an apparent discrepancy between totals and the sums of constituent items.
3. Whilst strength data are identified separately in HOSB 08/08, data on recruitment, retention and progression have not been previously published in this format, and are based on aggregated totals given in HOSB 08/08.
4. This summary includes figures from the Home Secretary’s Race Employment Targets Report and outlines progress against the race employment targets for 2008.
5. Some rates (in per cent) should be treated with caution due to very low numbers of officers, most notably recruitment figures for smaller forces, and progression figures for higher ranks. For example, for smaller forces the recruitment rate would be increased considerably should a single additional BME officer be recruited.
Table 1 below shows how the proportion of BME officers in the police service has increased over the last ten years. The number of BME officers increased by 273 (5 per cent) in the twelve months to 31 March 2008. In the nine year period depicted in the graph (1999 to 2008), the proportion of BME officers in the service has more than doubled.
Policing Minister’s Assessment of Minority Ethnic Recruitment, Retention and Progression in the Police Service
12
Table 1 Black and Minority Ethnic Officers as a proportion of all officers as at 31 March 1999 to 31 March 2008, England and Wales

Policing Minister’s Assessment of Minority Ethnic Recruitment, Retention and Progression in the Police Service
13
RECRUITMENT – table 2 below
The assessment on recruitment. • The national picture shows that the BME officer recruitment rate of 7.2 per cent is just above the national 7.0% target set by the Home Secretary in 1999. However BME officer strength is well below target at 4.1 per cent.
Given that turnover rates amongst police officers are generally very low, recruitment within • police forces in the future will need to reflect or exceed the economically active BME population for significant progress to be achieved. This is particularly so for the four major forces Metropolitan Police Service (MPS), West Midlands, Greater Manchester Police (GMP), and West Yorkshire who have the largest black and minority ethnic populations.

Policing Minister’s Assessment of Minority Ethnic Recruitment, Retention and Progression in the Police Service
14
Recruitment – table 2 Table 2 below shows both recruitment and overall strength figures for 2007/08:
2008 2008 2008 2008Force Name TARGET TOTAL BME BME % TOTAL BME BME %Avon & Somerset 2% 3,407 51 1.5% 167 2 1.2%Bedfordshire 10% 1,207 71 5.8% 94 10 10.7%Cambridgeshire 4% 1,379 31 2.2% 67 0 0.0%Cheshire 1% 2,181 22 1.0% 46 1 2.2%Cleveland 1% 1,692 25 1.5% 45 2 4.4%Cumbria 1% 1,246 12 1.0% 42 1 2.4%Derbyshire 3% 2,095 75 3.6% 143 6 4.2%Devon & Cornwall 1% 3,529 28 0.8% 118 2 1.7%Dorset 1% 1,518 15 1.0% 52 0 0.0%Durham 1% 1,632 27 1.6% 26 0 0.0%Essex 2% 3,385 78 2.3% 247 11 4.4%Gloucestershire 1% 1,353 22 1.6% 77 0 0.0%Greater Manchester 7% 8,034 334 4.2% 442 23 5.2%Hampshire 2% 3,912 85 2.2% 240 4 1.7%Hertfordshire 5% 2,162 64 3.0% 111 12 10.8%Humberside 1% 2,243 23 1.0% 107 0 0.0%Kent 2% 3,718 91 2.4% 179 23 12.8%Lancashire 5% 3,675 107 2.9% 182 10 5.5%Leicestershire 11% 2,241 137 6.1% 107 13 12.2%Lincolnshire 1% 1,201 17 1.4% 37 0 0.0%London, City of 10% 830 44 5.3% 28 1 3.6%Merseyside 2% 4,477 127 2.8% 211 6 2.8%Metropolitan Police 25% 31,460 2,594 8.2% 1,114 199 17.9%Norfolk 1% 1,578 19 1.2% 59 2 3.4%Northamptonshire 3% 1,309 52 4.0% 85 5 5.9%Northumbria 2% 3,983 54 1.4% 172 1 0.6%North Yorkshire 1% 1,581 18 1.1% 0 0 0.0%Nottinghamshire 4% 2,369 76 3.2% 52 3 5.8%South Yorkshire 3% 3,201 95 3.0% 92 4 4.3%Staffordshire 2% 2,269 42 1.9% 49 4 8.2%Suffolk 1% 1,319 25 1.9% 16 1 6.3%Surrey 4% 1,944 68 3.5% 125 12 9.6%Sussex 3% 3,075 44 1.4% 238 2 0.8%Thames Valley 5% 4,186 156 3.7% 263 18 6.8%Warwickshire 4% 1,036 40 3.9% 2 0 0.0%West Mercia 2% 2,486 38 1.5% 130 1 0.8%West Midlands 16% 8,412 624 7.4% 516 49 9.5%West Yorkshire 9% 5,822 246 4.2% 383 23 6.0%Wiltshire 1% 1,210 17 1.4% 61 2 3.3%Dyfed-Powys 1% 1,194 9 0.8% 53 0 0.0%Gwent 1% 1,487 22 1.5% 62 0 0.0%North Wales 1% 1,579 7 0.4% 50 2 4.0%South Wales 2% 3,244 62 1.9% 69 2 2.9%
7% 141,859 5,793 4.1% 6,357 457 7.2%
Number of forces meeting target (out of 43) 20 23Percentage of forces meeting target 47% 53%
Police Officer Strength Police Officer Recruitment

Policing Minister’s Assessment of Minority Ethnic Recruitment, Retention and Progression in the Police Service
15
RETENTION - table 3
Key messages
The assessment on national retention shows that BME officer retention is currently worse • than retention of white officers at all lengths of service.
The gap is most notable for BME officers with less than five years service.•
Separate analysis of retention by force shows that the situation is generally similar across • forces with both high and low BME officer populations.
Retention – table 3
Table 3 below shows retention figures (i.e. officers resigning from the service or dismissed) for both 2006/07 and 2007/08:
2006/07 2007/08 2006/07 2007/08 2006/07 2007/08 2006/07 2007/08 2006/07 2007/08 2006/07 2007/08Less than 6 months 16 9 261 255 6.1% 3.5% 109 88 3,521 2,783 3.1% 3.2%6 months to 2 years 37 37 557 621 6.6% 6.0% 509 431 9,004 8,364 5.7% 5.2%2 years to 5 years 46 57 1,629 1,443 2.8% 4.0% 529 447 25,441 21,395 2.1% 2.1%5 years to 10 years 21 26 1,033 1,338 2.0% 1.9% 355 417 24,467 28,019 1.5% 1.5%10 years and over 15 22 2,028 2,175 0.7% 1.0% 660 717 75,126 73,144 0.9% 1.0%Sum: 135 151 5,508 5,832 2.5% 2.6% 2162 2100 137,559 133,705 1.6% 1.6%
Number of Staff Percentage
White WhiteAll minority ethnic
All minority ethnic
All minority ethnic White
Number of Leavers Number of Staff Percentage Number of
Leavers
PROGRESSION
Representation by Rank – Table 4
Table 4 below shows BME representation by rank for 2007/08:
Rank BME %BME TOTALConstable 4,823 4.4% 108,884Sergeant 676 3.0% 22,240Inspector 188 2.6% 7,169
Ch Inspector 58 3.1% 1,869Superintendent 31 3.1% 1,014
Ch Superintendent 11 2.3% 484ACPO 7 3.5% 202TOTAL 5,793 4.1% 141,859
2008

Policing Minister’s Assessment of Minority Ethnic Recruitment, Retention and Progression in the Police Service
16
Table 5 below shows BME progression for 2007/08 split into length of service bands for England & Wales.
Progression table 5
R ank Length of Service
All minority ethnic White All minority
ethnic White All minority ethnic White All minority
ethnic White
TOTAL 5 to 10 yrs 1,338 28,019 643 6,603 327 6,469 368 14,947Sergeant or Above 5 to 10 yrs 136 2,958 55 707 34 565 47 1,686% Sergeant or Above 5 to 10 yrs 10.2% 10.6% 8.6% 10.7% 10.4% 8.7% 12.8% 11.3%
TOTAL 10 yrs + 2,175 73,144 806 16,176 645 18,288 724 38,680Sergeant or Above 10 yrs + 816 27,934 288 6,997 246 6,233 282 14,704% Sergeant or Above 10 yrs + 37.5% 38.2% 35.7% 43.3% 38.1% 34.1% 39.0% 38.0%
TOTAL 5 to 15 yrs 2,057 47,229 931 10,169 551 11,769 575 25,291Ins pector or Above 5 to 15 yrs 48 1,167 9 150 23 308 16 709% Ins pector or Above 5 to 15 yrs 2.3% 2.5% 1.0% 1.5% 4.2% 2.6% 2.8% 2.8%
TOTAL 15 yrs + 1,456 53,934 518 12,610 421 12,988 517 28,336Ins pector or Above 15 yrs + 240 8,910 87 2,232 57 1,929 96 4,749% Ins pector or Above 15 yrs + 16.5% 16.5% 16.8% 17.7% 13.5% 14.9% 18.6% 16.8%
TOTAL 10 to 15 yrs 719 19,210 288 3,566 224 5,300 207 10,344C hief Ins pector or Above 10 to 15 yrs 7 184 0 17 5 48 2 119% C hief Ins pector or Above 10 to 15 yrs 1.0% 1.0% 0.0% 0.5% 2.2% 0.9% 1.0% 1.2%
TOTAL 15 yrs + 1,456 53,934 518 12,610 421 12,988 517 28,336C hief Ins pector or Above 15 yrs + 93 3,113 28 723 21 631 44 1,759% C hief Ins pector or Above 15 yrs + 6.4% 5.8% 5.4% 5.7% 5.0% 4.9% 8.5% 6.2%
TOTAL 10 to 20 yrs 1,413 38,418 506 7,285 431 9,935 476 21,198S uperintendent or Above 10 to 20 yrs 5 207 1 20 4 57 0 130% S uperintendent or Above 10 to 20 yrs 0.4% 0.5% 0.2% 0.3% 0.9% 0.6% 0.0% 0.6%
TOTAL 20 yrs + 762 34,726 300 8,891 214 8,353 248 17,482S uperintendent or Above 20 yrs + 41 1,350 9 304 9 282 23 764% S uperintendent or Above 20 yrs + 5.4% 3.9% 3.0% 3.4% 4.2% 3.4% 9.3% 4.4%
E ngland And W alesMetropolitan P olice
S ervice (MP S )Metropolitan F orces not including MP S 1
All Other Non-Metropoltan F orces 1
1. The eight Metropolitan forces are Greater Manchester, City of London, Merseyside, Metropolitan Police, Northumbria, South Yorkshire, West Midlands and West Yorkshire.
Assessing BME progression without considering length of service (table 4) suggests that BME progression is much slower than white progression. However, this is misleading. Increases in BME recruitment in recent years mean that only 37% of BME officers have more than 10 years’ service, compared to 55% of white officers. Therefore, assessment of progression including length of service gives a more reliable picture (table 5).
The table separates out the position for some of the bigger forces: to some extent the relative position on progression in the MPS will be influenced by its steep increase in BME recruitment (even within a given length of service band, BME officers on average have shorter service than white officers). The MPS has made significant progress in recent years in raising the number of BME officers in Superintending, Inspector and Sergeant ranks, but recognises that there is opportunity for further improvement.

Policing Minister’s Assessment of Minority Ethnic Recruitment, Retention and Progression in the Police Service
17
Key messages
Minority ethnic officer progression is very close to the white officer progression for all length • of service bands assessed.
Specialist posts –table 6
Table 6 below shows representation within specialist functions for 2007/08: (Please note that this is a suggested list of specialist roles drawn up by the Home Office)
Totals 42,171 1,459 3.5% -0.2% -105
Specialist Functions
Number of specialist officers
Number of BME
specialist officers
BME specialist
officer proportion
Difference from overall
BME proportion
Difference from expected BME specialist
numbersCID 17,632 673 4% 0% 19
Traffic 6,299 102 2% -2% -132Child/Sex/Domestic 4,560 208 5% 1% 39
Special Branch/ Protection/ Immigration/ Nationality 4,289 214 5% 1% 54
Firearms - Tactical 2,569 48 2% -2% -47Dogs 1,517 17 1% -3% -39
Surveillance Unit 1,225 39 3% -1% -6CID Aides/Trainee
Investigators 889 56 6% 3% 23Complaints and Discipline 851 30 4% 0% -1
Fraud 788 40 5% 1% 11Drugs 515 17 3% 0% -2
Mounted 340 4 1% -3% -9Air 281 0 0% -4% -10
Asset confiscation 159 8 5% 1% 2Vice 99 3 3% -1% -1
Marine 94 0 0% -4% -3Underwater 65 0 0% -4% -2
Note: The comparison to the overall BME proportion and expected numbers are based on officers with >3 years service, since any less experienced officers are highly unlikely to be in specialist posts. Therefore the BME proportion for specialist posts overall is 3.7% (but currently stands at 3.5%). Table 6 therefore benchmarks against 3.7%.

Policing Minister’s Assessment of Minority Ethnic Recruitment, Retention and Progression in the Police Service
18
Key messages:
National BME representation within specialist roles is slightly lower than for other officers•
Performance varies substantially between different specialist roles. For some roles, BME • representation is higher than expected. The roles with the largest under-representation of BME officers are:
Traffic•
Firearms – tactical•
Dogs•
Notes and caveats
This summary includes draft and as yet unpublished figures from the Home Secretary’s • Employment Targets report for 2008.
Some figures should be treated with caution due to very low sample sizes – especially • recruitment figures for smaller forces, and progression figures for higher ranks.

Policing Minister’s Assessment of Minority Ethnic Recruitment, Retention and Progression in the Police Service
19
BME Police Staff – Recruitment and Retention
Police Staff Recruitment –table 7 Table 7 below shows both recruitment and overall strength figures for 2007/08:
2008 2008 2008 2008Force Name TARGET TOTAL BME BME % TOTAL BME BME %Avon & Somerset 2% 2,665 60 2.2% 266 46 17.4%Bedfordshire 10% 881 54 6.1% 116 10 8.8%Cambridgeshire 4% 1,115 39 3.5% 177 9 5.1%Cheshire 1% 1,648 19 1.1% 260 6 2.3%Cleveland 1% 871 13 1.5% 164 4 2.4%Cumbria 1% 905 5 0.5% 121 2 1.3%Derbyshire 3% 1,485 51 3.4% 215 14 6.4%Devon & Cornwall 1% 2,538 15 0.6% 369 4 1.1%Dorset 1% 1,162 12 1.0% 106 0 0.0%Durham 1% 978 6 0.6% 152 2 1.3%Essex 2% 2,501 68 2.7% 370 11 3.1%Gloucestershire 1% 918 27 3.0% 65 1 1.5%Greater Manchester 7% 4,492 176 3.9% 583 27 4.7%Hampshire 2% 2,856 61 2.2% 457 19 4.2%Hertfordshire 5% 1,828 66 3.6% 269 12 4.3%Humberside 1% 1,726 19 1.1% 368 8 2.0%Kent 2% 2,884 70 2.4% 546 24 4.3%Lancashire 5% 2,327 74 3.2% 363 18 4.8%Leicestershire 11% 1,392 131 9.4% 125 18 14.7%Lincolnshire 1% 938 8 0.9% 169 3 1.8%London, City of 10% 345 69 20.0% 30 8 26.7%Merseyside 2% 2,610 59 2.3% 243 10 4.1%Metropolitan Police 25% 18,831 4,685 24.9% 2,217 559 25.2%Norfolk 1% 1,383 13 0.9% 247 4 1.6%Northamptonshire 3% 1,183 42 3.6% 205 12 6.0%Northumbria 2% 2,278 21 0.9% 362 2 0.6%North Yorkshire 1% 1,261 12 1.0% 137 0 0.0%Nottinghamshire 4% 1,721 67 3.9% 216 10 4.6%South Yorkshire 3% 2,372 53 2.2% 297 10 3.3%Staffordshire 2% 1,563 29 1.8% 162 9 5.6%Suffolk 1% 991 17 1.7% 92 0 0.0%Surrey 4% 2,197 89 4.0% 432 24 5.6%Sussex 3% 2,401 44 1.8% 243 3 1.1%Thames Valley 5% 3,301 158 4.8% 793 48 6.1%Warwickshire 4% 762 31 4.1% 113 4 3.1%West Mercia 2% 1,922 37 1.9% 318 5 1.4%West Midlands 16% 4,184 447 10.7% 527 84 15.8%West Yorkshire 9% 4,012 154 3.8% 627 40 6.4%Wiltshire 1% 1,026 13 1.3% 181 1 0.6%Dyfed-Powys 1% 732 4 0.5% 78 2 1.9%Gwent 1% 1,015 9 0.9% 171 0 0.0%North Wales 1% 971 5 0.5% 79 2 2.5%South Wales 2% 2,086 23 1.1% 209 6 2.9%
7% 95,256 7,056 7.4% 13,238 1,078 8.1%
Number of forces meeting target (out of 43) 18 28Percentage of forces meeting target 42% 65%
Police Staff Strength Police Staff Recruitment

Policing Minister’s Assessment of Minority Ethnic Recruitment, Retention and Progression in the Police Service
20
Key messages:
Nationally both BME staff strength and recruitment are above target•
Higher turnover rates amongst staff, compared to officers, make it easier for strength targets • to be achieved quickly
The BME proportion within the MPS is extremely close to the target. This has been • particularly driven by a very high proportion of BME PCSOs (over 30%)
Police Staff - Retention table 8
Table 8 below shows retention figures (i.e. staff resigning from the service or dismissed) for both 2006/07 and 2007/08:
2006/07 2007/08 2006/07 2007/08 2006/07 2007/08 2006/07 2007/08 2006/07 2007/08 2006/07 2007/08Less than 6 months 68 70 664 439 10.2% 15.9% 994 875 7,849 5,775 12.7% 15.2%6 months to 2 years 149 223 1,164 1,624 12.8% 13.7% 2,152 2,727 12,767 17,916 16.9% 15.2%2 years to 5 years 169 219 2,431 2,282 7.0% 9.6% 2,055 2,426 22,685 22,297 9.1% 10.9%5 years to 10 years 33 47 945 1,381 3.5% 3.4% 760 934 15,627 17,884 4.9% 5.2%10 years and over 30 30 1,617 1,594 1.9% 1.9% 887 844 26,805 27,306 3.3% 3.1%Sum: 449 589 6,821 7,320 6.6% 8.0% 6848 7806 85,733 91,178 8.0% 8.6%
Number of Leavers Number of Staff Percentage Number of
LeaversAll minority
ethnicAll minority
ethnicAll minority
ethnic White
Number of Staff Percentage
White White
Key messages:
National BME staff retention is currently better than retention of white staff• for all but one length of service band
Assessment of key forces
The charts below show the significance of the Met, West Midlands, Greater Manchester and West Yorkshire for overall BME officer representation nationally. They are compared to the total for the next six forces which make up the top ten in terms of significance for balanced minority ethnic officer representation (Leicestershire, Thames Valley, Lancashire, Bedfordshire, Hertfordshire and South Yorkshire) and to the other 33 forces.

Policing Minister’s Assessment of Minority Ethnic Recruitment, Retention and Progression in the Police Service
21
Chart 1
Minority Ethnic officer strength broken down by force
Chart 2
Minority Ethnic officer target strength broken down by force
West M idlands, 1,346
Great er M anchest er , 562
West Yorkshire, 524
Next Six, 964
Ot hers, 1,430
M et , 7,865
M et , 2,594
West Yo rkshire
246 Great er M anc hest
er 334
Next Six, 630
West M idlands
624
Ot hers 1,365

Policing Minister’s Assessment of Minority Ethnic Recruitment, Retention and Progression in the Police Service
22
Annex B
ASSESSMENT OF MINORITY ETHNIC RECRUITMENT, RETENTION AND PROGRESSION IN THE POLICE SERVICE
List of Policing Partners
Three main meetings held in relation to the minority ethnic recruitment retention and progression assessment.
Meeting date: 8 October 2008 Dr Tim Brain – Chair Chief Police Officers’ Staff Association Charlie Laporte – Staff Officer to Dr Tim Brain Bob Jones – Chairman of the Association of Police Authorities Robin Field-Smith – Personnel, Training and Diversity, Her Majesty’s Inspectorate of Constabulary Ali Heydari – Her Majesty’s Inspectorate of Constabulary Ian Johnston – President Police Supers Jayne Monkhouse – Equalities Advisor Police Supers Peter Neyroud – Chief Executive National Policing Improvement Agency Stephen Otter – Chief Constable, Devon and Cornwall Police and ACPO Race and Diversity Lead Michael Pearson – Police Federation of England and Wales
Meeting date: 9 October 2008 National Black Police Association (NBPA) represented by the President Ali Dizaei and Vice President and Tony Smikle and the BME National Superintendents’ Network – represented by Dilip Amin.
Meeting date: 15 October 2008 Chairs of Post Lawrence Project Groups: Doreen Lawrence – Chair Trust and Confidence Group Iqbal Bhana - Chair of the Racist Incident Group and R David Muir – Chair of Learning and Development Training, and Ranjit Manghnani, National Policing Improvement Agency
Letters sent to Paul Cahill, Chair Gay Police Association, Scott Westbrook, Chair National Disabled Police Association and Julie Spence, Chair British Association for Women in Policing to inform them of the assessment.
Short discussions with the Police Federation Inspectors Branch, Julie Spence, Chair of the British Association for Women in Policing, Alf Hitchcock, Deputy Assistant Commissioner, Metropolitan Police and Sir Paul Stevenson, Deputy Commissioner, Metropolitan Police and Peter Neyroud, Chief Executive National Policing Improvement Agency.
Meeting 14 October 2008 Home Secretary meeting with National Association of Muslim Police (NAMP) represented by Zaheer Ahmad, President, Dal Babu Executive member, NAMP and Fiaz Choudhary, NAMP Committee Member and Chair of Met AMP

Policing Minister’s Assessment of Minority Ethnic Recruitment, Retention and Progression in the Police Service
23
Annex C
Some Key Achievements
Establishment of joint (HO, ACPO, APA) national team - Police National Diversity Team set • up (January 2005) to help the service and partners implement the “National Race Equality Programme” – developed in response to EHRC Formal Investigation into Racism in the Police Service (report of a 125 recommendations)
National Race Equality Programme for the Police Service (Published July 2005)•
‘Delivering Diversity in the Police Service’ Conference (July 2005) •
Establishment of a joint Board (HO, APA, ACPO, NPIA and HMIC) Equality and Diversity • Strategy Board – Board meets on a regular basis to consider the priorities for the police service in relation to the equality and diversity agenda
Development of a model framework and guidance to equality impact assess all national and • local policing policies
List of priority police service functions and policies (to assist with impact assessment) •
Standardised national exit interview questionnaire and guidance (2006)•
Employment Monitoring Duty Guidance bespoke for the police service (2006)•
National Race conference “Getting It Right” to consider the national Race Equality • Programme one year on and workshops to share good practice (June 2006)
Development of a model structure for forces to develop Confidence and Equality Boards • (through which the general duty to promote race equality is driven)
Establishment of force regional ‘Confidence and Equality’ Networks•
Minority Ethnic Police Officer representation 4.1% in 2008 double from 2% in 1999•
Minority Ethnic Police Staff representation achieved national target in 2007 •
Minority Ethnic Police Special Constable representation achieved national target in 2007•
In March 2008, minority ethnic Police Community Support Officers (PCSOs) accounted for • 11.5% of the total number of PCSOs in England and Wales

HO_01215_G