Minnesota Nonprofit Economy Report · The Minnesota Council of Nonprofits’ Minnesota Nonprofit...
20
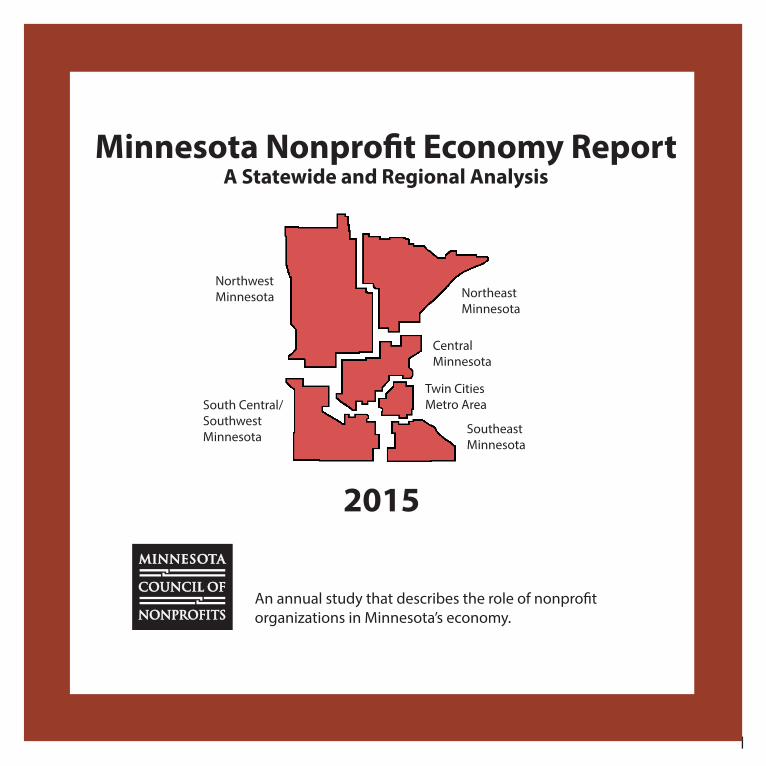
1 2015 An annual study that describes the role of nonprofit organizations in Minnesota’s economy. Minnesota Nonprofit Economy Report A Statewide and Regional Analysis Twin Cities Metro Area Northeast Minnesota Central Minnesota Southeast Minnesota Northwest Minnesota South Central/ Southwest Minnesota
Transcript of Minnesota Nonprofit Economy Report · The Minnesota Council of Nonprofits’ Minnesota Nonprofit...
1
2015
An annual study that describes the role of nonprofit organizations in Minnesota’s economy.
Minnesota Nonprofit Economy ReportA Statewide and Regional Analysis
Twin Cities Metro Area
NortheastMinnesota
CentralMinnesota
SoutheastMinnesota
NorthwestMinnesota
South Central/SouthwestMinnesota
2
The AuthorsPaul Vliem (development and project manager), Michael Seehusen (research intern) and Jon Pratt (executive director)
The Minnesota Council of Nonprofits (MCN) is the statewide association of more than 2,100 Minnesota nonprofit organizations. Through its website, publications, workshops and events, cost-saving programs and advocacy, MCN works to inform, promote, connect and strengthen individual nonprofits and the nonprofit sector.
Copyright ® 2016 Minnesota Council of Nonprofits. All rights reserved. Short sections of text may be quoted without explicit permission, provided that full credit is given to the source. Additional copies of this report can be downloaded from MCN’s website at www.minnesotanonprofits.org.
Using this ReportLike every other industry in the United States, the nonprofit sector benefits from having timely information on economic performance. The Minnesota Council of Nonprofits’ Minnesota Nonprofit Economy Report, published annually for the last fourteen years, provides the most comprehensive nonprofit economic information available in the nation. Minnesota ranks at or near the top in virtually every measure of nonprofit and philanthropic activity. This success is due to substantial dona-tions of time and financial resources by the people of Minnesota, generous support from Minnesota’s business community and strong partnerships with state and local governments.
The Minnesota Nonprofit Economy Report – when used together with the Minnesota Salary and Benefits Survey, the Non-profit Current Conditions Report and other publications from the Minnesota Council of Nonprofits – has important uses for five distinct audiences:
• Managers of nonprofit organizations: planning budgets, evaluating revenue streams and identifying potential partnerships• Nonprofit boards of directors: developing strategic plans, informing board trainings and evaluating staffing and compensation plans• Government officials: understanding nonprofit funding streams and identifying partnership opportunities• Donors to nonprofits: understanding the sources of support and nature of expenditures of nonprofit organizations• Economic and community development planners: incorporating nonprofit employment trends into economic development plans and understanding regional differences and local economies
3
2015 Minnesota Nonprofit Economy ReportExecutive Summary
Nonprofit organizations are an important part of Minnesota’s many communities, pro-viding key services, employing residents and improving the overall quality of life in the state. The importance of nonprofits has been highlighted by a period of slow growth that both Minnesota, as well as the U.S., have experienced following the Great Recession. The Nonprofit Economy Report (NPER) is an annual study by the Minnesota Council of Nonprofits (MCN) that analyzes public data on nonprofit employers, employment, and wages to understand the role nonprofit organizations play in the state’s economy. Through these methods, this report gives us a unique look on the state of Minnesota’s nonprofit sector.
Slow growth continuesMinnesota, like most of the country, saw its economy experience a dramatic slowdown following The Great Recession. Even seven years out, the state has not seen the same level of growth it did prior to 2007. Unfortunately, the nonprofit sector was not exempt from this. While the sector still tends to grow, it is at a noticeably slower rate. Between 2000 and 2007, the state’s nonprofit work-force grew by an average of 2.7 percent per year. However, from 2007 to 2014, the sector’s workforce grew by 1.5 percent per year. Although any growth in the sector is good, there is no clear indicator that the state’s nonprofit sector will return to its previous levels of growth in the near future. Despite this slowdown, the state’s nonprofit sector is still faring better than its for-profit sector, which saw its workforce grow by 0.1 percent per year over the same period.
While nonprofits are being affected by the long-lasting financial effects of The Great Recession, some of its immediate effects have worn off which also affects the sector. While there was an overall growth in nonprofit employment since 2007, in the last few years some industries saw very little growth and some even saw slight shrinkage in the number of individuals they employ. This may be
a sign that, due to the fact that Minnesota’s economy has been steadily recovering from the recession, nonprofit services are at a lower demand than in previous years. With more people in better financial situations, there are less individuals in need of assis-tance.
Signs of hope, despite strugglesEven with a changing economy putting the nonprofit sector in a difficult spot, there are still some promising signs for nonprofits in Minnesota. Wages, for example, may be growing more slowly than they previously had been across all sectors, but as of 2014
the nonprofit sector’s wages are growing the fastest. This is made even more impressive by the fact that when the healthcare industry (the largest industry in the nonprofit sector) is excluded, the rate of growth actually increases, and has not slowed since the recession.
In Central Minnesota, wages have risen in such a way that the average nonprofit sector wage has surpassed both government and for-profit sector wages to become the highest in the region. Central Minnesota stands out in other notable ways as well. Despite often being overlooked in comparison to the metro area, as a nonprofit hub, both the region’s number of nonprofits and number of nonprofit employees are growing faster than any other region in the state.
While it still has difficulties to face, there are plenty of signals that show the state’s nonprofit sector is resilient and full of potential.
Table of Contents 2 Statewide Analysis 6 Twin Cities Metro Area Analysis 8 Northeast Minnesota Analysis 10 Northwest Minnesota Analysis 12 Central Minnesota Analysis 14 Southeast Minnesota Analysis 16 South Central/Southwest Minnesota Analysis 18 Appendix
4
Statewide Nonprofit Employment
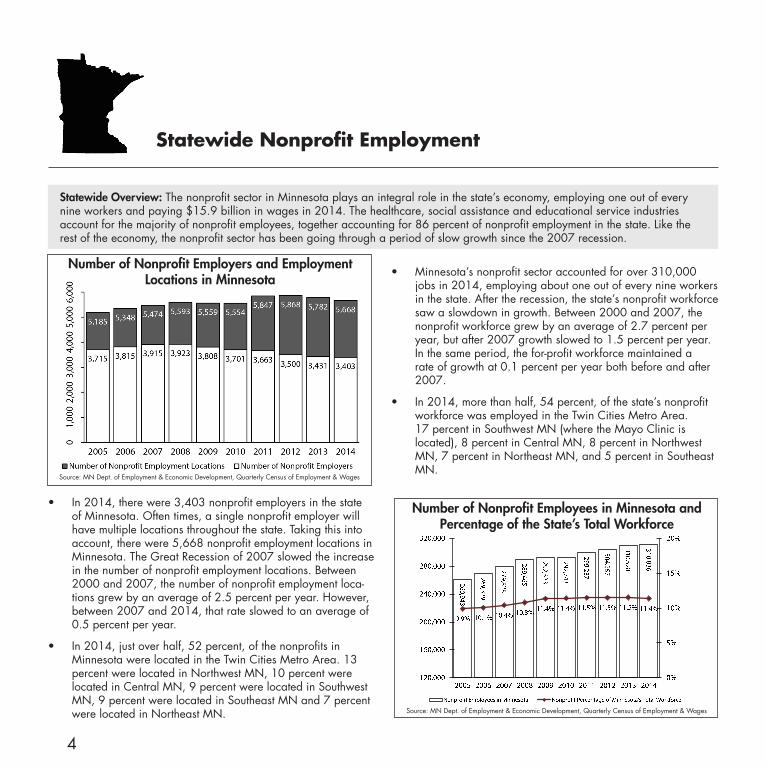
Statewide Overview: The nonprofit sector in Minnesota plays an integral role in the state’s economy, employing one out of every nine workers and paying $15.9 billion in wages in 2014. The healthcare, social assistance and educational service industries account for the majority of nonprofit employees, together accounting for 86 percent of nonprofit employment in the state. Like the rest of the economy, the nonprofit sector has been going through a period of slow growth since the 2007 recession.
• In 2014, there were 3,403 nonprofit employers in the state of Minnesota. Often times, a single nonprofit employer will have multiple locations throughout the state. Taking this into account, there were 5,668 nonprofit employment locations in Minnesota. The Great Recession of 2007 slowed the increase in the number of nonprofit employment locations. Between 2000 and 2007, the number of nonprofit employment loca-tions grew by an average of 2.5 percent per year. However, between 2007 and 2014, that rate slowed to an average of 0.5 percent per year.
• In 2014, just over half, 52 percent, of the nonprofits in Minnesota were located in the Twin Cities Metro Area. 13 percent were located in Northwest MN, 10 percent were located in Central MN, 9 percent were located in Southwest MN, 9 percent were located in Southeast MN and 7 percent were located in Northeast MN.
• Minnesota’s nonprofit sector accounted for over 310,000 jobs in 2014, employing about one out of every nine workers in the state. After the recession, the state’s nonprofit workforce saw a slowdown in growth. Between 2000 and 2007, the nonprofit workforce grew by an average of 2.7 percent per year, but after 2007 growth slowed to 1.5 percent per year. In the same period, the for-profit workforce maintained a rate of growth at 0.1 percent per year both before and after 2007.
• In 2014, more than half, 54 percent, of the state’s nonprofit workforce was employed in the Twin Cities Metro Area. 17 percent in Southwest MN (where the Mayo Clinic is located), 8 percent in Central MN, 8 percent in Northwest MN, 7 percent in Northeast MN, and 5 percent in Southeast MN.
Source: MN Dept. of Employment & Economic Development, Quarterly Census of Employment & Wages
Number of Nonprofit Employers and Employment Locations in Minnesota
Number of Nonprofit Employees in Minnesota and Percentage of the State’s Total Workforce
Source: MN Dept. of Employment & Economic Development, Quarterly Census of Employment & Wages
5
Statewide Nonprofit Wages
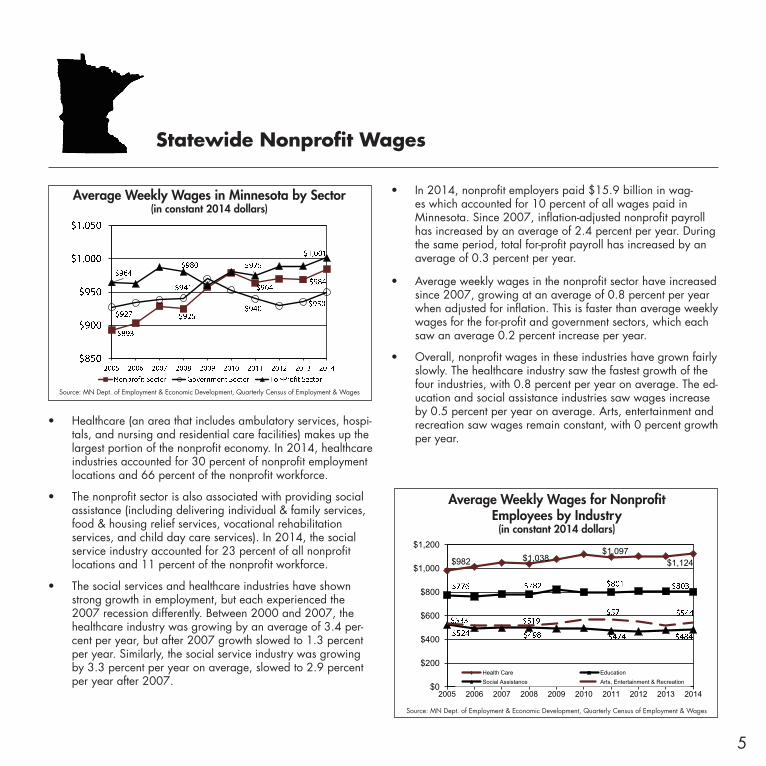
• Healthcare (an area that includes ambulatory services, hospi-tals, and nursing and residential care facilities) makes up the largest portion of the nonprofit economy. In 2014, healthcare industries accounted for 30 percent of nonprofit employment locations and 66 percent of the nonprofit workforce.
• The nonprofit sector is also associated with providing social assistance (including delivering individual & family services, food & housing relief services, vocational rehabilitation services, and child day care services). In 2014, the social service industry accounted for 23 percent of all nonprofit locations and 11 percent of the nonprofit workforce.
• The social services and healthcare industries have shown strong growth in employment, but each experienced the 2007 recession differently. Between 2000 and 2007, the healthcare industry was growing by an average of 3.4 per-cent per year, but after 2007 growth slowed to 1.3 percent per year. Similarly, the social service industry was growing by 3.3 percent per year on average, slowed to 2.9 percent per year after 2007.
• In 2014, nonprofit employers paid $15.9 billion in wag-es which accounted for 10 percent of all wages paid in Minnesota. Since 2007, inflation-adjusted nonprofit payroll has increased by an average of 2.4 percent per year. During the same period, total for-profit payroll has increased by an average of 0.3 percent per year.
• Average weekly wages in the nonprofit sector have increased since 2007, growing at an average of 0.8 percent per year when adjusted for inflation. This is faster than average weekly wages for the for-profit and government sectors, which each saw an average 0.2 percent increase per year.
• Overall, nonprofit wages in these industries have grown fairly slowly. The healthcare industry saw the fastest growth of the four industries, with 0.8 percent per year on average. The ed-ucation and social assistance industries saw wages increase by 0.5 percent per year on average. Arts, entertainment and recreation saw wages remain constant, with 0 percent growth per year.
$982 $1,038$1,097
$1,124
$0
$200
$400
$600
$800
$1,000
$1,200
2005 2006 2007 2008 2009 2010 2011 2012 2013 2014
Health Care EducationSocial Assistance Arts, Entertainment & Recreation
Average Weekly Wages for Nonprofit Employees by Industry
(in constant 2014 dollars)
Source: MN Dept. of Employment & Economic Development, Quarterly Census of Employment & Wages
Average Weekly Wages in Minnesota by Sector(in constant 2014 dollars)
Source: MN Dept. of Employment & Economic Development, Quarterly Census of Employment & Wages
6
Twin Cities Metro Area Nonprofit EmploymentCounties: Anoka, Carver, Dakota, Hennepin, Ramsey, Scott, Washington
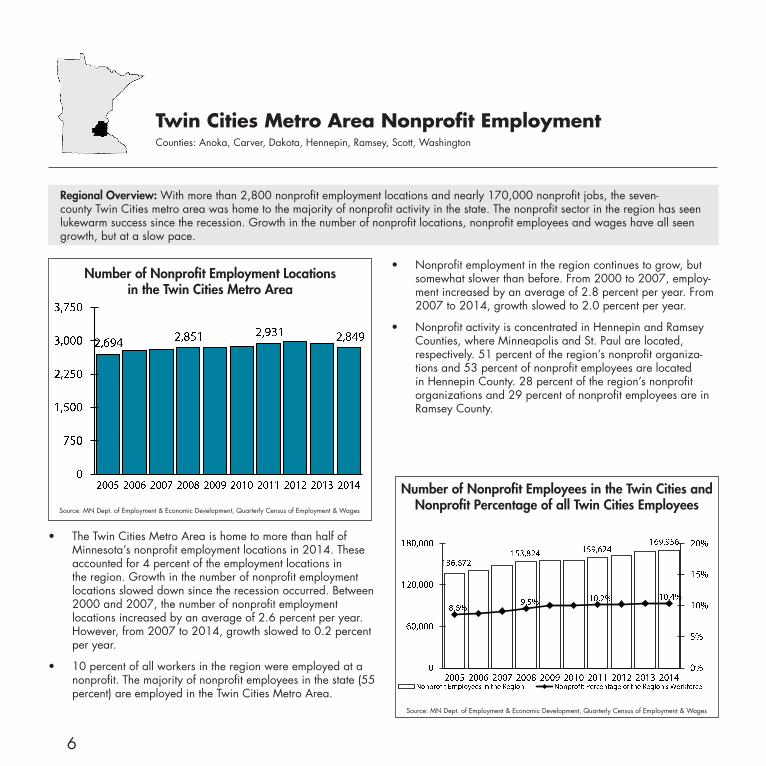
Regional Overview: With more than 2,800 nonprofit employment locations and nearly 170,000 nonprofit jobs, the seven-county Twin Cities metro area was home to the majority of nonprofit activity in the state. The nonprofit sector in the region has seen lukewarm success since the recession. Growth in the number of nonprofit locations, nonprofit employees and wages have all seen growth, but at a slow pace.
• The Twin Cities Metro Area is home to more than half of Minnesota’s nonprofit employment locations in 2014. These accounted for 4 percent of the employment locations in the region. Growth in the number of nonprofit employment locations slowed down since the recession occurred. Between 2000 and 2007, the number of nonprofit employment locations increased by an average of 2.6 percent per year. However, from 2007 to 2014, growth slowed to 0.2 percent per year.
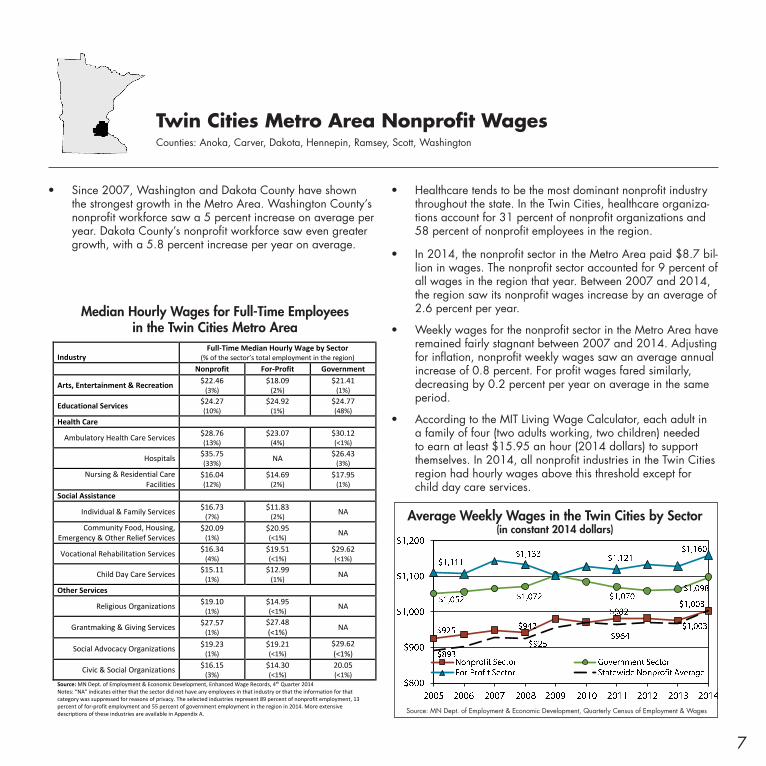
• 10 percent of all workers in the region were employed at a nonprofit. The majority of nonprofit employees in the state (55 percent) are employed in the Twin Cities Metro Area.
• Nonprofit employment in the region continues to grow, but somewhat slower than before. From 2000 to 2007, employ-ment increased by an average of 2.8 percent per year. From 2007 to 2014, growth slowed to 2.0 percent per year.
• Nonprofit activity is concentrated in Hennepin and Ramsey Counties, where Minneapolis and St. Paul are located, respectively. 51 percent of the region’s nonprofit organiza-tions and 53 percent of nonprofit employees are located in Hennepin County. 28 percent of the region’s nonprofit organizations and 29 percent of nonprofit employees are in Ramsey County.
Number of Nonprofit Employment Locations in the Twin Cities Metro Area
Number of Nonprofit Employees in the Twin Cities and Nonprofit Percentage of all Twin Cities EmployeesSource: MN Dept. of Employment & Economic Development, Quarterly Census of Employment & Wages
Source: MN Dept. of Employment & Economic Development, Quarterly Census of Employment & Wages
7
Twin Cities Metro Area Nonprofit WagesCounties: Anoka, Carver, Dakota, Hennepin, Ramsey, Scott, Washington
• Since 2007, Washington and Dakota County have shown the strongest growth in the Metro Area. Washington County’s nonprofit workforce saw a 5 percent increase on average per year. Dakota County’s nonprofit workforce saw even greater growth, with a 5.8 percent increase per year on average.
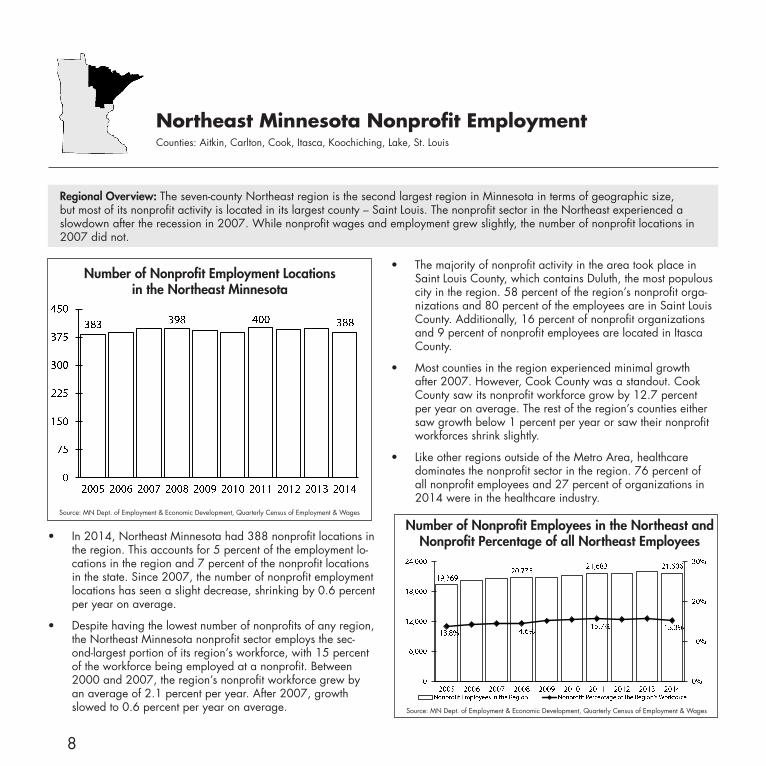
• Healthcare tends to be the most dominant nonprofit industry throughout the state. In the Twin Cities, healthcare organiza-tions account for 31 percent of nonprofit organizations and 58 percent of nonprofit employees in the region.
• In 2014, the nonprofit sector in the Metro Area paid $8.7 bil-lion in wages. The nonprofit sector accounted for 9 percent of all wages in the region that year. Between 2007 and 2014, the region saw its nonprofit wages increase by an average of 2.6 percent per year.
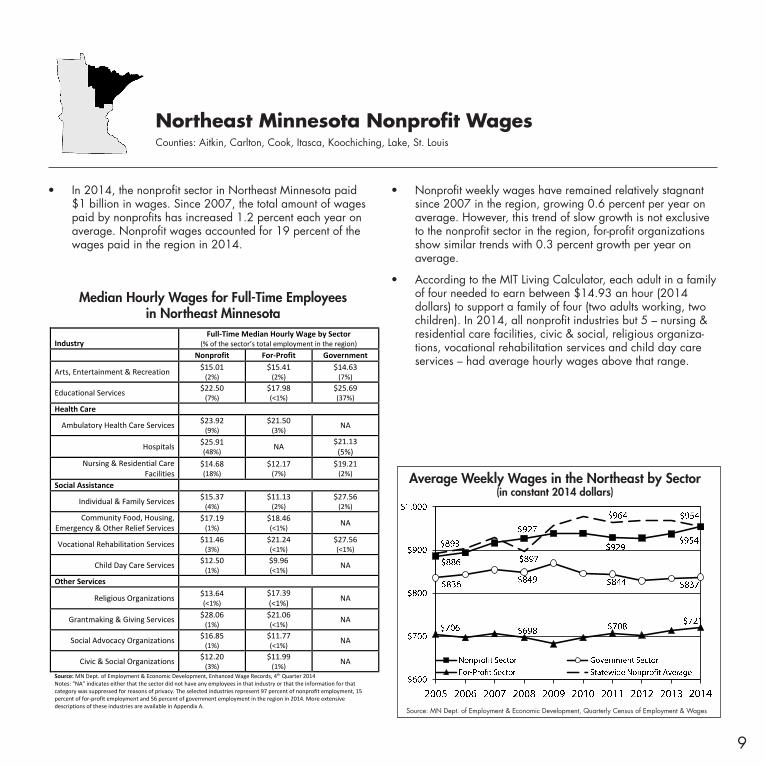
• Weekly wages for the nonprofit sector in the Metro Area have remained fairly stagnant between 2007 and 2014. Adjusting for inflation, nonprofit weekly wages saw an average annual increase of 0.8 percent. For profit wages fared similarly, decreasing by 0.2 percent per year on average in the same period.
• According to the MIT Living Wage Calculator, each adult in a family of four (two adults working, two children) needed to earn at least $15.95 an hour (2014 dollars) to support themselves. In 2014, all nonprofit industries in the Twin Cities region had hourly wages above this threshold except for child day care services.
13
Median Hourly Wages for Full-Time Employees in Twin Cities Minnesota
Industry Full-Time Median Hourly Wage by Sector
(% of the sector’s total employment in the region) Nonprofit For-Profit Government
Arts, Entertainment & Recreation $22.46 (3%)
$18.09 (2%)
$21.41 (1%)
Educational Services $24.27 (10%)
$24.92 (1%)
$24.77 (48%)
Health Care
Ambulatory Health Care Services $28.76 (13%)
$23.07 (4%)
$30.12 (<1%)
Hospitals $35.75 (33%) NA $26.43
(3%) Nursing & Residential Care
Facilities $16.04 (12%)
$14.69 (2%)
$17.95 (1%)
Social Assistance
Individual & Family Services $16.73 (7%)
$11.83 (2%) NA
Community Food, Housing, Emergency & Other Relief Services
$20.09 (1%)
$20.95 (<1%) NA
Vocational Rehabilitation Services $16.34 (4%)
$19.51 (<1%)
$29.62 (<1%)
Child Day Care Services $15.11 (1%)
$12.99 (1%) NA
Other Services
Religious Organizations $19.10 (1%)
$14.95 (<1%)
NA
Grantmaking & Giving Services $27.57 (1%)
$27.48 (<1%) NA
Social Advocacy Organizations $19.23 (1%)
$19.21 (<1%)
$29.62 (<1%)
Civic & Social Organizations $16.15 (3%)
$14.30 (<1%)
20.05 (<1%)
Source: MN Dept. of Employment & Economic Development, Enhanced Wage Records, 4th Quarter 2014 Notes: “NA” indicates either that the sector did not have any employees in that industry or that the information for that category was suppressed for reasons of privacy. The selected industries represent 89 percent of nonprofit employment, 13 percent of for-profit employment and 55 percent of government employment in the region in 2014. More extensive descriptions of these industries are available in Appendix A.
Median Hourly Wages for Full-Time Employees in the Twin Cities Metro Area
Average Weekly Wages in the Twin Cities by Sector(in constant 2014 dollars)
Source: MN Dept. of Employment & Economic Development, Quarterly Census of Employment & Wages
8
Northeast Minnesota Nonprofit EmploymentCounties: Aitkin, Carlton, Cook, Itasca, Koochiching, Lake, St. Louis
Regional Overview: The seven-county Northeast region is the second largest region in Minnesota in terms of geographic size, but most of its nonprofit activity is located in its largest county – Saint Louis. The nonprofit sector in the Northeast experienced a slowdown after the recession in 2007. While nonprofit wages and employment grew slightly, the number of nonprofit locations in 2007 did not.
• In 2014, Northeast Minnesota had 388 nonprofit locations in the region. This accounts for 5 percent of the employment lo-cations in the region and 7 percent of the nonprofit locations in the state. Since 2007, the number of nonprofit employment locations has seen a slight decrease, shrinking by 0.6 percent per year on average.
• Despite having the lowest number of nonprofits of any region, the Northeast Minnesota nonprofit sector employs the sec-ond-largest portion of its region’s workforce, with 15 percent of the workforce being employed at a nonprofit. Between 2000 and 2007, the region’s nonprofit workforce grew by an average of 2.1 percent per year. After 2007, growth slowed to 0.6 percent per year on average.
• The majority of nonprofit activity in the area took place in Saint Louis County, which contains Duluth, the most populous city in the region. 58 percent of the region’s nonprofit orga-nizations and 80 percent of the employees are in Saint Louis County. Additionally, 16 percent of nonprofit organizations and 9 percent of nonprofit employees are located in Itasca County.
• Most counties in the region experienced minimal growth after 2007. However, Cook County was a standout. Cook County saw its nonprofit workforce grow by 12.7 percent per year on average. The rest of the region’s counties either saw growth below 1 percent per year or saw their nonprofit workforces shrink slightly.
• Like other regions outside of the Metro Area, healthcare dominates the nonprofit sector in the region. 76 percent of all nonprofit employees and 27 percent of organizations in 2014 were in the healthcare industry.
Number of Nonprofit Employment Locations in the Northeast Minnesota
Number of Nonprofit Employees in the Northeast and Nonprofit Percentage of all Northeast Employees
Source: MN Dept. of Employment & Economic Development, Quarterly Census of Employment & Wages
Source: MN Dept. of Employment & Economic Development, Quarterly Census of Employment & Wages
9
Northeast Minnesota Nonprofit WagesCounties: Aitkin, Carlton, Cook, Itasca, Koochiching, Lake, St. Louis
• In 2014, the nonprofit sector in Northeast Minnesota paid $1 billion in wages. Since 2007, the total amount of wages paid by nonprofits has increased 1.2 percent each year on average. Nonprofit wages accounted for 19 percent of the wages paid in the region in 2014.
• Nonprofit weekly wages have remained relatively stagnant since 2007 in the region, growing 0.6 percent per year on average. However, this trend of slow growth is not exclusive to the nonprofit sector in the region, for-profit organizations show similar trends with 0.3 percent growth per year on average.
• According to the MIT Living Calculator, each adult in a family of four needed to earn between $14.93 an hour (2014 dollars) to support a family of four (two adults working, two children). In 2014, all nonprofit industries but 5 – nursing & residential care facilities, civic & social, religious organiza-tions, vocational rehabilitation services and child day care services – had average hourly wages above that range.
17
Median Hourly Wages for Full-Time Employees in Northeast Minnesota
Industry Full-Time Median Hourly Wage by Sector
(% of the sector’s total employment in the region) Nonprofit For-Profit Government
Arts, Entertainment & Recreation $15.01 (2%)
$15.41 (2%)
$14.63 (7%)
Educational Services $22.50 (7%)
$17.98 (<1%)
$25.69 (37%)
Health Care
Ambulatory Health Care Services $23.92 (9%)
$21.50 (3%) NA
Hospitals $25.91 (48%) NA
$21.13 (5%)
Nursing & Residential Care Facilities
$14.68 (18%)
$12.17 (7%)
$19.21 (2%)
Social Assistance
Individual & Family Services $15.37 (4%)
$11.13 (2%)
$27.56 (2%)
Community Food, Housing, Emergency & Other Relief Services
$17.19 (1%)
$18.46 (<1%) NA
Vocational Rehabilitation Services $11.46 (3%)
$21.24 (<1%)
$27.56 (<1%)
Child Day Care Services $12.50 (1%)
$9.96 (<1%) NA
Other Services
Religious Organizations $13.64 (<1%)
$17.39 (<1%) NA
Grantmaking & Giving Services $28.06 (1%)
$21.06 (<1%) NA
Social Advocacy Organizations $16.85 (1%)
$11.77 (<1%)
NA
Civic & Social Organizations $12.20 (3%)
$11.99 (1%) NA
Source: MN Dept. of Employment & Economic Development, Enhanced Wage Records, 4th Quarter 2014 Notes: “NA” indicates either that the sector did not have any employees in that industry or that the information for that category was suppressed for reasons of privacy. The selected industries represent 97 percent of nonprofit employment, 15 percent of for-profit employment and 56 percent of government employment in the region in 2014. More extensive descriptions of these industries are available in Appendix A.
Median Hourly Wages for Full-Time Employees in Northeast Minnesota
Average Weekly Wages in the Northeast by Sector(in constant 2014 dollars)
Source: MN Dept. of Employment & Economic Development, Quarterly Census of Employment & Wages
10
Northwest Minnesota Nonprofit EmploymentCounties: Becker, Beltrami, Cass, Clay, Clearwater, Crow Wing, Douglas, Grant, Hubbard, Kittson, Lake of the Woods, Mahnomen, Marshall, Morrison, Norman, Otter Tail, Pennington, Polk, Pope, Roseau, Stevens, Todd, Traverse, Wadena, Wilkin
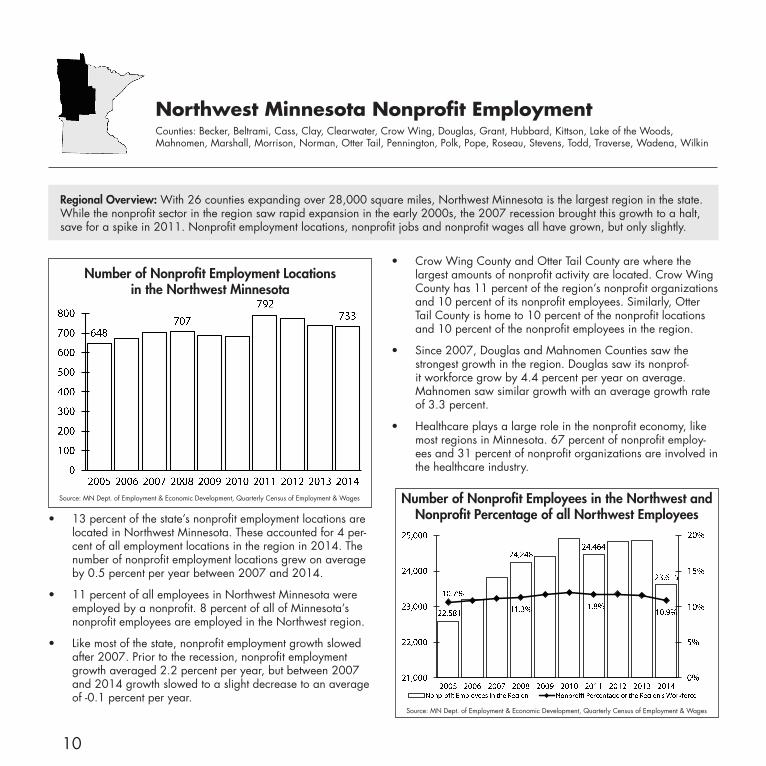
Regional Overview: With 26 counties expanding over 28,000 square miles, Northwest Minnesota is the largest region in the state. While the nonprofit sector in the region saw rapid expansion in the early 2000s, the 2007 recession brought this growth to a halt, save for a spike in 2011. Nonprofit employment locations, nonprofit jobs and nonprofit wages all have grown, but only slightly.
• 13 percent of the state’s nonprofit employment locations are located in Northwest Minnesota. These accounted for 4 per-cent of all employment locations in the region in 2014. The number of nonprofit employment locations grew on average by 0.5 percent per year between 2007 and 2014.
• 11 percent of all employees in Northwest Minnesota were employed by a nonprofit. 8 percent of all of Minnesota’s nonprofit employees are employed in the Northwest region.
• Like most of the state, nonprofit employment growth slowed after 2007. Prior to the recession, nonprofit employment growth averaged 2.2 percent per year, but between 2007 and 2014 growth slowed to a slight decrease to an average of -0.1 percent per year.
• Crow Wing County and Otter Tail County are where the largest amounts of nonprofit activity are located. Crow Wing County has 11 percent of the region’s nonprofit organizations and 10 percent of its nonprofit employees. Similarly, Otter Tail County is home to 10 percent of the nonprofit locations and 10 percent of the nonprofit employees in the region.
• Since 2007, Douglas and Mahnomen Counties saw the strongest growth in the region. Douglas saw its nonprof-it workforce grow by 4.4 percent per year on average. Mahnomen saw similar growth with an average growth rate of 3.3 percent.
• Healthcare plays a large role in the nonprofit economy, like most regions in Minnesota. 67 percent of nonprofit employ-ees and 31 percent of nonprofit organizations are involved in the healthcare industry.
Number of Nonprofit Employment Locations in the Northwest Minnesota
Number of Nonprofit Employees in the Northwest and Nonprofit Percentage of all Northwest Employees
Source: MN Dept. of Employment & Economic Development, Quarterly Census of Employment & Wages
Source: MN Dept. of Employment & Economic Development, Quarterly Census of Employment & Wages
11
Northwest Minnesota Nonprofit WagesCounties: Becker, Beltrami, Cass, Clay, Clearwater, Crow Wing, Douglas, Grant, Hubbard, Kittson, Lake of the Woods, Mahnomen, Marshall, Morrison, Norman, Otter Tail, Pennington, Polk, Pope, Roseau, Stevens, Todd, Traverse, Wadena, Wilkin
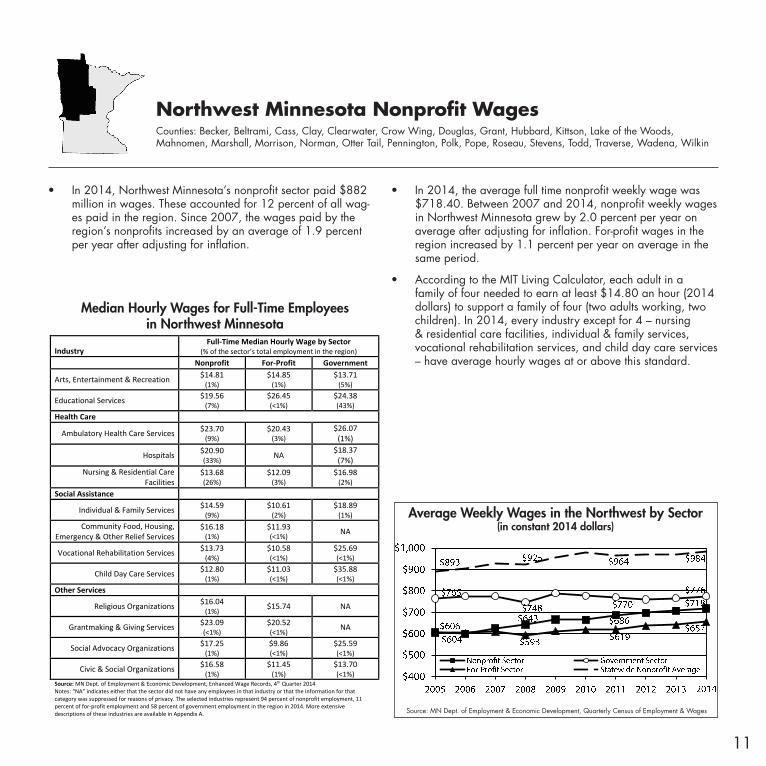
• In 2014, Northwest Minnesota’s nonprofit sector paid $882 million in wages. These accounted for 12 percent of all wag-es paid in the region. Since 2007, the wages paid by the region’s nonprofits increased by an average of 1.9 percent per year after adjusting for inflation.
• In 2014, the average full time nonprofit weekly wage was $718.40. Between 2007 and 2014, nonprofit weekly wages in Northwest Minnesota grew by 2.0 percent per year on average after adjusting for inflation. For-profit wages in the region increased by 1.1 percent per year on average in the same period.
• According to the MIT Living Calculator, each adult in a family of four needed to earn at least $14.80 an hour (2014 dollars) to support a family of four (two adults working, two children). In 2014, every industry except for 4 – nursing & residential care facilities, individual & family services, vocational rehabilitation services, and child day care services – have average hourly wages at or above this standard.
21
Median Hourly Wages for Full-Time Employees in Northwest Minnesota
Industry Full-Time Median Hourly Wage by Sector
(% of the sector’s total employment in the region) Nonprofit For-Profit Government
Arts, Entertainment & Recreation $14.81 (1%)
$14.85 (1%)
$13.71 (5%)
Educational Services $19.56 (7%)
$26.45 (<1%)
$24.38 (43%)
Health Care
Ambulatory Health Care Services $23.70 (9%)
$20.43 (3%)
$26.07 (1%)
Hospitals $20.90 (33%) NA
$18.37 (7%)
Nursing & Residential Care Facilities
$13.68 (26%)
$12.09 (3%)
$16.98 (2%)
Social Assistance
Individual & Family Services $14.59 (9%)
$10.61 (2%)
$18.89 (1%)
Community Food, Housing, Emergency & Other Relief Services
$16.18 (1%)
$11.93 (<1%) NA
Vocational Rehabilitation Services $13.73 (4%)
$10.58 (<1%)
$25.69 (<1%)
Child Day Care Services $12.80 (1%)
$11.03 (<1%)
$35.88 (<1%)
Other Services
Religious Organizations $16.04 (1%) $15.74 NA
Grantmaking & Giving Services $23.09 (<1%)
$20.52 (<1%) NA
Social Advocacy Organizations $17.25 (1%)
$9.86 (<1%)
$25.59 (<1%)
Civic & Social Organizations $16.58 (1%)
$11.45 (1%)
$13.70 (<1%)
Source: MN Dept. of Employment & Economic Development, Enhanced Wage Records, 4th Quarter 2014 Notes: “NA” indicates either that the sector did not have any employees in that industry or that the information for that category was suppressed for reasons of privacy. The selected industries represent 94 percent of nonprofit employment, 11 percent of for-profit employment and 58 percent of government employment in the region in 2014. More extensive descriptions of these industries are available in Appendix A.
Median Hourly Wages for Full-Time Employees in Northwest Minnesota
Average Weekly Wages in the Northwest by Sector(in constant 2014 dollars)
Source: MN Dept. of Employment & Economic Development, Quarterly Census of Employment & Wages
12
Central Minnesota Nonprofit EmploymentCounties: Benton, Chisago, Isanti, Kanabec, Kandiyohi, McLeod, Meeker, Mille Lacs, Pine, Renville, Sherburne, Stearns, Wright
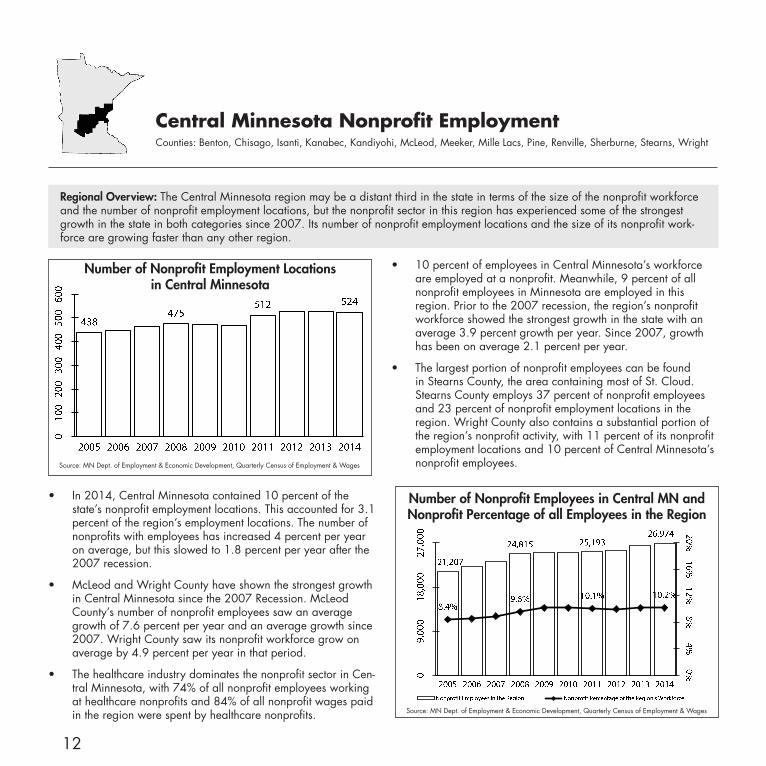
Regional Overview: The Central Minnesota region may be a distant third in the state in terms of the size of the nonprofit workforce and the number of nonprofit employment locations, but the nonprofit sector in this region has experienced some of the strongest growth in the state in both categories since 2007. Its number of nonprofit employment locations and the size of its nonprofit work-force are growing faster than any other region.
• In 2014, Central Minnesota contained 10 percent of the state’s nonprofit employment locations. This accounted for 3.1 percent of the region’s employment locations. The number of nonprofits with employees has increased 4 percent per year on average, but this slowed to 1.8 percent per year after the 2007 recession.
• McLeod and Wright County have shown the strongest growth in Central Minnesota since the 2007 Recession. McLeod County’s number of nonprofit employees saw an average growth of 7.6 percent per year and an average growth since 2007. Wright County saw its nonprofit workforce grow on average by 4.9 percent per year in that period.
• The healthcare industry dominates the nonprofit sector in Cen-tral Minnesota, with 74% of all nonprofit employees working at healthcare nonprofits and 84% of all nonprofit wages paid in the region were spent by healthcare nonprofits.
• 10 percent of employees in Central Minnesota’s workforce are employed at a nonprofit. Meanwhile, 9 percent of all nonprofit employees in Minnesota are employed in this region. Prior to the 2007 recession, the region’s nonprofit workforce showed the strongest growth in the state with an average 3.9 percent growth per year. Since 2007, growth has been on average 2.1 percent per year.
• The largest portion of nonprofit employees can be found in Stearns County, the area containing most of St. Cloud. Stearns County employs 37 percent of nonprofit employees and 23 percent of nonprofit employment locations in the region. Wright County also contains a substantial portion of the region’s nonprofit activity, with 11 percent of its nonprofit employment locations and 10 percent of Central Minnesota’s nonprofit employees.
Number of Nonprofit Employment Locations in Central Minnesota
Number of Nonprofit Employees in Central MN and Nonprofit Percentage of all Employees in the Region
Source: MN Dept. of Employment & Economic Development, Quarterly Census of Employment & Wages
Source: MN Dept. of Employment & Economic Development, Quarterly Census of Employment & Wages
13
Central Minnesota Nonprofit WagesCounties: Benton, Chisago, Isanti, Kanabec, Kandiyohi, McLeod, Meeker, Mille Lacs, Pine, Renville, Sherburne, Stearns, Wright
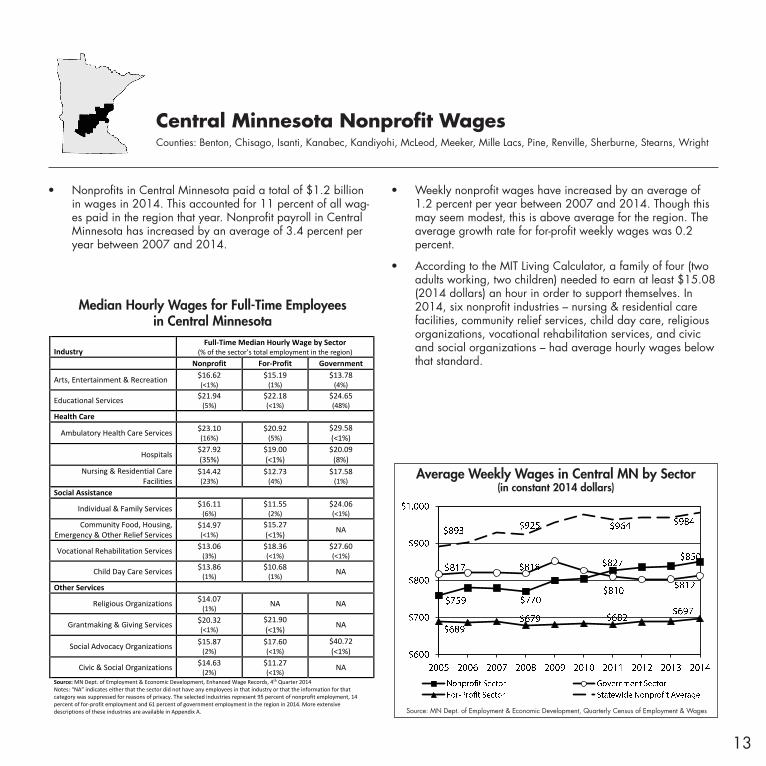
• Nonprofits in Central Minnesota paid a total of $1.2 billion in wages in 2014. This accounted for 11 percent of all wag-es paid in the region that year. Nonprofit payroll in Central Minnesota has increased by an average of 3.4 percent per year between 2007 and 2014.
• Weekly nonprofit wages have increased by an average of 1.2 percent per year between 2007 and 2014. Though this may seem modest, this is above average for the region. The average growth rate for for-profit weekly wages was 0.2 percent.
• According to the MIT Living Calculator, a family of four (two adults working, two children) needed to earn at least $15.08 (2014 dollars) an hour in order to support themselves. In 2014, six nonprofit industries – nursing & residential care facilities, community relief services, child day care, religious organizations, vocational rehabilitation services, and civic and social organizations – had average hourly wages below that standard.
25
Median Hourly Wages for Full-Time Employees in Central Minnesota
Industry Full-Time Median Hourly Wage by Sector
(% of the sector’s total employment in the region) Nonprofit For-Profit Government
Arts, Entertainment & Recreation $16.62 (<1%)
$15.19 (1%)
$13.78 (4%)
Educational Services $21.94 (5%)
$22.18 (<1%)
$24.65 (48%)
Health Care
Ambulatory Health Care Services $23.10 (16%)
$20.92 (5%)
$29.58 (<1%)
Hospitals $27.92 (35%)
$19.00 (<1%)
$20.09 (8%)
Nursing & Residential Care Facilities
$14.42 (23%)
$12.73 (4%)
$17.58 (1%)
Social Assistance
Individual & Family Services $16.11 (6%)
$11.55 (2%)
$24.06 (<1%)
Community Food, Housing, Emergency & Other Relief Services
$14.97 (<1%)
$15.27 (<1%) NA
Vocational Rehabilitation Services $13.06 (3%)
$18.36 (<1%)
$27.60 (<1%)
Child Day Care Services $13.86 (1%)
$10.68 (1%) NA
Other Services
Religious Organizations $14.07 (1%) NA NA
Grantmaking & Giving Services $20.32 (<1%)
$21.90 (<1%) NA
Social Advocacy Organizations $15.87 (2%)
$17.60 (<1%)
$40.72 (<1%)
Civic & Social Organizations $14.63 (2%)
$11.27 (<1%) NA
Source: MN Dept. of Employment & Economic Development, Enhanced Wage Records, 4th Quarter 2014 Notes: “NA” indicates either that the sector did not have any employees in that industry or that the information for that category was suppressed for reasons of privacy. The selected industries represent 95 percent of nonprofit employment, 14 percent of for-profit employment and 61 percent of government employment in the region in 2014. More extensive descriptions of these industries are available in Appendix A.
Median Hourly Wages for Full-Time Employees in Central Minnesota
Average Weekly Wages in Central MN by Sector(in constant 2014 dollars)
Source: MN Dept. of Employment & Economic Development, Quarterly Census of Employment & Wages
14
Southeast Minnesota Nonprofit EmploymentCounties: Dodge, Fillmore, Freeborn, Goodhue, Houston, Mower, Olsted, Rice, Steele, Wabasha, Winona
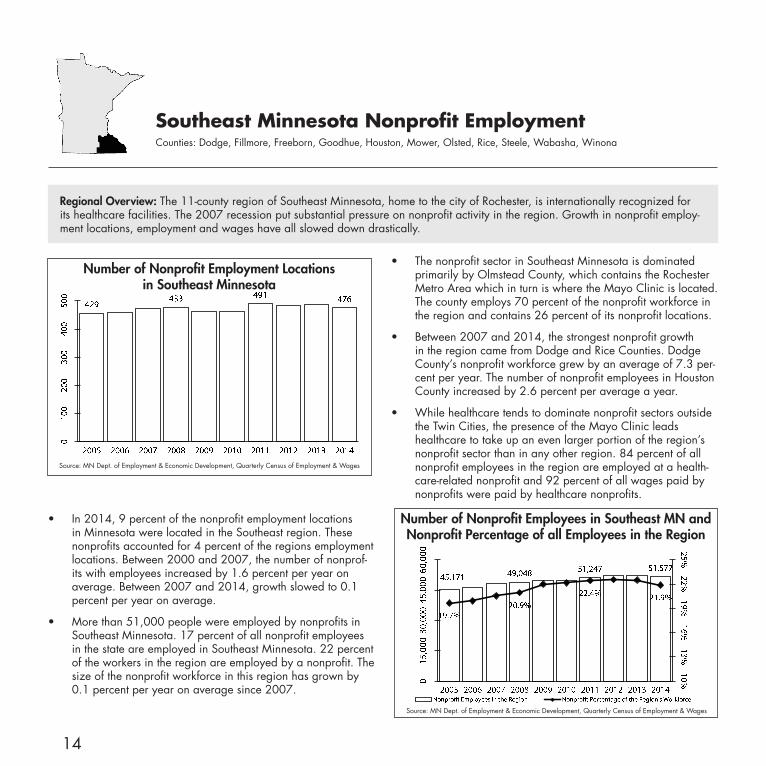
Regional Overview: The 11-county region of Southeast Minnesota, home to the city of Rochester, is internationally recognized for its healthcare facilities. The 2007 recession put substantial pressure on nonprofit activity in the region. Growth in nonprofit employ-ment locations, employment and wages have all slowed down drastically.
• In 2014, 9 percent of the nonprofit employment locations in Minnesota were located in the Southeast region. These nonprofits accounted for 4 percent of the regions employment locations. Between 2000 and 2007, the number of nonprof-its with employees increased by 1.6 percent per year on average. Between 2007 and 2014, growth slowed to 0.1 percent per year on average.
• More than 51,000 people were employed by nonprofits in Southeast Minnesota. 17 percent of all nonprofit employees in the state are employed in Southeast Minnesota. 22 percent of the workers in the region are employed by a nonprofit. The size of the nonprofit workforce in this region has grown by 0.1 percent per year on average since 2007.
• The nonprofit sector in Southeast Minnesota is dominated primarily by Olmstead County, which contains the Rochester Metro Area which in turn is where the Mayo Clinic is located. The county employs 70 percent of the nonprofit workforce in the region and contains 26 percent of its nonprofit locations.
• Between 2007 and 2014, the strongest nonprofit growth in the region came from Dodge and Rice Counties. Dodge County’s nonprofit workforce grew by an average of 7.3 per-cent per year. The number of nonprofit employees in Houston County increased by 2.6 percent per average a year.
• While healthcare tends to dominate nonprofit sectors outside the Twin Cities, the presence of the Mayo Clinic leads healthcare to take up an even larger portion of the region’s nonprofit sector than in any other region. 84 percent of all nonprofit employees in the region are employed at a health-care-related nonprofit and 92 percent of all wages paid by nonprofits were paid by healthcare nonprofits.
Number of Nonprofit Employment Locations in Southeast Minnesota
Number of Nonprofit Employees in Southeast MN and Nonprofit Percentage of all Employees in the Region
Source: MN Dept. of Employment & Economic Development, Quarterly Census of Employment & Wages
Source: MN Dept. of Employment & Economic Development, Quarterly Census of Employment & Wages
15
Southeast Minnesota Nonprofit WagesCounties: Dodge, Fillmore, Freeborn, Goodhue, Houston, Mower, Olsted, Rice, Steele, Wabasha, Winona
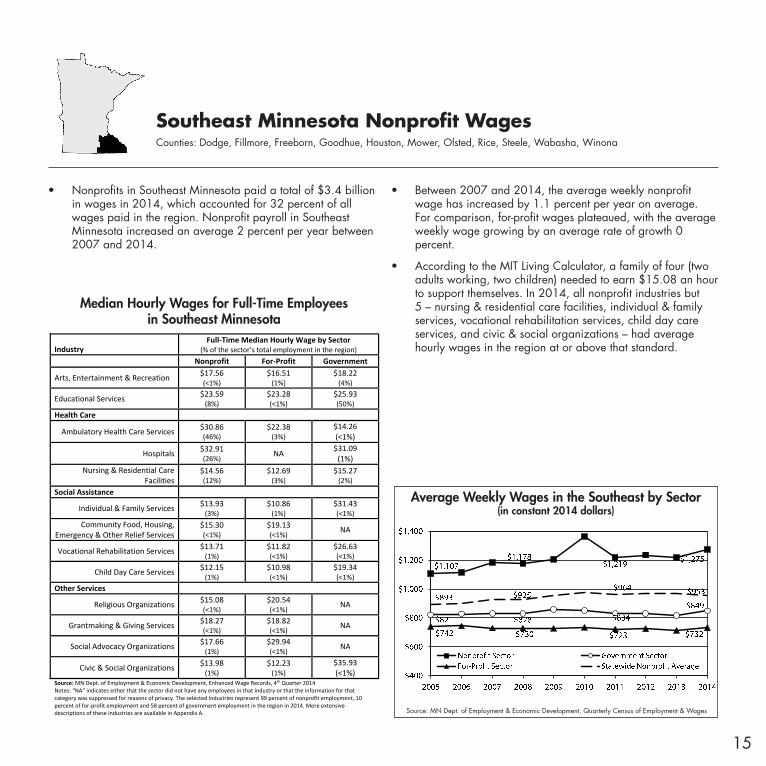
• Nonprofits in Southeast Minnesota paid a total of $3.4 billion in wages in 2014, which accounted for 32 percent of all wages paid in the region. Nonprofit payroll in Southeast Minnesota increased an average 2 percent per year between 2007 and 2014.
• Between 2007 and 2014, the average weekly nonprofit wage has increased by 1.1 percent per year on average. For comparison, for-profit wages plateaued, with the average weekly wage growing by an average rate of growth 0 percent.
• According to the MIT Living Calculator, a family of four (two adults working, two children) needed to earn $15.08 an hour to support themselves. In 2014, all nonprofit industries but 5 – nursing & residential care facilities, individual & family services, vocational rehabilitation services, child day care services, and civic & social organizations – had average hourly wages in the region at or above that standard.
29
Median Hourly Wages for Full-Time Employees in Southeast Minnesota
Industry Full-Time Median Hourly Wage by Sector
(% of the sector’s total employment in the region) Nonprofit For-Profit Government
Arts, Entertainment & Recreation $17.56 (<1%)
$16.51 (1%)
$18.22 (4%)
Educational Services $23.59 (8%)
$23.28 (<1%)
$25.93 (50%)
Health Care
Ambulatory Health Care Services $30.86 (46%)
$22.38 (3%)
$14.26 (<1%)
Hospitals $32.91 (26%) NA
$31.09 (1%)
Nursing & Residential Care Facilities
$14.56 (12%)
$12.69 (3%)
$15.27 (2%)
Social Assistance
Individual & Family Services $13.93 (3%)
$10.86 (1%)
$31.43 (<1%)
Community Food, Housing, Emergency & Other Relief Services
$15.30 (<1%)
$19.13 (<1%) NA
Vocational Rehabilitation Services $13.71 (1%)
$11.82 (<1%)
$26.63 (<1%)
Child Day Care Services $12.15 (1%)
$10.98 (<1%)
$19.34 (<1%)
Other Services
Religious Organizations $15.08 (<1%)
$20.54 (<1%) NA
Grantmaking & Giving Services $18.27 (<1%)
$18.82 (<1%) NA
Social Advocacy Organizations $17.66 (1%)
$29.94 (<1%) NA
Civic & Social Organizations $13.98 (1%)
$12.23 (1%)
$35.93 (<1%)
Source: MN Dept. of Employment & Economic Development, Enhanced Wage Records, 4th Quarter 2014 Notes: “NA” indicates either that the sector did not have any employees in that industry or that the information for that category was suppressed for reasons of privacy. The selected industries represent 99 percent of nonprofit employment, 10 percent of for-profit employment and 58 percent of government employment in the region in 2014. More extensive descriptions of these industries are available in Appendix A.
Median Hourly Wages for Full-Time Employees in Southeast Minnesota
Average Weekly Wages in the Southeast by Sector(in constant 2014 dollars)
Source: MN Dept. of Employment & Economic Development, Quarterly Census of Employment & Wages
16
South Central/Southwest Minnesota Nonprofit EmploymentCounties: Big Stone, Blue Earth, Brown, Chippewa, Cottonwood, Faribault, Jackson, Lac Qui Parle, Le Sueur, Lincoln, LyonMartin, Murray, Nicollet, Nobles, Pipestone, Redwood, Rock, Sibley, Swift, Waseca, Watonwan, Yellow Medicine
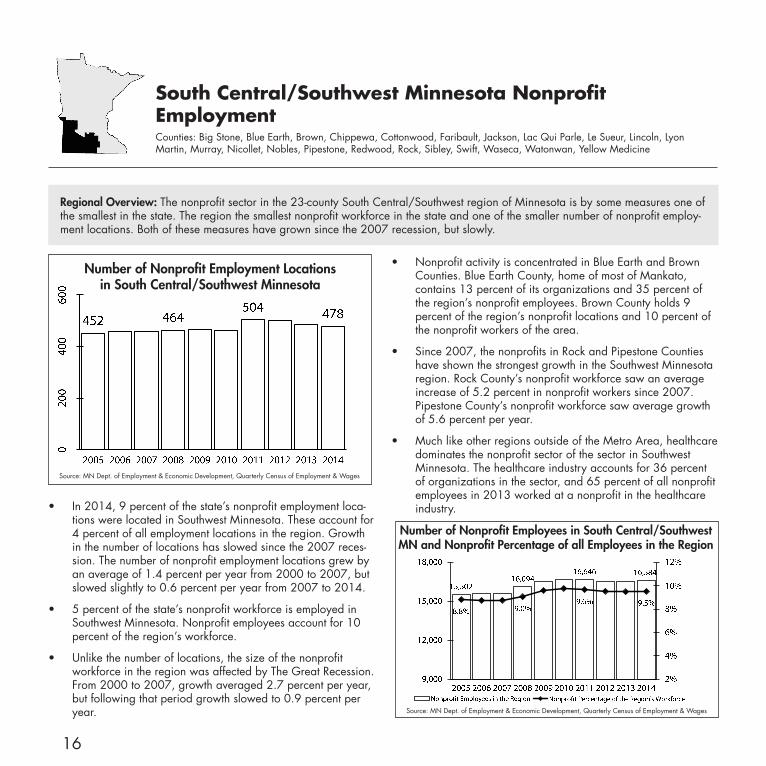
Regional Overview: The nonprofit sector in the 23-county South Central/Southwest region of Minnesota is by some measures one of the smallest in the state. The region the smallest nonprofit workforce in the state and one of the smaller number of nonprofit employ-ment locations. Both of these measures have grown since the 2007 recession, but slowly.
• In 2014, 9 percent of the state’s nonprofit employment loca-tions were located in Southwest Minnesota. These account for 4 percent of all employment locations in the region. Growth in the number of locations has slowed since the 2007 reces-sion. The number of nonprofit employment locations grew by an average of 1.4 percent per year from 2000 to 2007, but slowed slightly to 0.6 percent per year from 2007 to 2014.
• 5 percent of the state’s nonprofit workforce is employed in Southwest Minnesota. Nonprofit employees account for 10 percent of the region’s workforce.
• Unlike the number of locations, the size of the nonprofit workforce in the region was affected by The Great Recession. From 2000 to 2007, growth averaged 2.7 percent per year, but following that period growth slowed to 0.9 percent per year.
• Nonprofit activity is concentrated in Blue Earth and Brown Counties. Blue Earth County, home of most of Mankato, contains 13 percent of its organizations and 35 percent of the region’s nonprofit employees. Brown County holds 9 percent of the region’s nonprofit locations and 10 percent of the nonprofit workers of the area.
• Since 2007, the nonprofits in Rock and Pipestone Counties have shown the strongest growth in the Southwest Minnesota region. Rock County’s nonprofit workforce saw an average increase of 5.2 percent in nonprofit workers since 2007. Pipestone County’s nonprofit workforce saw average growth of 5.6 percent per year.
• Much like other regions outside of the Metro Area, healthcare dominates the nonprofit sector of the sector in Southwest Minnesota. The healthcare industry accounts for 36 percent of organizations in the sector, and 65 percent of all nonprofit employees in 2013 worked at a nonprofit in the healthcare industry.
Number of Nonprofit Employment Locations in South Central/Southwest Minnesota
Number of Nonprofit Employees in South Central/Southwest MN and Nonprofit Percentage of all Employees in the Region
Source: MN Dept. of Employment & Economic Development, Quarterly Census of Employment & Wages
Source: MN Dept. of Employment & Economic Development, Quarterly Census of Employment & Wages
17
South Central/Southwest Minnesota Nonprofit WagesCounties: Big Stone, Blue Earth, Brown, Chippewa, Cottonwood, Faribault, Jackson, Lac Qui Parle, Le Sueur, Lincoln, LyonMartin, Murray, Nicollet, Nobles, Pipestone, Redwood, Rock, Sibley, Swift, Waseca, Watonwan, Yellow Medicine
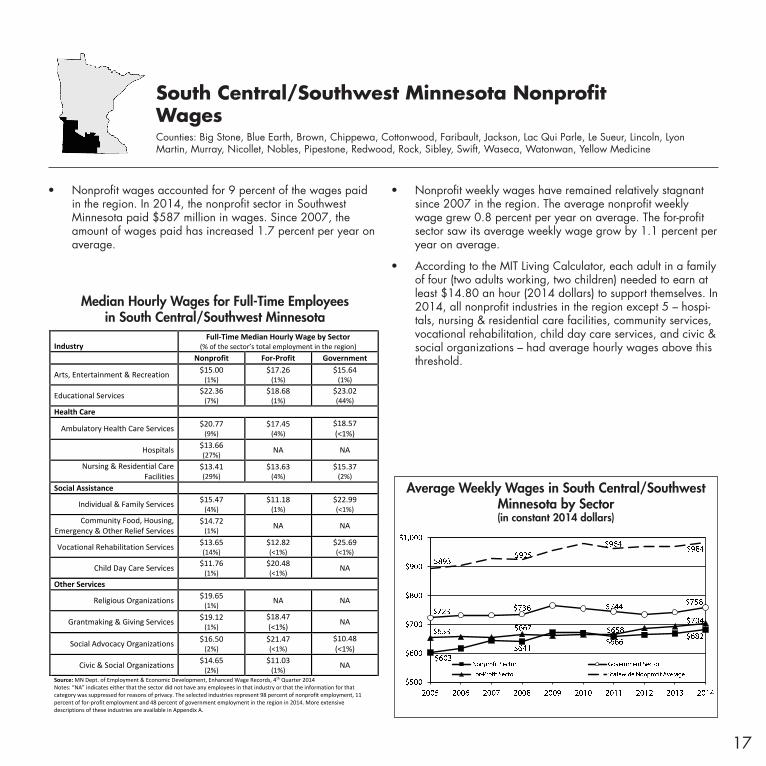
• Nonprofit wages accounted for 9 percent of the wages paid in the region. In 2014, the nonprofit sector in Southwest Minnesota paid $587 million in wages. Since 2007, the amount of wages paid has increased 1.7 percent per year on average.
• Nonprofit weekly wages have remained relatively stagnant since 2007 in the region. The average nonprofit weekly wage grew 0.8 percent per year on average. The for-profit sector saw its average weekly wage grow by 1.1 percent per year on average.
• According to the MIT Living Calculator, each adult in a family of four (two adults working, two children) needed to earn at least $14.80 an hour (2014 dollars) to support themselves. In 2014, all nonprofit industries in the region except 5 – hospi-tals, nursing & residential care facilities, community services, vocational rehabilitation, child day care services, and civic & social organizations – had average hourly wages above this threshold.
33
Median Hourly Wages for Full-Time Employees in Southwest Minnesota
Industry Full-Time Median Hourly Wage by Sector
(% of the sector’s total employment in the region) Nonprofit For-Profit Government
Arts, Entertainment & Recreation $15.00 (1%)
$17.26 (1%)
$15.64 (1%)
Educational Services $22.36 (7%)
$18.68 (1%)
$23.02 (44%)
Health Care
Ambulatory Health Care Services $20.77 (9%)
$17.45 (4%)
$18.57 (<1%)
Hospitals $13.66 (27%) NA NA
Nursing & Residential Care Facilities
$13.41 (29%)
$13.63 (4%)
$15.37 (2%)
Social Assistance
Individual & Family Services $15.47 (4%)
$11.18 (1%)
$22.99 (<1%)
Community Food, Housing, Emergency & Other Relief Services
$14.72 (1%) NA NA
Vocational Rehabilitation Services $13.65 (14%)
$12.82 (<1%)
$25.69 (<1%)
Child Day Care Services $11.76 (1%)
$20.48 (<1%) NA
Other Services
Religious Organizations $19.65 (1%) NA NA
Grantmaking & Giving Services $19.12 (1%)
$18.47 (<1%) NA
Social Advocacy Organizations $16.50 (2%)
$21.47 (<1%)
$10.48 (<1%)
Civic & Social Organizations $14.65 (2%)
$11.03 (1%) NA
Source: MN Dept. of Employment & Economic Development, Enhanced Wage Records, 4th Quarter 2014 Notes: “NA” indicates either that the sector did not have any employees in that industry or that the information for that category was suppressed for reasons of privacy. The selected industries represent 98 percent of nonprofit employment, 11 percent of for-profit employment and 48 percent of government employment in the region in 2014. More extensive descriptions of these industries are available in Appendix A.
Median Hourly Wages for Full-Time Employees in South Central/Southwest Minnesota
Average Weekly Wages in South Central/Southwest Minnesota by Sector(in constant 2014 dollars)
18
Appendix ANonprofit Classification Systems
Ambulatory Health Care Services (NAICS 621) – provide health care services to ambulatory patients, and include physicians’ offices, mental health practitioners, dentists, optometrists, physical, occupational and speech therapists, family planning centers, outpatient mental health and substance abuse centers, medical and diagnostic laboratories and home health care services.
Arts, Entertainment & Recreation (NAICS 71) – establishments that are involved in producing, promoting or participating in live performances, events or exhibits intended for public viewing; establishments that pre-serve and exhibit objects and sites of historical, cultural or educational interest; and establishments that operate facilities or provide services that enable patrons to participate in recreational activities or pursue amuse-ment, hobby and leisure-time interests.
Child Day Care Services (NAICS 6244) – establishments primarily engaged in providing day care of infants or children.
Civic & Social Organizations (NAICS 8134) – establishments engaged in promoting the civic and social interests of their members, including alumni associations, ethnic associations, scouting organizations, student clubs and social senior citizens’ associations.
Community Food, Housing, Emergency & Other Relief Services(NAICS 6242) – Community food service establishments primarily collect and deliver food for the needy. Community housing service establish-ments provide short-term emergency shelter, transitional housing for low-income people, volunteer construction of low-cost housing, or repair of homes for elderly or disabled homeowners. Emergency and other relief service establishments primarily provide food, shelter, clothing, medical relief, resettlement and counseling to victims of domestic or international disasters or conflicts.
Educational Services (NAICS 611) – establishments that provide instruc-tion and training through specialized establishments, such as schools, colleges, universities and training centers.
Grantmaking & Giving Services (NAICS 8132) – grantmaking founda-tions and charitable trusts, as well as establishments primarily engaged in raising funds for a range of social welfare activities.
Hospitals (NAICS 622) – provide medical, diagnostic and treatment services that include physician, nursing and other health services to inpa-tients. Hospitals may provide outpatient services as a secondary activity.
Individual & Family Services (NAICS 6241) – establishments primarily engaged in providing nonresidential social assistance services for
children and youth, such as adoption and foster care, drug prevention, life skills training and positive social development.
Nursing & Residential Care Facilities (NAICS 623) – provide residential care combined with nursing or other types of care as required by the res-idents. Examples include nursing care facilities, residential mental health facilities and community care facilities for the elderly.
Religious Organizations (NAICS 8131) – churches, religious temples, monasteries and establishments primarily engaged in administering an organized religion or promoting religious activities.
Social Advocacy Organizations (NAICS 8133) – establishments primarily engaged in promoting a particular cause or working for the realization of a specific social or political goal to benefit a broad or specific constituency. These organizations may solicit contributions or offer memberships to support these goals.
Vocational Rehabilitation Services (NAICS 6243) – establishments engaged in providing services such as job counseling, job training and work experience to unemployed and underemployed persons, persons with disabilities and persons who have a job market disadvantage because of lack of education, job skills or experience.
Health – activities include, but are not limited to, hospitals, ambulatory health care, rehabilitative care, public health, nursing care, mental health treatment, substance abuse treatment, HMOs and medical research.
Human Services – activities include, but are not limited to, crime pre-vention and rehabilitation, abuse prevention, legal services, vocational counseling and rehabilitation, food programs, housing and shelter, disas-ter preparedness and relief, recreation and sports, youth development, child and youth services, emergency assistance and centers for specific populations.
Education – activities include, but are not limited to, nonprofit elementary and secondary schools, vocational and technical schools, higher educa-tion, adult education, libraries, educational services and student services.
Arts, Culture and Humanities – activities include, but are not limited to, arts education, media and communications, visual arts, museums, performing arts and historical preservation.
Environmental and Animal-Related – activities include, but are not limited to, natural resources conservation and protection, pollution abate-ment and control, horticulture, animal protection and welfare, wildlife preservation, veterinary services, and zoos and aquariums.
North American Industry Classification System (NAICS)This report uses the NAICS for the analysis of nonprofit
employers, employees and wages.
National Taxonomy of Exempt Entities (NTEE)This report uses the NTEE for the analysis of nonprofit finances.
19
Appendix BData Sources
Quarterly Census of Employment and Wages The Quarterly Census of Employment and Wages (QCEW), a cooperative endeavor between the U.S. Department of Labor’s Bureau of Labor Statistics (BLS) and the Minnesota Department of Employment and Economic Development (DEED), is a virtual census of Minnesota employers, covering 97 percent of nonag-ricultural employment and wage data in Minnesota. Total wages include gross wages and salaries, pay for vacation and other paid leave, tips and other gratuities that are reported to the employer, bonuses (including severance pay), stock options, some sickness and disability payments, and the cash value of meals and lodging. This report uses QCEW data to analyze 501(c)(3) nonprofit em-ployers, employment locations, employees and wages. Each year, DEED provides new data for the most current year and revised data for the previous year. Therefore, data for 2013 may differ slightly from what was reported in the 2012 Minnesota Nonprofit Economy Report. Information on the number of nonprofit employ-ers is only available at the state level, so regional analysis focuses on the number of nonprofit employment locations. This report uses the Consumer Price Index (CPI-U) to adjust total payroll and average weekly wages for inflation.
Enhanced Wage Records The median wage data used in this report is from the Minnesota Department of Employment and Economic Development (DEED). DEED merges data from the QCEW program (described above) from the 4th quarter of 2014 with Unemployment Insurance (UI) Wage Records for the same quarter. UI records contain indi-vidual-level employment and wage data on all employees and employers covered under the UI program. Merging these data sets enables DEED to determine an individual employee’s wages as paid by a unique employer during that quarter. In order to be included in the analysis, each employee needed to have earnings in the 3rd and the following 1st quarter with the same employer as in the 4th quarter. This report uses the data to examine median hourly wages, or the mid-point in the range of wages, by region for full-time employees in selected industries. Full-time is defined as working 35 hours or more per week, or over 454 hours during the quarter.
MIT Living Wage CalculatorThe MIT Living Wage Calculator, created by Dr. Amy K. Glasmei-er and the Massachusetts Institute of Technology, calculates the wage necessary for a family to cover its basic needs, looking at a variety of family compositions as well as geographic differences. The living wage model is a market-based approach that draws upon geographically specific expenditure data related to a fam-ily’s likely minimum food, child care, health insurance, housing, transportation, and other basic necessities (e.g. clothing, personal care items, etc.) costs. The budget does not include any money for entertainment, vacation, eating out, emergencies, retirement or education. The MIT Living Wage Calculator is regularly updated and is available online at livingwage.mit.edu.
20
2314 University Avenue West, Suite 20, Saint Paul, MN 55114Tel: 651-642-1904 800-289-1904 Fax: 651-642-1517 www.mncn.org
Central Chapter ChapterSt. Cloud
Tel: 320-403-3376
Northeast ChapterDuluth
Tel: 218-206-5711
Northwest ChapterMankato
Tel: 218-407-5202
South Central/Southwest ChapterMankato
Tel: 507-469-2217
Southeast ChapterRochester
Tel: 507-884-4728
West Central ChapterFargo/Moorhead
Tel: 218-443-6864