Mining and Mineral Processing - InfoHouseinfohouse.p2ric.org/ref/18/17310.pdf · pollution impacts...
128
w . p j1.12 0 Liz? Special Publication SP 06-95 ”- I ? .I - “ /I,- * -’ Pollution Prevention in Mining and Mineral Processing i, I q 1 $ ‘3 Waste Assessments for Mines and Mills s P ; By Daniel S. Witkowsky 1, I‘ U.S. Department of the Interior U.S. Bureau of Mines 1995
Transcript of Mining and Mineral Processing - InfoHouseinfohouse.p2ric.org/ref/18/17310.pdf · pollution impacts...
w. p j1.12 0 Liz? Special Publication SP 06-95
” - I ?
.I - “ /I,-
* - ’ Pollution Prevention in Mining and Mineral Processing
i, I
q 1
$ ‘3
W a s t e A s s e s s m e n t s for Mines and Mills s
P ; By Daniel S. Witkowsky 1 ,
I ‘
U.S. Department of the Interior U.S. Bureau of Mines
1995

I
Special Publication
Pollution Prevention in Mining and Mineral Processing W a s t e A s s e s s m e n t s for Mines and Mills
By Daniel S. Witkowsky
U.S. DEPARTMENT OF THE INTERIOR Bruce Babbitt, Secretary
U.S. BUREAU OF MINES Rhea L. Graham, Director
Library of Congress Catl loqing-in-Publicion Data:
Witkowsky, D. 8.
waste assessments for mines and mills/by Daniel S. Witkowsky. Pollution prevention in mining and mineral processing:
p. cm. Includes bibliographical references. 1. Mineral industrieeEnvironmental aspects. 2.Ore-dressing-Environmental aspects. 3. Industrial management-Environmental aspects. 4. Pollution. I .Title. TD195.MSW58 1995 6 2 2 4 ~ 2 0 95-12945
CIP
Reference to specific corporate entities or product does not imply endorsement by the U.S. Bureau of Mines or the U.S. Department of the Interior.
I
i
PREFACE
l -
The United States Department of the Interior is the Nation’s principal conservation agency. It is responsible for the assessment of mineral resources and for assuring that mineral resource development is in the best interest of the United States. Having responsibility for most of our nationally-owned public lands, the Department fosters the wisest use of lands and water resources, protects fish and wildlife, and preserves the environmental and cultural values of our national parks and historic places. In helping to meet this responsibility, the Department’s Office of Environmental Policy and Compliance provided technical and financial support for this report.
The U.S. Bureau of Mines (USBM) was established within the Department by an act of Congress in 1910. This act, and subsequent statutes, specifically identified the USBM as the agency accountable for mineral resources conservation, mine worker health and safety, environmental protection associated with the minerals industries, raw materials extraction and processing, and recycling.
The current mission of the USBM is to help ensure that the Nation has an adequate and dependable supply of minerals and materials for national security and economic growth at acceptable economic, human, and environmental costs. The agency is the world’s premier source of information about minerals and is the principal Government agency conducting minerals-related analyses related to explored deposits, developing and producing mines, and mineral processing plants worldwide. In so doing, the USBM identifies, collects, compiles, and evaluates mineral information on current and possible production, health/safety; and production/environmental technology.
With this expertise, the USBM is in a unique position to provide input and guidance to assist mine and plant operators in many phases of their operations. This publication has thus been prepared to serve as a general reference for pollution prevention at mines and mills, including heap and dump leach operations.
Questions concerning studies related to mining, minerals processing, materials, and associated environmental issues, may be addressed to the Office of Public Information, U.S. Bureau of Mines, 810 7th St., N W . , Washington, DC 20241, telephone ( 2 0 2 ) 501 -9649 or fax ( 2 0 2 ) 2 1 9 - 2 4 9 3 .
l -

I
iii
CONTENTS
Page
Preface . . . . . . . . . . . . . . . . . . . . . . . . . . . . . . i Contents . . . . . . . . . . . . . . . . . . . . . . . . . . . . iii Abstract . . . . . . . . . . . . . . . . . . . . . . . . . . . . . 1 Introduction . . . . . . . . . . . . . . . . . . . . . . . . . . . 2 Pollution prevention and mining . . . . . . . . . . . . . . . . . . 3 What is pollution prevention (W)? . . . . . . . . . . . . . . 3
Why the minerals industry needs to "RELIE" on P2 . . . . . . . 6
Economic incentives .. it pays to reduce waste . . . . . . . . 7 Liability incentives .. it's the operator's responsibility . . 7
The need for a publication on P2 for mining and mineral processing 3
Regulatory incentives .. it's the law . . . . . . . . . . . . . 6
Image of the Industry .. it's the right thing to do . . . . . . 8 Environment and human health .. it's the future of mining . . . 8
P2 examples in mining and mineral processing . . . . . . . . . . 8
Establishing the P2 program . . . . . . . . . . . . . . . . . . 11 Make the executive level decision and present a policy statement 11 Build consensus . . . . . . . . . . . . . . . . . . . . . . . . 11
Organize a P2 program . . . . . . . . . . . . . . . . . . . . . . 13 Name the task force . . . . . . . . . . . . . . . . . . . . . . 13 Provide employee training . . . . . . . . . . . . . . . . . . . 15 State goals . . . . . . . . . . . . . . . . . . . . . . . . . . 16
Do preliminary assessment . . . . . . . . . . . . . . . . . . . . 17 Collect data . . . . . . . . . . . . . . . . . . . . . . . . . 18
Implementation of the pollution prevention program . . . . . . . . 9
Establish priorities . . . . . . . . . . . . . . . . . . . . . 18 Write program plan . . . . . . . . . . . . . . . . . . . . . . . 21 Define objectives . . . . . . . . . . . . . . . . . . . . . . . 21 Identifying potential obstacles . . . . . . . . . . . . . . . . 21 Economic . . . . . . . . . . . . . . . . . . . . . . . . . . 21 Technical . . . . . . . . . . . . . . . . . . . . . . . . . . 22 Institutional . . . . . . . . . . . . . . . . . . . . . . . . 22 Regulatory . . . . . . . . . . . . . . . . . . . . . . . . . 23
Develop a schedule . . . . . . . . . . . . . . . . . . . . . . 23 The waste assessment methodology . . . . . . . . . . . . . . . . . 23 Do the waste assessments . . . . . . . . . . . . . . . . . . . . 23 Name the waste assessment team(s) . . . . . . . . . . . . . . . 25 Review the available data . . . . . . . . . . . . . . . . . . . 25 Do input materials and waste stream characterizations . . . . . 26 Visit the site(s) . . . . . . . . . . . . . . . . . . . . . . . 27 Do material, energy, and water balances . . . . . . . . . . . . 28 Do waste stream summary . . . . . . . . . . . . . . . . . . . . 2 9
Select pollution prevention options . . . . . . . . . . . . . . . 30 Option generation . . . . . . . . . . . . . . . . . . . . . . . 30 Option description . . . . . . . . . . . . . . . . . . . . . . 35
Do feasibility analyses . . . . . . . . . . . . . . . . . . . . . 35 Technical/environmental . . . . . . . . . . . . . . . . . . . . 36 Economic . . . . . . . . . . . . . . . . . . . . . . . . . . . 37
Write waste assessment reports . . . . . . . . . . . . . . . . . 38
I
CONTENTS.. Continued
Write summary assessment report . . . . . . . . . . . . . . . . . Maintenance of the pollution prevention program . . . . . . . . . . Implementaplan . . . . . . . . . . . . . . . . . . . . . . . . Selectprojects . . . . . . . . . . . . . . . . . . . . . . . . Obtainfunding . . . . . . . . . . . . . . . . . . . . . . . . Implement the P2 opportunities . . . . . . . . . . . . . . . . Do post-implementation . . . . . . . . . . . . . . . . . . . .
Measure progress . . . . . . . . . . . . . . . . . . . . . . . . Collect data . . . . . . . . . . . . . . . . . . . . . . . . . Analyze data variations . . . . . . . . . . . . . . . . . . . . Analyze results . . . . . . . . . . . . . . . . . . . . . . . .
Maintain the pollution prevention program . . . . . . . . . . . . Educate staff . . . . . . . . . . . . . . . . . . . . . . . . . Maintain internal communication . . . . . . . . . . . . . . . .
Do public outreach and education . . . . . . . . . . . . . . . Summary . . . . . . . . . . . . . . . . . . . . . . . . . . . . . .
References . . . . . . . . . . . . . . . . . . . . . . . . . . . .
Appendix A.-Standard operating practices for pollution prevention .
. Reward employees . . . . . . . . . . . . . . . . . . . . . . .
Acknowledgments . . . . . . . . . . . . . . . . . . . . . . . . . .
Bibliography . . . . . . . . . . . . . . . . . . . . . . . . . . .
Appendix B.-Checklist for common pollution prevention methods . . . Appendix C.-Pollution prevention worksheets . . . . . . . . . . . . Appendix D.-Option rating . weighted sum method . . . . . . . . . . Appendix E.-EPA technical/financial assistance programs . . . . . .
iv
Page
38 39 39 41 41 41 41 41 41 42 42 44 44 44 45 45 46 47 48 50 51 52 55
113 115
ILLUSTRATIONS
1 . Environmental management options hierarchy . . . . . . . . . . . 4 2 . Pollution prevention program overview . . . . . . . . . . . . . 10 3 . Implementation of the pollution prevention program . . . . . . . 12 4 . Waste assessment methodology . . . . . . . . . . . . . . . . . . 24 5 . Maintenance of the pollution prevention program . . . . . . . . 40
TABLES
1 . Initial P2 data to be collected at each operation . . . . . . . 19 2 . Examples of pollution prevention methods for mining and
3 . List of pollution prevention worksheets . . . . . . . . . . . . 56 milling operations . . . . . . . . . . . . . . . . . . . . . . . 31
I -
POLLUTION PREVENTION
IN
MINING AND MINERAL PROCESSING
WASTE ASSESSMENTS
FOR
MINES AND MILLS
By Daniel S. Witkoweky’
ABSTRACT
The Pollution Prevention Act of 1990 provides few specifics to assist the non-fuel mining and mineral processing industries of the United States in achieving pollution prevention (P2) compliance. The U.S. Bureau of Mines (USBM) recognizes the absence of specific information to reduce pollution impacts from mining and mineral processing of hardrock and industrial minerals. Therefore, the USBM has prepared this publication to help reduce or eliminate environmental pollution and to assure the viability of these segments of the domestic mining industry.
This report includes worksheets designed to help operators of mining and milling facilities to establish a P2 program. The report can also be used by citizen and environmental groups, State and local governments, and academia to gain an understanding of P2 as it relates to mining and mineral processing.
I
’ Metallurgical engineer, Minerals Availability Field Office, U.S. Bureau of Mines, Building 20, Denver Federal Center, Denver, CO 80225; telephone (303) 236-5209, extension 264; FAX (303) 2364208.
l -
2
INTRODUCTION
llPollutionlT as defined by the U.S. Environmental Protection Agency (EPA) is, "Generally, the presence of matter or energy whose nature, location, or quantity produces undesired environmental effects." (1)' Pollution in the United States has historically been controlled and managed through EPA's development of standards, promulgation of regulations, and enforcement of the law with an emphasis on end- of-pipe solutions.
During recent years, pollution control efforts have begun to emphasize llsource reduction" for reducing or eliminating the volume and toxicity of wastes. Generally speaking, source reduction is any practice that reduces the amount of any hazardous substance, pollutant, or contaminant released into the environment prior to recycling, treatment , and disposal. It is considered to be the best long-term, cost-effective solution to problems associated with pollution.
The Pollution Prevention Act of 1990 (2) establishes source reduction as a national priority. Source reduction is preferred over options of decreasing desirability, i.e., recycling, followed by treatment, and then disposal. The act is profound in the sense that prior environmental legislation had generally relied upon "end-of -pipe" management of wastes, which entailed enforcement of programs and policies
'Italic numbers in parentheses refer to items in the list of references preceding the appendixes at the end of this report.
~
addressing wastes following their generation. Because end-of-pipe management of wastes has been the norm, traditionally there have been few, if any, incentives to industry to reduce waste generation.
Most literature on pollution prevention (P2)3 focuses on the chemical and manufacturing industries, not mining and milling, and the resulting wastes produced from these industries. Due to this scarcity of P2 literature germane to the mineral industries , the U. S . Bureau of Mines (USBM) developed this publication based upon EPA's Fac i 1 it y Pollution Prevention Guide ( 3 ) . It is felt that this Bureau report will help correct the deficiency and address the unique opportunities for P2 which exist within the hardrock and industrial minerals industries.
This publication provides a methodology for P2 to operators of non-fuel mining and mineral processing facilities, including heap and dump leaching, who are concerned about the balance between protecting the environment and maintaining "their bottom line." It emphasizes that an effective P2 program can yield cost savings that will more than offset program development and implementation costs.
3The acronym " P 2 for "pollution prevention" has gained widespread acceptance by not only industry, academia, and government during the past years, but also by the public and members of the environmental community. Because of this acceptance, "P2," as it refers to pollution prevention, is used throughout the remainder of this paper, including appendixes.

3
POLLUTION PREVENTION AND MINING
WHAT IS POLLUTION PREVENTION (P2)?
"An ounce of prevention is worth a pound of cure.Il
-Benjamin Franklin Poor Richard's Almanac
Benjamin Franklin's simple proverb has survived the test of time for the past 200 years. It has undoubtedly influenced thinking that has had a profound effect on how the United States views its waste problems and, most recently, on how the country deals with those problems. One recent approach is the Pollution Prevention Act of 1990. Passed as part of the Budget Reconciliation Act of 1990, this act establishes source reduction as a "national policy" of highest priority in environmental management.
For this report, "pollution prevention1# as defined by the EPA ( 3 , p. 4 ) is:
l l . . .the maximum feasible reduction of all wastes generated at production sites. It involves the judicious use of resources through source reduction, energy efficiency, reuse of input materials during production, and reduced water consumption. There are two general methods of source reduction that can be used in a pollution prevention program: product changes and process changes. They reduce the volume and toxicity of production wastes and end-products during their life-cycle and at disposal.
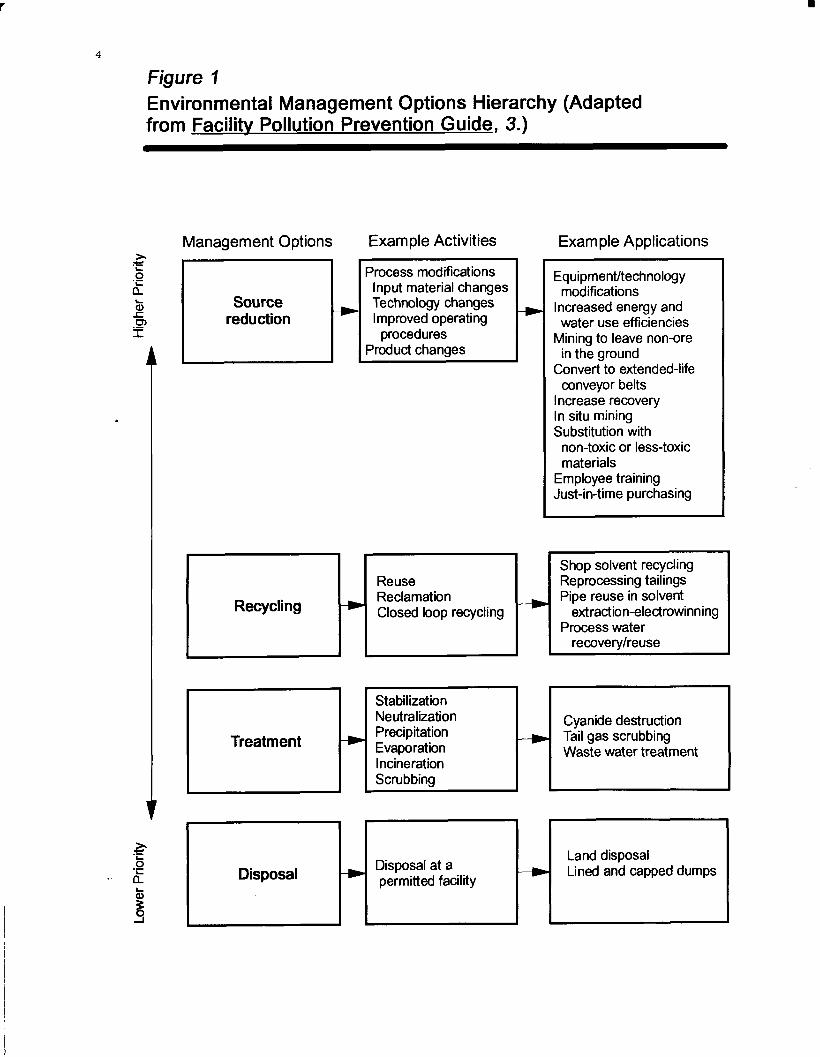
The environmental management options hierarchy ( 3 , p. 5 ) , shown in figure 1, provides examples of
source reduction for the mining and mineral industries, while also differentiating source reduction from recycling, treatment, and disposal. Options are shown in column 1 in decreasing order of desirability, from top to bottom. Preventing pollution through source reduction is the preferred opt ion, i .e. , the highest priority. Less desirable options are recycling wastes, if they cannot be prevented at the source; treatment of wastes, if they cannot be prevented at the source or recycled; and, as a last resort, disposal of wastes, if they cannot be prevented at the source, recycled, or treated.
As seen in figure 1, source reduction can be achieved through process and product changes. Process modifications, as shown in figure 1, involve changes to input materials, technology, and operating procedures.
Product changes in mining and mineral processing involve changes in composition of intermediate or end products.
The EPA definition also includes energy and water conservation as methods of "source reduction" within the realm of P2. Energy and water can be conserved through incorporation of efficient operating practices and through product changes.
THE NEED FOR A PUBLICATION ON P2 FOR MINING AND MINERAL PROCESSING
Bureau data (4, p. 16) indicate that in 1992, 1 billion metric tons of wastes, exclusive of materials from wells, ponds, and pumping operations, were produced from the surface and underground mining of 1.9 billion
Stabilization Neutralization Precipitation + Evaporation Incineration Scrubbing
4
Figure 7 E n vi ro n menta I M an a g em en t 0 p t i o n s H i e ra rc h y (Ad a p t e d from Facility Pollution Prevention Guide, 3.)
Cyanide destruction Tail gas scrubbing Waste water treatment
.- E
.- b
Management Options Example Activities Example Applications
Recycling
Treatment r- Disposal
Process modifications Input material changes Technology changes Improved operating procedures
Product changes /1
Reuse Reclamation Closed loop recycling
~ ~~ ~~
Equipmentltechnology modifications
Increased energy and water use efficiencies
Mining to leave non-ore in the ground
Convert to extended-life conveyor belts
Increase recovery In situ mining Substitution with
non-toxic or less-toxic materials
Em plo yee training Just-in-time purchasing
1 Shop solvent recycling Reprocessing tailings Pipe reuse in solvent
Process water extraction-electrowinning
recoveryheuse
t Disposal at a permitted facility
I
Land disposal Lined and capped dumps
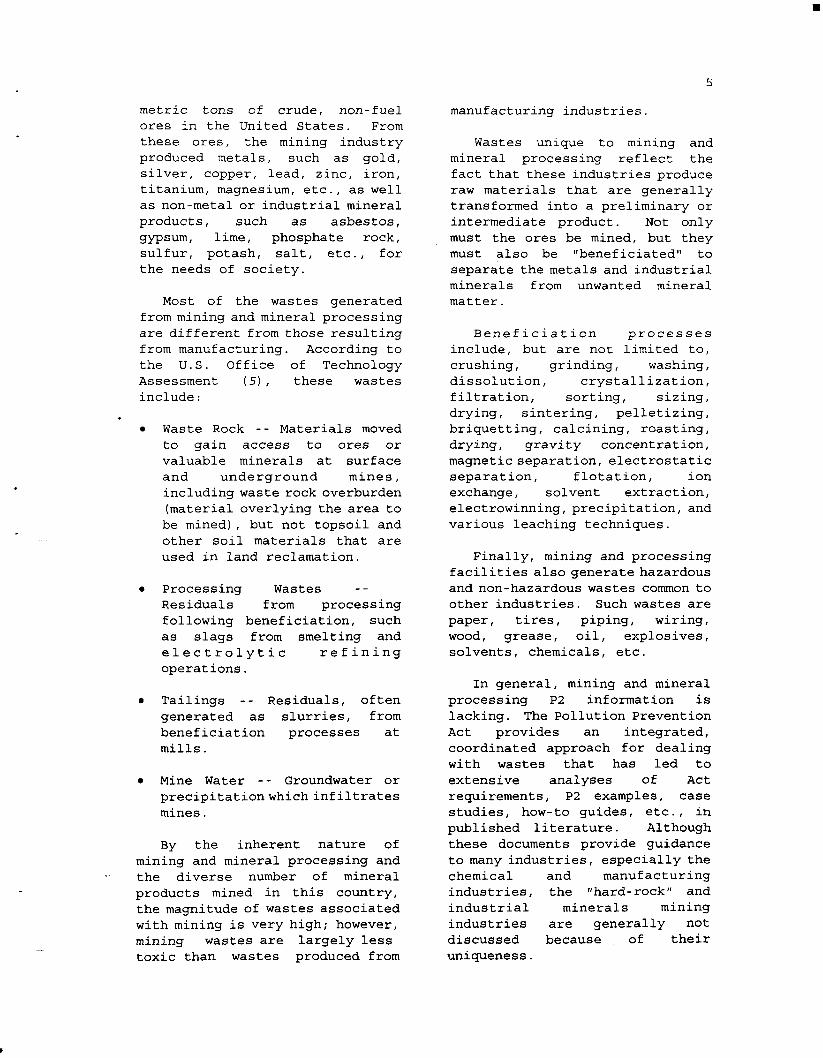
5
metric tons of crude, non-fuel ores in the United States. From these ores, the mining industry produced metals, such as gold, silver, copper, lead, zinc, iron, titanium, magnesium, etc., as well as non-metal or industrial mineral products, such as asbestos, gypsum, lime, phosphate rock, sulfur, potash, salt, etc., for the needs of society.
Most of the wastes generated from mining and mineral processing are different from those resulting from manufacturing. According to the U.S. Office of Technology Assessment (5) , these wastes include :
Waste Rock - - Materials moved to gain access to ores or valuable minerals at surface and underground mines, including waste rock overburden (material overlying the area to be mined), but not topsoil and other soil materials that are used in land reclamation.
e Processing Wastes - - Residuals from processing following beneficiation, such as slags from smelting and electrolytic refining operations.
0 Tailings - - Residuals, often generated as slurries, from beneficiation processes at mills.
0 Mine Water - - Groundwater or precipitationwhich infiltrates mines.
By the inherent nature of mining and mineral processing and
. the diverse number of mineral products mined in this country, the magnitude of wastes associated with mining is very high; however, mining wastes are largely less toxic than wastes produced from
manufacturing industries.
Wastes unique to mining and mineral processing reflect the fact that these industries produce raw materials that are generally transformed into a preliminary or intermediate product. Not only must the ores be mined, but they must also be "beneficiatedl1 to separate the metals and industrial minerals from unwanted mineral matter.
Beneficiation processes include, but are not limited to, crushing, grinding, washing, dissolution, crystallization, filtration, sorting, sizing, drying, sintering, pelletizing, briquetting, calcining, roasting, drying, gravity concentration, magnetic separation, electrostatic separation, flotation, ion exchange, solvent extraction, electrowinning, precipitation, and various leaching techniques.
Finally, mining and processing facilities also generate hazardous and non-hazardous wastes common to other industries. Such wastes are paper, tires, piping, wiring, wood, grease, oil, explosives, solvents, chemicals, etc.
In general, mining and mineral processing P2 information is lacking. The Pollution Prevention Act provides an integrated, coordinated approach for dealing with wastes that has led to extensive analyses of Act requirements, P2 examples, case studies, how-to guides, etc. , in published literature. Although these documents provide guidance to many industries, especially the chemical and manufacturing industries, the "hard-rock" and industrial minerals mining industries are generally not discussed because of their uniqueness.
6
WHY THE MINERALS INDUSTRY NEEDS TO “RELIE” ON P2
The unique wastes associated with mining and processing create unique treatment problems for which implementation of P2 makes good sense. P2 should form an essential part of every operation‘s immediate or short- term (within 1 year or less), mid- term (1 to 10 years), and long- term (greater than 10 years) strategies for success, although the benefits and incentives which exist for the operator may not be immediately obvious.
The ultimate form of source reduction, as applied to mining, could be, toDon’ t mine! It If there Gere no mining, there certainly would exist no need for P2 as applied to mining operations. This concept is impractical, however, when one considers that the United States must have an adequate, uninterrupted, and dependable supply of minerals and materials to meet its national security and economic needs at acceptable social, environmental, and economic costs.
Although mining cannot be performed without generating non- usable waste materials, source reduction in mining and processing operations, if properly implemented, can actually demonstrate benefits to efficiencies of operation. Properly implemented, there are several incentives for incorporation of P2 at every mine and processing facility. These incentives can be remembered by using the acronym, ItRELIE,” for the following incentives:
~ R = Regulatory E = Economic L = Liability I = Image E = Environmental and human
health.
Regulatory Incentives - It’s the Law
The EPA is charged by Congress with protecting the Nation’s air, land, and water resources. Under a mandate of national environmental laws, the Agency seeks to formulate and implement actions leading to a compatible balance between human activities and the ability of natural systems to support and nurture life.
The EPA‘ s Administrator indicated, in December 1993, that the agency is clear in sending ! I . . . a message to the public and to industry that pollution does not pay. It (6) This is substantiated by the following:
0 In 1993 the EPA fined polluters $133.5 million in criminal and civil penalties and sent more violators to jail than in any previous year.
Financialpenaltiesassociated with Resource Conservation and Recovery Act (RCRA) violations alone increased 66%.
0 The EPA tallied 2,110 criminal a n d c i v i l c a s e s , administrative penalties, and consent decree enforcements during 1993, as compared to 1,935 actions in 1992.
The agency more than doubled the number of new case investigations started in 1993, as compared with 1992.
Althoughthese statistics apply to all industries, including mining and mineral processing, the message to all industries, including mining and mineral processing, is clear. An operator can reduce regulatory risks by aggressively pursuing a P2 program.
7
Economic Incentives -- It Pays to Reduce Waste
End-of-pipe pollution control strategies are costly, and "the cost of managing waste is escalating at a rate of 20 to 30 percent per year," according to the Texas Water Commission (7). P2, on the other hand, has been shown to reduce or eliminate industrial treatment and disposal costs. As such, P2 practices are an extension of the simple, yet powerful, idea that it makes better economic sense to prevent the generation of waste, rather than develop complex and costly - treatment schemes to treat wastes after they have been generated. P2 is simply good business for the mine operator and mineral processor.
A good example is Minnesota Mining and Manufacturing (3M) Co.'s nPollution Prevention Pays" Program that has eliminated the annual generation of more than 450,000 metric tons of pollutants, according to the Center for Hazardous Materials Research ( B ) , and has resulted in a cumulative savings of $426 million since the program began in 1975.
P2 can result in considerable savings by reducing operating costs associated with waste disposal and those associated with the consumption of raw materials, water, and energy. It can also negate increases in insurance costs or the inability to obtain insurance, both of which result in higher operating costs for treatment and disposal, or the loss of treatment or disposal capacity. Still another benefit to practicing P2 is reduced occupational health exposures to employees when toxic usage is
reduced or eliminated. One possible way to reduce such expense is to reduce the cause of liability, which equates to reducing the quantity of pollutants at a mine or mill.
Economic pressures are encouraging the mining and mineral processing industries to be more efficient in management of their wastes, especially toxic and hazardous pollutants. Many operators are finding that it pays to prevent generation of pollutants, and that dividends reaped from reducing waste will continue to increase in the future.
Liability Incentives -- It's the Operator's Responsibility
RCRA is very explicit in its definition of hazardous wastes (9) and generator responsibilities. According to RCRA, the generator of a hazardous waste is responsible for such waste from "cradle to grave, (I i .e., once an operation generates a hazardous waste, the operator is legally responsible for that waste forever. This has resulted in what many insurance experts now call the "liability crisis, IT which has resulted in huge increases in liability insurance premiums during the last several years due to increasing numbers of lawsuits against hazardous waste generators involved in accidental spills and leaking disposal sites, according to the Texas Water Commission ( 7 ) .
In addition, Federal and State laws have set a precedent that generators of hazardous waste are at least partially responsible for the cleanup of wastes which leak from disposal sites. This
I
8
precedent could cost operators who generate hazardous wastes huge sums of money in the future.
Every operator is also aware that liability is not limited to hazardous wastes. Operators are also liable for cleanup of non- RCRA regulated mining wastes. Superfund, or Comprehensive Environmental Response, Compensation, and Liability Act (CERCLA) of 1980, sites, such as California Gulch (Leadville) , Colorado, and Silver Bow Creek/Butte Area, Montana, are examples which illustrate such non-hazardous mining waste clean- ups.
Image of the Industry -- It’s the Right Thing to Do
The mining and mineral processing industries have often been viewed negatively by the general public. This is partially due to the public becoming more concerned and better informed about environmental issues. The public is also increasing its awareness of the potential effects which many wastes and the release of such wastes to the environment can have on human health.
Companies which demonstrate through P2 accomplishments that they are self-regulating, environmentally responsible corporate citizens will improve their image with the public. The “publicf1 is every mine and mill’s next-door neighbor.
- Environment and Human Health - It’s the Future of Mining
P2 has been cited as a unique, first-line approach to utilization
of technology to address global environmental issues through sustainable development, It
according to Air and Waste ( 1 0 ) . This includes effects upon global climate and the environment through human activities. The increasing importance of sustainable development issues provides support to the development of P2 as a key element of any operation’s environmental strategy as it relates to the future of the mining industry.
Every responsible operator believes that there can be no cost benefit to an operation if human health, or the environment, or both, are threatened or degraded. This belief forms the basis of responsible mining. Protection of human health and the environment has become mandatory for industry.
P2 EXAMPLES IN MINING AND MINERAL PROCESSING
Exactly how P2 can be incorporated will vary from operation to operation, but several universal examples of P2 are generally applicable to all operations, as well as to many other industries. These exafitples are presented in appendix A. Many historic mining practices are examples of good P2 practices and are part of efficient production practices.
One practice, for example, is that of ore grade control to keep mill grade out of heap leach grade and to segregate waste from ore. Often, lllow-gradell ore is really ore diluted with waste rock. Ore excavation equipment, for example, can be selected to reduce dilution of ore with waste and thus control grade and resulting prof it,
I
9
l - according to Banks (11). Hydraulic excavators can have a significant impact on ore control, due to their ability to dig tight material, particularly compared to wheel loaders. The most selective of all pieces of mining equipment is the backhoe. The operator has precise control of bucket placement and amount of material in the bucket and, when trucks are loaded, the operator has an unobstructed view of material in the truck. It does require a prepared bench on which to work, but has limited reach when material rolls down the face. A
backhoe can be used to mine more selectively than can a hydraulic shove 1 , since backhoes can selectively dig anywhere in the bank face. As a result, more rock can be left undisturbed.
Only slightly less selective than the hydraulic backhoe is the hydraulic shovel. The shovel also can place its bucket anywhere in the face to selectively load material. It can load blocky material and can move to pick up spilled material.
IMPLEMENTATION OF THE POLLUTION PREVENTION PROGRAM
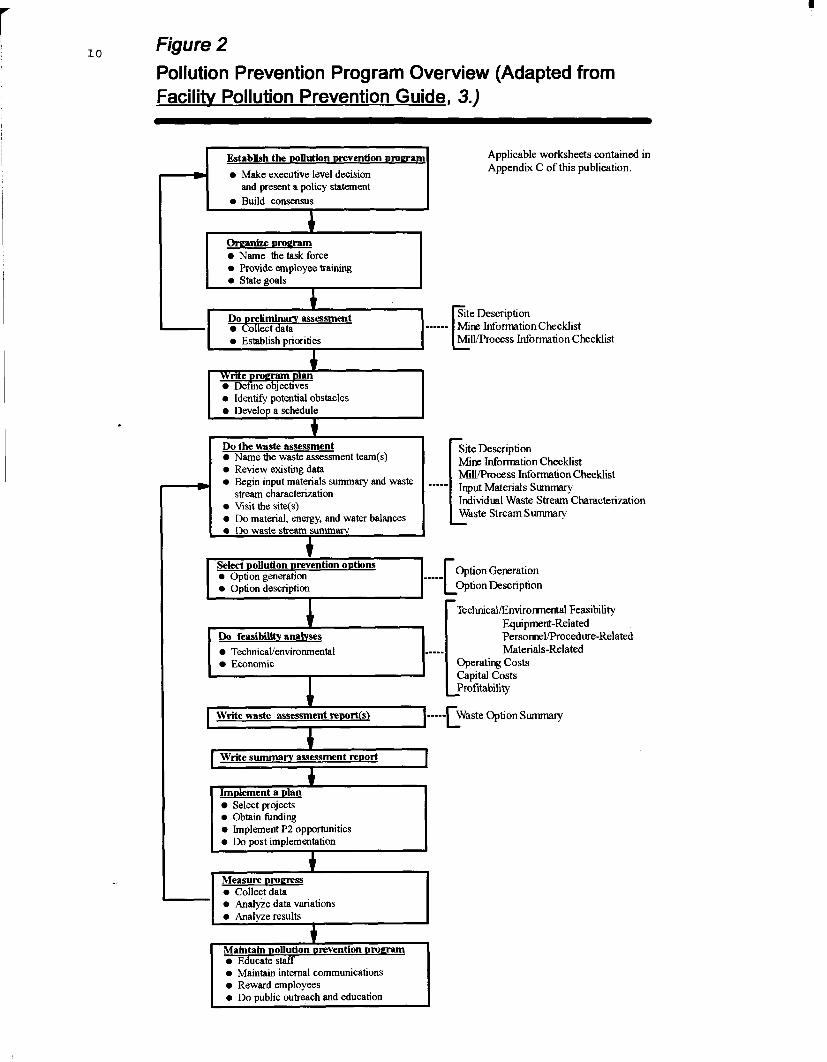
To implement P2, a systematic approach will produce better results than will piecemeal efforts. The EPA's generic approach ( 3 ; has been adapted by the USBM to be more specific to the mining and mineral processing industries. This approach is diagrammed in figure 2.
The top four boxes, or steps in the process, shown in figure 2 comprise the imp 1 emen t a t ion I' phase of the P2 program. The next five steps comprise the "waste assessment" phase, and the last three steps the rlmaintenance!t phase. Each phase is described in detail in this report. A step-by- step approach is presented which is best used in conjunction with the generic worksheets presented in appendix C to assist an operator in developing a P2 program.
Adopting a systematic approach for adopting P2 requires a new attitude about waste generation and environmental pollution. Traditional thinking places all the responsibility and resulting
credit (or blame) fo r pollution control upon management and/or upon the environmental staff. P2, however, becomes the specific responsibility of every employee. Preventing pollution, as opposed to controlling pollution, may be a relatively new role for production-oriented managers, miners, and mill workers, but cooperation of all employees is crucial for the success and longevity of an operation. It is generally in everyone's best interest to enhance the source of their employment and to create a healthier work environment. As such, it is critical that P2 be incorporated into both short, mid, and long range planning.
In summary, the problems associated with waste generation may be addressed with source reduction, recycling, . treatment, and disposal. Logically, if waste generation can be avoided or minimized, savings can be realized, and an operator can be perceived as environmentally aware and responsible. As shown in the
I
Select poUution urevention outions
0 Option description 0 Option generation
10
Option Generation Option Description c --..-
Figure 2 Pollution Prevention Program Overview (Adapted from Facilitv Pollution Prevention Guide, 3.)
Establish the pollution prevention ~ r ~ m p m
0 Make executive level decision and present a policy statement
e I %e i z o r c e 0 Provide employee training
~~~ ~
Do~reliminarv assessment - Collectdata 0 Establish priorities
4 I
. Write uroglnm plan 0 Defme obiectives 1
I 0 Identifv &entia1 obstacles I I 0 Develdpa schedule I i
I ~~ ~
Do the waste assessment Name the waste assessment team(s)
0 Review existing data 0 Begin input materials summary and waste
0 Visit the site(s) 0 Do material, energy, and water balances 0 Do waste siream s u m "
stream characterization
4
....
Applicable worksheets contained in Appendix C of this publication.
- Site Description WIE InformationChecklist Milllprocess Information Checklist -
- Site Description Mine Infomtion Checklist MiUProcess Information Checklist Input Materials Summary Individual Waste Stream Characterization Waste Stream Summary -
TechnicalEnviromerhal Feasibility Equipment-Related
Do feasibility analyses PersonneVProcedure-Related TecbnicaVenvironmental Materials-Related Economic Operating Costs
Capital Costs
Write waste assessment reportkl f----Lwaste Option summaq
Write summary assessment rep014 I i
Imolement a plan Select projects
0 Obtain hnding 0 Implement P2 opportunities 0 Do post implementation
0 Collect data 0 Analyze data variations
. Maintain pollution prevention Pmefam 0 Educate staff 0 Maintain internal communications 0 Reward employees
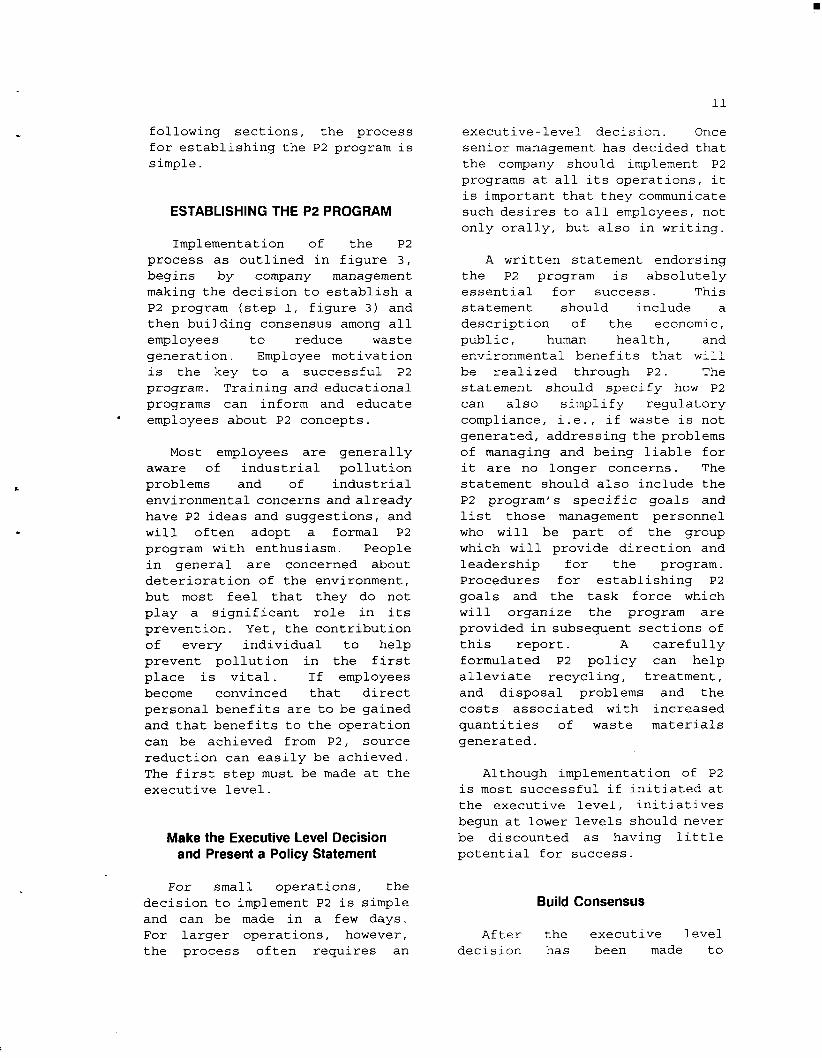
following sections, the process for establishing the P2 program is simple.
ESTABLISHING THE P2 PROGRAM
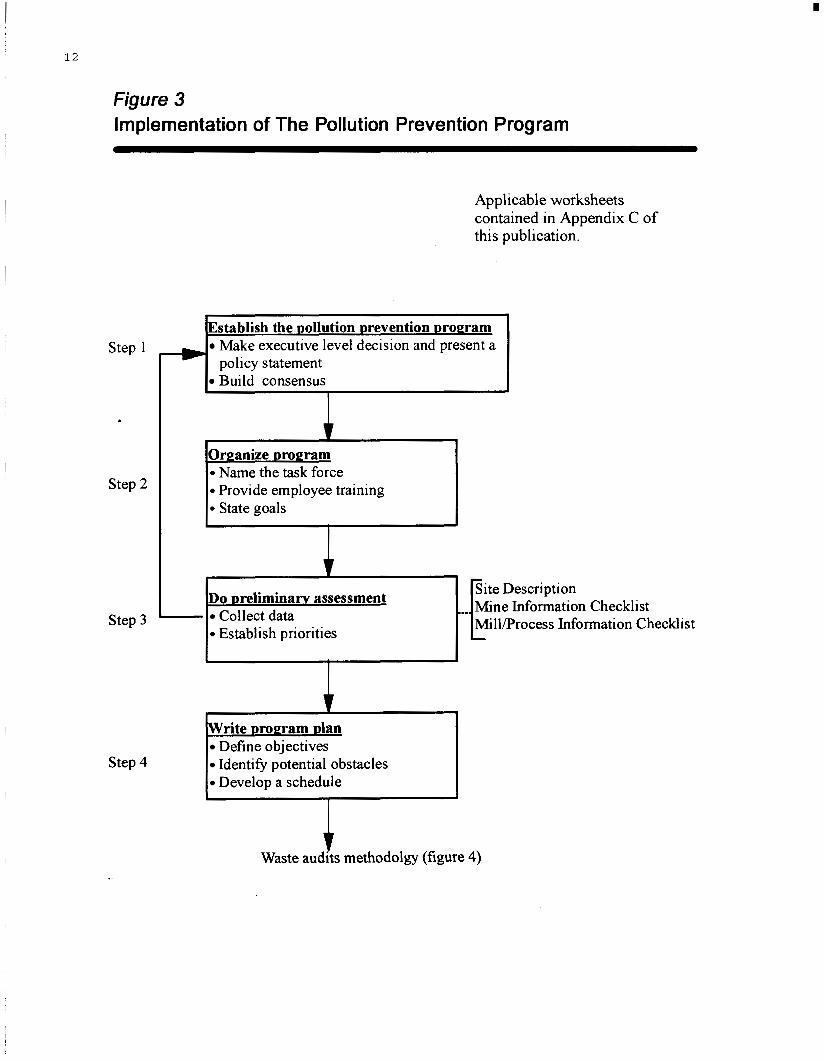
Implementation of the P2 process as outlined in figure 3, begins by company management making the decision to establish a P2 program (step 1, figure 3 ) and then building consensus among all employees to reduce waste generation. Employee motivation is the key to a successful P2 program. Training and educational programs can inform and educate employees about P2 concepts.
Most employees are generally aware of industrial pollution problems and of industrial environmental concerns and already have P2 ideas and suggestions, and will often adopt a formal P2 program with enthusiasm. People in general are concerned about deterioration of the environment, but most feel that they do not play a significant role in its prevention. Yet, the contribution of every individual to help prevent pollution in the first place is vital. If employees become convinced that direct personal benefits are to be gained and that benefits to the operation can be achieved from P2, source reduction can easily be achieved. The first step must be made at the executive level.
Make the Executive Level Decision and Present a Policy Statement
For small operations, the decision to implement P2 is simple and can be made in a few days. For larger operations, however, the process often requires an
executive-level decision. Once senior management has decided that the company should implement P2 programs at all its operations, it is important that they communicate such desires to all employees, not only orally, but also in writing.
A written statement endorsing the P2 program is absolutely essential for success. This statement should include a description of the economic, public, human health, and environmental benefits that will be realized through P2. The statement should specify how P2 can also simplify regulatory compliance, i.e., if waste is not generated, addressing the problems of managing and being liable for it are no longer concerns. The statement should also include the P2 program’s specific goals and list those management personnel who will be part of the group which will provide direction and leadership for the program. Procedures for establishing P2 goals and the task force which will organize the program are provided in subsequent sections of this report. A carefully formulated P2 policy can help alleviate recycling, treatment, and disposal problems and the costs associated with increased quantities of waste materials generated.
Although implementation of P2 is most successful if initiated at the executive level, initiatives begun at lower levels should never be discounted as having little potential for success.
Build Consensus
After the executive level decision has been made to
12
*
Figure 3 Implementation of The Pollution Prevention Program
Establish the Dollution mevention prowam Make executive level decision and present a policy statement Build consensus
Step 1
. Mine Information Checklist Checklist
Do preliminarv assessment Collect data
0 Establish priorities
Step 2
Write Dropram Dlan Define objectives Identify potential obstacles Develop a schedule
Step 3
Applicable worksheets contained in Appendix C of this publication.
Step 4
r
13
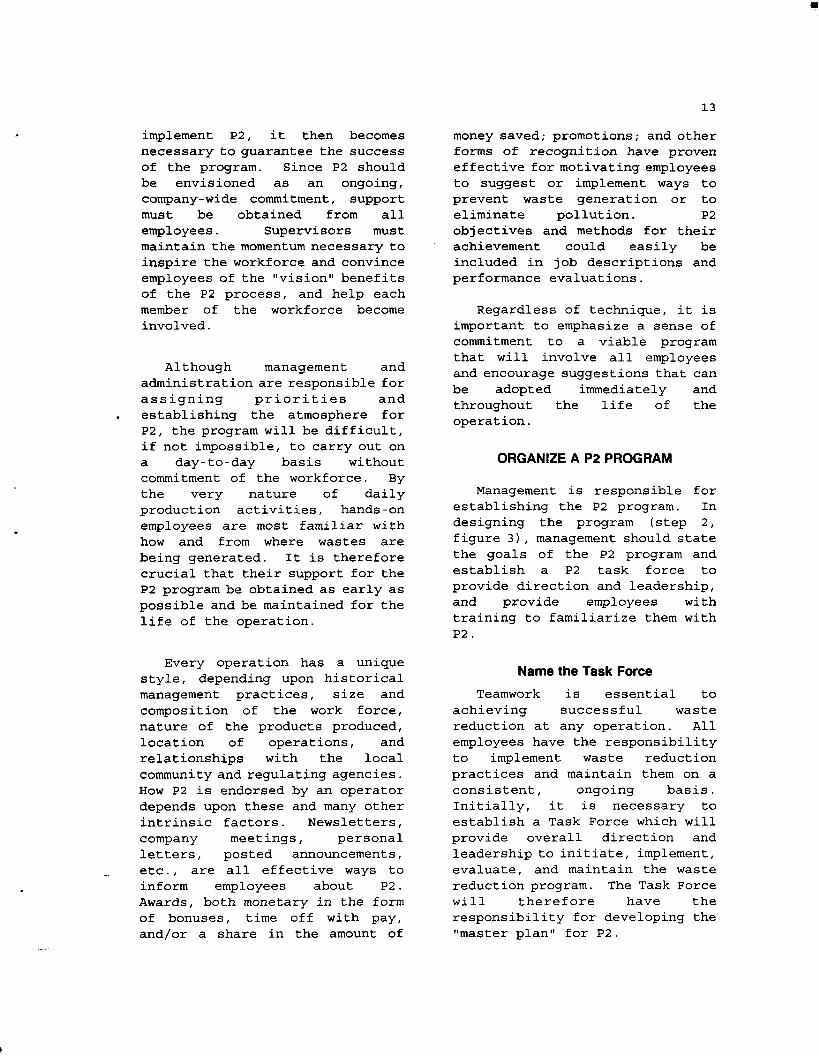
implement P2, it then becomes necessary to guarantee the success of the program. Since P2 should be envisioned as an ongoing, company-wide commitment, support must be obtained from all employees. Supervisors must maintain the momentum necessary to inspire the workforce and convince employees of the "vision" benefits of the P2 process, and help each member of the workforce become involved.
Although management and administration are responsible for assigning priorities and . establishing the atmosphere for P2, the program will be difficult, if not impossible, to carry out on a day-to-day basis without commitment of the workforce. By the very nature of daily production activities, hands-on employees are most familiar with how and from where wastes are being generated. It is therefore crucial that their support for the P2 program be obtained as early as possible and be maintained for the life of the operation.
Every operation has a unique style, depending upon historical management practices, size and composition of the work force, nature of the products produced, location of operations, and relationships with the local community and regulating agencies. How P2 is endorsed by an operator depends upon these and many other intrinsic factors. Newsletters, company meetings, personal letters, posted announcements, etc., are all effective ways to inform employees about P2. Awards, both monetary in the form of bonuses, time off with pay, and/or a share in the amount of
money saved; promotions; and other forms of recognition have proven effective for motivating employees to suggest or implement ways to prevent waste generation or to eliminate pollution. P2 objectives and methods for their achievement could easily be included in job descriptions and performance evaluations.
Regardless of technique, it is important to emphasize a sense of commitment to a viable program that will involve all employees and encourage suggestions that can be adopted immediately and throughout the life of the operation.
ORGANIZE A P2 PROGRAM
Management is responsible for establishing the P2 program. In designing the program (step 2, figure 3 ) , management should state the goals of the P2 program and establish a P2 task force to provide direction and leadership, and provide employees with training to familiarize them with P2.
Name the Task Force
Teamwork is essential to achieving successful waste reduction at any operation. All employees have the responsibility to implement waste reduction practices and maintain them on a consistent, ongoing basis. Initially, it is necessary to establish a Task Force which will provide overall direction and leadership to initiate, implement, evaluate, and maintain the waste reduction program. The Task Force will theref ore have the responsibility for developing the !'master plan" for P2.
14
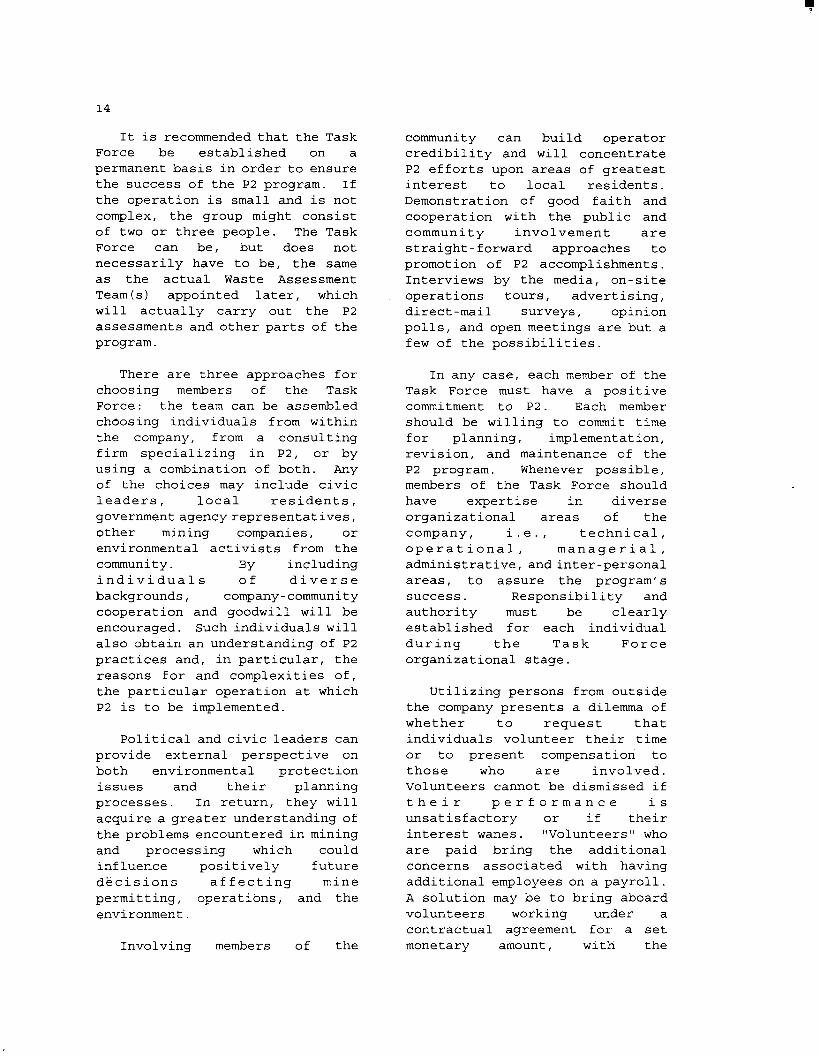
It is recommended that the Task Force be established on a permanent basis in order to ensure the success of the P2 program. If the operation is small and is not complex, the group might consist of two or three people. The Task Force can be, but does not necessarily have to be, the same as the actual Waste Assessment Team(s) appointed later, which will actually carry out the P2 assessments and other parts of the program.
There are three approaches for choosing members of the Task Force: the team can be assembled choosing individuals from within the company, from a consulting firm specializing in P2, or by using a combination of both. Any of the choices may include civic leaders, local residents, government agency representatives, other mining companies, or environmental activists from the community. By including individuals of divers e backgrounds, company-community cooperation and goodwill will be encouraged. Such individuals will also obtain an understanding of P2 practices and, in particular, the reasons for and complexities of, the particular operation at which P2 is to be implemented.
Political and civic leaders can provide external perspective on both environmental protection issues and their planning processes. In return, they will acquire a greater understanding of the problems encountered in mining and processing which could influence positively future decisions affecting mine permitting, operations, and the environment.
Involving members of the
community can build operator credibility and will concentrate P2 efforts upon areas of greatest interest to local residents. Demonstration of good faith and cooperation with the public and community involvement are straight-forward approaches to promotion of P2 accomplishments. Interviews by the media, on-site operations tours, advertising, direct-mail surveys, opinion polls, and open meetings are but a few of the possibilities.
In any case, each member of the Task Force must have a positive commitment to P2. Each member should be willing to commit time for planning, implementation, revision, and maintenance of the P2 program. Whenever possible, members of the Task Force should have expertise in diverse organizational areas of the company, i.e., technical, operational, managerial, administrative, and inter-personal areas, to assure the program' s success. Responsibility and authority must be clearly established for each individual during the Task Force organizational stage.
Utilizing persons from outside the company presents a dilemma of whether to request that individuals volunteer their time or to present compensation to those who are involved. Volunteers cannot be dismissed if t h e i r p e r f o r m a n c e i s unsatisfactory or if their interest wanes. "Volunteers" who are paid bring the additional concerns associated with having additional employees on a payroll. A solution may be to bring aboard volunteers working under a contractual agreement for a set monetary amount, with the
I
15
understanding that they must agree to a proprietary disclosure agreement. In any case, individual operations must decide on the best arrangements for these Task Force members.
The Task Force leader will be the key to the success of the program. He or she should be from supervision, management, or administration and a believer in the benefits of P2 as it relates to the short-, mid- and long-term planning necessary to achieve success at the operation. This individual should have sufficient authority and guaranteed funding sufficient to keep the program moving in a direction which will guarantee incorporation of P2 into the overall operating plan. The leader must facilitate the flow of information, both positive and negative, among all levels and portions of the operation. Ideally, the leader should be a dynamic individual whose credibility within the company will encourage participation from individuals within the operation.
Other team members of the Task Force might be selected or encouraged to volunteer, based upon their business and/or technical backgrounds. These individuals might be supervisors a n d f o r e m e n , u n i o n representatives, experienced mine or mill operators, purchasing representatives, or local community representatives. Selection of a variety of team members will assure operational
~ planning incorporates diverse P2 viewpoints and, more importantly, that the P2 philosophy and "visionv1 will be taken back to the work site.
Provide Employee Training
Employee training in P2 is mandatory in order to achieve maximum effectiveness of the P2 program.Whenever formal classroom training is required, some employees are quite supportive, but others may feel the best way people learn is to work on the job. So which option is better?
Programmed training often seems to be a low priority to some employees; consequently, they are often reluctant to support or become involved in specialized training within their respective departments. But supervisors concerned about P2 must emphasize P2 training for all their employees for a variety of reasons (12). Supervisors mdst determine:
What current and emerging issues and technology will influence the success of the department, the operation, and the company, and insure that training will help employees become aware of those issues.
What it takes to survive the current and emerging issues and formulate a strategy insuring which will insure the operation becomes or remains efficient and profitable.
How to educate people. Nothing, including turning P2 strategy into reality, can be accomplishedwithout competent, educated people.
How to market P2 within the company and program, maintain momentum by inspiring people, getting them to believe in the P2 "vision,11 and helping them to become directly responsible for achieving P2 at a mine and/or mill.

r
16
e How to set standards which to the operation mill and communicating
performance are important of a mine and its people, those same
standards to the employees, and evaluating accomplishments as measured against the standards.
Considering these issues, it would seem foolhardy to jeopardize projects, operating budgets, and careers to allow a workforce to casually learn P2 "only on the job." A poorly trained staff can weaken an operation and production, creating havoc for projects and careers and undermine the implementation of P2. Yet, the right P2 training can ensure above average performance of individuals and departments.
For maximum favorable implementation of a P2 program, each supervisor must not only be supportive, but encouraging as well. He or she must persuade those taking formal P2 training of its importance to not only the job, but also to the profitability and survival of the company. The supervisor must emphasize the priority management places upon employee training and the advantage of enhancing everyone's P2 skills. The supervisor must continually evaluate the training program and help each employee establish personal, specific goals which the employer can apply on the job.
State Goals
When a commitment to P2 has been adopted by management, the decision must be communicated in writing to all employees. Ideally, a formal policy statement
endorsing P2 should be announced. A corporate-wide policy statement takes on special significance if the company president's signature appears below it. This announcement must be followed by a request for commitment to P2 throughout the organization. Given these criteria, the P2 policy statement should indicate exactly which goals will be set and who will be involved. The policy statement should convey that the success of the program will likely require both changes in the operations and changes to organizational thinking.
Furthermore, the policy statement should provide meaningful, realistic goals, each of which must be:
Useful and meaningful for every employee ;
Challenging, yet reasonable, practical, and attainable;
Clearly defined;
Flexible ;
Included in the operation's long-term operating plan;
Quantitative, as well as qualitative;
Achievable by a certain target date.
Three legitimate, basic questions to the policy statement might be posed by employees. It is important that these questions be answered clearly, possibly as follows:
e Question: Why is it necessary for an operation to implement P2?
I
17
Answer: only to it also health ensure safety,
The operation needs not increase prof its, but needs to protect human and the environment, worker health and reduce the company' s
liability, and comply with Federal and State laws.
0 Question: What needs to be done to implement the P2 program?
Answer: The operation needs to eliminate or reduce quantities of all types of waste to help reduce operating costs and seek to improve efficiency of energy and water usage.
Question: Who will be responsible for implementing this program and ensuring its success?
Answer: Every employee, regardless of position or salary, will be responsible.
It is very advantageous not only to print the policy statement in the organization's newsletter, but also to post it on bulletin boards throughout all facilities to improve the changes for program success.
The Task Force leader should, from the start, answer these all questions related to P2 indicate their importance to only the short term, but also mid- and the long-term life of operation. If well answered, answers to these questions he 1 p bu i 1 d consensus concentrate effort.
and and not the the the can and
DO PRELIMINARY ASSESSMENT
One of the first tasks to be
undertaken by the P2 Task Force is a preliminary assessment of wastes at an operation (step 3, figure 3) to gather information of immediate value. A series of worksheets for copying is provided in appendix C to simplify the assessment process. The P2 program is a full-facility, multi-media study. All waste streams need to be examined, including solid non- hazardous, energy, and water, as well as the more traditional wastes. Envisioning each facility/operation completely surrounded by a box is often helpful. This helps the Task Force realize that every P2 program considers everything moving into and out of this imaginary box.
A copy of the first worksheet, "Site Description, should be filled out for each operational area. The Task Force may consider only one or two operational areas initially. This will permit rapid data generation and identification of low-cost-to-implement/high- benefit-to-the-operation P2 improvements which can be immediately implemented to
and therefore encourage continued management and employee commitment and support.
demons t rat e s u c c e s s It
The preliminary assessment may determine that shortcomings exist in the P2 program. For example, full executive commitment to the program may still be required, or consensus necessary to achieve success may not yet be in place. It may be necessary then to "step back" and review the P2 program as it is established. In figure 3, this reevaluation is graphically shown as a line "return" from step 3 back to step 1 at the beginning of the flow chart.
18
Collect Data
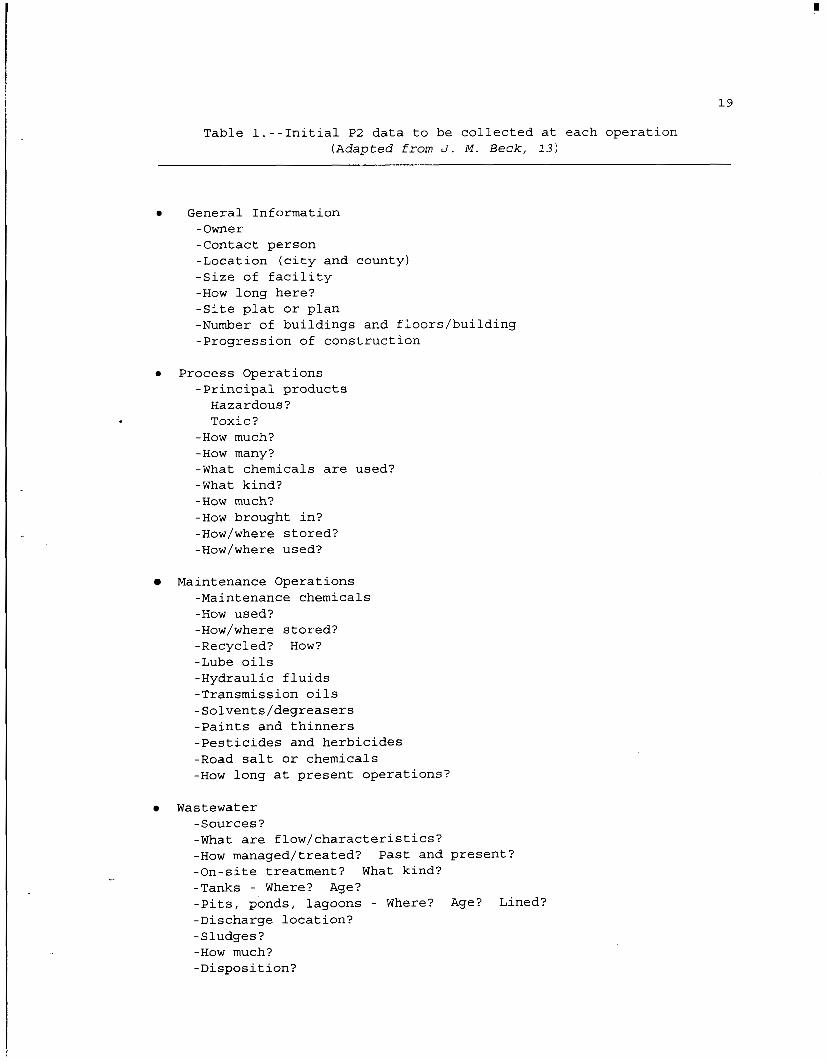
The key to successful P2 implementation (step 3, figure 3) is initial data gathering. Data collected during the preliminary assessment can be reviewed by the Task Force as a first step to enable the Task Force to establish priorities and procedures for writing a program plan. This process is accomplished using existing data. A general outline listing typical items for consideration is provided in table 1. The information obtained from the preliminary assessment of these data will form the fpundation of the actual waste assessment protocol and the P2 program plan.
If P2 data can be initially assembled and presented in a convincing manner to corporate leadership, or management for smaller operations, a commitment to develop, implement, and support a program is easier to obtain. The "Mine Information Checklistll and the I1Mill/Process Information Checklist" worksheets in appendix C can be utilized to maximize the amount of data assembled from available sources. Collection of data using these checklists will save time and minimize possible disruptions during later site visits.
Establish Priorities
Once data have been collected during the preliminary assessment, P2 priorities can be established (step 3, figure 3). Assigning
.priorities to specific operations, processes, and materials can then be accomplished. Such priorities will indicate which areas can best benefit from waste assessments.
During the preliminary assessment phase, the Task Force must begin to identify opportunities for P2 that are of concern within the operation and begin to work with management to establish priorities which will be addressed as parts of the short-, mid-, and long-range objectives of the program. For example, typical considerations, as modified from those presented in EPA's Facility Pollution Prevention Guide, (3) might include:
Cost/benefit potential;
Compliance with current and anticipated Federal, State, and local government regulations and requirements;
Lifecycle costs of pollution control vs. actual costs of waste management options (recycling, treatment, or disposal) ;
Potential environmental and safety liability;
Quantity of waste generated;
Hazardous properties of waste;
Practicality of P2;
Pot en t ial for removing bottlenecks in production or in the treatment of wastes;
Potential recovery of valuable byproducts;
Available budget for P2 assessment program and projects ;
Minimization of waste water discharges;
Reduction in energy usage.
I
19
Table 1.--Initial P2 data to be collected at each operation (Adapted from J. M. Beck, 13)
General Information -owner -Contact person -Location (city and county) -Size of facility -How long here? -Site plat or plan -Number of buildings and floors/building -Progression of construction
e Process Operations -Principal products Hazardous? Toxic?
-How much? -How many? -What chemicals are used? -What kind? -How much? -How brought in? -How/where stored? -How/where used?
0 Maintenance Operations -Maintenance chemicals -HOW used? -How/where stored? -Recycled? How? -Lube oils -Hydraulic fluids -Transmission oils -Solvents/degreasers -Paints and thinners -Pesticides and herbicides -Road salt or chemicals -How long at present operations?
Wastewater -Sources? -What are flow/characteristics? -How managed/treated? Past and present? -On-site treatment? What kind? -Tanks - Where? Age? -Pits, ponds, lagoons - Where? Age? Lined? -Discharge location? - Sludges ? -How much? -Disposition?
I
2 0
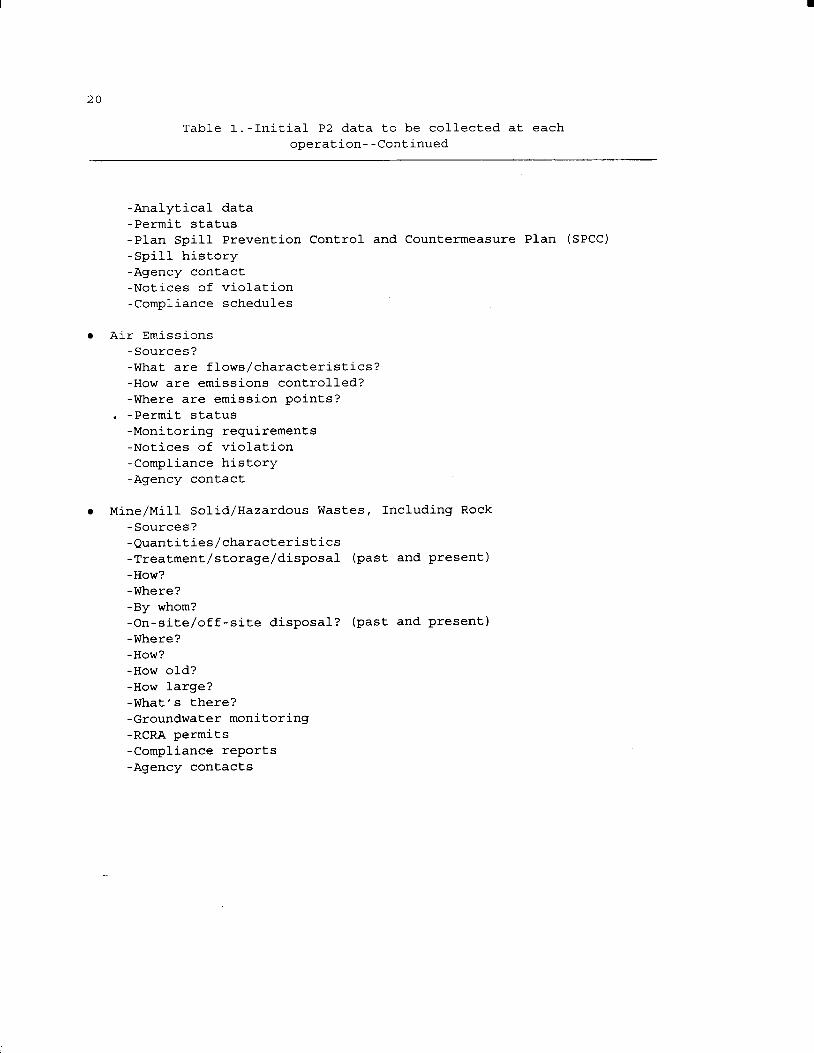
Table 1.-Initial P2 data to be collected at each operation--Continued
-Analytical data -Permit status -Plan Spill Prevention Control and Countermeasure Plan (SPCC) -Spill history -Agency contact -Notices of violation -Compliance schedules
Air Emissions -Sources? -What are flows/characteristics? -How are emissions controlled? -Where are emission points?
-Monitoring requirements -Notices of violation -Compliance history -Agency contact
. -Permit status
Mine/Mill Solid/Hazardous Wastes, Including Rock -Sources? -Quantities/characteristics -Treatment/storage/disposal (past and present)
-Where ? -By whom? -On-site/off-site disposal? (past and present) -Where ?
-How?
-How? -HOW old? -HOW large? -What's there? -Groundwater monitoring -RCRA permits -Compliance reports -Agency contacts
21
Establishing these priorities will enable preparation of the Program Plan.
WRITE PROGRAM PLAN
The output from the P2 Task Force is the formal, written P2 program plan (step 4 , figure 3 ) . Three essential items to include in the plan are the definition of objectives, the identification of potential opportunities for overcoming obstacles, and the development of a schedule for achieving specific goals.
Define Objectives
The objectives should be defined at each operation, or specifically, at each department within an operation. The size and nature of each operation is highly specific. The operator of a small mine might establish a single set of objectives to cover all phases of the operation. A large company with several mines might develop a corporate plan with broad goals, supplemented by individual goals for each specific operation and possibly even specific operating departments. Regardless of size, each operation should have both management and employee commitment as an objective in order to successfully identify potential opportunities.
The written program plan should include a schedule with objectives s t a t e d q u a n t i t a t i v e l y . Quantitative objectives are often difficult to prepare, but are more valuable than if they are only expressed qualitatively. Simply stated, everyone can understand a real number. For example, the objective to "reduce toxic waste discharges into the environment"
is qualitative in nature with no time frame. A quantitative objective might be: "Name waste assessment teams on first working day of the calendar year." Objectives which can be quantified as well as qualified more clearly specify a commitment to P2 and provide a means to measure progress.
P2 objectives must be flexible and adaptable to expected changes in operating conditions which will occur over the course of time. As the P2 program becomes more focused and the practicality and cost saving potential of certain P2 aspects become realized, objectives should be periodically reviewed and adjusted.
Identifying Potential Obstacles
Based upon the preliminary assessment and the specific objectives established for each operation, all potential obstacles which might impede the implementation of the P2 program must be identified and included as part of the program plan. Such obstacles will vary from operation to operation, as will the means for overcoming these obstacles. If the Task Force members have been selected using the recommendations presentedearlier, the obstacle identification process should not be difficult. Obstacles can be classified as e c o n o m i c , t e c h n i c a l , institutional, or regulatory, or a combination of these categories.
Economic
Cost-benefit considerations for implementing P2 may be anticipated, and the Task Force should recognize that some complex economic factors may need to be
I
22
addressed later. As an example, it is anticipated that many proposed P2 options will have initial costs for startup including formal class room training on P2 and equipment, repair, purchase, or replacement. Although most operators justify expenses of this type solely on the basis of short-term return on investment or cost effectiveness, it may prove necessary to demonstrate return on investment on the basis of how an investment may benefit the operation over a longer time period, even beyond the life of the orebody and into post production operations (lifecycle costs). Liability costs, external costs, and societal costs all can be potentially reduced over the life of the property and beyond.
Tec hn ica I
Information is needed about alternative procedures, how they may be integrated into the production process, and what effects may result. A technical change using a new or improved technology to reduce waste may make an operation considerably more efficient. By their nature, a mine and its associated mill are complex. A technical change may be simple and may be limited to an improvement which can be implemented without causing major disruption of production. The possible perception by management of loss of production may incorrectly be attributed to the implementation of P2. Therefore, it is always advisable to have at feast one individual from planning and from production to assist with the P2 planning process in order to alleviate such perceptions. For example, implementation may
change the process flow diagram, resulting in temporary downtime for modification of the operation. Every mill metallurgist would have serious concerns if feed head grades from the mine suddenly changed without notice and recoveries or product assays dropped in the mill. To alleviate such concerns, individuals from both planning and production can verify customer needs, adjust production rates, and then determine process flexibility in order to minimize the short term effects of process modification.
Institutional
As with any new program, general resistance to change within the organization may arise. IIWe've always done it this way!" is frequently heard when a change from the norm is proposed. Yet, promoting an awareness of organizational goals for undertaking a P2 study will generally overcome lack of commitment, poor communication, inflexible management, and general resistance to change.
The average worker is generally perceived as being concerned with job satisfaction, job security, promotions, pay, and safety and health on the job. Management is concerned with these same issues, but also has responsibility for "the bottom line," which is affected by productivity, costs of production, efficiency, return on investment, stockholder expectations, and potential liability. These additional management concerns, therefore, need to be considered and addressed in employee outreach and education throughout the organization to broaden the
2 3
opportunities for P 2 . To see all flexible enough to allow the issues from differing processing changes which will perspectives can increase promote P 2 . understanding by all employees and help to promote changes which can be of benefit to everyone. Develop a Schedule
Regulatory
Regulations may be a barrier to some P2 options. For example, a regulation-driven change may eliminate a hazardous solvent in favor of a non-hazardous, non- regulated solvent. Other examples might be to change the composition of the ore feed to a mill or . adding or reducing reagents to a mill circuit. As simple as these sound, however, they may require changes in existing permits.
The opportunity to incorporate a P2 plan with minimal impact resulting from existing regulations can potentially be simplified through close cooperation with the appropriate regulatory agencies. Hopefully, permitting agencies will be
The final aspect of planning the P2 program is t o list milestones, or reference points, within each of the phases from the waste assessment (step 5, figure 4 ) through implementation and assignment of realistic target dates. The target dates are important because they help quantify each objective. For example, the objective to "begin waste assessments at the operation during 1995" is qualitative in nature with no target date. It would be better to state: "Begin site visits for the waste assessments at the mill on the first working day of the fiscal year. Quantitative objectives with specific target dates clearly specify commitment to P2 and give a company a method to measure progress.
THE WASTE ASSESSMENT METHODOLOGY
The waste assessment phase is Write summary assessment comprised of five steps: report.
These steps are illustrated in 0 Do waste assessments; figure 4 and described in the
Select pollution prevention following sections.
opt ions ; DO THE WASTE ASSESSMENTS
0 Do feasibility analyses;
Write waste assessment reports;
Waste assessments (step 5 in figure 4) are designed to examine waste streams and then determine

24
Figure 4 Waste Assessment Methodolgy
Step 5
Step 6
step 7
Step 8
step 9
Implementation of the pollution prevention program (figure 3)
Do the waste assessment Name the waste assessmat t d s ) Review existing data &gin input materials summary and waste stream characterization Visit the site(s) Do material, energy, and water
Do waste stream summary balances
Applicable worksheets contained in Appendix C of this publication.
Site Description Mine Information Checklist Mill/Process Information Checklist Input Materials Summary Individual Waste Stream Characterization Waste Stream Summary -
0 Option generation Option Description
Do feasibilitv analy Ses
0 TechnicaVenviromtal 0 Economic
~
TechnicalEnvironmental Feasibility Equipment-Related PersonndDrocedure-Related Materials-Related
Operating Costs Capital Costs Profitability -
Write sunnnar~ assessment 1 ~ 0 r t
I Maintenance of the pollution prevention program (figure 5)
-
25
how and where such waste can be reduced or eliminated. The process is begun by establishment of a Waste Assessment team.
Name the Waste Assessment Team(s)
Each waste assessment is performed by a Waste Assessment Team. For a small operation, the Waste Assessment and the Task Force Teams may be one and the same. In larger operations, however, additional staff may be recruited to form the Waste Assessment Team or Teams. Members of the Waste Assessment Team can seek volunteers or appoint others who have a commitment to P2.
The ideal size for a Waste Assessment Team is three to six individuals. One member from the Task Force will be part of each Waste Assessment Team. The other members of the Team should include individuals with knowledge and responsibility for the specific areas and processes under review. A variety of backgrounds and responsibilities will provide the best possible P2 input to the data collection and its subsequent analysis. If possible, the Assessment Team should consist of a mix of an engineer, a manager, mine and mill workers, and individuals fromthe environmental staff, accounting, administration, and/or purchasing departments. By the nature of the fact that Waste Assessment Team members must be familiar with the areas and processes under review, it is advisable not to include individuals who are not employees.
It is important that Assessment Team members interact well, are interested and committed to P2,
want positive change, and are creative. Further, the Team Leader should be an individual who has experience and supervisory responsibility in day-to-day mine and mill operation.
Each Waste Assessment Team can have a relatively narrow focus. For example, it would work only in specific operational departments, identified in preliminary assessments. Or a Waste Assessment Team can be formed to work through various departments of the operation.
Waste Assessment Team members should initially be concerned with the most obvious opportunities for implementation of P2, the proverbial "low-hanging fruit. I 1
Such opportunities to correct obvious problems, may have simple solutions and can often result in a significant, fast return on time and money invested. Some simple changes are described in appendix B. Some changes may be implemented quickly with little or no disruption to operations and with minimal cost or risk. The greatest benefit to successful implementation of simple changes is the results, which can promote credibility and support for the more difficult changes. The comprehensive P2 program, however, will require more detailed analysis and discussion.
Review the Available Data
The goal of the P2 program is to eliminate or prevent pollution, not to collect data. The simpler the data collection program, the better. Much of the data may have existed prior to establishment of the P2 program or may have been collected during the preliminary
I
2 6
assessment. It makes no sense to collect data a second time if data are already available or if the data will not or cannot be utilized. Additional existing site evaluations and available information, if not previously reviewed, should be surveyed with the idea to reduce the time required for field data collection. To ensure all sources of data have been considered, the "Mine Information Checklist,Il and the IlMill/Process Information Checklistu1 worksheets in appendix C, completed earlier, should be reviewed again.
Do Input Materials and Waste Stream Characterizations
Information necessary to complete the IIInput Materials Summaryf1 and the IIWaste Stream Characterization" worksheets in appendix C can be based upon data already available to the Waste Assessment Team. A n operator will soon realize that much of the required information for the P2 assessment is already available from the day-to-day operating records and from regulatory reports and permits. Such information may include:
0 Production Records: Records from purchasing and shipping, accounting, marketing, inventory control, training, etc., may provide needed data and may identify opportunities for P2.
0 Operating Data: Engineering documents, including design
~ criteria; equipment operating manuals, may provide broad indications of waste streams which might be investigated.
Regulatory Reports: National Pollutant Discharge Elimination System (NPDES) documents will provide an initial source of data on volume and composition of waste water discharged.
Material Safety Data Sheets: Facility operators are required to prepare or have available Material Safety Data Sheets (MSDS) as required by the Occupational Safety and Health Administration (OSHA) for supplied and produced chemicals and materials. The sheets are available from all suppliers of the covered materials.
Environmental Impact Statements, Environmental Assessments, and Operating Permits: These documents are invaluable sources of information for newer mines.
Historical Data: For older properties, newspaper accounts, articles, and historic preservation files can provide critical information.
Government Reports: There is a wealth of materials available at libraries in Federal and State agencies; colleges and universities; public libraries, especially in a region where a mine is located; and state historical societies. Both the EPA and the USBM maintain libraries, in various cities, that are open to the public.
These are only a few examples of the many sources of information available. Detailed listings for advanced assessments are available in the literature (14).
I
27
Visit the Site(s)
Only after information from the preliminary assessment and all existing data have been used to complete the "Input Materials Summary" and the Individual Waste Stream worksheets, should missing data be collected by the Waste Assessment Team(s) by site inspections and through worker interviews. Site visits and interviews help the Assessment Team to verify available data, identify elements that may not be well-documented, and determine which information is still missing. If consultants . perform the waste assessment, it enables them to become familiar with the mine or mill and their operations.
Character i z a t ion
Site visits should be planned so as to avoid, whenever possible, repeat visits to the same location to verify or supplement data. To assure efficient use of time:
1.
2 .
3 .
Visits should be scheduled in advance by arranging visit times and dates with supervision at each site. Work being performed should be representative of typical activities that occur during day-to-day operations.
A visit agenda should be provided in advance to all Assessment Team members and to managers at the specific site.
During the site waste assessment, operations should be observed as they are actually done on the same shift; during different shifts, if necessary; and under various conditions. This may require subsequent visits.
4.
5 .
6.
The processes actually observed must be compared to previously- reviewed operating manuals, and, if discrepancies exist, the discrepancies should be fully documented. For example, different reagents may now be used so as to change the original process.
Operations should be photographed or video-recorded whenever possible with the understanding that all photographs, negatives, and tapes will not be released outside the company and will be given to the department being evaluated as part of the final report. For security and proprietary purposes, only employees should be responsible for collecting and maintaining documentation of this type. Permission for collecting such documentation may be required in advance for this for s e cur e I o or pro c e s s - prop r i e tar y areas. The use of photos or videotape is ideal for showing
a f t e r I t
improvements. In combination with calculated cost savings, such documentation can visibly justify future P2 efforts.
be f o re and
Managers and operators should be interviewed for their opinions about wastes being generated and for their suggestions for improvements. Typical questions would involve administrative controls, cost accountingprocedures, material purchasing and storage procedures, and waste collection efforts. The organizational structure and level of coordination of environmental activities among departments should be noted.
2 8
7. Housekeeping practices, spill clean-up, and leak control methods should be noted. Equipment not kept leak- f ree should be identified. Odors and fumes and the overall cleanliness of the site should also be recorded.
8 . The length of time many mines are in operation will often require subsequent site visits and interviews for monitoring P2 program accomplishments. Heap or dump leach operations may extend €or many years, which may necessitate multiple visits. In addition, mines and mills are often continuous, around-the-clock operations with ebbs and surges in the flow of processing materials.
Do Material, Energy, and Water Balances
Following the completion of the IIInput Materials Summary" and the Individual Waste Stream
Char act e r i z a t ion worksheets (appendix C) , information should be analyzed and interpreted. This procedure is most conveniently done by completing material, energy, and water balances to determine where wastes are being generated and to analyze opportunities for eliminating or reducing such wastes. Balances can conveniently account for the generation, flow, consumption, and accumulation of mass, energy, and water in a process by using the principle of conservation of mass, energy, or water:
[Mass (or energy or water) in] = [Mass (or energy or water) out].
It is recommended that a separate water balance be made, although water may indeed be
included in the mass balance. No worksheets are provided for calculating balances, since the calculations must be developed specifically for each operation and usually require the assistance of an engineer.
The concepts of flowsheets and mass, energy, and water balances are familiar to most mining and process engineers. The layperson, however, may be unfamiliar with such concepts and often unrealistically expects no waste to be generated by mining or industry in general.
The simple fact is, however, that overburden, mine waste rock, tailings, water, spent liquors, slag, gaseous emissions, etc., result from mining processes and must be considered in mining and mineral processing waste assessments, since the assessments require listing all wastes generated wastes with identification of their source and composition. Balances must include all components entering and leaving the process, including lubricants, consumables, chemicals, and supplies; mine ore, overburden, stockpiled ore, and waste; mill feeds and products; etc. It is important to not neglect wastes from maintenance operations; raw material storage; transportation areas, including roads and railroads; etc., in light of the more obvious waste generation areas.
Chemical reactions occur in mining and milling, thus necessitating material balance calculations with compounds and elements, rather than just the compounds.
Available information, such as process diagrams, can help with
I
29
I . the balances. These diagrams provide a visual means of organizing inputs and outputs during the actual waste assessments. They show process boundaries, all streams leaving the process, and points at which wastes are generated. These diagrams and other mass-balance data are a critical part of metallurgical or process control of the plant and are likely to be readily available.
The mass-balance procedure must follow the path of all materials from beginning to end. For an operator, this means ore-in-place, . to ore/waste removal, to minerals processing, to waste-in-place. In a mill or heap or dump leach, it is necessary to examine incoming reagents and ore materials and to monitor solution flows. Processing is examined from all starting inputs through the end, when concentrates are shipped and tailings are sent to the ponding area. Scrutiny by all Waste Assessment Team members will ensure that all suspected wastes are identified at their sources.
Sometimes estimates must be made. It is important that the Assessment Team be aware that initial balances may require approximations or may be partially incomplete, especially when chemical reactions occur. Cyanide chemistry in a process facility or in a heap leach may be extremely complex, for example, and may require that approximations be made.
Despite these difficulties, mass and energy balances are critical to an explanation of processes in a step-by-step manner, to identify gaps in data, and to permit estimation of missing information. Mass
balances help to determine concentrations of wastes where quantitative composition data are limited or it is impractical or uneconomic to collect and analyze samples. In addition, inaccurate data or unmeasured releases can be estimated if the balance fails to glbalance,lr and there are few variables. The operator can benefit by searching the equation variables for unrecognized sources of emissions or leaks, which are costly to any operation.
Do Waste Stream Summary
Following analyses of the data using engineering balances, the IlWaste Stream Summary” worksheet should be completed by the Waste Assessment Team to prioritize waste streams. This worksheet contains a rating and ranking method, which is fully discussed in appendix D. Using all six worksheets in step 5 will ensure efficient use of personnel, time, and financial resources.
As time and f inancia1 resources permit, and as cost savings from initial P2 efforts become evident, many lower priority, more complicated,difficult-to-correct, or less significant pollution problems can be examined. Completion of waste assessments will indicate how to prioritize such problems. The most important items of consideration (14) in any waste stream summary are:
Compliance with current and anticipated regulations;
0 Costs of waste management (pollution control, recycling, treatment, and disposal) ;
0 potential environmental and

3 0
safety liability;
Quantity of Waste;
Hazardous properties of the waste (toxicity, flammability, corrosivity, and reactivity);
Other safety and occupational health hazards to employees;
Potential for P2
- potential for minimizing waste water use
- potential for reducing energy usage ;
Potential for removing bottlenecks in production or waste treatment;
0 Potential recovery of valuable byproducts or "lostv1 products from waste.
SELECT POLLUTION PREVENTION OPTIONS
Once the waste streams have been ranked using the "Waste Stream Summary" worksheet, the Assessment Team can then begin to develop P2 options for those waste streams that merit feasibility analyses. This is illustrated in step 6 of figure 4 .
Option Generation
The Assessment Team should encourage creativity to implement P2 as soon as possible after completion of the "Waste Stream Summaryll worksheet. Ideas can then be generated using the "Option Generation" worksheets (appendix C). A checklist of standard operating practices €or P2 can be found in appendix A.
Examples of P2 methods specific to mining and milling operations are provided in table 2. The table contains examples of source reduction, energy efficiency, reuse of input materials, and reduction in water usage.
Additional methods are presented in EPA' s IIPollution Prevention and Waste Minimization Opportunities for the Mining Industry, (15) which provides guidelines for hazardous waste minimization at coal mines, using data solicited from surface coal mines in Wyoming and selected fleet maintenance facilities located in Colorado. P2 guidelines discussed in that publication can also be applied to most fleet maintenance shops at mines and mills.
Resources of information can be very limited for a small operation, which may not have easy access to a central information source on P2 techniques. This limitation can be overcome in a number of ways. Sharing of successful P2 ideas from other mining operations and other businesses in the same geographic area can be beneficial for all concerned. Contacting local business groups is an excellent way to locate resources in the immediate area, while professional societies can often provide contacts with those who have been successful in implementing P2 at other mining operations in others areas of the state, country, and world. The sharing of ideas regarding implementation of P2 can help prevent environmental degradation, as well as to help save money.
In addition to contacting many consulting firms which specialize
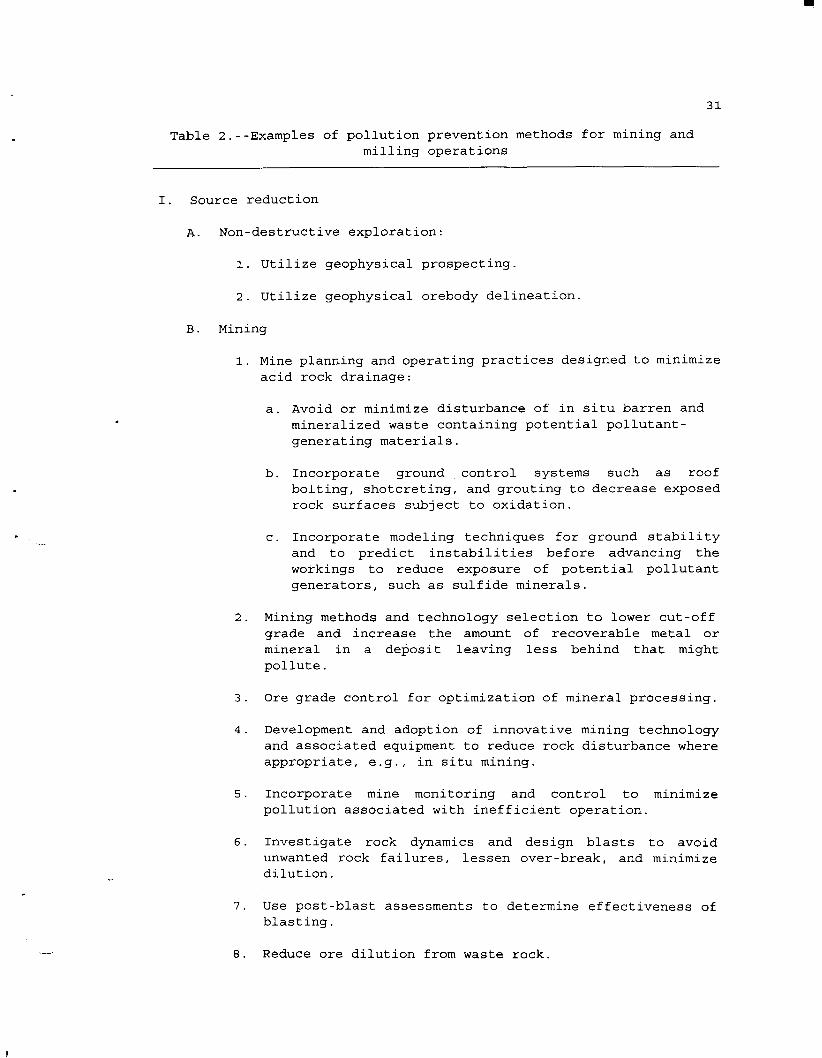
31
Table 2.--Examples of pollution prevention methods for mining and milling operations
I. Source reduction
A. Non-destructive exploration:
1. Utilize geophysical prospecting.
2. Utilize geophysical orebody delineation.
B. Mining
1.
2.
3.
4 .
5 .
6.
7 .
a .
Mine planning and operating practices designed to minimize acid rock drainage:
a. Avoid or minimize disturbance of in situ barren and mineralized waste containing potential pollutant- generating materials.
b. Incorporate ground control systems such as roof bolting, shotcreting, and grouting to decrease exposed rock surfaces subject to oxidation.
c. Incorporate modeling techniques for ground stability and to predict instabilities before advancing the workings to reduce exposure of potential pollutant generators, such as sulfide minerals.
Mining methods and technology selection to lower cut-off grade and increase the amount of recoverable metal or mineral in a deposit leaving less behind that might pollute.
Ore grade control for optimization of mineral processing.
Development and adoption of innovative mining technology and associated equipment to reduce rock disturbance where appropriate, e.g., in situ mining.
Incorporate mine monitoring and control to minimize pollution associated with inefficient operation.
Investigate rock dynamics and design blasts to avoid unwanted rock failures, lessen over-break, and minimize dilution.
Use post-blast assessments to determine effectiveness of blasting.
Reduce ore dilution from waste rock.
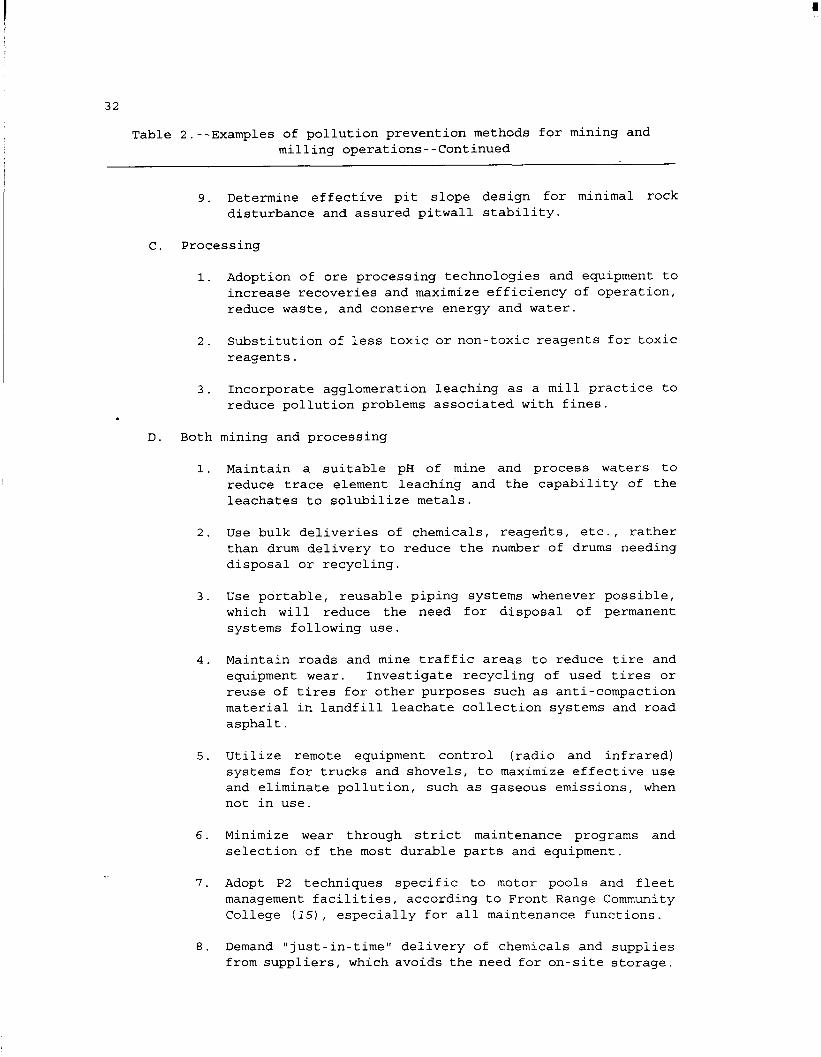
32
Table 2.--Examples of pollution prevention methods for mining and milling operations--Continued i
9. Determine effective pit slope design for minimal rock disturbance and assured pitwall stability.
C. Processing
1. Adoption of ore processing technologies and equipment to increase recoveries and maximize efficiency of operation, reduce waste, and conserve energy and water.
2. Substitution of less toxic or non-toxic reagents for toxic reagents.
3 . Incorporate agglomeration leaching as a mill practice to reduce pollution problems associated with fines.
D. Both mining and processing
1.
2 .
3 .
4 .
5 .
6.
7 .
8 .
Maintain a suitable pH of mine and process waters to reduce trace element leaching and the capability of the leachates to solubilize metals.
Use bulk deliveries of chemicals, reagefits, etc., rather than drum delivery to reduce the number of drums needing disposal or recycling.
Use portable, reusable piping systems whenever possible, which will reduce the need for disposal of permanent systems following use.
Maintain roads and mine traffic areas to reduce tire and equipment wear. Investigate recycling of used tires or reuse of tires for other purposes such as anti-compaction material in landfill leachate collection systems and road asphalt.
Utilize remote equipment control (radio and infrared) systems for trucks and shovels, to maximize effective use and eliminate pollution, such as gaseous emissions, when not in use.
Minimize wear through strict maintenance programs and selection of the most durable parts and equipment.
Adopt P2 techniques specific to motor pools and fleet management facilities, according to Front Range Community College ( I s ) , especially for all maintenance funct.ions.
Demand "just-in-time" delivery of chemicals and supplies from suppliers, which avoids the need for on-site storage.
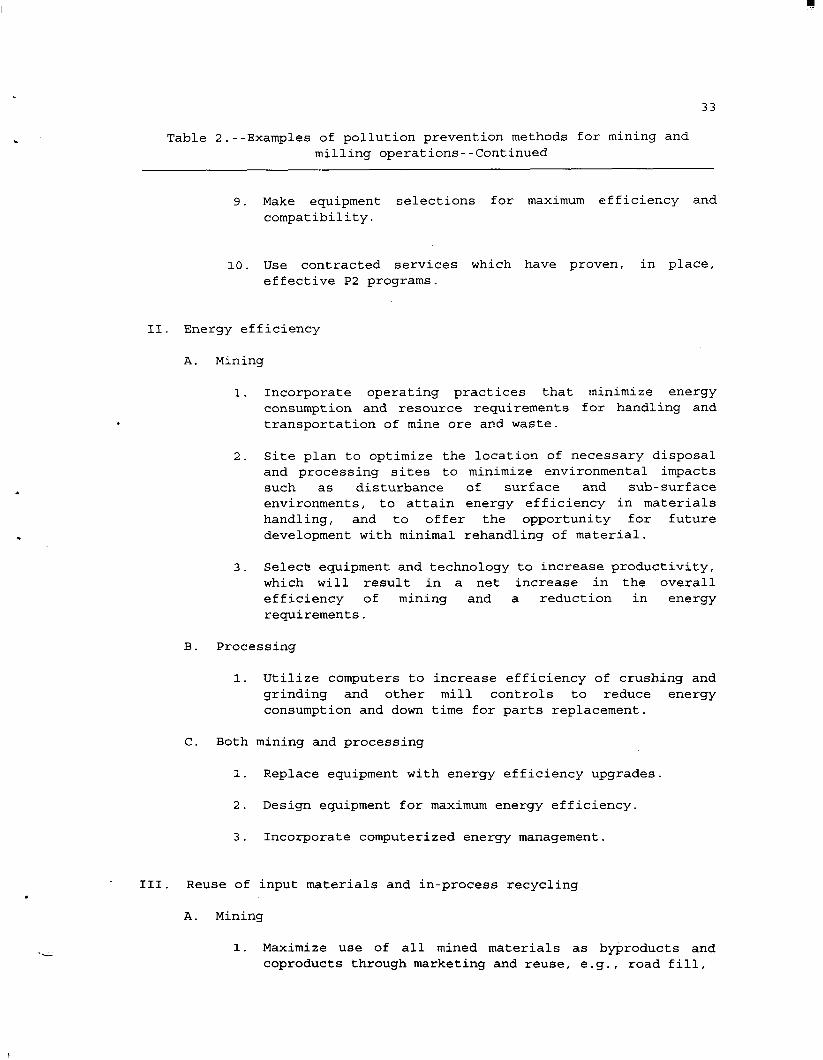
3 3
Table 2.--Examples of pollution prevention methods for mining and milling operations--Continued
9. Make equipment selections for maximum efficiency and compatibility.
10. Use contracted services which have proven, in place, effective P2 programs.
11. Energy efficiency
A. Mining
1. Incorporate operating practices that minimize energy consumption and resource requirements for handling and transportation of mine ore and waste.
2. Site plan to optimize the location of necessary disposal and processing sites to minimize environmental impacts such as disturbance of surface and sub-surface environments, to attain energy efficiency in materials handling, and to offer the opportunity for future development with minimal rehandling of material.
3. Seleck equipment and technology to increase productivity, which will result in a net increase in the overall efficiency of mining and a reduction in energy requirements.
B. Processing
1. Utilize computers to increase efficiency of crushing and grinding and other mill controls to reduce energy consumption and down time for parts replacement.
C. Both mining and processing
1. Replace equipment with energy efficiency upgrades.
2. Design equipment for maximum energy efficiency
3 . Incorporate computerized energy management.
~ 111. Reuse of input materials and in-process recycling
A. Mining
1. Maximize use of all mined materials as byproducts and coproducts through marketing and reuse, e.g., road fill,
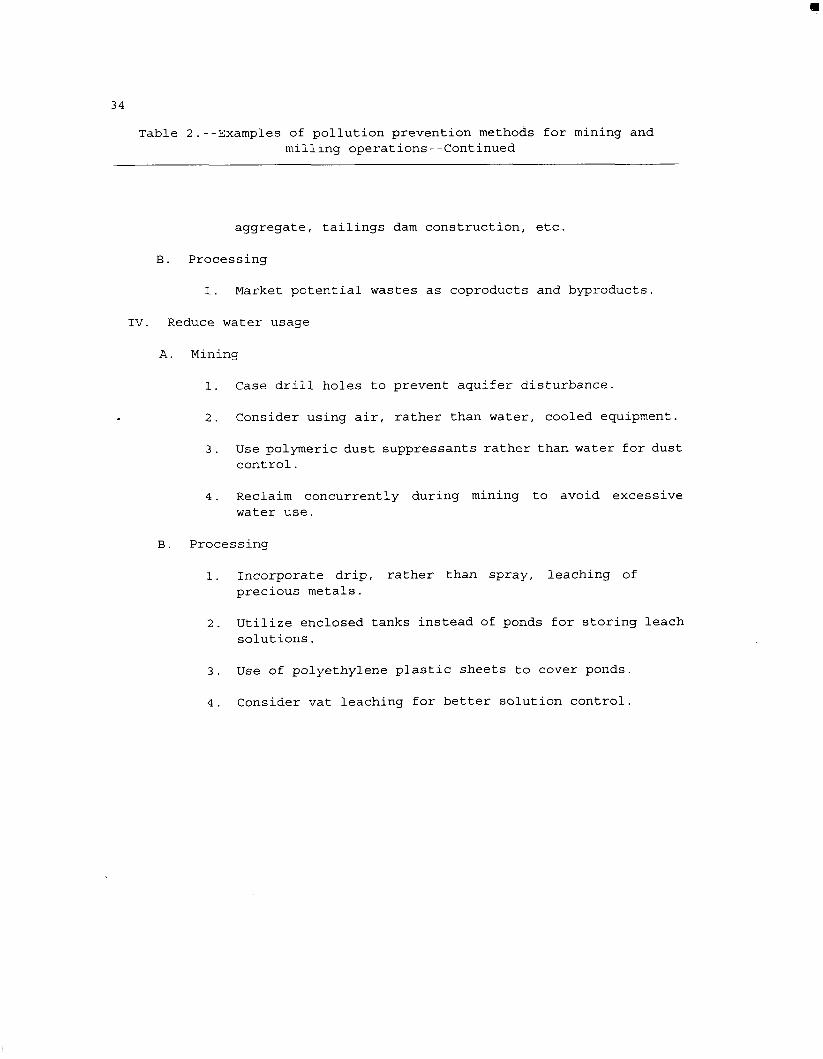
34
Table 2.--Examples of pollution prevention methods for mining and milling operations--Continued
aggregate, tailings dam construction, etc.
B. Processing
1. Market potential wastes as coproducts and byproducts
IV. Reduce water usage
A. Mining
1. Case drill holes to prevent aquifer disturbance.
2. Consider using air, rather than water, cooled equipment.
3 . Use polymeric dust suppressants rather than water €or dust control.
4. Reclaim concurrently during mining to avoid excessive water use.
B. Processing
1. Incorporate drip, rather than spray, leaching of precious metals.
2. Utilize enclosed tanks instead of ponds for storing leach solutions.
3. Use of polyethylene plastic sheets to cover ponds
4. Consider vat leaching €or better solution control


3 6
innocuous. Yet, many processes are developed through extensive testing and pilot work. The full effects of a change are frequently unknown until after testing is completed and evaluated and the proposed change is confirmed. All proposed changes require evaluation, testing, modification, application, and often, reevaluation.
In any case, the list of P2 options must be ranked using technical/environmental and e c o n o m i c f e a s i b i l i t y considerations.
Tech n ica I/E nviron menta I
'IWill this option work and at the same time protect the environment? l1 is the primary consideration for every P2 option. Usingthe "Technical/Environmental Feasibilityll worksheet in appendix C, a determination can be made as to whether the opticn is
r e 1 a t e d , I1
Ilpersonnel/procedure related," or "materials-related. A specific set of worksheets is provided for assessing each of these three categories.
e q u i p m e n t
Each worksheet addresses the following questions:
Will pollution be eliminated or reduced?
Is this option safe for workers?
Will product quality be improved or maintained?
Is there enough space at the operation?
will new equipment, materials, and procedures be compatible
with existing operating procedures, work flow, and production rates?
Will additional people have to be hired?
Will additional training or skilled personnel be required for this option?
Are the existing utilities adequate to operate the additional equipment that may be required? Will major expenditures be required to install additional utilities?
Will production be affected or stopped during system installation?
Will the vendors provide acceptable service?
What will be the direct and indirect environmental benefits? Will the operation still be able to comply with existing and future regulations by incorporation of P2 options?
Will other environmental problems result if this option were to be incorporated?
All groups within the operation which will be affected if a particular option is adopted need to provide technical evaluation of that option. Such evaluations could be made by mining, milling, maintenance, haulage, purchasing, and even marketing personnel. For example, if a concentrate grade
implementation, marketing may find it necessary to contact the "customer, i.e., the smelter, which purchases the concentrate to ensure that the new grade will be acceptable.
changes because of P2
3 7
It may be beneficial to visit other mines and mills to determine whether an option at an analogous site has proven beneficial and to what degree. Visits of this type frequently can be arranged through equipment or reagent vendors or through professional contacts. A bench-scale or even a pilot plant demonstration may be warranted prior to implementation. Some vendors will install equipment on a consignment or trial basis, with acceptance and payment after the equipment or reagents have been successfully tested.
In some cases, an option may be very straightforward. An option that would eliminate known toxic or hazardous waste without producing other toxic or hazardous waste would rank high in the priority hierarchy.
Economic
Perhaps the most important consideration for most operators is the "bottom line." Many will be hesitant to consider a possible P2 option unless it will cut costs or generate revenue.
The real costs of P2 are often difficult to calculate because the real costs of continuing to pollute, which include projected costs of future cleanup and fines, are not easily determined. The long-term need to avoid expected increased costs of waste treatment, storage, and disposal, as well as expected future regulatory and liability complications and litigations, will all impact the prioritization
~ process.
In performing an economic test, a thorough evaluation of costs and
benefits needs to be made. This includes explicit recognition of lifecycle, displaced costs, and costs avoided, e.g., decrease in compliance costs for shipping and
hazardous materials. handling non-hazardous vs .
Cost estimation and projection of economic benefits of some proposed P2 projects are generally straightforward, although they can be complicated. Using the "Operating Costs" and "Capital Costsg1 worksheets in appendix C, estimated and actual costs for all options employed can be documented to ensure that the real benefits of the P2 program will not be overlooked when actual progress is measured.
If an option is projected to have a low capital cost, profitability can easily be determined on the basis of reduction in operating costs or maintenance of operating costs at a constant level while reducing pollution. Installation of flow controls and improved operating practices, for example, generally require little or no analysis before adoption. The Profitability worksheet in appendix C can be used for calculations.
The payback period for a P2 project is the amount of time it takes to recover the project's initial cash outlay. Information from the "Operating Costs" and IICapital Costs" worksheets can be used to complete the Profitabilityv1 worksheet which contains the formula for calculating the pre-tax payback period. For example, if an operation installs equipment worth $500,000 and that equipment will save $125,000 per year, the
3 8
payback period will be 4 years. Based upon consideration of the payback period, projects with shorter payback periods are generally preferred over projects with longer payback periods. A rule-of-thud is that payback periods of up to 3 or 4 years are generally considered acceptable, low-risk investments.
M o s t c o m p a n i e s use sophisticated financial analysis methods, such as the Internal Rate of Return (IRR), for ranking capital projects which are competing for funding. IRR is preferred to payback as the method for determining the economic viability of projects. The IRR is the discounted cash flow rate of return for a project and is considered to be the interest earned on money invested in a project. The rate of interest increases as the project becomes more profitable. For investments with a low level of risk, an after-tax interest rate of 12% to 15% is considered by many to be reasonable.
Financial management, cost accounting, and engineering economics textbooks present information on calculating IRR. Many popular spreadsheet programs for personal computers can also calculate IRR.
There are other methods for analyzing the economics of P2 options. The EPA recommends a Total Cost Assessment (TCA) method (16) and other costing methods -(17). Utilizing TCA helps an operator to demonstrate the true costs of pollution to an operation and the net benefits of prevention to the same operation.
WRITE WASTE ASSESSMENT REPORTS
Using all the feasibility and financial worksheets compiled thus far, the I'Waste Option Summary1I worksheets in appendix C should be completed (step 8 , figure 4) for each option that is considered. These can then be utilized to prepare a waste assessment report describing options proposed for the operation. Each report should include :
P2 potential for the waste stream ;
Applicable P2 technology and discussion of successful applications;
Economics of P2 incorporation;
How required funding can be obtained;
Time projections for implementation;
Proposed evaluation techniques for implemented P2.
WRITE SUMMARY ASSESSMENT REPORT
For smaller operations, the waste assessment reports can be relatively simple, and together they may also serve as the final report. For such operations, each waste assessment report can be used to implement a P2 plan and provide a permanent record for ongoing P2 work.
Larger, integrated operations generally require interaction and cooperation among company divisions, departments, or groups. For these operations, all the waste assessment reports may have to be reviewed by the Waste
3 9
Assessment Teams, or the Task Force itself, in order to prepare a summary assessment report (step 9, figure 4) from the waste assessment reports submitted, before implementation can take place within the overall operation. This summary assessment report should give
cooperating areas or departments within the same operation. This summary assessment report, based upon the waste assessment reports and the Waste Option Summary Worksheets, should determine how P2 proposals are prioritized, if they are technically and economically feasible, and if they have the support of the individuals and groups which will be directly affected by their implementation. It should include a preliminary, qualitative evaluation of all indirect and intangible costs (and benefits) to the operation and its employees.
specific recommendations to
The weighted sum method €or option screening shown in appendix D might be utilized in preparation of the summary assessment report. It might also be necessary to evaluate implementation of options using extremes of both optimistic and pessimistic assumptions. If possible, sensitivity analyses, which indicate the effects of key variables onprofitability, should be included. Use of technical specialists to perform such analyses may be required. The weighted sum method, however, as described in appendix D should be adequate for most operations.
Finally, the summary assessment report should always be reviewed by operations managers who would be directly affected by proposed changes, in order to ensure that adoption of the preferred P2 options is possible, practical, and cost effective over the long term.
MAINTENANCE OF THE POLLUTION PREVENTION PROGRAM
After completing the Waste Assessment phase illustrated in figure 4, it is important that the P2 program be maintained on an ongoing basis. This requires both short-, mid-, and long-term planning and implementation as shown in figure 5. The llmaintenancell phase is composed of three steps:
0 Implement a plan;
0 Measure progress;
0 Maintain the P2 program.
IMPLEMENT A PLAN
Using the waste assessment reports and the summary assessment report, the Task Force, or the Waste Assessment Team in smaller
operations, must then implement the plan as described in the summary assessment report. This is illustrated in figure 5, step 10.
In a smaller operation, the plan may be readily implemented. For larger operations, the implementation plan will likely need approval of higher management. Top management approval will accomplish several objectives: (1) management will have the opportunity to see concrete results of the Assessment Team effort, including an explanation of specific benefits accruing to the operation through P 2 ; ( 2 ) management will have a final opportunity for input to the implementation program; and, (3) rank-and-file employees will be more likely to accept the
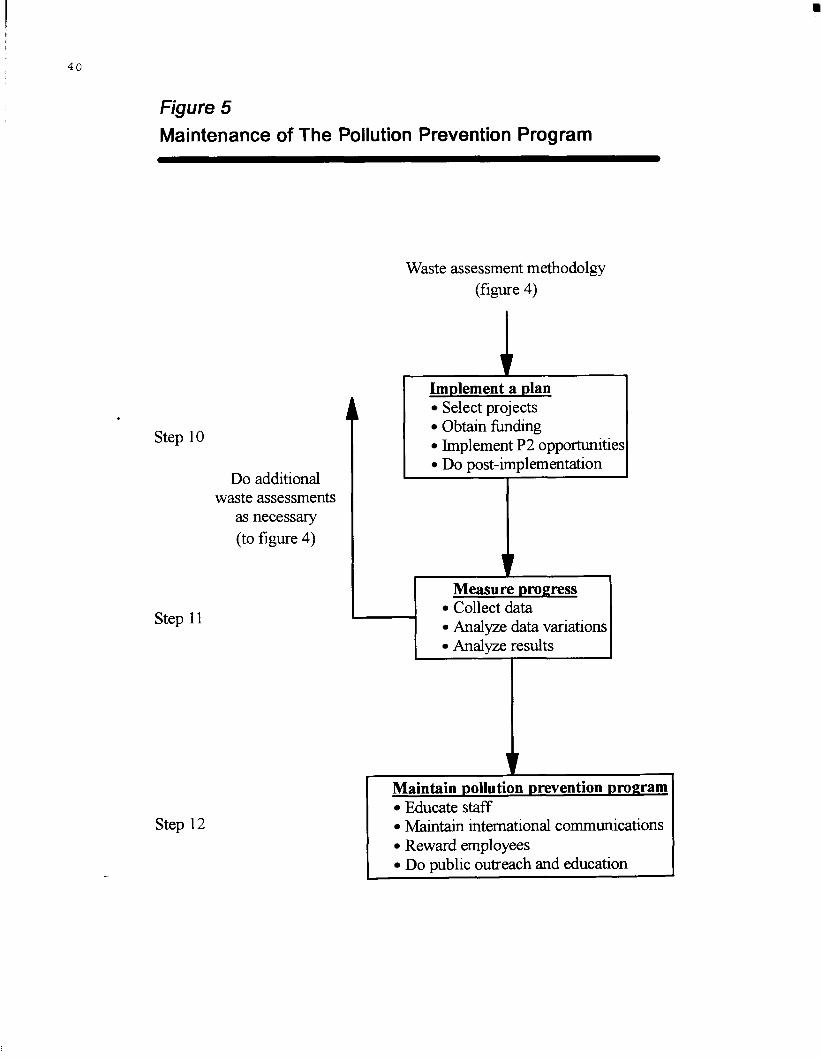
4 0
Figure 5 Maintenance of The Pollution Prevention Program
Step 10
Do additional waste assessments
as necessaq (to figure 4)
Step 11
Step 12
Waste assessment methodolgy (figure 4)
1 Implement a plan
Select projects Obtain h d m g Implement P2 opportunities Do post-implementation
Collect data Analyze data variations Analyze results
Maintain pollution prevention program Educate staff Maintain international communications Reward employees Do mblic outreach and education
41
I -
I I *
I -
implementation program, realizing that top management has approved the program.
The operator must always avoid spur-of-the-moment changes in mine or mill operations without first considering a feasibility review to ensure that the results desired are beneficial. Even with such a determination, the operator should proceed with caution and a "trial and adoption" phase.
Select Projects
P2 projects will compete with other mine and mill requests for . funding. Such competition might include new orebody development, mill additions, and mine production capacity expansions. If members of the Task Force are involved in the overall budget- making process, P2 requests can more easily be integrated with other requests. Adoption of selected P2 proposals and time frames necessary for their implementation may require modifications, based upon available resources.
E includes information from EPA on securing financial assistance ( 3 , p. 117).
Implement the P2 Opportunities
Incorporation of the new P2 opportunities into existing operations is similar to other capital improvement projects in that each requires planning, design, procurement, construction, and operator training. Changes in operating procedures, purchasing techniques, and materials may all be affected.
Do Post-Implementation
Following implementation, technical, economic, and labor effects must be reviewed to ensure that original expectations are being met. Where expectations are not met, modifications are necessary. Evaluation of the effectiveness of a project and ways to maintain and enhance a program after its implementation are discussed below.
MEASURE PROGRESS
Obtain Funding
Some projects can be funded directly from operating budgets. Other options may require submission to operations administration for approval, as well as to management directly affected by such options.
For small operations, a number of external funding sources exist. Funding for P2 opportunities may
~ be available through grant programs secured from outside sources such as the EPA (18), or as loans from financial institutions, State departments of commerce, or even the U.S. Small Business Administration. Appendix
To ensure that a particular P2 option is proving effective after implementation and that it produces no adverse effects upon operations, it is necessary to compare actual progress made with both the original and with modified goals. This comparison, as represented in step 11 of figure 5, will permit identification of P2 opportunities which are working well and those which are less effective.
Collect Data
Data collection for success determination of an adopted P2 option allows comparison with

42
similar operations, not only within the company, but with other mining and non-mining industrial operations. Such data will permit full evaluation of the effectiveness of P2 projects that have been employed. For example, the process will allow enhancement of the overall P2 program, provide chances to select other, perhaps, more effective technologies, and allow identification of new opportunities for cost savings.
Analyze Data Variations
Data variations may present problems for analyses of the effectiveness of P2. As previously discussed, a considerable volume of data may exist for waste streams already subject to regulation. In some cases, however, data may be unavailable for specific, non- regulated waste streams. Gaseous emissions, for example, may not have been quantified; perhaps only rough engineering estimates are available. In addition, if reporting requirements have changed from one period to another, data that have been assembled for one period may not be meaningful for another period. Data variations of this sort require careful attention to avoid drawing wrong conclusions about the effectiveness of the P2 program.
Some wastes will be eliminated after incorporation of the P2 program, while other wastes may be shifted to another part of the mine or mill or into another product or waste stream, often
~ with a resultant change in physical states among solid, liquid, and/or gaseous forms. Waste transfer to another physical state or replacement of one pollutant with another is not P2 if new environmental problems or
product losses result
Waste reduction is not P2 if the process results in concentrating toxicity, i.e., increasing toxicity per unit, but rather is a treatment option. For example, pH adjustment with lime to reduce heavy metal toxicity of waste water removes heavy metals from solution and precipitates these metals, forming a sludge. The sludge containing the heavy metals is considered a "new" waste which must be managed. Although a mare concentrated waste has been produced, this is waste treatment, not P2.
There are a number of non-P2 factors which may affect volumes of wastes and products. These include, but are not limited to, weight or volume of mined and processed materials; amount of process supplies such as explosives or reagents; weight or volume of resulting products or wastes; total process hours; number of batches processed or transported; startup and shutdown; maintenance; and quality level. Corrections for such factors must be considered as they occur during the course of normal facility operations.
Analyze Results
Evaluation of the effectiveness of P2 is complex. Analyzing P2 data can be performed with several methods discussed by the EPA (2, pp. 44-49). Brief summaries of seven such methods follow:
e ( I Semi - Quant itat ive Process Description" relies upon text supplemented with limited numerical data. It is fairly easy to prepare in terms of time, but evaluation of P2 goals is limited, since processes cannot be compared
43
I .
I -
quantitatively.
IIQuantity of Waste Shipped or Treated or Stored on Site" analyzes waste transfers and such things as quantities of overburden stockpiled. This method relies upon a quantitative review of manifests and production records. A shortcoming of the method is that the data source may contain only weights; compositions of the subject wastes may be unknown.
e "Quantity of Materials Received, Mined, and Processedr1 examines changes in quantities of materials brought on site, mined, or processed. Most operations keep detailed records of purchased, mined, and processed materials. Unfortunately, this method is imprecise since it does not usually account for loss during processing or if materials are acquired from other production units in the facility.
llInput-Outputll provides a material balance for each waste component through a combination of the two previous methods. This method involves tracking all materials going into and coming out of each operation. Quantities of materials purchased, produced, and consumed, and discharges to waste treatment and disposal, are required for this process. Fugitive emission data can be determined from other known data in the material and energy balance.
~ IIProcess Analysisn1 analyzes P2 on a process-by-process basis and determines what changes in waste generation can be a t t r i b u t e d t o t h e
activities. Accurate data on implementation of P2
process-related waste can be obtained if the process is carefully selected and precisely defined. For large operations, the technique may be difficult to use with complex, interdependent processes, simply because extensive data collection and analysis are required. For a small-to-medium sized operation, such methods might prove highly beneficial in cutting costs. The disadvantage to this method is that some wastes common to several process areas may be overlooked or assumed to be credited to another process area. Water circulated in several areas may, for example, be neglected due to its llcommonll or "shared" usage.
I1Analysis of a P2 Project" reviews each P2 activity and is useful for operations that produce several products or include a wide range of processes. Data collection requirements are extensive for this technique. It is best applied to product and equipment changes, rather than to behavioral changes, such as improved training or housekeeping.
TIAnalysis of Material ToxicityI1 requires testing for and eliminating discharge of pollutants which are toxic to aquatic life. To conduct this analysis, process streams which contribute to plant waste effluents are individually measured and analyses made to determine toxicity. Such detailed toxicity testing allows identification and tracking of the actual wastes from the mine or mill. Toxicity testing requires sophisticated equipment and data processing and may not be
44
feasible for all applications.
Whatever method or methods are used, results achieved must be reevaluated on a regular basis. Periodic reviews of the program should be scheduled so that P2 implementation can be adjusted to reflect changes in regulations, technology, and economic feasibility with minimum disruption to operation.
MAINTAIN THE POLLUTION PREVENTION PROGRAM
The final step in the process is maintenance of permanent program (step 12
P2 the of
figure 5). To do this, P2 must be continually promoted to all employees. Such a program will accomplish the following:
0 Make employees aware of environmental issues;
0 Increase employee awareness of environmentally-related activities at the operation;
0 Encourage employees to participate in P2;
0 Train employees for P2 responsibilities;
0 Recognize employees for their P2 efforts;
0 Publicize company P2 successes with credit given to Task Force and Waste Assessment Team members.
All P2 data collected should be reviewed on a regular basis by the Task Force with recommendations made and changes implemented. Feedback from all operations personnel to include successes and failures of the program should be summarized at least annually for
management. A high P2 profile can be maintained with continued commitment of management.
Educate Staff
P2 training should be continuous for everyone within the mine and mill. Ideally, then, employees will search for and become aware of opportunities for source reduction. An annual 1- day, refresher course on P2 and quality improvement will help to ensure continued interest in the program and company commitment to P2. New employees should receive special training as part of their initial orientation. As experience on the job is acquired, additional, detailed training should be provided. Additional P2 skills can be acquired.
Senior level employees should also receive additional P2 training if they work in multiple areas of the operation or if their job functions become expanded. P2 training should be considered as important as is safety training when an employee is assigned to a new job or area. If policies or operating procedures change, training update sessions should be scheduled.
Maintain Internal Communications
Often it may be difficult to keep P2 goals in focus for all employees. Employees must see the company demonstrate its commitment to the goals and objectives of P2 and offer ongoing opportunities to directly participate in their success within an operation.
Supervisors or managers must continuously keep employees informed of the benefits of P2 and
4 5
encourage them to submit P2 ideas. Employees should be briefed either orally or in writing on a regular basis. If briefings are sporadic and vague without quantified accomplishments and credit given for employee participation, the conclusion may be drawn that P2 is not really important. Infrequent briefings or failure to publicize accomplishments could present the impression that little progress is being made or that P2 is not as important as was originally described.
Employee feedback during briefings is necessary in order to determine the degree of employee support. If management informs all employees of the importance of P2 through regular briefings, an open exchange of ideas should occur. It is also the responsibility of management to thoroughly and completely evaluate all employee suggestions promptly and to incorporate feasible P2 ideas. Even if an idea submitted is not feasible, the reasons why it is not feasible must be tactfully explained to the employee. Rejection of an idea, if not handled very carefully, could discourage an employee from further participation and would certainly stifle all interest. Prompt, candid feedback is necessary to maintain employee enthusiasm.
Reward Employees
At a supervisory level , performance reviews can incorporate P2 commitment. Peer recognition for all employees who have shown commitment to P2 can easily be accomplished through use of the company newsletter, group meetings, or through notices on bulletin boards. Ideally, such announcements should contain
estimated cost savings and other advantages to the company.
If cost savings are stressed, a percentage of the savings realized by the company or production unit could be awarded to those individuals responsible for suggesting the idea. This will often do more than any other technique to encourage employee participatio9. Why? The employee benefits in a personal way, i.e., through added income. W. W. Berg suggests that a company adopt a P2 Bounty' reward type
program.. . (that utilizes) a $1,000 or more standing offer for P2 options from employees (P2 options that actually get implemented) . . . (This) becomes an incredibly strong motivator for keeping the P2 program on the corporate front-burner."
4
Do Public Outreach and Education
The mining and minerals processing industries should tout their P2 accomplishments. Promoting P2 and the resulting environmental as well as monetary benefits can help improve company image not only locally, but regionally, nationally, and, perhaps, internationally. Operators must !'get the word outll to the community, the media, other mining and milling companies, regulators, and legislators. Informed, articulate employees should be encouraged to speak at various community organization meetings, schools, and to do interviews with the local media to pub1 ic i ze the operation's commitment to P2 by actions, not talk. Employees with
Private communication from W.W. Berg, RECOM Applied Solutions, November 29, 1994.
4
46
technical and professional for trade or professional positions should be encouraged journals, with funding for to present papers at professional transportation being paid by the meetings, or to prepare articles company.
SUMMARY
This special publication is intended to provide specific information to reduce pollution impacts from mining and mineral processing of hardrock and industrial minerals. Although minerals cannot be provided to the United States without generating non-usable, waste materials, pollution prevention can be achieved without affecting reasonable efficiencies of operation.
Properly implemented, a P2 program offers incentives for mine and processing facilities. These include economic, regulatory, and liability incentives, as well as benefits to the public, human health, and the environment. The step-by-step, simplified procedure which utilizes the generic worksheets in the publication, can be adapted to meet the specific needs of those wishing to realize these benefits. The publication can also serve as a reference for P2 for citizen and environmental groups, State and local governments, and academia.
a
4 7
ACKNOWLEDGMENTS
Many mining, environmental, citizen, and governmental organizations provided suggestions for this report, including members of the Colorado Mining Association, The Sierra Wetlands, the Colorado Center for Environmental Management, the League of Women Voters (Colorado), interested consultants, the Colorado Department of Health, the Environmental Protection Agency, the Colorado School of Mines, the Gulf Coast Hazardous Substances Center, and the Texas Natural Resource Conservation Commission. Special thanks are extended to both Robert C. Steckley, Chief, and Stewart W. Towle, Environmental Engineer (retired), of the Engineering Feasibility and Economic Analysis Section of the Minerals Availability Field Office, U.S. Bureau of Mines, Denver, CO, for their suggestions in preparing this document. The efforts of Kathleen Anderson of the Mining and Environmental Institute, Division of Economics and Business at the Colorado School of Mines, and A. Robert Easter of the Colorado Mining Association's Mine Waste Subcommittee, proved invaluable in coordinating much of the non-USBM input to the project, especially in determining the needs of operators of small mines and mills. Thanks to . Geoff Elliott of AmbioCom Strategies for soliciting input from the mining industry on this publication.
The USBM also acknowledges the technical and financial support of the Department of the Interior's Office of Environmental Policy and Compliance in the preparation of this report.
48
REFERENCES
1. U.S. Environmental Protection Agency . Glossary of Environmental Terms and Acronym List. EPA/19K-1002, Dec. 1989, 29 PP.
2. U.S. Code of Fede ra 1 Regulations. Pollution Prevention Act of 1990, Public Law 101-508-Nov. 5, 1990, 104 Stat, 1388-321.
3. U.S. Environmental Protection Agency . Facility Pollution Prevention Guide. EPA/GOO/R- 92/088, May 1992, 143 pp.
Brady, B. T., G. J. Chekan, and C. V. Jude. Mining and Quarrying Trends in the Metals and Industrial Minerals Industries. Ch. in USBM Minerals Yearbook 1992, v. 1, 81 PP.
U.S. Office of Technology Assessment. Managing Industrial Solid Wastes from Manufacturing, Mining, Oil and Gas Production, and Utility Coal Combustion. Background Paper for Congress of the United States, 1992, 130 pp.
6. U.S. Environmental Protection Agency. Press Release. Environmental Enforcement Reaches Record Levels. Dec. 9, 1993. 2 pp.
7. Texas Water Commission. Pollution Prevention Assessment Manual for Texas Businesses - A Guide for a Source Reduction and Waste Minimization Plan. Publication 92-03. Feb. 1992, 98 PP-
8. Pollution Prevention: Strategies for the Coal Mining Industry. Center €or Hazardous Materials Research, location unknown, Factsheet, undated, 4 PP.
9. U.S. Code of Federal Regulations. Res our ce Conservation and Recovery Act, 42 U.S.C. Articles 6901-6991, 1976.
10. Firor, J., and J. E. Jacobsen. Global Climate Change and Sustainable Development. Air and Waste, v. 43, May 1993, pp. 707-722.
11. Banks, K. Ore Grade Control. Mining World News, Mar. 1994, v. 6, No. 2, p. 18.
12. Gallant, R. W. Make Training More than a Stepchild. Chem. Eng., v. 96, No. 8, pp. 161- 162, 164.
13. Beck, J. M. What Is an Environmental Audit? Pres. at Environmental Audit Seminar, sponsored by the Colorado Mining Assoc., Sept. 29, 1992.
14. Brown, P. E., and D. E. Baldwin. The Use of Environmental Risk Assessment for the Mining Industry. Paper in the Environmental Regulation Conference for Mining (Denver, CO, June 26- 27, 1993). Leonard Rice Consulting Water Engineers, Inc.; Stewart Environmental Consultants, Inc.; and the Colorado Mining Association; 1993.
49
R EFERENCES-Cont hued
15. Front Range Community College (Westminster, CO) , Hazardous Materials Program. Pollution Prevention and W a s t e M i n i m i z a t i o n Opportunities for the Mining Industry. EPA Document 8HWM- HW. Oct. 1, 1993 (released Jan. 1994), 41 pp. with unnumbered appendixes.
16. Tellus Institute. Total Cost Assessment: Accelerating Industrial Pollution Prevention through Innovative Project Financial Analysis, with Applications to the Pulp and Paper Industry. Prepared for the Environmental Protection Agency, Dec. 1991, unspecified number of pages.
17. White, A. L., M. Becker, and D . E . S a v a g e . Environmentally Smart Accounting: Using Total Cost Assessment to Advance Pollution Prevention, Pollution Prevention Rev., v. 3, No. 3, 1993, pp. 247-259.
18. F e d e r a l R e g i s t e r . Environmental Protection
Availability of Pollution Prevention Grants and Announcement of Financial Assistance Programs Eligible for Review. V. 59, No. 36, Feb. 23, 1994, pp. 8613-8615.
Agency. Notice of
50
BlBLlOG RAPHY
Facility Pollution Prevention Guide . . . . . . . . . . EPA/600/R-92/088
Opportunities for Pollution Prevention Research to Support the 33/50 Program . . . . . . . . EPA/600/R-92/175
Life Cycle Design Guidance Manual . . . . . . . . . . . EPA/600/R-92/226
Life Cycle Assessment: Inventory Guidelines and Principles . . . . . . . . . . . . . . . . . . . . EPA/600/R-92/245
Pollution Preventing Case Studies Compendium . . . . . . . . . . . . . . . . . . . . . . EPA/600/R-92/046
Industrial Pollution Prevention Opportunities for the 1990's . . . . . . . . . . . . . EPA/600/8-91/052
Achievements in Source Reduction and Recycling for Ten Industries in the United States . . . . . . . . . . . . . . . . . . . . EPA/600/2-91/051
Background Document on Clean Products Research and Implementation . . . . . . . . . . . . . EPA/600/2-90/048
Measuring Pollution Prevention Progress Proceedings . . . . . . . . . . . . . . . . . . . . . EPA/600/R-93/151
A Primer for Financial Analysis of Pollution Prevention Projects . . . . . . . . . . . . . . . . . EPA/600/R-93/059
Innovative Clean Technologies Case Studies . . . . . . EPA/600/R-93/175
DuPont Chambers Works Waste Minimization Project . . . . . . . . . . . . . . . . . . . . . . . EPA/600/R-93/203
The above reports are available from:
CERI Publication Unit United States Environmental Protection Agency 26 W. Martin Luther King Drive Cincinnati, OH 45268 (513) 569-7562
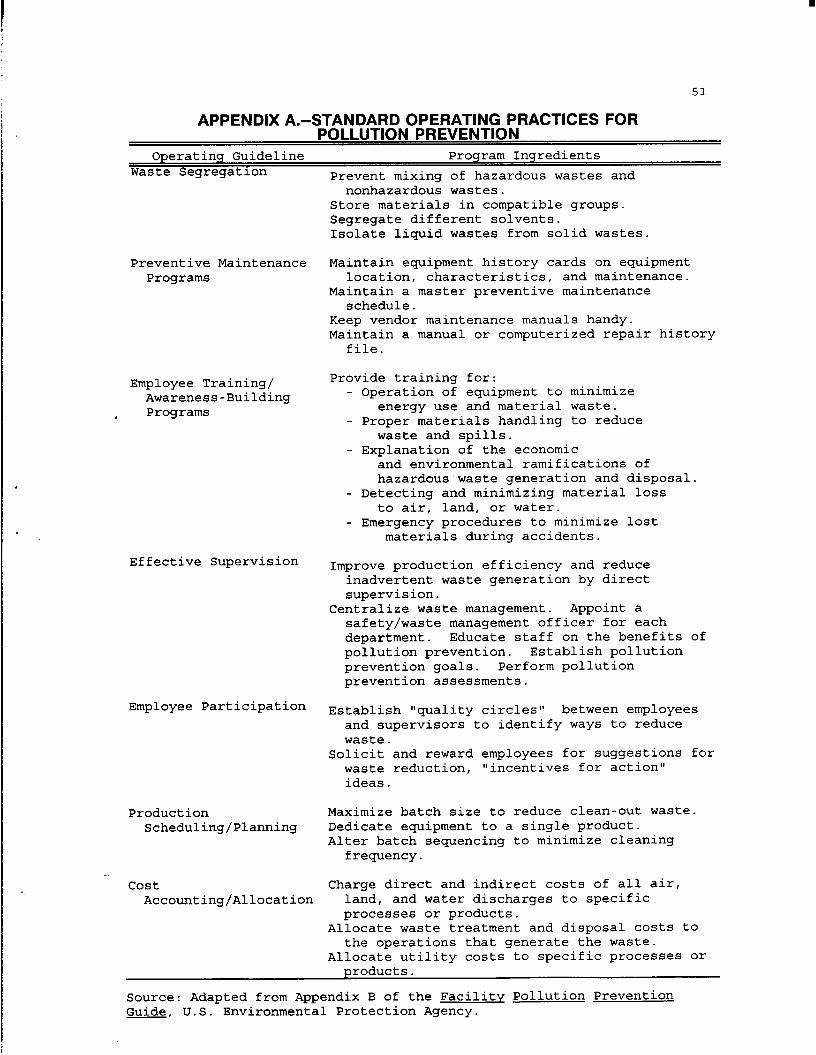
I
51
APPENDIX A.--STANDARD OPERATING PRACTICES FOR POLLUTION PREVENTION
Operating Guideline Program Inqredients Waste Segregation Prevent mixing of hazardous wastes and
Store materials in compatible groups. Segregate different solvents. Isolate liquid wastes from solid wastes.
nonhazardous wastes.
Preventive Maintenance Programs
Employee Training/ Awareness-Building Programs
Effective Supervision
Employee Participation
Production Scheduling/Planning
cost Accounting/Allocation
Maintain equipment history cards on equipment location, characteristics, and maintenance.
Maintain a master preventive maintenance schedule.
Keep vendor maintenance manuals handy. Maintain a manual or computerized repair history file .
Provide training for: - Operation of equipment to minimize
energy use and material waste. - Proper materials handling to reduce
waste and spills. - Explanation of the economic
and environmental ramifications of hazardous waste generation and disposal
to air, land, or water. - Detecting and minimizing material loss
- Emergency procedures to minimize lost materials during accidents.
Improve production efficiency and reduce inadvertent waste generation by direct supervision.
safety/waste management officer for each department. Educate staff on the benefits of pollution prevention. Establish pollution prevention goals. Perform pollution prevention assessments.
Centralize waste management. Appoint a
Establish "quality circles" between employees and supervisors to identify ways to reduce waste.
waste reduction, "incentives for action" ideas.
Solicit and reward employees for suggestions for
Maximize batch size to reduce clean-out waste Dedicate equipment to a single product. Alter batch sequencing to minimize cleaning frequency .
Charge direct and indirect costs of all air, land, and water discharges to specific processes or products.
the operations that generate the waste. Allocate waste treatment and disposal costs to
Allocate utility costs to specific processes or
Source: Adapted from Appendix B of the Facility Pollution Prevention Guide, U.S. Environmental Protection Agency.

I
52
APPENDIX B.--CHECKLIST FOR COMMON POLLUTION PREVENTION METHODS
Waste Oriqin/Type Pollution Prevention Method
Material Receiving
Raw Material and Product storage
Use ttjust-in-timetl ordering system. Establish a centralized purchasing program.
Select quantity and package type to minimize packing waste.
Order reagent chemicals in exact amounts .
Encourage chemical suppliers to become responsible partners (e.g., accept return of outdated supplies).
Establish an inventory control program to trace chemical from cradle to grave.
out" (FIFO) inventory control.
chemicals for other departments' use.
shipment.
specifications.
Rotate chemical stock. #'Practice first-
Develop a running inventory of unused
Inspect material before accepting a
Review material procurement
Validate shelf-life expiration dates. Test effectiveness of outdated material. Eliminate shelf-life requirements for
Conduct frequent inventory checks. Use computer-assisted plant inventory
Conduct periodic material tracking. Properly label all containers. Set up staffed control points to
Buy pure feeds. Find less critical uses for off-spec material that would otherwise be disposed or refused acceptance.
stable compounds.
system.
dispense chemical and collect wastes.
Change to reusable shipping containers. Switch to less hazardous raw material. Use rinsable/recyclable drums. Establish Spill Prevention, Control, and Countermeasures (SPCC) plans.
Use properly designed tanks and vessels only for their intended purposes.
Install overflow alarms for all tanks and vessels.
Maintain physical integrity of all tanks and vessels.
Set up written procedures for all loading/unloading and transfer operations.
Install secondary containment areas.

53
APPENDIX 6.--CHECKLIST FOR COMMON POLLUTION PREVENTION METHODS--Continued
Waste Oriqin/Type Pollution Prevention Method
Raw Material and Product Isolate equipment or process lines that Storage--Continued leak or are not in service.
Use sealless pumps. Use bellows-seal valves. Document all spillage. Instruct operators not to bypass interlocks, alarms, or significantly alter setpoints without authorization.
Perform overall materials balances and estimate the quantity and dollar value of all losses.
Use floating-roof tanks for VOC control. Use conservation vents on fixed roof
Use vapor-recovery systems. Store containers so as to allow for
tanks.
visual inspection for corrosion and leaks.
Stack containers in a way to minimize the chance of tipping, puncturing, or breaking.
Prevent concrete llsweating" by raising the drum off storage pads.
Maintain Material Safety Data Sheets to ensure correct handling of spills.
Provide adequate lighting in the storage area.
Maintain a clean, even surface in transportation areas.
Keep aisles clear of obstruction. Maintain distance between incompatible chemicals and different types of chemicals to prevent cross contamination.
equipment.
storage and handling of all raw materials.
Avoid stacking containers against process
Follow manufacturers' suggestions on the
Operation and Process Changes Use proper insulation of electric circuitry and inspect regularly for corrosion and potential sparking.
Use large containers for bulk storage whenever possible.
Use containers with height-to-diameter ratio equal to one to minimize wetted area.
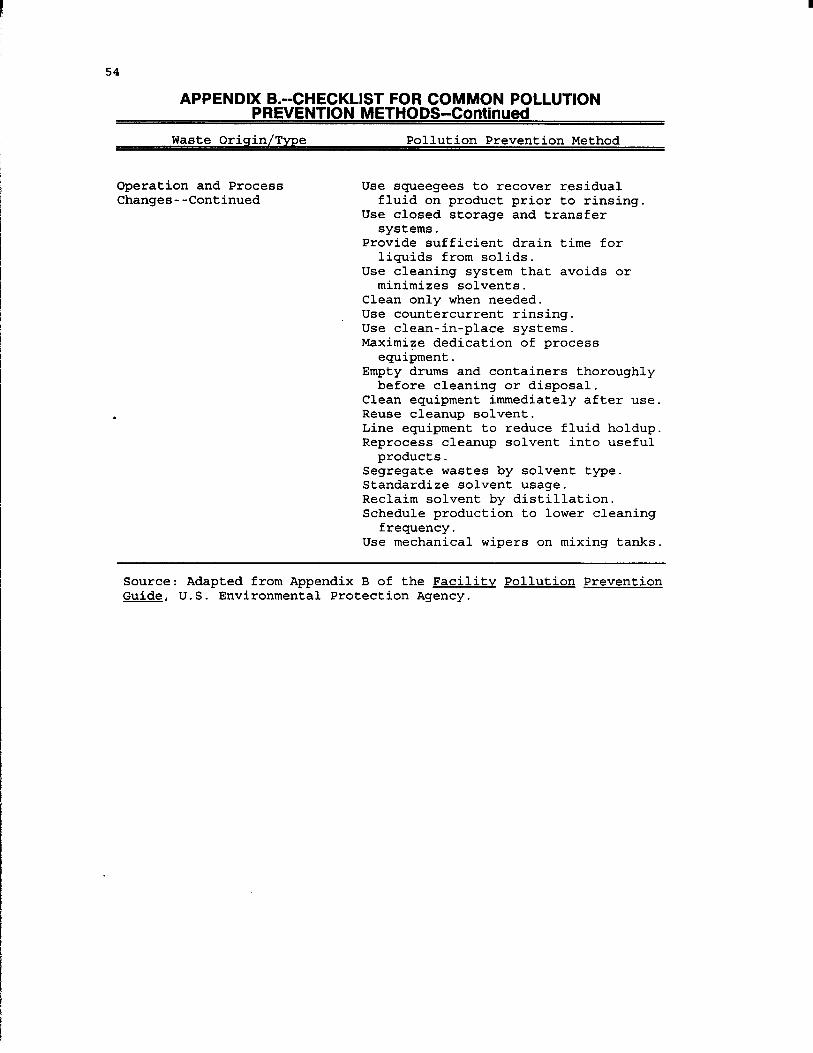
I
54
APPENDIX B.--CHECKLIST FOR COMMON POLLUTION PREVENTION METHODS--Continued
Waste Oriqin/Type Pollution Prevention Method
Operation and Process Use squeegees to recover residual Changes--Continued fluid on product prior to rinsing.
Use closed storage and transfer systems .
Provide sufficient drain time for liquids from solids.
Use cleaning system that avoids or minimizes solvents.
Clean only when needed. Use countercurrent rinsing. Use clean-in-place systems. Maximize dedication of process
Empty drums and containers thoroughly
Clean equipment immediately after use. Reuse cleanup solvent. Line equipment to reduce fluid holdup. Reprocess cleanup solvent into useful
Segregate wastes by solvent type. Standardize solvent usage. Reclaim solvent by distillation. Schedule production to lower cleaning
Use mechanical wipers on mixing tanks.
equipment.
before cleaning or disposal.
products.
frequency .
Source: Adapted from Appendix B of the Facilitv Pollution Prevention Guide, U.S. Environmental Protection Agency.
55
APPENDIX C.--POLLUTION PREVENTION WORKSHEETS
Worksheets in this appendix are helpful to develop and implement a pollution prevention (P2) program. The worksheets are provided in an unbound, single-sided format to facilitate reproducing the sheets for use. The back of each worksheet is left blank to permit the recording of additional notes. Table C-1 lists each worksheet and briefly describes its purpose. Although these worksheets have been designed for use at mines and mills, each sheet is generic, due to the unique nature of each mine and mill. It is necessary to adapt each sheet to meet the specific needs of each operation implementing a P2 program. Appendixes A and B contain information that can help in adapting each worksheet to fit the unique situations that may exist at each operation.
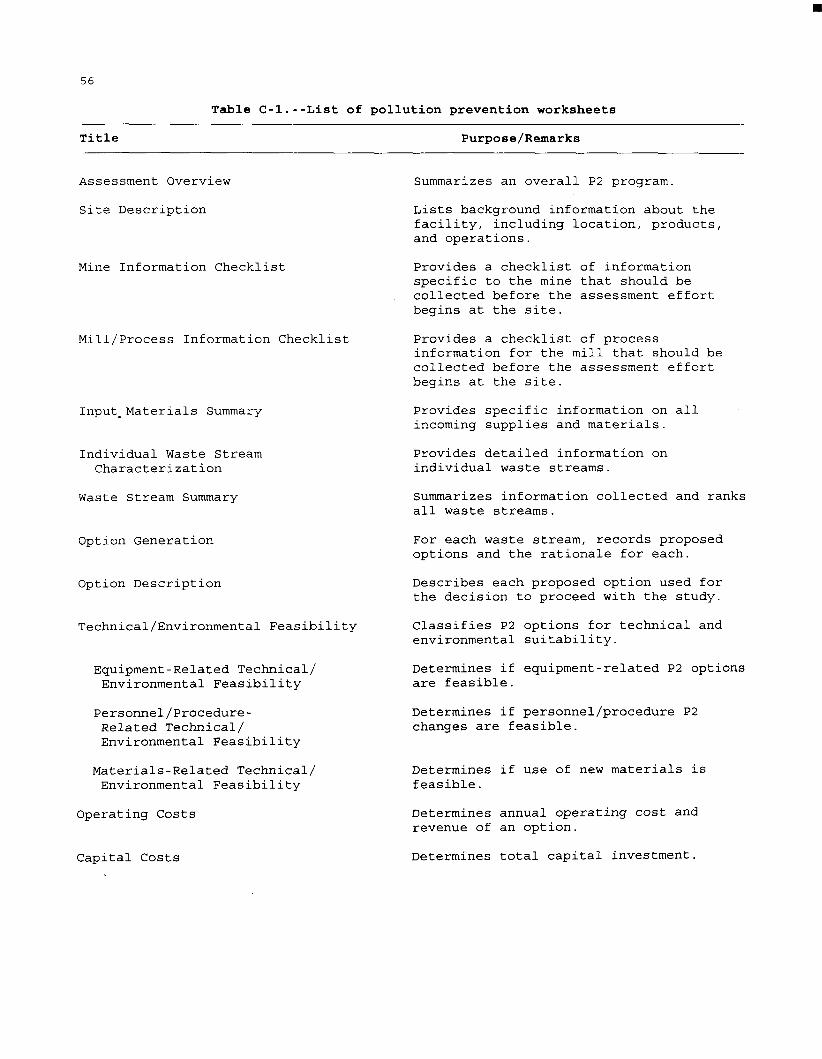
56
Table C-1.--List of pollution prevention worksheets
Title Purpose/Remarks
Assessment Overview
Site Description
Mine Information Checklist
Mill/Process Information Checklist
Input. Materials Summary
Individual Waste Stream Characterization
Waste Stream Summary
Option Generation
Option Description
Technical/Environmental Feasibility
Equipment-Related Technical/ Environmental Feasibility
Personnel/Procedure- Related Technicall Environmental Feasibility
Materials-Related Technicall Environmental Feasibility
Operating Costs
Summarizes an overall P2 program.
Lists background information about the facility, including location, products, and operations.
Provides a checklist of information specific to the mine that should be collected before the assessment effort begins at the site.
Provides a checklist of process information for the mill that should be collected before the assessment effort begins at the site.
Provides specific information on all incoming supplies and materials.
Provides detailed information on individual waste streams.
Summarizes information collected and ranks all waste streams.
For each waste stream, records proposed options and the rationale for each.
Describes each proposed option used for the decision to proceed with the study.
Classifies P2 options for technical and environmental suitability.
Determines if equipment-related P2 options are feasible.
Determines if personnel/procedure P2 changes are feasible.
Determines if use of new materials is feasible . Determines annual operating cost and revenue of an option.
Determines total capital investment. Capital Costs
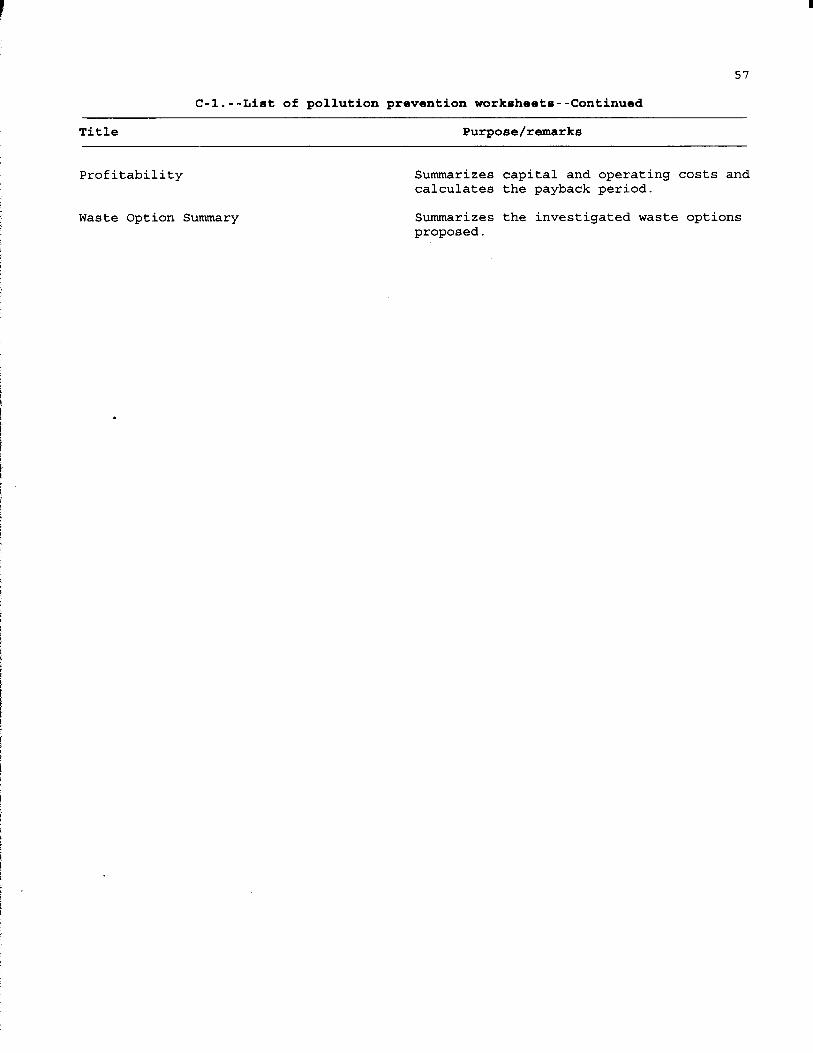
I
57
C-1.--List of pollution prevention worksheets--Continued
Title Purpose/remarks
Profitability
Waste Option Summary
Summarizes calculates
Summarizes proposed.
capital and operating costs and the payback period.
the investigated waste options

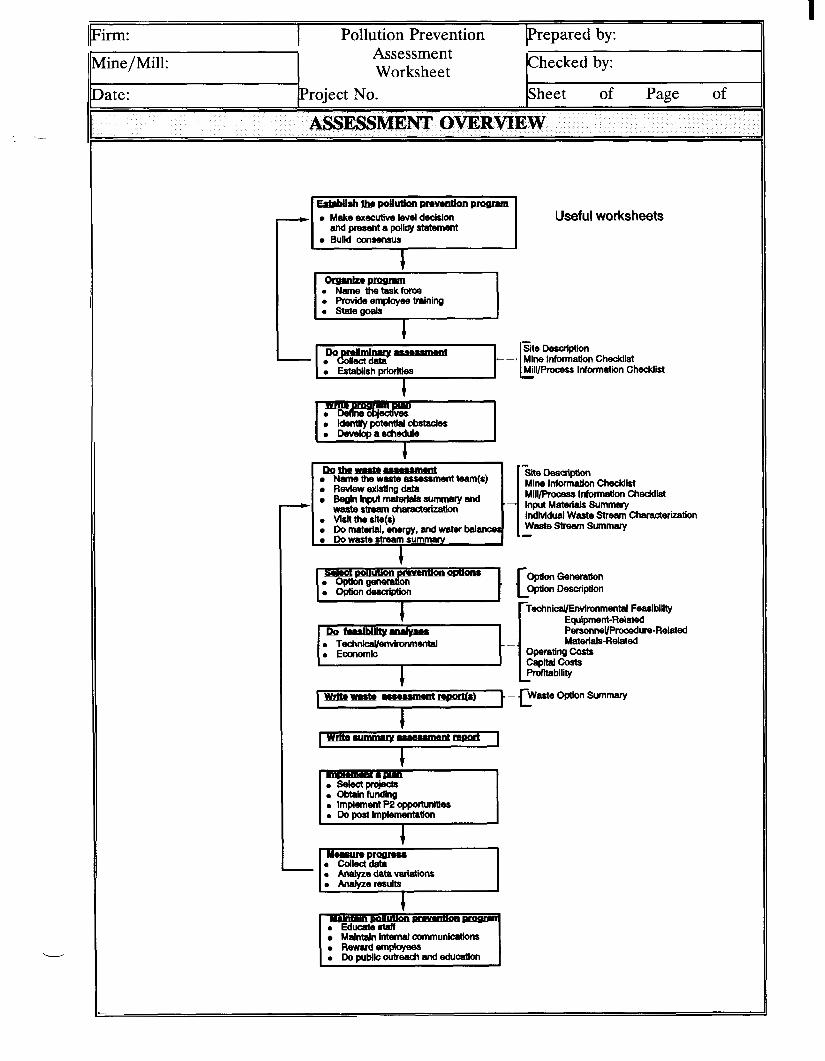
Iprm: I Pollution Prevention prepared by:
llMine/Mill: I (bate: broject NO.
Assessment Worksheet IChecked by:
ISheet of Page of I " I -
ASSESSMENT OVERVIEW
Make executive level dedsion
BUM consensus and present a policy statement
RQmY""m "e the waste assessment team@) RevlewexlsUngdata
mute"- * VsHthesite(s)
Do material, energy, and water balancec Do waste stream summay
BeQhlnplRmatdalssumf?aryand
Useful worksheets
- Site Description Mlne Infomtlon CheddM MiiVProcesr information Cheddist -
- SlteDeSalptbn Mine information C W i M i i ~ infomation Cheddist input Materlals Summary individual Waste Weam Characterization Waste St" Summary -
OpUonGene" --C O w n Description
-I 0 Analyzeresults
MdnMn internal mmunicatkm
I

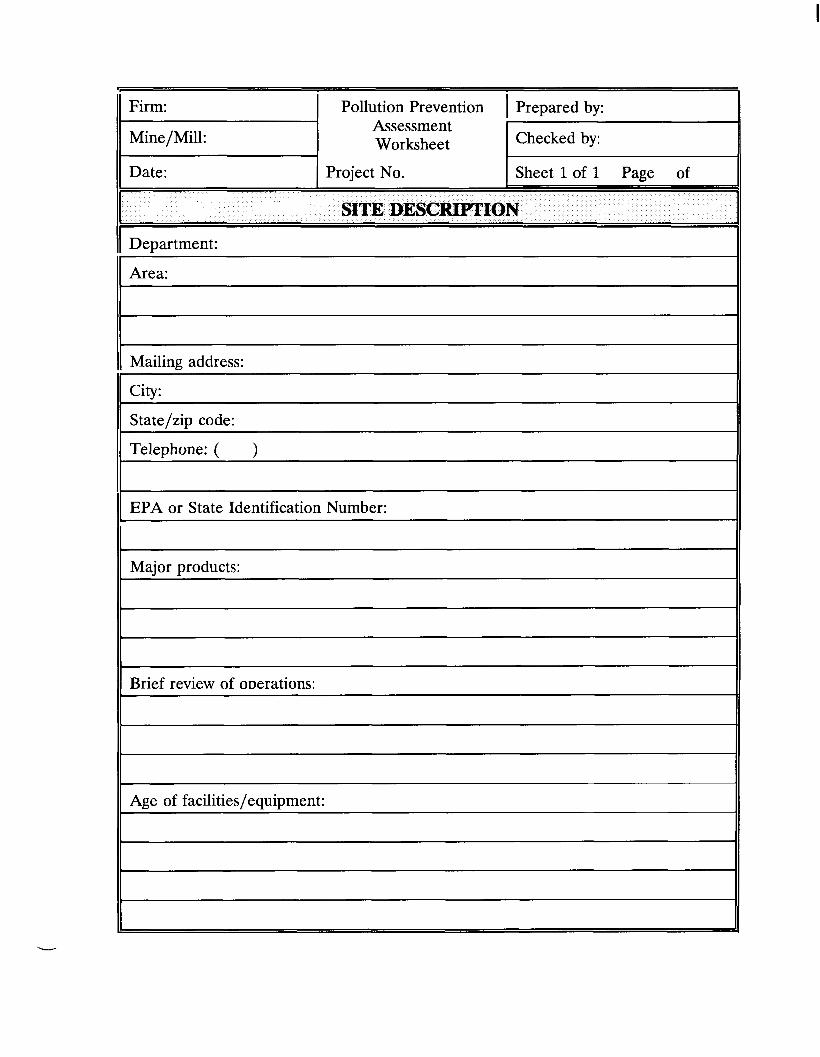
11 Firm: I Pollution Prevention I Prepared by:
1
Assessment Mine/Mill: Worksheet
Date: Project No.
EPA or State Identification Number:
Checked by:
I Sheet 1 of 1 Page of I I
SITE DESCRIPTION
11 Department:
Area:
11 Mailing address:
City:
State/ziD code:
Telephone: ( )
Major products:
11 Brief review of oDerations:
Age of facilities/equipment:
I

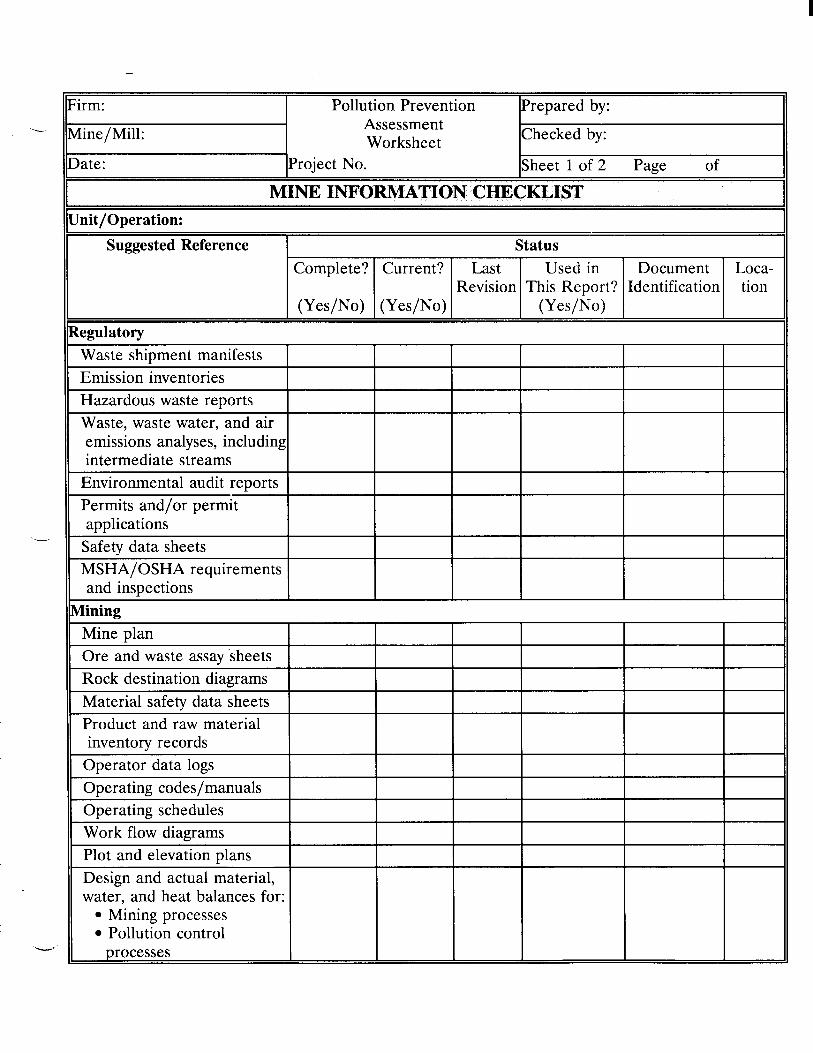
Ipirm: I Pollution Prevention IPrepared by:
Ibate: lproject NO.
Assessment Worksheet Checked by:
ISheet 1 of 2 Page of I I
tunit /Operation: Suggested Reference
Complete? Status
Current? Last Used in Document
(Yes/No) (Yes/No) Revision This Report? Identification
Loca- tion
Pollution control v

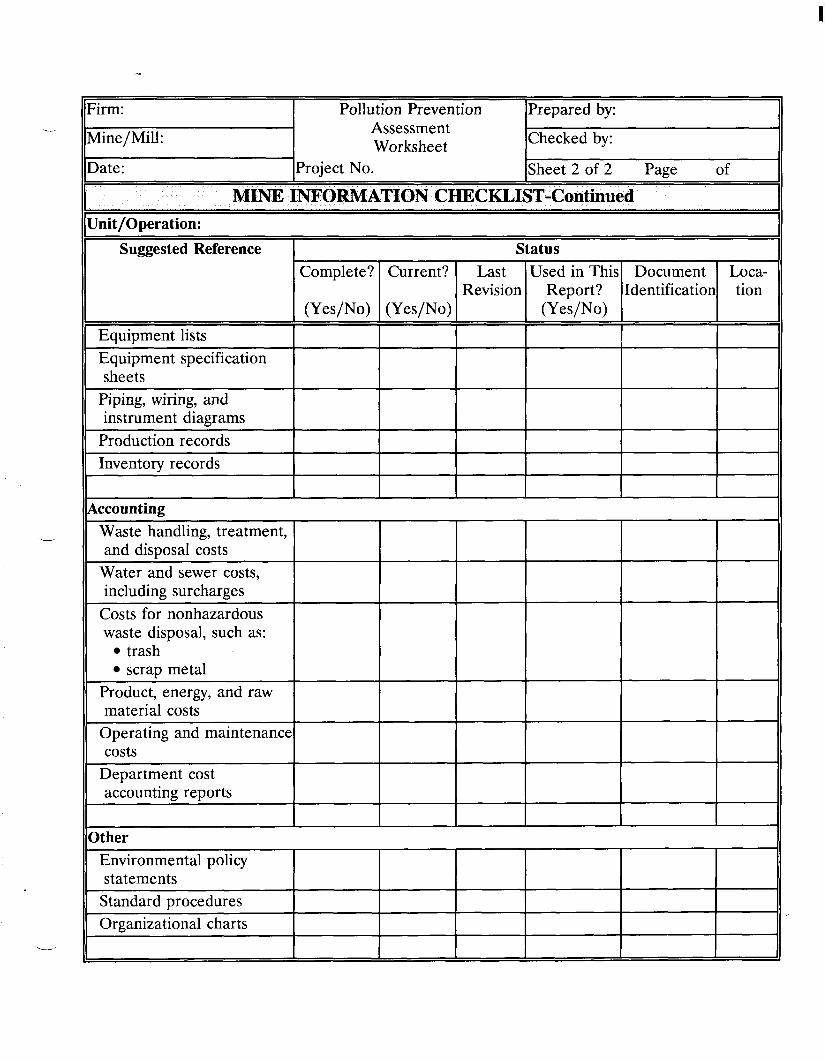
I
irm: Pollution Prevention IPrepared by:
4ine/Mill:
)ate:
Assessment Worksheet
Project No.
Complete? Current? Last Used in This Revision Report?
(Yes/No) (Yes/No) (Yes/No)
Checked by:
Sheet 2 of 2 Page of
Document Loca- Identification tion
CKLIS Jnit/O perat ion:
Suggested Reference I Status
iccoun ting Waste handling, treatment, and disposal costs
Water and sewer costs, including surcharges
Costs for nonhazardous waste disposal, such as:
trash scrap metal
Product, energy, and raw material costs
Operating and maintenance costs
Department cost accounting reports
Ither Environmental policy statements
Standard procedures Organizational charts

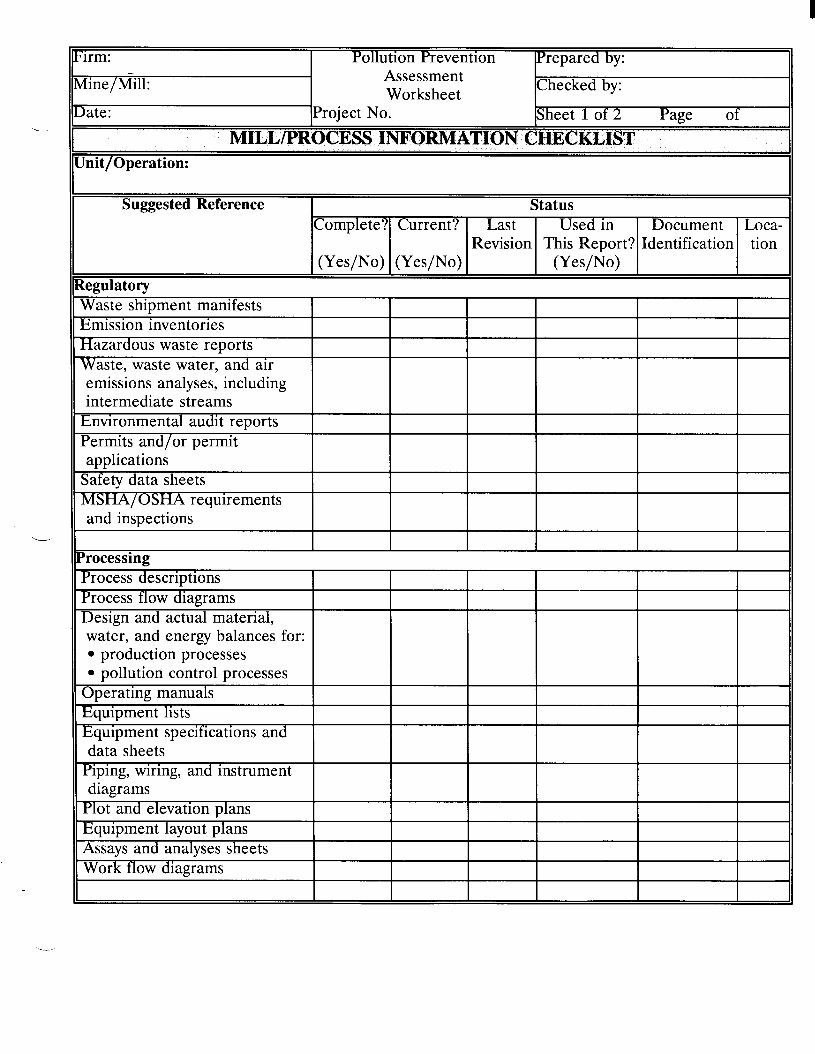
Iirm:
Aine/Mill:
Pollution Prevention repared by: Assessment Worksheet
Suggested Reference
late: (Project NO.
Status Complete? Current? Last Used in Document Loca-
Revision This Report? Identification tion (Yes/No) (Yes/No) (Yes/No)
Checked by:
ISheet 1 of 2 Page of
Jnit/Operation:

I

“n: I Pollution Prevention IPrepared by: 7 .
Suggested Reference
Customer specification sheets
Operating records Inventory records Production schedules
Assessment Worksheet
Status Complete? Current? Last Used in Document Loca-
Revision This Report? Identification tion (Yes/No) (Yes/No) (Yes/No)
late: lproject NO.
Checked by:
ISheet 2 of 2 Page of I I -
MILL/PROCESS INFORMATION CHECKLIST-Continued h i t/Opera t ion:

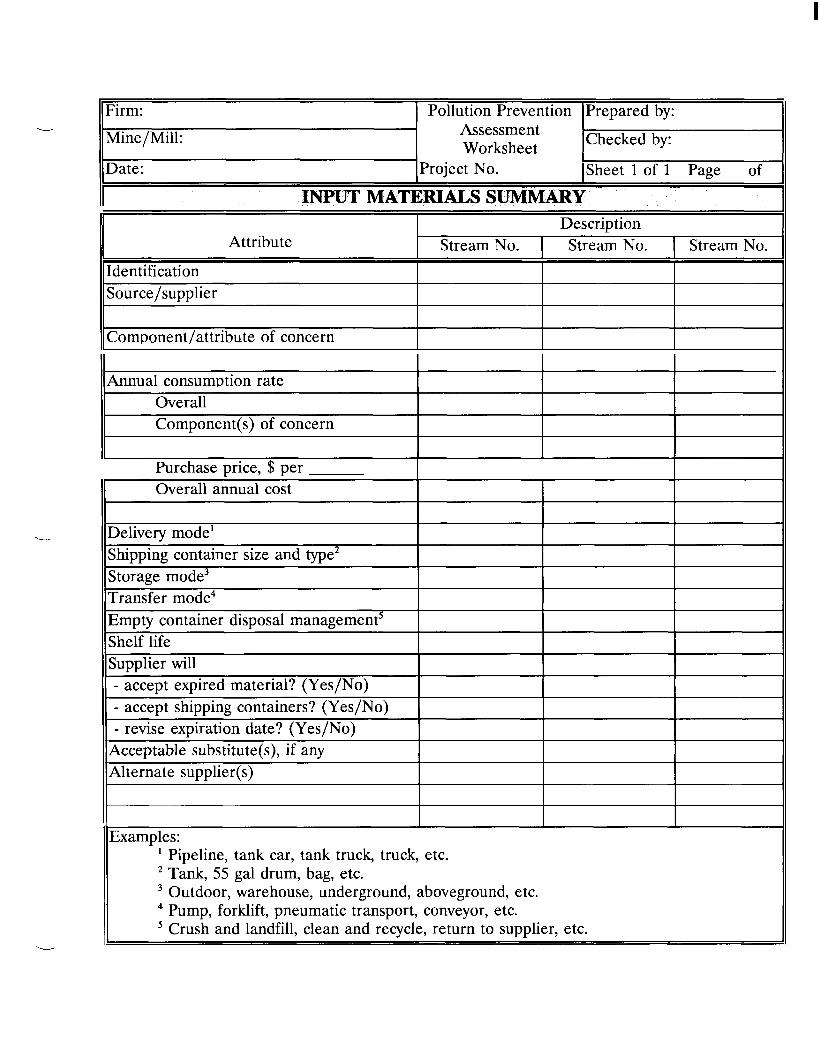
I
I (1 Firm: I Pollution Prevention IPrepared by:
Checked by: Assessment Worksheet
Mine/Mill:
L
Attribute
Identification Source/supplier
Component/attribute of concern
Description Stream No. Stream No. Stream No.
IIDate: 1 Project
Purchase price, $ per
No.
Overall annual cost
Delivery mode' shipping container size and type2 Storage mode3 Transfer mode4 Empty container disposal management5 Shelf life
ISheet 1 of 1 Page of
Examples: Pipeline, tank car, tank truck, truck, etc.
Outdoor, warehouse, underground, aboveground, etc. Pump, forklift, pneumatic transport, conveyor, etc. Crush and landfill, clean and recycle, return to supplier, etc.
2 Tank, 55 gal drum, bag, etc.
I
I I -
I/ INPUT MATERIALS SUMMARY
IIAnnual consumption rate I I I Overall Component(s) of concern
Supplier will - accept expired material? (Yes/No) - accept shipping containers? (Yes/No) - revise extiration date? (Yes/No)
Acceptable substitute(s), if any Alternate supplier(s)
--..---

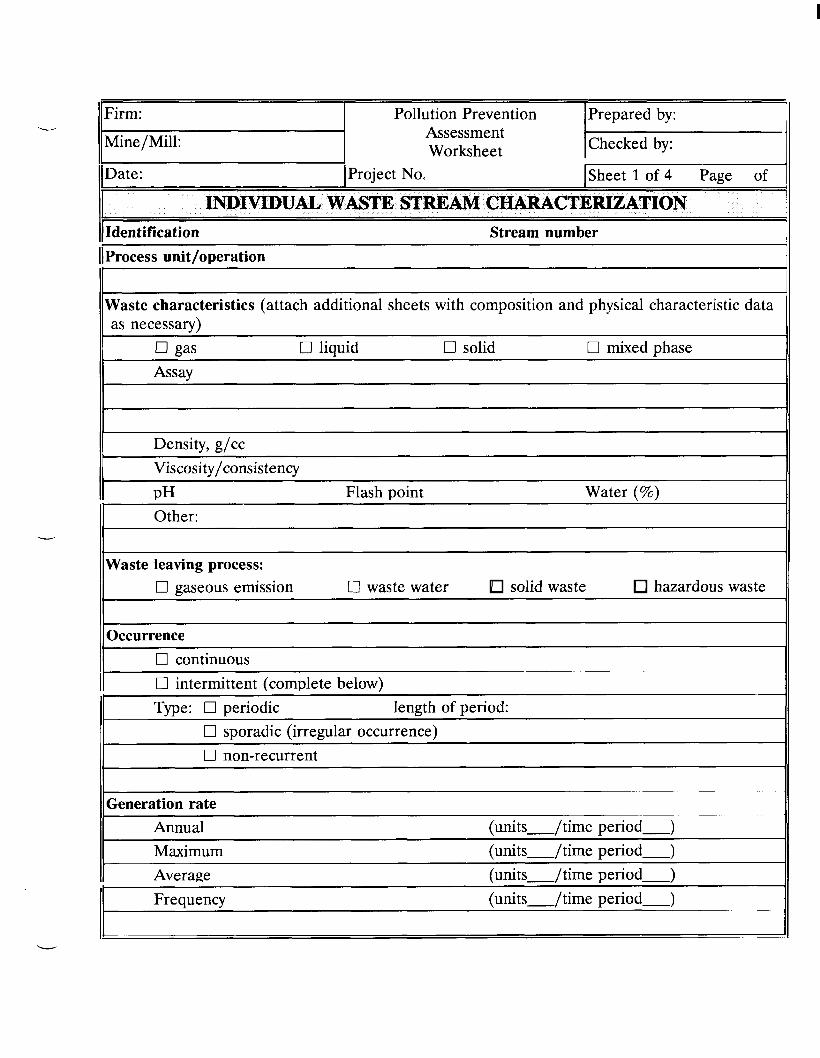
I
I I - - INDIVIDUAL WASTE STREAM CHARACTERIZATION
Firm:
Mine/Mill:
Pollution Prevention Assessment Worksheet
Prepared by:
IlDate: IProject No. ISheet 1 of 4 Page of
11 Identification Stream number 11 Process unit/operation
Waste characteristics (attach additional sheets with composition and physical characteristic data as necessary)
0 gas 0 liquid I3 solid 0 mixed phase
Density, g/cc Viscosity/consistency _ . II PH Flash point Water (%)
u
Other:
Waste leaving process: 0 gaseous emission 0 waste water solid waste hazardous waste
~
Occurrence 0 continuous 0 intermittent (complete below)
~
Type: 0 periodic length of period: 0 sporadic (irregular occurrence) I3 non-recurrent
~~
Generation rate Annual (units-/time period-) Maximum (units-/t ime period-)
ir- ~~
Average (units-/time period-) -~ ~ ~
Frequency (units-/ time period-)

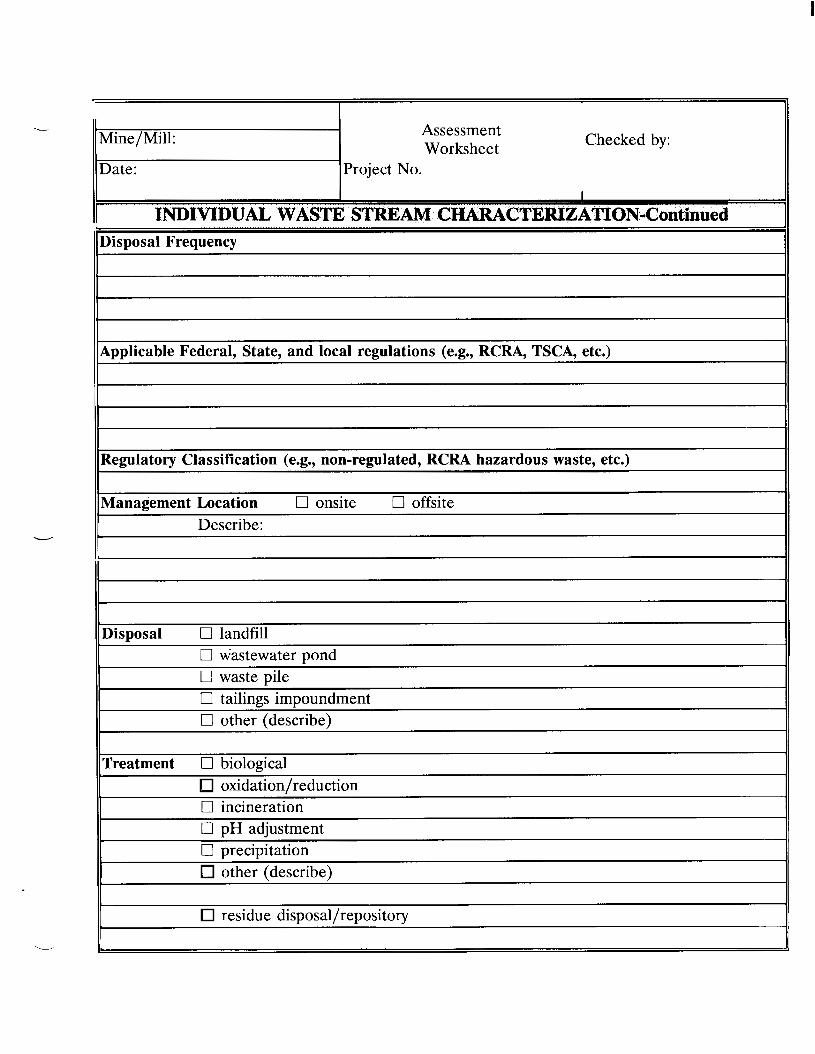
I
~
Regulatory Classification (e.g., non-regulated, RCRA hazardous waste, etc.)
Management Location 0 onsite 0 offsite Describe:
Mine/Mill:
Project
- Assessment Worksheet
No.
Checked by:
I I Ii INDIVIDUAL WASTE STREAM CHARACTERIZATION-Continued Disposal Frequency
Applicable Federal, State, and local regulations (e.g., RCRA, TSCA, etc.)
Disposal 0 landfill 0 wastewater Dond 0 waste pile 0 tailings impoundment 0 other (describe)
Treatment 0 biological oxidation/reduction
0 incineration 0 pH adjustment 0 precipitation
other (describe)
residue disposal/repository

I
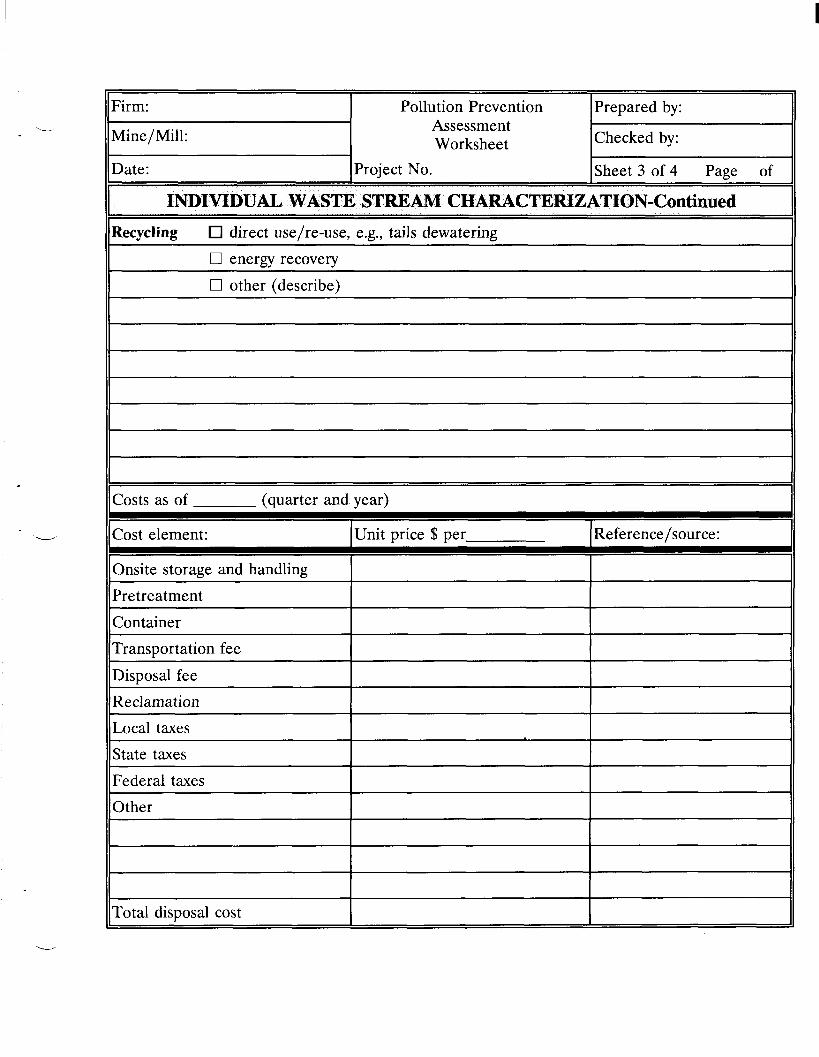
Firm:
~~~~ ~ ~~ ~ ~ ~
Transportation fee
Disposal fee
Reclamation Local taxes
State taxes
_ _ ~ ___
Pollution Prevention Assessment Worksheet
(IDate: Project No.
Prepared by:
Checked by:
I I I
IRecycling direct use/re-use, e.g., tails dewatering II 0 energy recovery
0 other (describe)
IICosts as of (quarter and year)
u ((Cost element: (Unit price $ per 1 Reference/source:
Onsite storage and handling
Pretreatment
11 Container
11 Federal taxes
ITotal disposal cost


))Firm: I Pollution Prevention 1 Prepared by:
1 Mine/Mill: Assessment Worksheet
IIDate: I Project No.
Checked by: l l I I - li INDIVIDUAL WASTE STREAM CHARACTERIZATION-Continued
Waste Origins/Sources Is the waste mixed with other wastes? If yes, fill out a sheet for each of the individual waste streams.
0 Yes 0 No
Describe how the waste is generated, e.g., spill or leak cleanup, evaporative losses from heap or dump leaches, waste rock, slags lost from dore casting, leach solution from leaking pumps, etc. Attach flowsheets for clarity where appropriate.

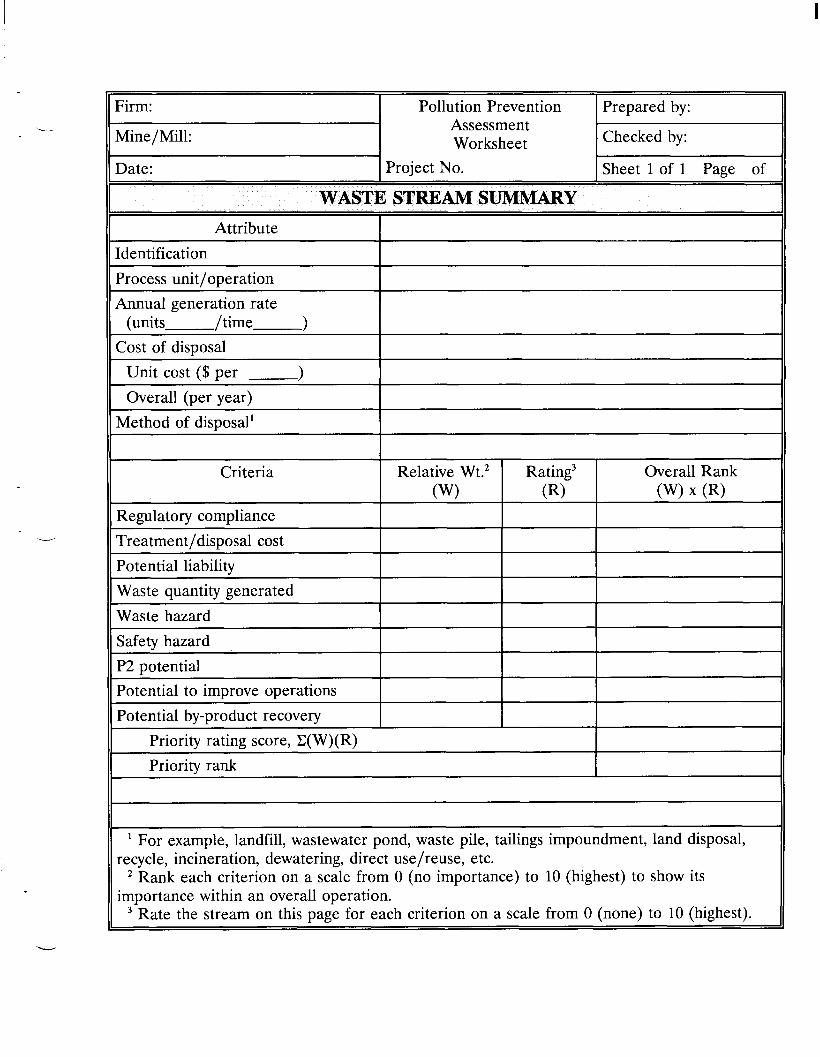
I
Firm: Pollution Prevention I Prepared by:
Mine/Mill:
Criteria
Regulatory compliance Treatment/disposal cost Potential liability Waste quantity generated Waste hazard Safety hazard P2 potential Potential to improve operations Potential by-product recovery
Assessment Worksheet
Relative Wt.2 Rating3 Overall Rank (W) (R) (W) x (R)
11 Date: Project No.
Checked by:
I Sheet 1 of 1 Page of I I I
II Attribute
11 Identification I 11 Process unit/operation
Annual generation rate
Cost of disposal (units /time )
Overall (per year) Method of disposal'
For example, landfill, wastewater pond, waste pile, tailings impoundment, land disposal,
Rank each criterion on a scale from 0 (no importance) to 10 (highest) to show its
Rate the stream on this page for each criterion on a scale from 0 (none) to 10 (highest).
recycle, incineration, dewatering, direct use/reuse, etc.
importance within an overall operation.

I
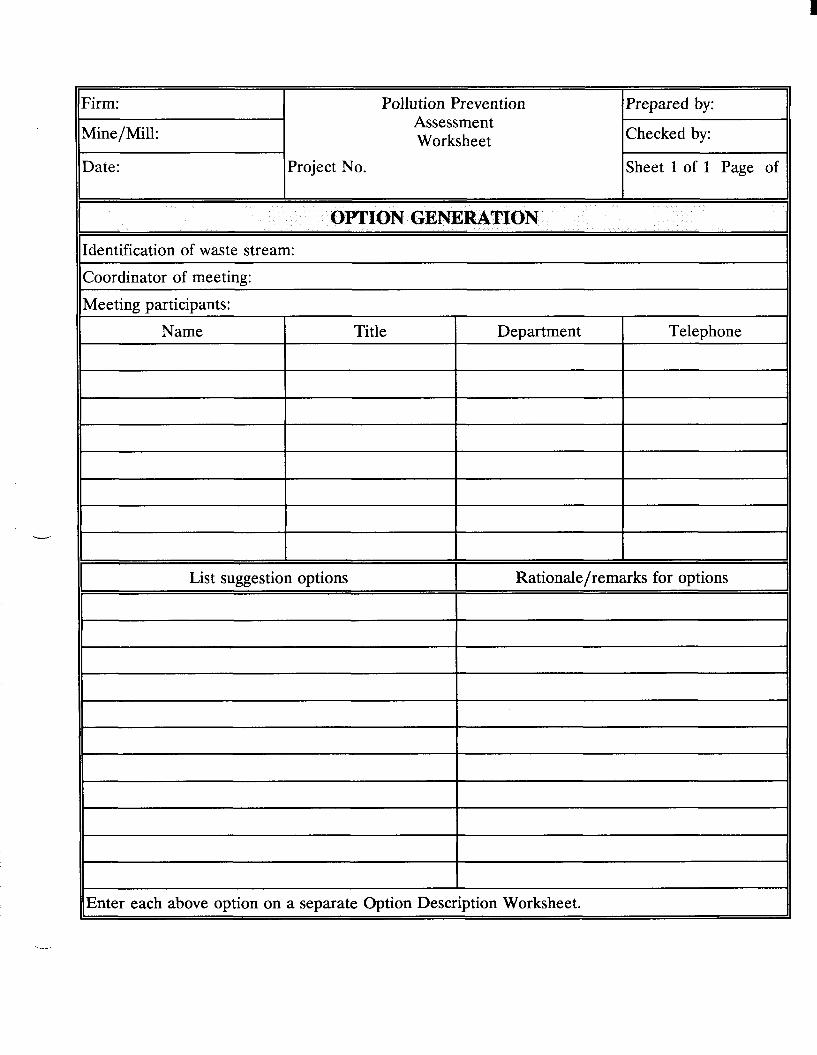
Firm:
List suggestion options
Mine/Mill:
Rationale/remarks for options
Pollution Prevention Assessment Worksheet
~~
IPrepared by:
IChecked by:
Date: Project No. Sheet 1 of 1 Page of
Identification of waste stream:
Coordinator of meeting:
Meeting participants:
Name Title Department Telephone
~~
Enter each above option on a separate Option Description Worksheet.

I
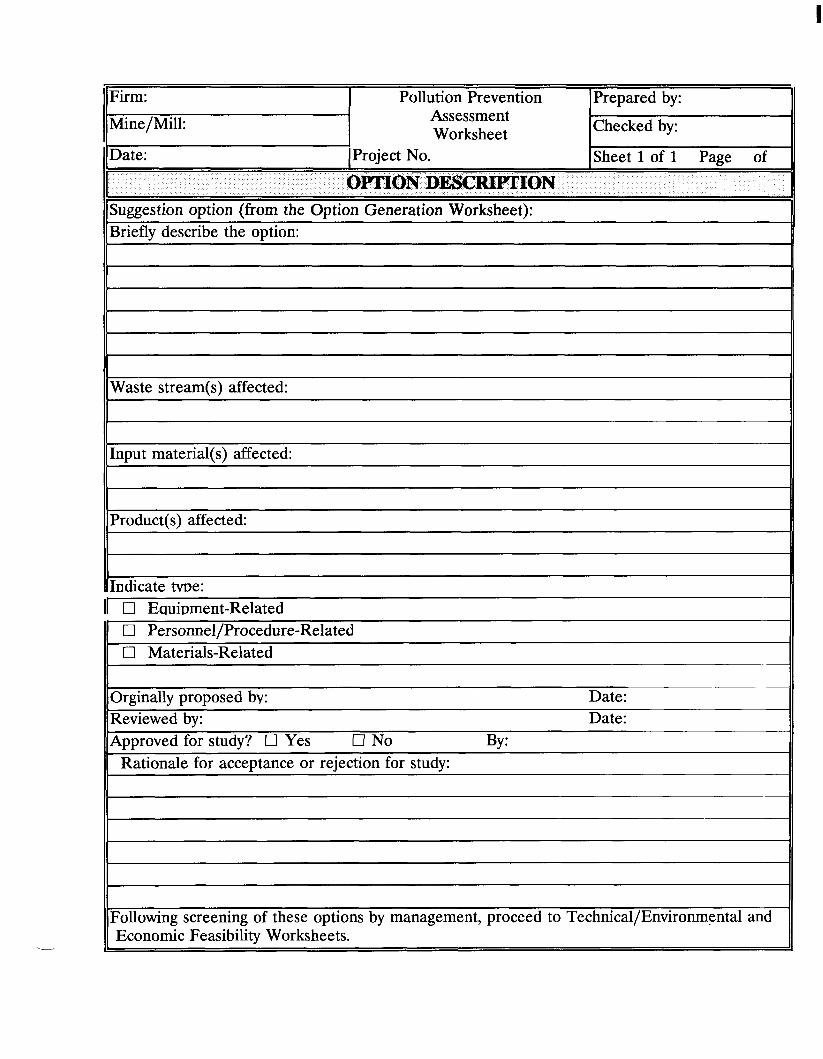
I
I !!Firm: I Pollution Prevention IPrepared by:
'Mine/Mill:
-0 Personnel/Procedure-Related 0 Materials-Related
Assessment Worksheet
Following screening of these options by management, proceed to Technical/Environmental and Economic Feasibility Worksheets.
IIDate: [Project No.
Checked by:
ISheet 1 of 1 Page of L -
OPTION DESCRIPTION Suggestion option (from the Option Generation Worksheet): Briefly describe the option:
Waste stream(s) affected:
Input material(s) affected:
Product(s) affected:
hndicate me: I r O EauiDment-Related
IlOrginallv proposed bv: Date: Y I A I
Reviewed by: Date: Approved for study? 0 Yes 0 No By:
Rationale for acceptance or rejection for study:


:irm:
dine/Mill:
Pollution Prevention IPrepared by: Assessment Worksheet
late: IProject No.
Checked by: I I 1 -
TECHNICAL/ENVIRONMENTAL FEASIBILITY '2 option description: f the o d o n amears technicallv feasible, Drovide rationale for this:
P2 Option Category 0 Equipment-related (complete Equipment-Related Technical/Environmental Feasibility Worksheet)
Technical/Environmental Feasibility Worksheet)
Technical/Environmental Feasibility Worksheet)
0 Personnel/procedure related (complete Personnel\Procedure
0 Materials-related (complete Material-Related
Following completion of all of the above, does this P2 option appear technically and environmentally feasible, based upon the above?
0 Yes 0 No (if no, discard this option from further consideration)

3
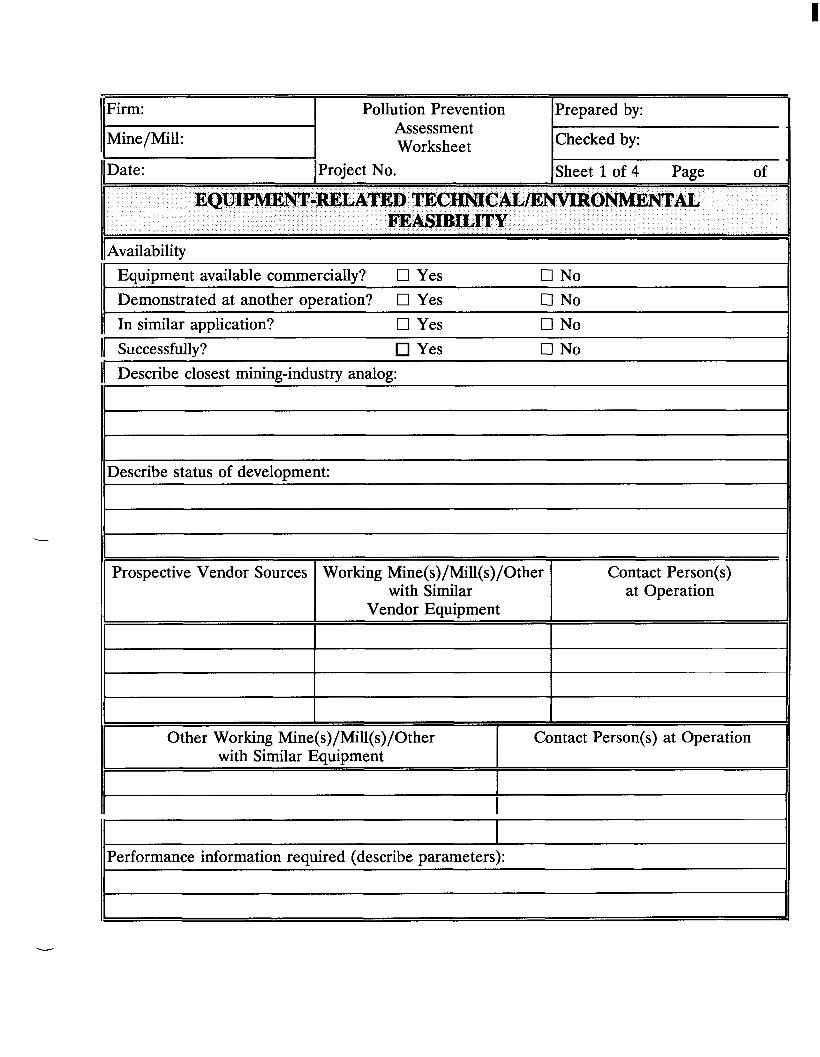
I
I 11 Firm: I Pollution Prevention IPrepared by:
Mine/Mill:
Prospective Vendor Sources
Assessment Worksheet
Working Mine(s)/Mill(s)/Other Contact Person(s) with Similar at Operation
Vendor Equipment
]]Date: ]Project No.
Other Working Mine( s)/Mill( s)/Other with Similar Equipment
Checked by: 1
Contact Person(s) at Operation
I I Y
EQUI-W-RELATED TEC€€NICAL/ENVIRONMENTAL FEASIBILITY
Equipment available commercially? Cl Yes 0 No Demonstrated at another operation? 0 Yes 0 No
11 In similar application? 0 Yes 0 No 11 Successfully? Yes El No 11 Describe closest mining-industry analog:
Describe status of development:
It I
I
Performance information required (describe parameters):


I
I
-4
Assessment Worksheet Mine/Mill:
IFirm: I Pollution Prevention I Prepared by:
(IDate: Project No.
IChecked by:
ISheet 2 of 4 Page of -
EQUIPMENT-RELATED TEC€€NICAL/ENVIRONMEN"AL
Environmental considerations Are indirect environmental tradeoffs going to be experienced? 0 Yes 0 No If yes, explain:
Nature of testing: Scale: 0 bench 0 pilot 0 other
Testing required 0 Yes 0 No
11 Test unit available? 0 Yes 0 No 11 Test parameters (list):
Testing location: At operation 0 Other
Facility/production constraints Space requirements:
11 Possible locations within facility:
11 Adequate existing facilities? 0 Yes 0 No. Explain solution:
Utility requirements Electric power: Volts (AC or DC): kW: Process water: Flow: Pressure:
Quality (tap, demineralized, etc.):
Duty: Fuel: Type: Flow:
Other:

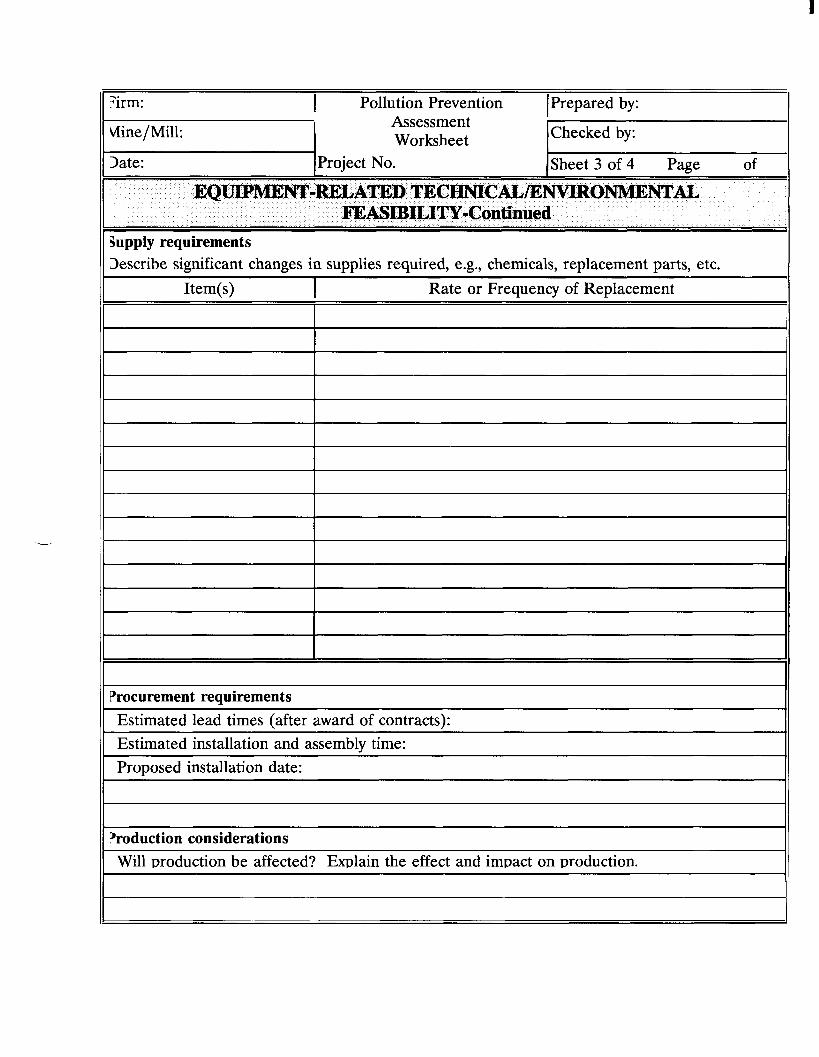
I
I Pollution Prevention T. irm:
I Uine / Mill:
Date: lproject NO.
Assessment Worksheet
I Prepared by:
IChecked by:
ISheet 3 of 4 Page of I I "
EQUIPMENT-RELATED TECHNICAL/ENVIRONMENTAL FEASIBILITY -Continued
Supply requirements Describe significant changes in supplies required, e.g., chemicals, replacement parts, etc.
Item(s) I Rate or Frequency of Replacement
Procurement requirements Estimatedlead times (after award of contracts): Estimated installation and assembly time: Proposed installation date:
Production considerations Will production be affected? Explain the effect and impact on production.


I
Firm: Pollution Prevention IPrepared by: I Mine/Mill: Assessment
Worksheet Date: 1Project NO.
Checked by: I -
EQUIPMENT-RELATED TECHNIC RONMENTAL
Will product quality be affected? Explain the effect on quality.
Will operations modifications to the flowsheet production procedures be required? Explain.
~~
Maintenance considerations How is service handled (maintenance and technical assistance)?
What warranties are offered?
Storage considerations Describe additional storage or material handling requirements.
Other significant requirements Describe additional laboratory or analytical requirements.
Does this option appear technically and environmentally feasible, based upon the above? I 0 Yes 17 No

I
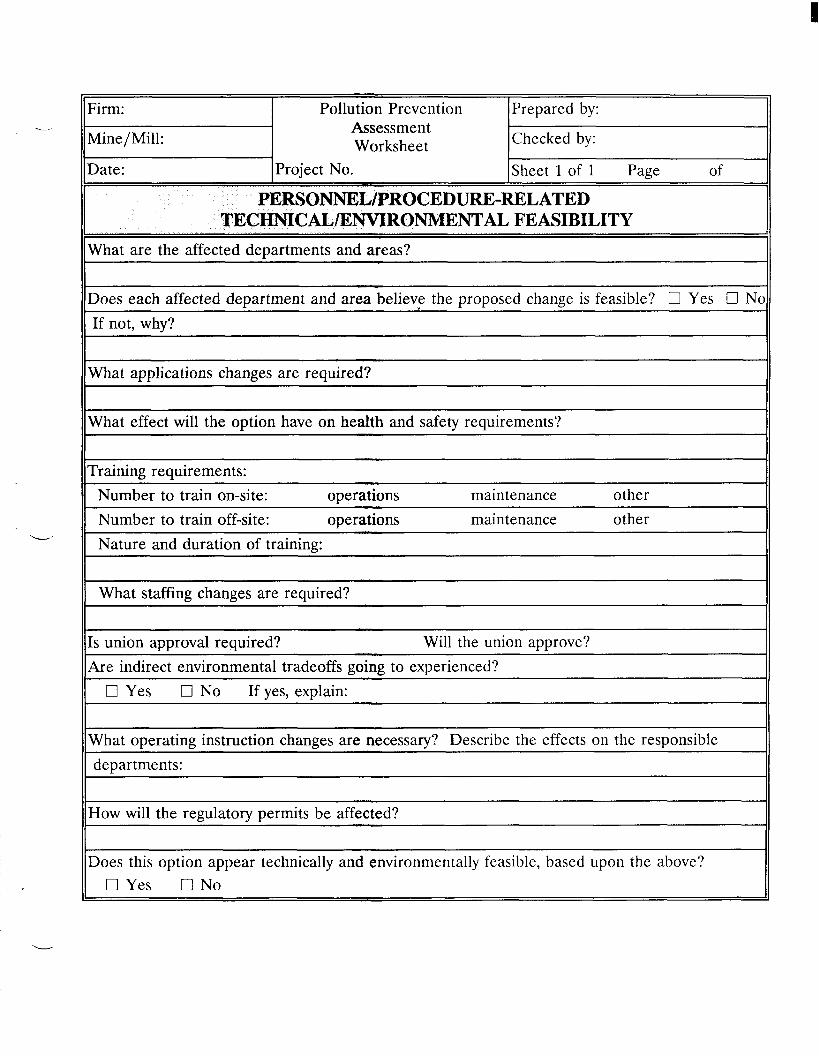
I
3rm: Pollution Prevention I Prepared by:
vfine/Mill: I late:
Assessment Worksheet
Project No.
Checked by:
ISheet 1 of 1 Page of I I -
OCEDURE-RELATED NVIRONMENTAL FEASIBILITY
What are the affected departments and areas?
loes each affected department and area believe the proposed change is feasible? 0 Yes 0 Nc If not, why?
What applications changes are required?
What effect will the option have on health and safety requirements?
rraining requirements: Number to train on-site: operations maintenance other Number to train off-site: operations maintenance other Nature and duration of training:
~~ ~~
What staffing changes are required?
s union approval required? Will the union approve? b e indirect environmental tradeoffs going to experienced? 0 Yes 0 No If yes, explain:
Nhat operating instruction changes are necessary? Describe the effects on the responsible departments:
iow will the regulatory permits be affected?
loes this option appear technically and environmentally feasible, based upon the above? 0 Yes 0 No


I
..
Firm: Pollution Prevention IPrepared by:
Mine/Mill: Assessment Worksheet Checked by:
Has the new material been demonstrated commercially? 0 Yes 0 No [n a similar application? Yes 0 No
~ ~~~
Successfully? Yes ~ 0 No Describe closest mining-industry analog.
What are the affected departments and areas? Do they believe the proposed change is feasible?
Will production quantity be affected? Explain the effect and the impact on production.
Will production quality be affected? Explain the effect on quality.
Will additional storage, handling, or other ancillary equipment be required? Explain.
~
Describe any training or procedure changes that are required.

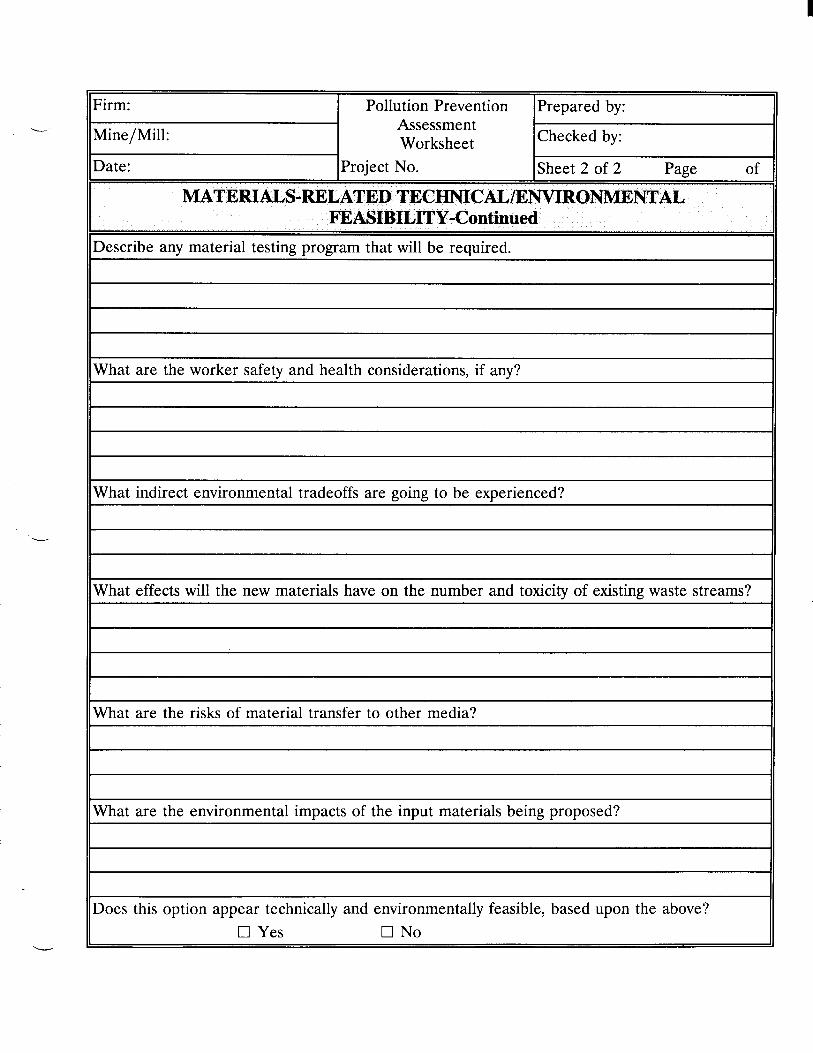
I
Firm: Pollution Prevention IPrepared by: Assessment
Describe any material testing program that will be required.
What are the worker safety and health considerations, if any?
What indirect environmental tradeoffs are going to be experienced?
What effects will the new materials have on the number and toxicity of existing waste streams?
What are the risks of material transfer to other media?
What are the environmental impacts of the input materials being proposed?
Does this option appear technically and environmentally feasible, based upon the above? 0 Yes 0 No


7 . 'irm:
Operating Cost /Revenue Item
dine/ Mill:
$ per Year
Pollution Prevention Assessment Worksheet
IPrepared by
Checked by I I
lperating costs
Decrease (or increase) in disposal
Decrease (or increase) in raw materials
Decrease (or increase) in utility
Decrease (or increase) in quality
Decrease (or increase) in labor
Decrease (or increase) in supplies 1 Decrease (or increase) in insurance
Decrease (or increase) in overhead
Total decrease (or increase) in operating cost
Revenue
Incremental revenue from increased (decreased) production
Incremental revenue from marketable by-products
Net incremental revenue change:
Units of production (annual)
hnual net operating cost savings (loss)
Enter annual net operating cost savings on Profitability Worksheet.

I
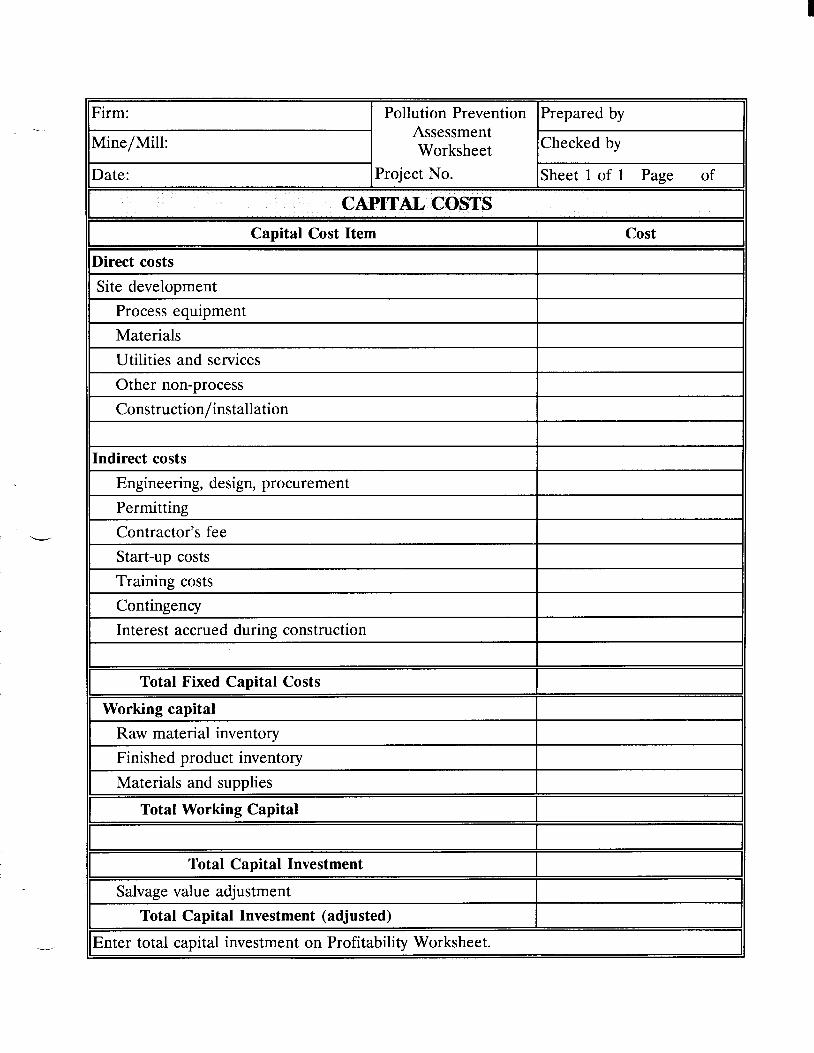
I
I Pollution Prevention IPrepared by 7 . w-m: Assessment Worksheet Checked by dine/Mill:
late: I Project No. ISheet 1 of 1 Page of
Capital Cost Item I Cost
lirect costs I Site development
Process equipment I _ _ _ _ ~
Materials Utilities and services Other non-process Construction/installation
ndirect costs Engineering, design, procurement Permitting Contractor’s fee Start-up costs Training costs Contingency Interest accrued during construction
Total Fixed Capital Costs
Working capital Raw material inventory Finished product inventory Materials and suuulies
Total Working Capital
Total Capital Investment ~
Salvage value adjustment Total Capital Investment (adjusted)
~
2nter total capital investment on Profitability Worksheet.


I
I Pollution Prevention 7 . w-m:
I Viine/Mill:
Date: IProject No.
Assessment Worksheet
Prepared by
Checked by
ISheet 1 of 1 Page of I I Y
rota1 capital investment ($ from Capital Cost Worksheet)
4nnual net operating cost savings ($ per year from Operating Cost Worksheet)
rota1 operating cost ($/unit)
Total capital investment Annual net operating cost savings
- - Payback period
Discounted cash flow rate of return can be investigated at this point. Several texts are available applying this technique, e.g., "Economic Evaluation and Investment Decision Methods," 8th Edition, by F.J. Stermole and J.M. Stermole, May 1993, Investment Evaluations Corporation, Golden, Colorado.

I
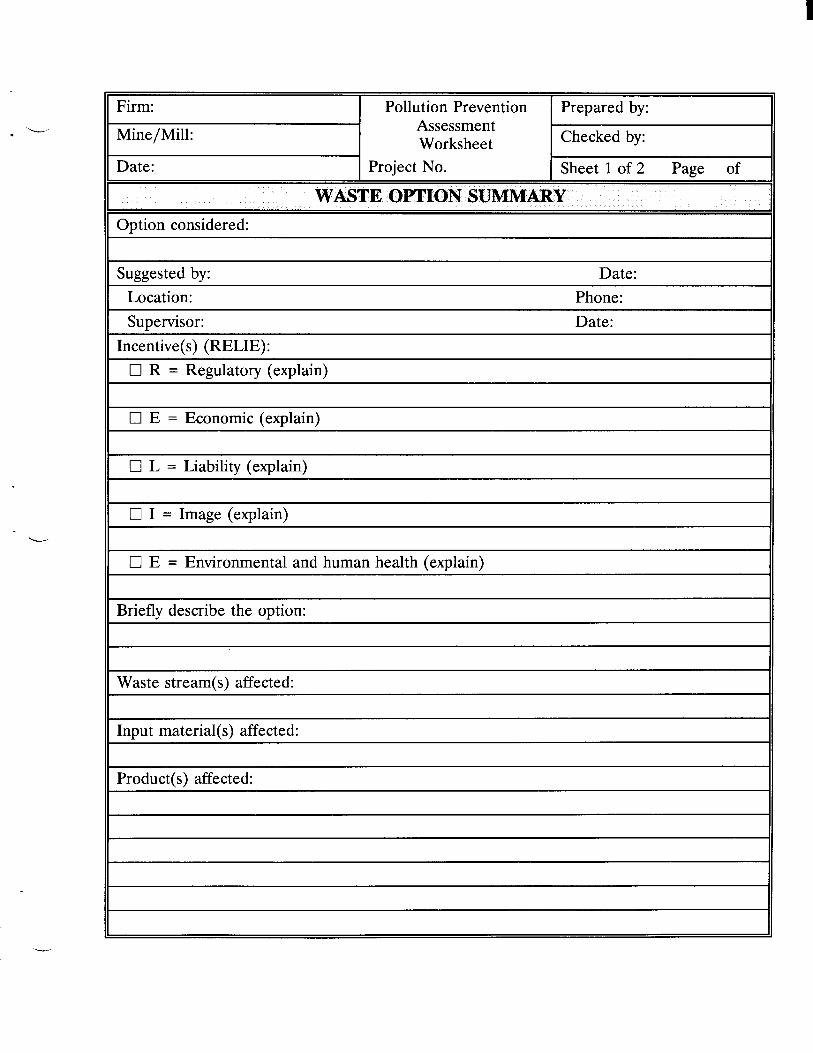
I
I 11 Firm: I Pollution Prevention I Prepared by:
Assessment Worksheet Mine/Mill:
11 Date: Project No.
Checked by:
I Sheet 1 of 2 Page of I I I
I Option considered:
Suggested by: Date: Location: Phone: Supervisor: Date:
Incentive(s) (RELIE): 0 R = Regulatory (explain)
0 E = Economic (explain)
11 Cl L = Liability (explain)
0 I = Image (explain)
0 E = Environmental and human health (explain)
Briefly describe the option:
Waste stream(s) affected:
Input material(s) affected:
Product(s) affected:

I

I
Date:
Firm:
Project No. Sheet 2 of 2 Page of
I Pollution Prevention I Prepared by:
Mine / Mill: Assessment Worksheet Checked by:
If no, give reason(s):
Economically feasible? 0 Yes 0 No If no, give reason(s):
Indicate type: 0 Source reduction: 0 Equipment-related change 0 Personnel/procedure-related change 0 Materials-related change 0 Other
0 Recyclinglreuse: El On-site c3 Off-site 0 Material reused for orginal purpose 0 Material used for a lower-quality purpose 0 Material sold as product
~
0 Material burned for heat recovery
Reviewed by: Date: Approved for study? 0 Yes 0 No Approved by:
Reason for acceptance or rejection:

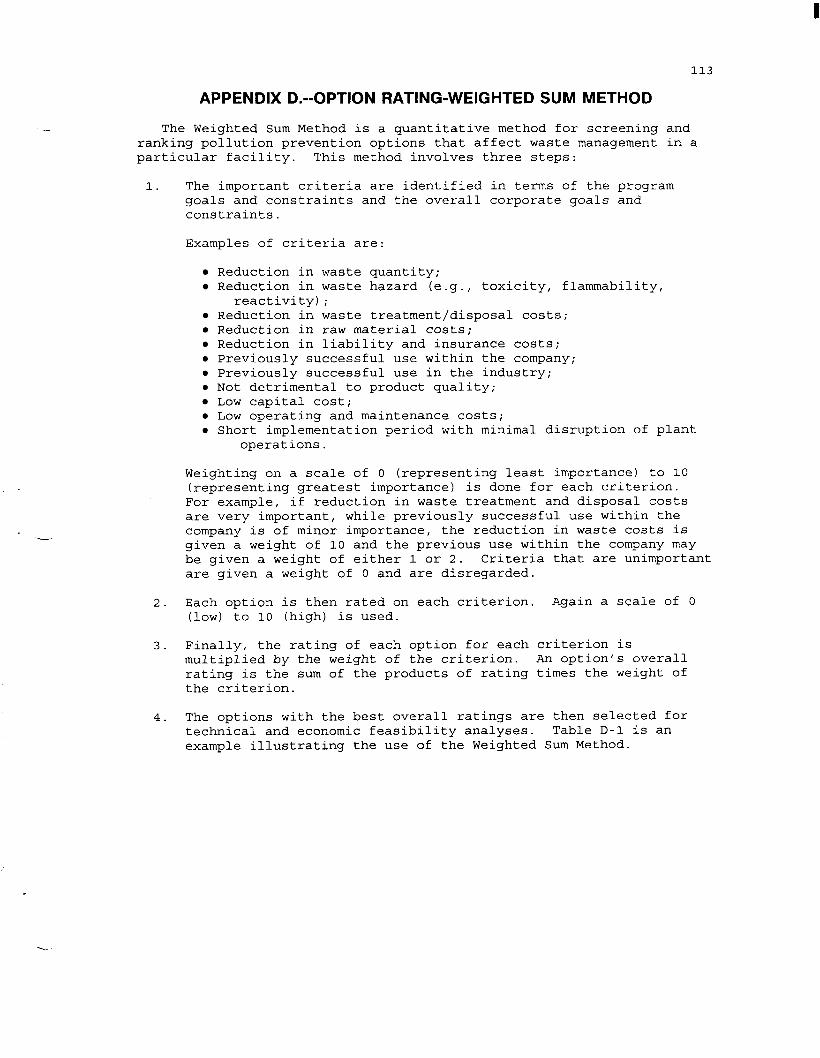
I
113
APPENDIX D.--OPTION RATING-WEIGHTED SUM METHOD
The Weighted Sum Method is a quantitative method for screening and ranking pollution prevention options that affect waste management in a particular facility. This method involves three steps:
1. The important criteria are identified in terms of the program goals and constraints and the overall corporate goals and constraints.
Examples of criteria are:
Reduction in waste quantity; Reduction in waste hazard (e.g., toxicity, flammability,
Reduction in waste treatment/disposal costs; Reduction in raw material costs; Reduction in liability and insurance costs; Previously successful use within the company; Previously successful use in the industry;
0 Not detrimental to product quality; Low capital cost; Low operating and maintenance costs; Short implementation period with minimal disruption of plant
reactivity) ;
operations.
Weighting on a scale of 0 (representing least importance) to 1 0 (representing greatest importance) is done for each criterion. For example, if reduction in waste treatment and disposal costs are very important, while previously successful use within the company is of minor importance, the reduction in waste costs is given a weight of 10 and the previous use within the company may be given a weight of either 1 or 2. Criteria that are unimportant are given a weight of 0 and are disregarded.
2. Each option is then rated on each criterion. Again a scale of 0 (low) to 10 (high) is used.
3. Finally, the rating of each option for each criterion is multiplied by the weight of the criterion. An option's overall rating is the sum of the products of rating times the weight of the criterion.
4. The options with the best overall ratings are then selected for technical and economic feasibility analyses. Table D-1 is an example illustrating the use of the Weighted Sum Method.
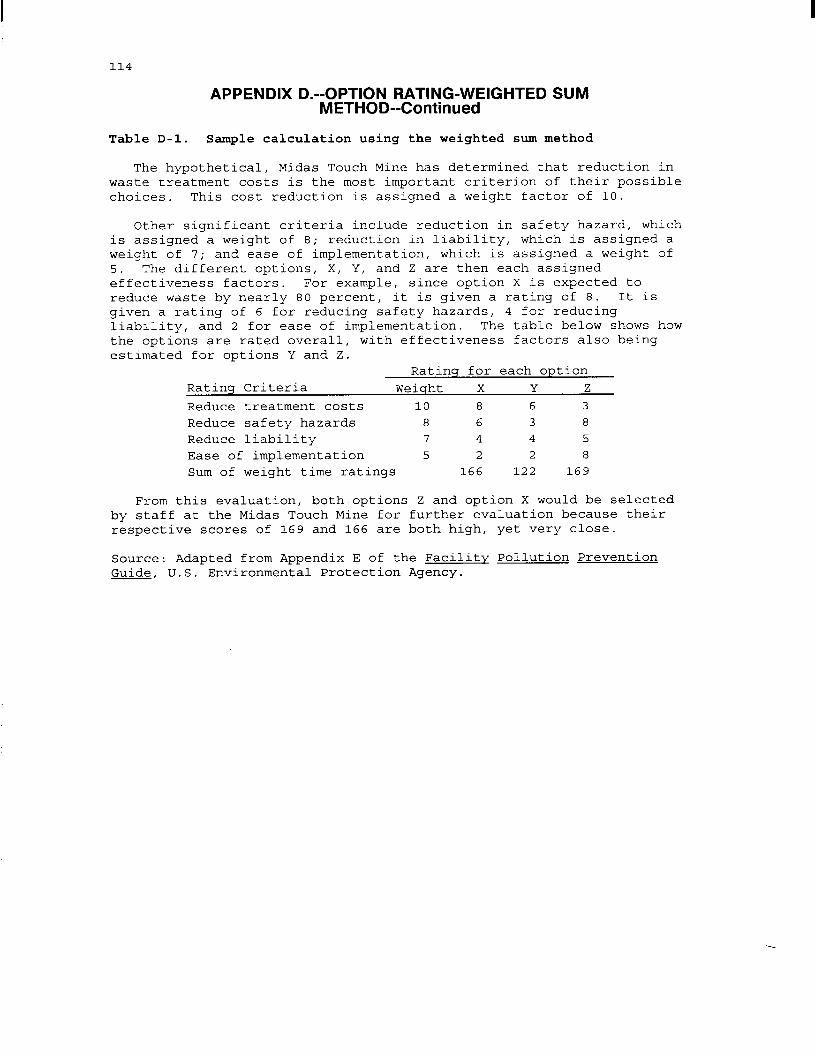
114
APPENDIX D.--OPTION RATING-WEIGHTED SUM METHOD--Continued
Table D-1. Sample calculation using the weighted sum method
The hypothetical, Midas Touch Mine has determined that reduction in waste treatment costs is the most important criterion of their possible choices. This cost reduction is assigned a weight factor of 10.
Other significant criteria include reduction in safety hazard, which is assigned a weight of 8; reduction in liability, which is assigned a weight of 7; and ease of implementation, which is assigned a weight of 5. The different options, X, Y, and Z are then each assigned effectiveness factors. For example, since option X is expected to reduce waste by nearly 80 percent, it is given a rating of 8. It is given a rating of 6 for reducing safety hazards, 4 for reducing liability, and 2 for ease of implementation. The table below shows how the options are rated overall, with effectiveness factors also being estimated for options Y and Z .
Ratinq for each option
Reduce treatment costs 10 8 6 3 Reduce safety hazards 8 6 3 8 Reduce liability 7 4 4 5 Ease of implementation 5 2 2 8 Sum of weight time ratings 166 122 169
Rating Criteria Weiqht X Y Z
From this evaluation, both options Z and option X would be selected by staff at the Midas Touch Mine for further evaluation because their respective scores of 169 and 166 are both high, yet very close.
Source: Adapted from Appendix E of the Facility Pollution Prevention Guide, U.S. Environmental Protection Agency.
.
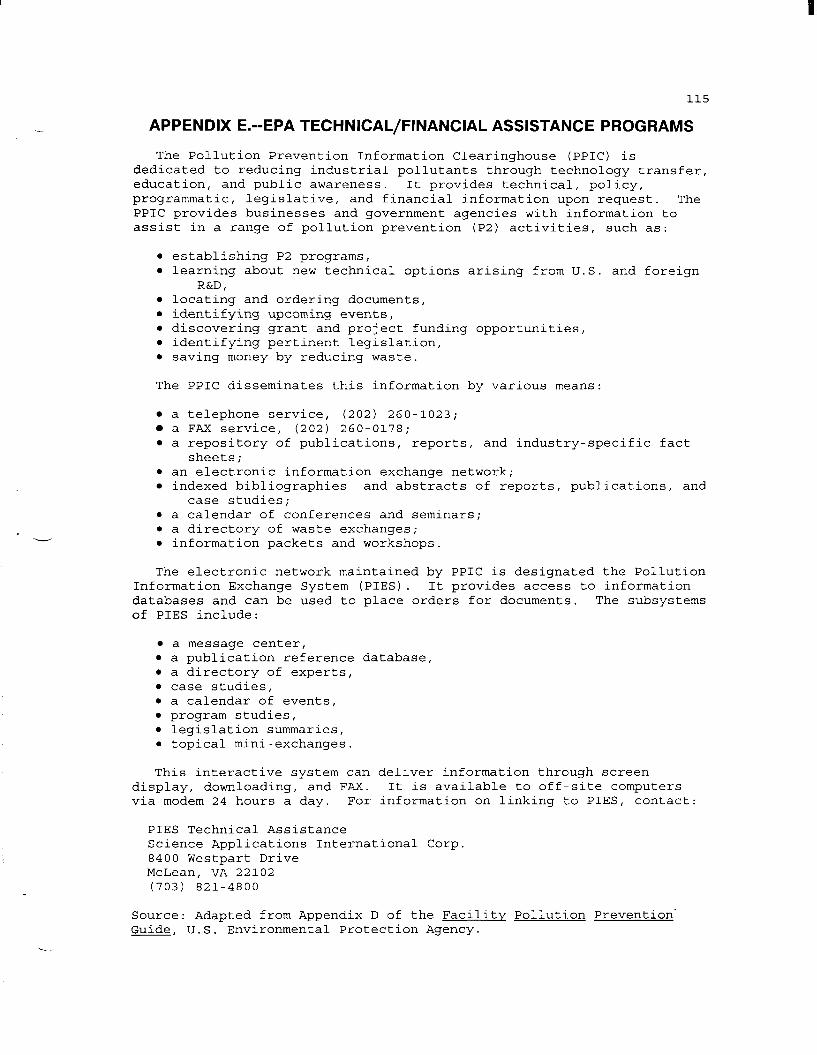
I
115
APPENDIX E.--EPA TECHNICAL/FINANCIAL ASSISTANCE PROGRAMS
The Pollution Prevention Information Clearinghouse (PPIC) is dedicated to reducing industrial pollutants through technology transfer, education, and public awareness. It provides technical, policy, programmatic, legislative, and financial information upon request. The PPIC provides businesses and government agencies with information to assist in a range of pollution prevention (P2) activities, such as:
e establishing P2 programs, e learning about new technical options arising from U.S. and foreign
e locating and ordering documents, e identifying upcoming events, e discovering grant and project funding opportunities, e identifying pertinent legislation, e saving money by reducing waste.
R&D,
The PPIC disseminates this information by various means:
a telephone service, (202) 260-1023; 0 a FAX service, (202) 260-0178; a repository of publications, reports, and industry-specific fact
e an electronic information exchange network; indexed bibliographies and abstracts of reports, publications, and
e a calendar of conferences and seminars; e a directory of waste exchanges; e information packets and workshops.
sheets ;
case studies;
The electronic network maintained by PPIC is designated the Pollution Information Exchange System (PIES). It provides access to information databases and can be used to place orders for documents. The subsystems of PIES include:
a message center, e a publication reference database, e a directory of experts, e case studies, e a calendar of events, e program studies, e legislation summaries, e topical mini-exchanges.
This interactive system can deliver information through screen display, downloading, and FAX. It is available to off-site computers via modem 24 hours a day. For information on linking to PIES, contact:
PIES Technical Assistance Science Applications International Corp. 8400 Westpart Drive McLean, VA 22102 (703) 821-4800
Source: Adapted from Appendix D of the Facility Pollution Prevention. Guide, U.S. Environmental Protection Agency.

I
Pollution Prevention in Mining and Mineral Processing Waste Audits for Mines and Mills
CUSTOMER APPRAISAL
In an effort to best serve you, we would appreciate receiving your suggestions and comments regarding this Special Publication of the U.S. Bureau of Mines. The receipt of your voluntary response will assist the Bureau in improving future publications to best meet your specific needs.
Please attach postage and return this mail-ready form to the address on the back of this sheet, or directly contact Daniel S. Witkowsky, Metallurgical Engineer [telephone (303) 236- 5209 Extension 264, or FAX (303) 236-4208] for further information.
Optional Information:
Your Name:
Title:
Address:
Telephone: FAX:
How was this Special Publication useful to you?
How can the Bureau improve this Special Publication?
What other Bureau of Mines studies would be helpful to you?
Who else might like a copy of this Special Publication?
Name:
Title:
Address:
Telephone:
Other comments:
FAX:
I
Your Address
Daniel S. Witkowsky Metallurgical En ineer
Building 20 Denver Federal Center Denver, CO 80225
U.S. Bureau of 8 ines

U.S. Department of the Interior U.S. Bureau of Mines Denver Federal Center (Building 20) Denver, CO 80225-0086
OFFICIAL BUSINESS PENALTY FOR PRIVATE USE--$300
.
AN EQUAL OPPORTUNITY EMPLOYER
a Federal Recycling Program on Recycled Paper