Mining and Metals commodity briefcase - Ernst & Young prices received another boost from declining...
17
Mining and Metals commodity briefcase Aluminium, Coal, Copper, Gold, Iron Ore, Nickel, Platinum July, 2016
Transcript of Mining and Metals commodity briefcase - Ernst & Young prices received another boost from declining...
Mining and Metals commodity briefcase Aluminium, Coal, Copper, Gold, Iron Ore, Nickel, Platinum July, 2016

Aluminium
This publication contains information in summary form and is therefore intended for general guidance only. It is not intended to be a substitute for detailed research or the exercise of professional judgment. Neither EYGM Limited nor any other member of the global Ernst & Young organization can accept any responsibility for loss occasioned to any person acting or refraining from action as a result of any material in this publication. On any specific matter, reference should be made to the appropriate advisor.
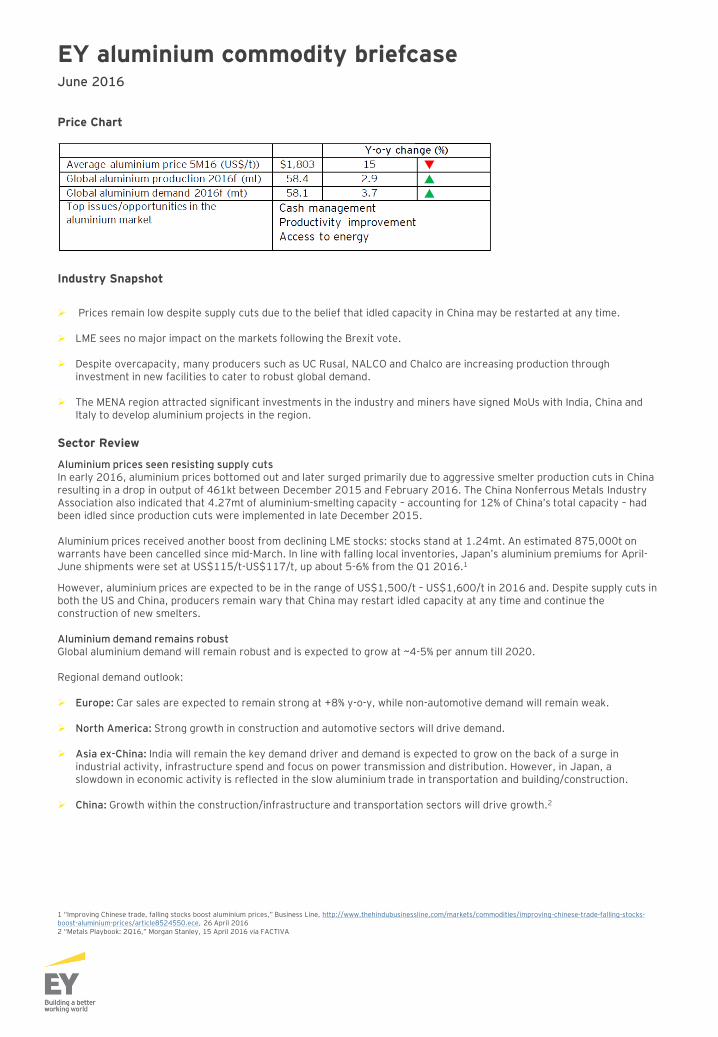
EY aluminium commodity briefcase June 2016
Price Chart
Industry Snapshot
Prices remain low despite supply cuts due to the belief that idled capacity in China may be restarted at any time.
LME sees no major impact on the markets following the Brexit vote. Despite overcapacity, many producers such as UC Rusal, NALCO and Chalco are increasing production through
investment in new facilities to cater to robust global demand. The MENA region attracted significant investments in the industry and miners have signed MoUs with India, China and
Italy to develop aluminium projects in the region.
Sector Review
Aluminium prices seen resisting supply cuts In early 2016, aluminium prices bottomed out and later surged primarily due to aggressive smelter production cuts in China resulting in a drop in output of 461kt between December 2015 and February 2016. The China Nonferrous Metals Industry Association also indicated that 4.27mt of aluminium-smelting capacity – accounting for 12% of China’s total capacity – had been idled since production cuts were implemented in late December 2015. Aluminium prices received another boost from declining LME stocks: stocks stand at 1.24mt. An estimated 875,000t on warrants have been cancelled since mid-March. In line with falling local inventories, Japan’s aluminium premiums for April-June shipments were set at US$115/t-US$117/t, up about 5-6% from the Q1 2016.1
However, aluminium prices are expected to be in the range of US$1,500/t – US$1,600/t in 2016 and. Despite supply cuts in both the US and China, producers remain wary that China may restart idled capacity at any time and continue the construction of new smelters. Aluminium demand remains robust Global aluminium demand will remain robust and is expected to grow at ~4-5% per annum till 2020. Regional demand outlook: Europe: Car sales are expected to remain strong at +8% y-o-y, while non-automotive demand will remain weak.
North America: Strong growth in construction and automotive sectors will drive demand.
Asia ex-China: India will remain the key demand driver and demand is expected to grow on the back of a surge in industrial activity, infrastructure spend and focus on power transmission and distribution. However, in Japan, a slowdown in economic activity is reflected in the slow aluminium trade in transportation and building/construction.
China: Growth within the construction/infrastructure and transportation sectors will drive growth.2
1 “Improving Chinese trade, falling stocks boost aluminium prices,” Business Line, http://www.thehindubusinessline.com/markets/commodities/improving-chinese-trade-falling-stocks-boost-aluminium-prices/article8524550.ece, 26 April 2016 2 “Metals Playbook: 2Q16,” Morgan Stanley, 15 April 2016 via FACTIVA
Coal
This publication contains information in summary form and is therefore intended for general guidance only. It is not intended to be a substitute for detailed research or the exercise of professional judgment. Neither EYGM Limited nor any other member of the global Ernst & Young organization can accept any responsibility for loss occasioned to any person acting or refraining from action as a result of any material in this publication. On any specific matter, reference should be made to the appropriate advisor.
EY coal commodity briefcase May - June 2016
Price Chart
Industry Snapshot
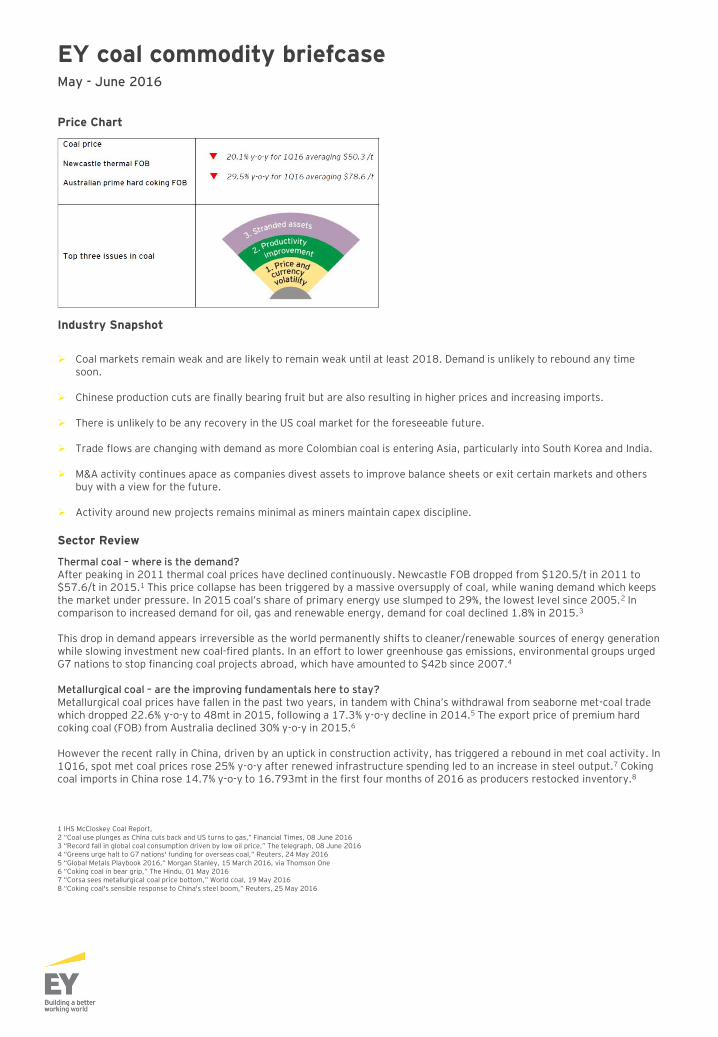
Coal markets remain weak and are likely to remain weak until at least 2018. Demand is unlikely to rebound any time
soon.
Chinese production cuts are finally bearing fruit but are also resulting in higher prices and increasing imports.
There is unlikely to be any recovery in the US coal market for the foreseeable future.
Trade flows are changing with demand as more Colombian coal is entering Asia, particularly into South Korea and India.
M&A activity continues apace as companies divest assets to improve balance sheets or exit certain markets and others buy with a view for the future.
Activity around new projects remains minimal as miners maintain capex discipline.
Sector Review
Thermal coal – where is the demand? After peaking in 2011 thermal coal prices have declined continuously. Newcastle FOB dropped from $120.5/t in 2011 to $57.6/t in 2015.1 This price collapse has been triggered by a massive oversupply of coal, while waning demand which keeps the market under pressure. In 2015 coal’s share of primary energy use slumped to 29%, the lowest level since 2005.2 In comparison to increased demand for oil, gas and renewable energy, demand for coal declined 1.8% in 2015.3 This drop in demand appears irreversible as the world permanently shifts to cleaner/renewable sources of energy generation while slowing investment new coal-fired plants. In an effort to lower greenhouse gas emissions, environmental groups urged G7 nations to stop financing coal projects abroad, which have amounted to $42b since 2007.4
Metallurgical coal – are the improving fundamentals here to stay? Metallurgical coal prices have fallen in the past two years, in tandem with China’s withdrawal from seaborne met-coal trade which dropped 22.6% y-o-y to 48mt in 2015, following a 17.3% y-o-y decline in 2014.5 The export price of premium hard coking coal (FOB) from Australia declined 30% y-o-y in 2015.6
However the recent rally in China, driven by an uptick in construction activity, has triggered a rebound in met coal activity. In 1Q16, spot met coal prices rose 25% y-o-y after renewed infrastructure spending led to an increase in steel output.7 Coking coal imports in China rose 14.7% y-o-y to 16.793mt in the first four months of 2016 as producers restocked inventory.8
1 IHS McCloskey Coal Report, 2 “Coal use plunges as China cuts back and US turns to gas,” Financial Times, 08 June 2016 3 “Record fall in global coal consumption driven by low oil price,” The telegraph, 08 June 2016 4 “Greens urge halt to G7 nations' funding for overseas coal,” Reuters, 24 May 2016 5 “Global Metals Playbook 2016,” Morgan Stanley, 15 March 2016, via Thomson One 6 “Coking coal in bear grip,” The Hindu, 01 May 2016 7 “Corsa sees metallurgical coal price bottom,” World coal, 19 May 2016 8 “Coking coal's sensible response to China's steel boom,” Reuters, 25 May 2016

Copper
This publication contains information in summary form and is therefore intended for general guidance only. It is not intended to be a substitute for detailed research or the exercise of professional judgment. Neither EYGM Limited nor any other member of the global Ernst & Young organization can accept any responsibility for loss occasioned to any person acting or refraining from action as a result of any material in this publication. On any specific matter, reference should be made to the appropriate advisor.
EY copper commodity briefcase May - June 2016
Price Chart
Industry Snapshot
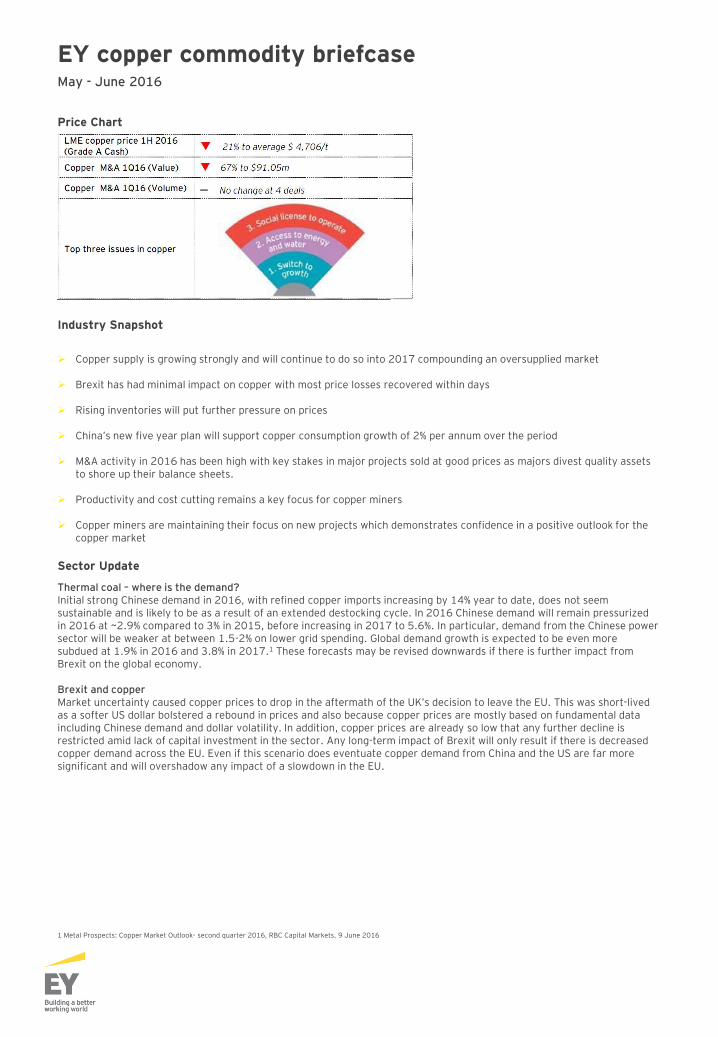
Copper supply is growing strongly and will continue to do so into 2017 compounding an oversupplied market
Brexit has had minimal impact on copper with most price losses recovered within days
Rising inventories will put further pressure on prices
China’s new five year plan will support copper consumption growth of 2% per annum over the period
M&A activity in 2016 has been high with key stakes in major projects sold at good prices as majors divest quality assets
to shore up their balance sheets.
Productivity and cost cutting remains a key focus for copper miners
Copper miners are maintaining their focus on new projects which demonstrates confidence in a positive outlook for the copper market
Sector Update
Thermal coal – where is the demand? Initial strong Chinese demand in 2016, with refined copper imports increasing by 14% year to date, does not seem sustainable and is likely to be as a result of an extended destocking cycle. In 2016 Chinese demand will remain pressurized in 2016 at ~2.9% compared to 3% in 2015, before increasing in 2017 to 5.6%. In particular, demand from the Chinese power sector will be weaker at between 1.5-2% on lower grid spending. Global demand growth is expected to be even more subdued at 1.9% in 2016 and 3.8% in 2017.1 These forecasts may be revised downwards if there is further impact from Brexit on the global economy. Brexit and copper Market uncertainty caused copper prices to drop in the aftermath of the UK’s decision to leave the EU. This was short-lived as a softer US dollar bolstered a rebound in prices and also because copper prices are mostly based on fundamental data including Chinese demand and dollar volatility. In addition, copper prices are already so low that any further decline is restricted amid lack of capital investment in the sector. Any long-term impact of Brexit will only result if there is decreased copper demand across the EU. Even if this scenario does eventuate copper demand from China and the US are far more significant and will overshadow any impact of a slowdown in the EU. 1 Metal Prospects: Copper Market Outlook- second quarter 2016, RBC Capital Markets, 9 June 2016
Gold
This publication contains information in summary form and is therefore intended for general guidance only. It is not intended to be a substitute for detailed research or the exercise of professional judgment. Neither EYGM Limited nor any other member of the global Ernst & Young organization can accept any responsibility for loss occasioned to any person acting or refraining from action as a result of any material in this publication. On any specific matter, reference should be made to the appropriate advisor.

Price Chart
Industry Snapshot
A potential Brexit would be positive for gold prices: If the UK votes to leave the EU (Brexit), then it will slow expected US interest rate increases due to the global macroeconomic uncertainty. A delay in interest rate hikes will be positive for gold prices. Additionally, increased global macroeconomic uncertainty will lead investors towards safe haven assets such as gold.
Switch to growth: Many gold miners reported flat or lower gold production in their 2015 annual results with guidance of continued decline in gold production in the coming years. Some of the gold mines such as Goldcorp have taken the first step to augment falling production by acquiring advanced gold projects such as Kaminak.
To increase or not to: The US Federal Bank (the fed) is in dilemma on whether or not to increase interest rates. Minutes
of last Fed meeting suggested a rise is on the anvil but poor macroeconomic data (esp. job growth) along with global geo-political events appear to have led the market to expect a rise in later part of the year.
Feature: How will Brexit impact gold prices? Brexit would be a positive for gold prices For the past year or so, gold prices have largely been a play on US dollar and have been guided by market talks on the course of action that the US Fed will take with regards to the US interest rates. For example, expectations of delay in interest rates hike led to the gold rally in the 1Q16 and increasing probability of a rise led to a fall in gold prices in mid-May. The Fed’s view of interest rates depends most importantly on US economic data but also global macro-economic situation. Britain’s referendum to remain/leave EU is one such event with the potential to impact global macroeconomics. The referendum will impact gold prices through the impact on the Fed’s decision on interest rates and through creating significant global uncertainty on the future of Britain/EU and its impact on the global markets. Below is how the two outcomes may impact gold prices: Remain: If the UK votes to remain in the EU, then the likelihood of an increase in US interest rates around July/August is
higher, dependent on US macroeconomic data. In such a scenario, gold prices are expected to fall due to increased chances of a US interest rate increase (leading to stronger US dollar) and due to lower market uncertainty which will weaken demand for safe haven assets.
Leave: If the UK votes to leave the EU, then the potential for a US interest rate increase in the near term is less likely due to an expected increase in the global macroeconomic uncertainty. A delay in interest rate hikes will be positive for gold prices. Additionally, increased global macroeconomic uncertainty will lead investors towards safe haven assets such as gold, the US dollar, Swiss franc and Japanese yen. Typically, US dollar and gold prices are inversely correlated but increase in demand for safe haven assets in such a scenario will likely break this relationship (as was the case during the Greek financial crisis) and will lead to stronger US dollar and higher gold prices.
EY gold commodity briefcase June 2016
Iron Ore
This publication contains information in summary form and is therefore intended for general guidance only. It is not intended to be a substitute for detailed research or the exercise of professional judgment. Neither EYGM Limited nor any other member of the global Ernst & Young organization can accept any responsibility for loss occasioned to any person acting or refraining from action as a result of any material in this publication. On any specific matter, reference should be made to the appropriate advisor.
Price Chart
Industry Snapshot
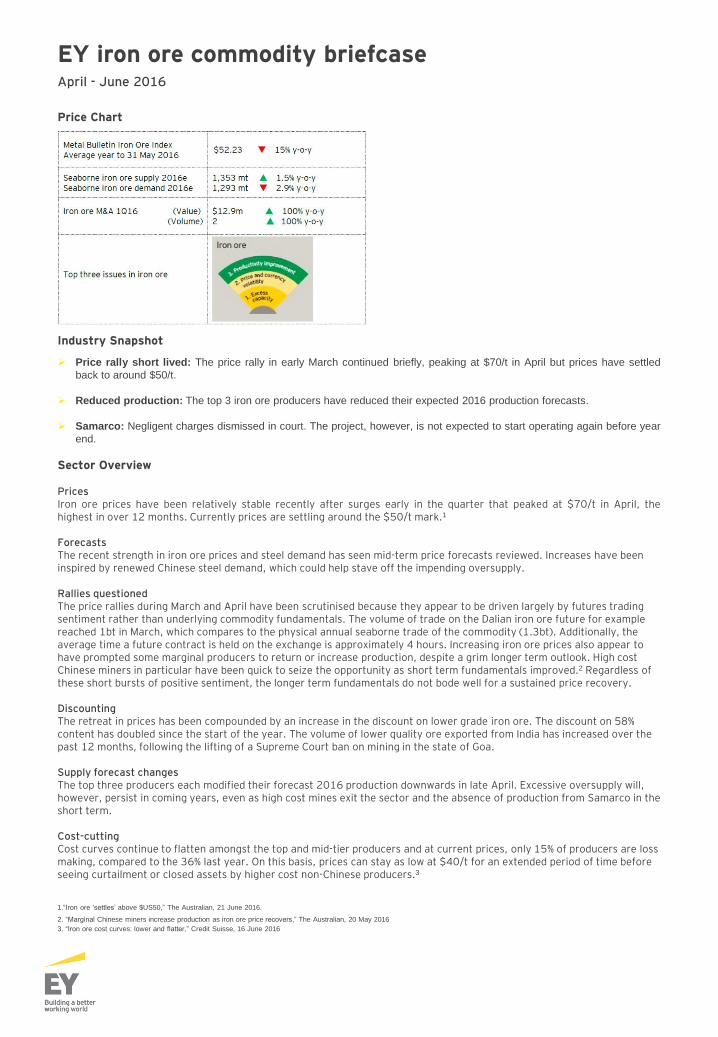
Price rally short lived: The price rally in early March continued briefly, peaking at $70/t in April but prices have settled
back to around $50/t.
Reduced production: The top 3 iron ore producers have reduced their expected 2016 production forecasts.
Samarco: Negligent charges dismissed in court. The project, however, is not expected to start operating again before year
end.
Sector Overview Prices Iron ore prices have been relatively stable recently after surges early in the quarter that peaked at $70/t in April, the highest in over 12 months. Currently prices are settling around the $50/t mark.1
Forecasts The recent strength in iron ore prices and steel demand has seen mid-term price forecasts reviewed. Increases have been inspired by renewed Chinese steel demand, which could help stave off the impending oversupply. Rallies questioned The price rallies during March and April have been scrutinised because they appear to be driven largely by futures trading sentiment rather than underlying commodity fundamentals. The volume of trade on the Dalian iron ore future for example reached 1bt in March, which compares to the physical annual seaborne trade of the commodity (1.3bt). Additionally, the average time a future contract is held on the exchange is approximately 4 hours. Increasing iron ore prices also appear to have prompted some marginal producers to return or increase production, despite a grim longer term outlook. High cost Chinese miners in particular have been quick to seize the opportunity as short term fundamentals improved.2 Regardless of these short bursts of positive sentiment, the longer term fundamentals do not bode well for a sustained price recovery. Discounting The retreat in prices has been compounded by an increase in the discount on lower grade iron ore. The discount on 58% content has doubled since the start of the year. The volume of lower quality ore exported from India has increased over the past 12 months, following the lifting of a Supreme Court ban on mining in the state of Goa. Supply forecast changes The top three producers each modified their forecast 2016 production downwards in late April. Excessive oversupply will, however, persist in coming years, even as high cost mines exit the sector and the absence of production from Samarco in the short term. Cost-cutting Cost curves continue to flatten amongst the top and mid-tier producers and at current prices, only 15% of producers are loss making, compared to the 36% last year. On this basis, prices can stay as low at $40/t for an extended period of time before seeing curtailment or closed assets by higher cost non-Chinese producers.3
1.“Iron ore ‘settles’ above $US50,” The Australian, 21 June 2016.
2. “Marginal Chinese miners increase production as iron ore price recovers,” The Australian, 20 May 2016
3. “Iron ore cost curves: lower and flatter,” Credit Suisse, 16 June 2016
EY iron ore commodity briefcase April - June 2016

Nickel
This publication contains information in summary form and is therefore intended for general guidance only. It is not intended to be a substitute for detailed research or the exercise of professional judgment. Neither EYGM Limited nor any other member of the global Ernst & Young organization can accept any responsibility for loss occasioned to any person acting or refraining from action as a result of any material in this publication. On any specific matter, reference should be made to the appropriate advisor.

Price Chart
Industry Snapshot
Price volatility: After witnessing a low of US$7,561/t in February, nickel prices rallied around 15% to trade at US$8,700/t by the start of April 2016. The recovery in prices has given some hope of breaking even to low cost producers, provided prices sustain at these levels with an upside bias.
Capital project execution: The crash in nickel prices to a 13 years low forced many nickel producers to delay or cancel their projects. Of 32 ongoing projects in Indonesia, 12 nickel projects were to complete by the end of 2015; but only five came online. There is a serious crunch of capital to invest in upcoming projects and the Indonesian Government is under pressure to lift the ban on nickel ore exports so as to generate funds to complete construction of these smelters.
Industry Developments Outlook Nickel has underperformed the recent rally in commodities and is still down 5% YTD. There are signs of pressure induced closures but not enough to stabilize the market. The 90th percentile cost of production for nickel is around US$10,000/t and despite the fact that current prices are well below it; there is still a reluctance to cut production.1
On demand side, Chinese stainless steel production should growth modestly at 5% y-o-y in 2016 compared to a flat growth in 2015. Oil & Gas and domestic appliances account for 65% of global stainless steel demand and both remain subdued. However to push up nickel prices significant demand growth is needed as total global inventories have breached the 1mt mark.2
Overall, there has almost been no change in the nickel industry outlook in the last few months. The necessary production cuts never happened and prices remain subdued. Globally demand remains weak, stainless prices are low and production in China has declined y-o-y. Ongoing uncertainty in the Chinese economy and the absence of significant rationalization on the supply side indicates that cutbacks are inevitable. Whether it happens due to scarcity of capital or happens voluntarily will decide the extent of the current downturn in nickel. Despite price falls, companies are not willing to cut production Despite low prices, producers refuse to cut production. Depreciation in currencies vis-à-vis the US dollar has been beneficial for some major nickel producing nations and has only delayed the much expected production cuts. Production indiscipline will keep nickel market under pressure for the foreseeable future.3
1 Commodities quarterly-an early recovery,” Deutsche Bank, 22nd March 2016
2 “Commodities review-supply more than you demand,” Societe Generale, March 2016
3 “Commodities forecasts-Passing the worst,” Credit Suisse, 7th April 2016
EY nickel commodity briefcase April 2016

Platinum
This publication contains information in summary form and is therefore intended for general guidance only. It is not intended to be a substitute for detailed research or the exercise of professional judgment. Neither EYGM Limited nor any other member of the global Ernst & Young organization can accept any responsibility for loss occasioned to any person acting or refraining from action as a result of any material in this publication. On any specific matter, reference should be made to the appropriate advisor.
EY platinum commodity briefcase May 2016
Price Chart
Industry Snapshot
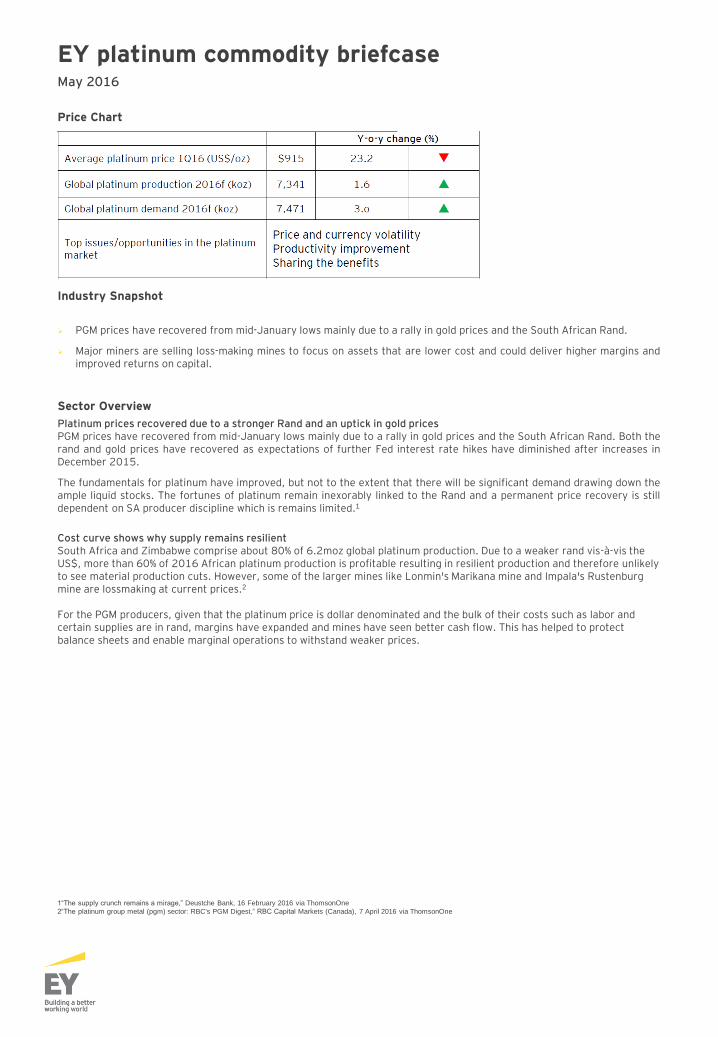
PGM prices have recovered from mid-January lows mainly due to a rally in gold prices and the South African Rand.
Major miners are selling loss-making mines to focus on assets that are lower cost and could deliver higher margins and improved returns on capital.
Sector Overview
Platinum prices recovered due to a stronger Rand and an uptick in gold prices PGM prices have recovered from mid-January lows mainly due to a rally in gold prices and the South African Rand. Both the rand and gold prices have recovered as expectations of further Fed interest rate hikes have diminished after increases in December 2015.
The fundamentals for platinum have improved, but not to the extent that there will be significant demand drawing down the ample liquid stocks. The fortunes of platinum remain inexorably linked to the Rand and a permanent price recovery is still dependent on SA producer discipline which is remains limited.1
Cost curve shows why supply remains resilient South Africa and Zimbabwe comprise about 80% of 6.2moz global platinum production. Due to a weaker rand vis-à-vis the US$, more than 60% of 2016 African platinum production is profitable resulting in resilient production and therefore unlikely to see material production cuts. However, some of the larger mines like Lonmin's Marikana mine and Impala's Rustenburg mine are lossmaking at current prices.2
For the PGM producers, given that the platinum price is dollar denominated and the bulk of their costs such as labor and certain supplies are in rand, margins have expanded and mines have seen better cash flow. This has helped to protect balance sheets and enable marginal operations to withstand weaker prices.
1“The supply crunch remains a mirage,” Deustche Bank, 16 February 2016 via ThomsonOne
2“The platinum group metal (pgm) sector: RBC's PGM Digest,” RBC Capital Markets (Canada), 7 April 2016 via ThomsonOne
Contacts Peru Víctor Burga Assurance Services Tel: +51 1 411 4419 [email protected] Marcial García Tax Services Tel: +51 1 411 4424 [email protected] Rafael Huamán Fraud Investigation & Dispute Services Tel: +51 1 411 4443 [email protected] Enrique Oliveros Transactions & Corporate Finance Services Tel: +51 1 411 4417 [email protected] Marco Antonio Zaldívar Risk Management Tel: +51 1 411 4450 [email protected]
EY | Assurance | Tax | Transactions | Advisory About EY EY is the global leader in assurance, tax, transaction and advisory services. The insights and quality services we deliver help to build trust and confidence in the capital markets and in economies the world over. We develop outstanding leaders who team to deliver on our promises to all of our stakeholders. In so doing, we play a critical role in building a better working world for our people, for our clients and for our communities. For more information about our organization, please visit ey.com/pe © 2016 EY All Rights Reserved.