Minimising tibial fracture after unicompartmental knee ...
9
Contents lists available at ScienceDirect Clinical Biomechanics journal homepage: www.elsevier.com/locate/clinbiomech Minimising tibial fracture after unicompartmental knee replacement: A probabilistic finite element study Elise C. Pegg a, ⁎ , Jonathan Walter b , Darryl D. D'Lima c , Benjamin J. Fregly d , Harinderjit S. Gill a,f , David W. Murray e a Centre for Orthopaedic Biomechanics, Department of Mechanical Engineering, University of Bath, UK b CED Technologies, Inc., Jacksonville, FL, USA c Shiley Center for Orthopaedic Research & Education, Scripps Clinic, La Jolla, CA, USA d Department of Mechanical Engineering, Rice University, Houston, TX, USA e Nuffield Department of Orthopaedics, Rheumatology and Musculoskeletal Sciences, University of Oxford, Oxford, UK f Centre for Therapeutic Innovation, Department of Mechanical Engineering, University of Bath, UK ARTICLE INFO Keywords: Knee Bone Fracture Unicompartmental Finite element ABSTRACT Background: Periprosthetic tibial fracture after unicompartmental knee replacement is a challenging post-op- erative complication. Patients have an increased risk of mortality after fracture, the majority undergo further surgery, and the revision operations are less successful. Inappropriate surgical technique increases the risk of fracture, but it is unclear which technical aspects of the surgery are most problematic and no research has been performed on how surgical factors interact. Methods: Firstly, this study quantified the typical variance in surgical cuts made during unicompartmental knee replacement (determined from bones prepared by surgeons during an instructional course). Secondly, these measured distributions were used to create a probabilistic finite element model of the tibia after replacement. A thousand finite element models were created using the Monte Carlo method, representing 1000 virtual opera- tions, and the risk of tibial fracture was assessed. Findings: Multivariate linear regression of the results showed that excessive resection depth and making the vertical cut too deep posteriorly increased the risk of fracture. These two parameters also had high variability in the prepared synthetic bones. The regression equation calculated the risk of fracture from three cut parameters (resection depth, vertical and horizonal posterior cuts) and fit the model results with 90% correlation. Interpretation: This study introduces for the first time the application of a probabilistic approach to predict the aetiology of fracture after unicompartmental knee replacement, providing unique insight into the relative im- portance of surgical saw cut variations. Targeted changes to operative technique can now be considered to seek to reduce the risk of periprosthetic fracture. 1. Introduction Periprosthetic tibial fracture after unicompartmental knee replace- ment (UKR) is a severe complication which can be challenging to treat and manage (Pandit et al., 2007). Fracture is associated with increased mortality and significant morbidity, and is increasing in incidence (Della Rocca et al., 2011). Of the cases of tibial fracture after UKR re- ported in the literature (Berger et al., 2005; Brumby et al., 2003; Kumar et al., 2008; Kumar and Fiddian, 1997; Lindstrand et al., 2000; Pandit et al., 2007; Rudol et al., 2007; Sloper et al., 2003; Van Loon et al., 2006; Yang et al., 2003), approximately half of the fractures occurred during the operation, and half occurred within 6 weeks post- operatively. More than 50% of the reported case studies end with re- vision to total knee replacement, requiring removal of the cruciate li- gament(s) and leading to reduced knee function (Berger et al., 2005; Brumby et al., 2003; Kumar et al., 2008; Kumar and Fiddian, 1997; Lindstrand et al., 2000; Pandit et al., 2007; Rudol et al., 2007; Sloper et al., 2003; Van Loon et al., 2006; Yang et al., 2003). The reported incidence of tibial fracture after UKR ranges from 0.8% (Pandit et al., 2007) to 5.0% (Berger et al., 2005). The absolute number of patients at risk of fracture is rising (Della Rocca et al., 2011) as a result of increasing numbers of UKRs being performed each year (NJR, 2014), greater life expectancy (Bennett et al., 2015), higher cases of osteoporosis (Gauthier et al., 2011), and increasing patient activity https://doi.org/10.1016/j.clinbiomech.2019.12.014 Received 28 August 2019; Accepted 16 December 2019 ⁎ Corresponding author at: University of Bath, Department of Mechanical Engineering, Claverton Down, Bath BA2 7AY, United Kingdom. E-mail address: [email protected] (E.C. Pegg). Clinical Biomechanics 73 (2020) 46–54 0268-0033/ © 2019 Elsevier Ltd. All rights reserved. T
Transcript of Minimising tibial fracture after unicompartmental knee ...
Contents lists available at ScienceDirect
Clinical Biomechanics
journal homepage: www.elsevier.com/locate/clinbiomech
Minimising tibial fracture after unicompartmental knee replacement: Aprobabilistic finite element study
Elise C. Pegga,⁎, Jonathan Walterb, Darryl D. D'Limac, Benjamin J. Freglyd, Harinderjit S. Gilla,f,David W. Murraye
a Centre for Orthopaedic Biomechanics, Department of Mechanical Engineering, University of Bath, UKb CED Technologies, Inc., Jacksonville, FL, USAc Shiley Center for Orthopaedic Research & Education, Scripps Clinic, La Jolla, CA, USAdDepartment of Mechanical Engineering, Rice University, Houston, TX, USAeNuffield Department of Orthopaedics, Rheumatology and Musculoskeletal Sciences, University of Oxford, Oxford, UKf Centre for Therapeutic Innovation, Department of Mechanical Engineering, University of Bath, UK
A R T I C L E I N F O
Keywords:KneeBoneFractureUnicompartmentalFinite element
A B S T R A C T
Background: Periprosthetic tibial fracture after unicompartmental knee replacement is a challenging post-op-erative complication. Patients have an increased risk of mortality after fracture, the majority undergo furthersurgery, and the revision operations are less successful. Inappropriate surgical technique increases the risk offracture, but it is unclear which technical aspects of the surgery are most problematic and no research has beenperformed on how surgical factors interact.Methods: Firstly, this study quantified the typical variance in surgical cuts made during unicompartmental kneereplacement (determined from bones prepared by surgeons during an instructional course). Secondly, thesemeasured distributions were used to create a probabilistic finite element model of the tibia after replacement. Athousand finite element models were created using the Monte Carlo method, representing 1000 virtual opera-tions, and the risk of tibial fracture was assessed.Findings: Multivariate linear regression of the results showed that excessive resection depth and making thevertical cut too deep posteriorly increased the risk of fracture. These two parameters also had high variability inthe prepared synthetic bones. The regression equation calculated the risk of fracture from three cut parameters(resection depth, vertical and horizonal posterior cuts) and fit the model results with 90% correlation.Interpretation: This study introduces for the first time the application of a probabilistic approach to predict theaetiology of fracture after unicompartmental knee replacement, providing unique insight into the relative im-portance of surgical saw cut variations. Targeted changes to operative technique can now be considered to seekto reduce the risk of periprosthetic fracture.
1. Introduction
Periprosthetic tibial fracture after unicompartmental knee replace-ment (UKR) is a severe complication which can be challenging to treatand manage (Pandit et al., 2007). Fracture is associated with increasedmortality and significant morbidity, and is increasing in incidence(Della Rocca et al., 2011). Of the cases of tibial fracture after UKR re-ported in the literature (Berger et al., 2005; Brumby et al., 2003; Kumaret al., 2008; Kumar and Fiddian, 1997; Lindstrand et al., 2000; Panditet al., 2007; Rudol et al., 2007; Sloper et al., 2003; Van Loon et al.,2006; Yang et al., 2003), approximately half of the fractures occurredduring the operation, and half occurred within 6 weeks post-
operatively. More than 50% of the reported case studies end with re-vision to total knee replacement, requiring removal of the cruciate li-gament(s) and leading to reduced knee function (Berger et al., 2005;Brumby et al., 2003; Kumar et al., 2008; Kumar and Fiddian, 1997;Lindstrand et al., 2000; Pandit et al., 2007; Rudol et al., 2007; Sloperet al., 2003; Van Loon et al., 2006; Yang et al., 2003).
The reported incidence of tibial fracture after UKR ranges from0.8% (Pandit et al., 2007) to 5.0% (Berger et al., 2005). The absolutenumber of patients at risk of fracture is rising (Della Rocca et al., 2011)as a result of increasing numbers of UKRs being performed each year(NJR, 2014), greater life expectancy (Bennett et al., 2015), higher casesof osteoporosis (Gauthier et al., 2011), and increasing patient activity
https://doi.org/10.1016/j.clinbiomech.2019.12.014Received 28 August 2019; Accepted 16 December 2019
⁎ Corresponding author at: University of Bath, Department of Mechanical Engineering, Claverton Down, Bath BA2 7AY, United Kingdom.E-mail address: [email protected] (E.C. Pegg).
Clinical Biomechanics 73 (2020) 46–54
0268-0033/ © 2019 Elsevier Ltd. All rights reserved.
T

(Naudie et al., 2007). It is, therefore, important to identify which as-pects of UKR surgery put patients at the greatest risk of fracture, so thatthe operative technique can be optimised to minimise the occurrence ofthis serious complication.
The issue of periprosthetic fracture has been reported in severaldifferent unicompartmental knee designs, so it appears the issue is notdesign-specific (Berger et al., 2005; Kumar and Fiddian, 1997;Lindstrand et al., 2000; Pandit et al., 2007; Van Loon et al., 2006; Yanget al., 2003), though one study suggested cementless components are atgreater risk (Seeger et al., 2012). There is uncertainty in the literatureregarding the most important surgical risk factors for tibial fractureafter UKR. The surgical errors that have been proposed to cause tibialplateau fracture include:
• excessive depth of surgical cuts made for the tray, tray keel, or pegs(Clarius et al., 2009; Clarius et al., 2010; Lindstrand et al., 2000;Pandit et al., 2007; Rudol et al., 2007)
• too many holes in the cortex for alignment guides (Brumby et al.,2003; Yang et al., 2003)
• perforation of the tibial cortex (Sloper et al., 2003)
• under-sizing of the tibial tray (Pandit et al., 2007; Van Loon et al.,2006)
• use of excessive force when impacting the plateau (Pandit et al.,2007)
• excessive removal of bone (Pandit et al., 2007).
However, of these studies, Clarius et al. were the only authors tobase their conclusions on experimental evidence and showed that ex-tended vertical cuts reduced the force required to cause tibial fractureby 30% (Clarius et al., 2010).
Finite element analysis (FEA) is a useful tool for predicting bonefracture, and it has been applied most commonly to fractures of thefemoral neck. Schileo et al. proposed a Risk Of Fracture (ROF) criterion(Eq. (1)) which has been validated for hip fracture cases (Schileo et al.,2008). The ROF is calculated from the maximum principal strain (ε)within the bone divided by elastic limit strain values. The criteriondistinguishes between tensile and compressive loading states, and highROF values in a localised region indicate a higher risk of fracture.
=⎧⎨⎩
ε if tensileε if compressive
ROF 0.0073
0.0104 (1)
An advantage of using FEA to examine risk factors for bone fractureis that the uncertainty resulting from confounding factors is removed,enabling the study to focus on the parameters of interest. The aim ofthis study was to apply Schileo's fracture criterion and utilise prob-abilistic FEA methods to assess which surgical parameters increase therisk of periprosthetic fracture after unicompartmental knee replace-ment.
2. Methods
The study first quantified the surgical variability in the preparationof the tibia for UKR, then used the Monte Carlo method to virtuallyimplant 1000 UKRs, representing that variability. The risk of fracturefor the finite element models was found and multivariate linear re-gression used to assess the influence of each surgical cut parameter.
2.1. Quantification of variability in surgical cuts
Twenty three right tibial Sawbones (custom anatomic design madefor Zimmer-Biomet UK Ltd. by Sawbones, Pacific Research LaboratoriesInc., Vashon Island, Washington, USA) were prepared for medial mobileUKR (Oxford Partial Knee, Biomet, Bridgend, UK) as part of an in-structional course. The attendees were a mixture of experienced andinexperienced orthopaedic surgeons who each prepared a Sawbone
tibia after receiving training in the operative technique. Measurementswere then taken of the positions and depths of the surgical cuts (Fig. 1).The parameters examined were:
• the resection depth (the superior-inferior distance from the tibialplateau on the lateral side to the resected medial horizontal cut,where the distance was parallel to the mechanical axis)
• the angle between the horizontal and vertical cuts
• the depth of the vertical cuts, both at the posterior and anteriorcortex
• the depth of the horizontal cuts, both at the posterior and anteriorcortex
• the depth of the pin hole (used to hold the cutting guide)
2.2. Finite element model
2.2.1. GeometryThe finite element model was based on a previously published UKR
tibial model that was validated against cadaveric tests (Gray et al.,2008). The tibial geometry was segmented from a CT scan of a cada-veric tibia obtained from a male donor aged 60 years with a body massindex of 22.5. The geometry was segmented using Mimics software(version 14.1, Materialise, Leuven, Belgium) and smoothed using theScanto3D function in SolidWorks software (version 2012, Simulia,Waltham, MA, USA). The tibia was aligned so that the tibial mechanicalaxis was the Z-axis, anterior-posterior was the X-axis, and medial-lateralwas the Y-axis. Previous work verified that use of a shortened tibiaimproves computational speed without affecting the strain in theperiprosthetic region (Simpson et al., 2009). Therefore, the length ofthe tibia was shortened to 100 mm proximally.
The UKR was implanted virtually using Boolean functions withinABAQUS software (Version 6.12, Dassault-Systèmes, Rhode Island,USA). A Python script (version 2.6, Python Software Foundation) wascreated to automate the implantation for different surgical and loadingparameters. The width of all saw cuts used was 1 mm, which is thewidth of the saw blade used during surgery (Biomet, 2011). The base ofthe Oxford Unicompartmental Knee tibial tray was fully fixed to thetibia, and frictionless contact was defined between the tray wall and thebone. Neither the effect of interference fit nor loosening was examinedin this study.
2.2.2. MeshThe finite element mesh was created using ABAQUS software.
Quadratic tetrahedral elements (C3D10) were used to mesh the boneand the tibial tray was meshed with quadrilateral rigid elements
Fig. 1. The surgical cut parameters measured from synthetic sawbone tibiawere: the resection depth (a), the angle between the horizontal and vertical cuts(b), the extension of the vertical and horizontal cuts posteriorly (e, f) andanteriorly (c, d), and the depth of the pin hole required to hold the cutting guide(g).
E.C. Pegg, et al. Clinical Biomechanics 73 (2020) 46–54
47

(R3D4). A smaller element size (a third of the overall element size) wasassigned to; the muscle attachment sites, the edges created by the sawcuts, and the drilled pin-hole.
A mesh convergence study was performed to determine the optimalmesh density, where convergence was defined as when the output waswithin 5% of the next three finer element sizes (0.1 mm mesh size in-tervals). The model converged for both output parameters at an overallelement size of 2.4 mm.
2.2.3. Material propertiesThe tray was modelled as a rigid cobalt chromium‑molybdenum
alloy with a density of 8.4 g cm−3 (Pegg et al., 2013). The tibia wasmodelled as a heterogeneous linear elastic material, where the modulusof each element was assigned based on the corresponding gray scalevalue of that element in the CT scan of the tibia. The bone materialassignment was performed with Mimics software (400 material inter-vals with a modulus range of 1 to 22 GPa, consistent with previouswork (Gray et al., 2008)).
2.2.4. Musculoskeletal modelThe muscle and contact loads applied to the tibia throughout the
gait cycle were estimated using data from an instrumented total kneereplacement (TKR) implanted in a male subject (age: 83 years, BMI:22.5, alignment: neutral) at the Shiley Center for Orthopaedic Researchand Education at the Scripps Clinic in California (D'Lima et al., 2005).The data were recorded while the patient performed overgroundwalking trials at a self-selected speed (Fregly et al., 2009; Fregly et al.,2012) and included the following quantities: contact forces on the tibialtray, ground reaction forces and moments, surface marker positions,and electromyographic (EMG) data. Medial and lateral tibial contactforces were calculated from the implant load cell data using an elasticfoundation contact model (Bei and Fregly, 2004). Muscle force esti-mates were generated using static optimization of a subject-specificknee model which minimized (the sum of the squares of) muscle acti-vations. The measured tibio-femoral contact forces and net (inverse-dynamic) knee loads were also matched as part of this optimization (Linet al., 2010) constructed in OpenSim (Delp et al., 2007). The muscu-loskeletal knee model and muscle force estimation approach have beendescribed in detail in a previous study (Pegg et al., 2013).
2.2.5. Boundary conditionsThe muscle and contact loads from the musculoskeletal model were
applied to the FE model using distributed coupling to the tibial at-tachment sites (Fig. 2). On the lateral side the compartment loads wereapplied to the tibial articular surface in the same manner, while on themedial side the compartment load was applied to the upper surface ofthe tibial tray using an equation derived in a previous study to representthe pressure field (Pegg et al., 2013). The distal end of the tibia wasfixed in all degrees of freedom.
The cadaveric tibia used for the finite element model in the presentstudy was different from the instrumented knee subject tibia. Both ti-bias were from male subjects with a similar body mass index (in-strumented tibia: 22.5 and cadaveric tibia: 25.9) and size (instrumentedtibia: 75.0 mm tibial width, and cadaveric tibia: 76.5 mm tibial width)but different age (instrumented tibia: 83, cadaveric tibia: 60). Aniterative closest point (ICP) algorithm was used to register the two ti-bias and determine the muscle attachment sites and vectors for the newgeometry.
2.2.6. Post-processingThe risk of fracture parameter described by Schileo et al. (Schileo
et al., 2008) (Eq. (1)) is not automatically calculated by ABAQUSsoftware, so a custom Python script was written to interact withABAQUS and calculate the new field output. The two outputs used forthe analysis were: (1) the maximum ROF value (omitting artificiallyhigh results at muscle attachment sites), and (2) the total volume of
elements exceeding an ROF of 1 (threshold for fracture defined bySchileo).
2.3. Application of the Monte Carlo method
The measurements taken from the Sawbone tibias prepared duringthe surgical training course (Section 2.1, Fig. 1) were used to define theenvelope of surgical cut variation for the models. A thousand finiteelement models were then created to represent the variance in surgicaltechnique.
The distribution of each surgical cut parameter was categorisedfrom the measured data using the Kernel Density function from the‘scikit-learn’ machine learning module implemented in Python(Pedregosa et al., 2011). A Gaussian kernel (K(x;h)) was applied with abandwidth (h) of 0.75, to create the function representing the dis-tribution of cut parameters measured from the Sawbone tibias. Thekernel has the form given in Eq. (2) where the density estimate at pointy is found from the provided group of points xi; i = 1⋯N.
∑= ⎛⎝
− ⎞⎠=
ρ y K y xh
( )Ki
Ni
1 (2)
An ABAQUS-python script was then used to automate the creationof each finite element model. The script involved the following steps:
1. Randomly select each surgical cut parameter from its calculateddistribution, using Python ‘random’ and ‘scikit-learn’ packages.
2. Prepare tibia using Boolean operations3. Assemble tibia and UKR components4. Apply muscle loading, joint loading, constraints and materials5. Mesh and solve
To confirm that 1000 models were sufficient to achieve convergenceof the Monte Carlo method, we used the method described by Fishmanet al. (Fishman, 1996). Convergence was defined when the mean andcoefficient of variance of both risk of fracture output parameters werewithin 3% of their values from the last 10% of valid instantiations(Fishman, 1996; Reinbolt et al., 2007).
2.4. Model verification
The finite element model was verified two ways: (1) the location ofelements at risk of fracture were compared to typical clinical fracturelocations (Pandit et al., 2007), and (2) the maximum ROF in the peri-prosthetic region was compared with failure loads reported by Clariuset al. (Clarius et al., 2010). To replicate the experiments performed byClarius we applied an increasing load (max 10 kN) to the medialcompartment while the two risk of fracture criteria were recorded. Thetibia was analysed with and without an extended vertical cut (cut an-gled at 10 degrees (Clarius et al., 2010)). No muscle or lateral com-partment loading was applied.
2.5. Statistical analysis
Which parameters influenced the risk of fracture was determined byperforming an analysis of variance (ANOVA) test. The parameterswhich significantly (p < 0.05) influenced the risk of fracture werethen input into a generalised linear regression (GLM) model. All sta-tistical analyses were implemented in R (www.r-project.org). To ensurethe dependent variables (maximum ROF and Volume of failed ele-ments) were normally distributed for the ANOVA and GLM model, wetransformed the data by taking the logarithm of the maximum ROF andthe cube root of the volume of failed elements.
E.C. Pegg, et al. Clinical Biomechanics 73 (2020) 46–54
48

3. Results
3.1. Quantification of variability in surgical cuts
The measurements of the prepared tibial Sawbones highlightedlarge variability in the vertical and horizontal cuts posteriorly (Table 1).The standard deviation in the anterior cut depths was half that of theposterior cuts. Furthermore, in 14 of the 23 Sawbone tibias, the pin holehad gone into the keel slot, greatly increasing the hole depth and pro-ducing a bi-modal distribution with a high standard deviation. The cutangle had very low variability (percent deviation 1.6%) and so was notincluded in the Monte Carlo models.
3.2. Application of the Monte Carlo method
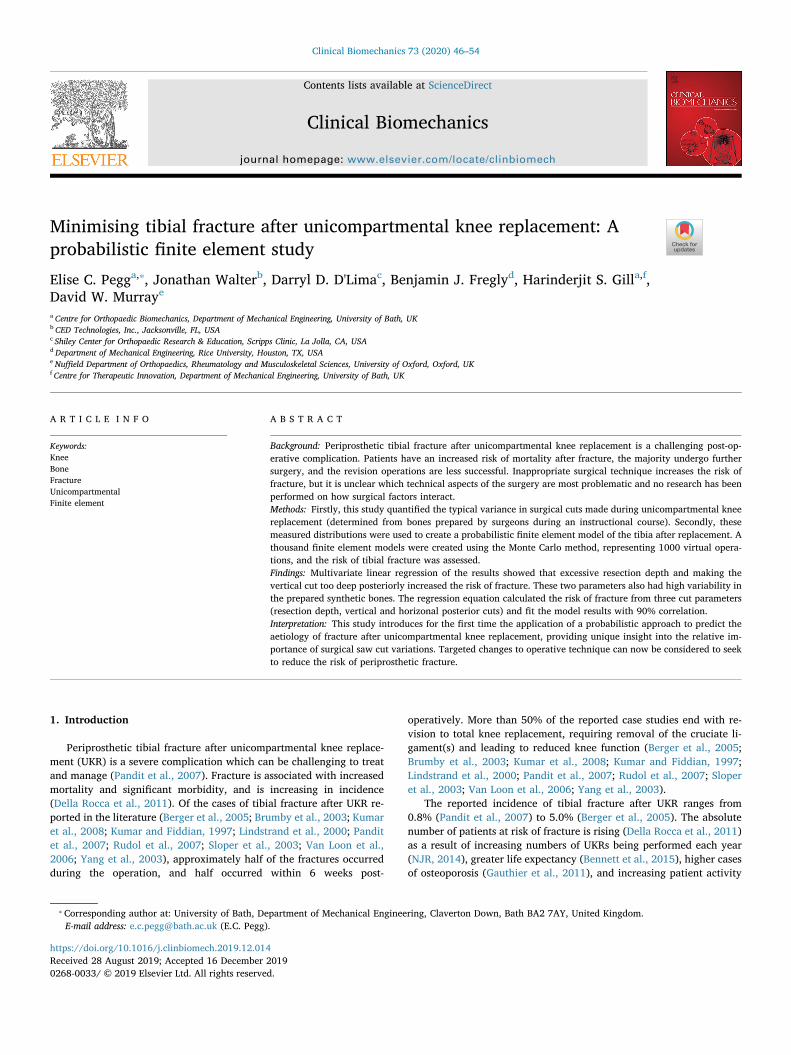
A linear relationship was found between medial contact force andthe maximum ROF when loaded through the whole gait cycle(R2 = 0.83), despite the varying muscle loads and load vectors from themusculoskeletal model (Fig. 3). The maximum ROF value and the
maximum volume of failed elements occurred at 16% of the gait cycle,so these results were used for the regression analysis.
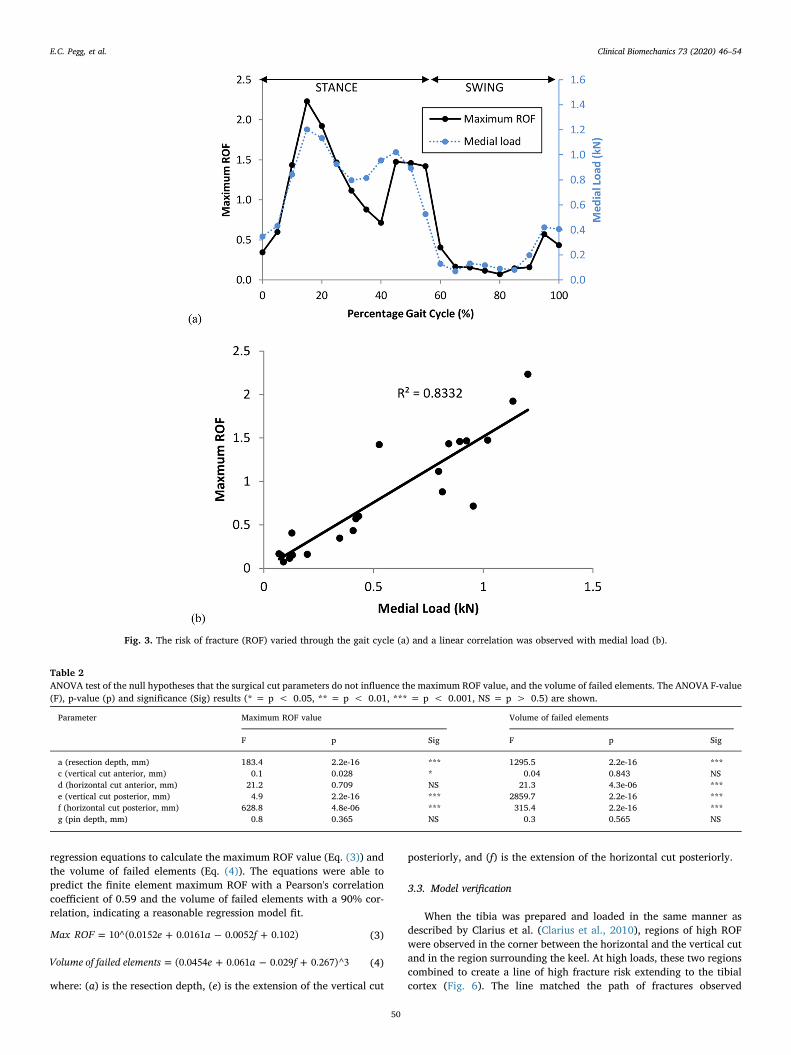
The ANOVA results (Table 2) found the extension of the vertical cutposteriorly (e), the resection depth (a), and extension of the horizontalcut posteriorly (f) to significantly influence both the maximum ROFvalue and the volume of failed elements. Consequently, these para-meters were used to create the regression model. The correlation be-tween both output variables and the posterior vertical and horizontalcuts and the resection depth was also confirmed visually (Fig. 4).
The multivariate linear regression model found that the greater theresection depth and the more extended the posterior vertical cut, thegreater the risk of fracture in terms of both the maximum ROF and thevolume of failed elements. In contrast, extension of the horizontal cutposteriorly reduced the risk of fracture slightly. The parameters whichmost influenced the risk of fracture were the resection depth and ex-tension of the vertical cut posteriorly, as can be seen from the 3-di-mensional scatterplot shown in Fig. 5.
From the known resection depth, posterior vertical cut, and pos-terior horizontal cut for each of the 1000 models, we used the
Fig. 2. The constraint (blue), load locations, and vectors (red)applied to the model at 16% of the gait cycle. The medial viewshown includes the gracilis (Grac), sartorius (Sart), semi-teninosus (Semiten), semimembranosus (Semimem), vastusmedialis, vastus intermedius and vastus lateralis (Vastus)muscles forces; the tensor fasciae latae muscle forces werealso applied on the lateral side. (For interpretation of the re-ferences to color in this figure legend, the reader is referred tothe web version of this article.)
Table 1The surgical cut parameters measured from 23 synthetic tibias prepared by surgeons during an instructional course. The mean value, standard deviation anddistribution percentiles for each parameter are summarised.
Parameter Mean Standard deviation 0% 25% 50% 75% 100%
a (resection depth, mm) 8.8 1.7 5.0 8.0 9.0 10.0 11.0b (angle between cuts, deg) 90.6 1.4 88.0 90.0 90.0 91.0 95.0c (vertical cut anterior, mm) 0.5 1.0 0.0 0.0 0.0 0.3 4.0d (horizontal cut anterior, mm) 0.7 0.9 0.0 0.0 0.0 1.0 3.0e (vertical cut posterior, mm) 4.2 3.9 0.0 0.0 4.0 7.0 12.0f (horizontal cut posterior, mm) 1.3 2.1 0.0 0.0 1.0 1.3 7.5g (pin depth, mm) 28.6 6.8 8.0 25.0 30.0 33.5 36.0
E.C. Pegg, et al. Clinical Biomechanics 73 (2020) 46–54
49
regression equations to calculate the maximum ROF value (Eq. (3)) andthe volume of failed elements (Eq. (4)). The equations were able topredict the finite element maximum ROF with a Pearson's correlationcoefficient of 0.59 and the volume of failed elements with a 90% cor-relation, indicating a reasonable regression model fit.
= + − +Max ROF e a f10^(0.0152 0.0161 0.0052 0.102) (3)
= + − +Volume of failed elements e a f(0.0454 0.061 0.029 0.267)^3 (4)
where: (a) is the resection depth, (e) is the extension of the vertical cut
posteriorly, and (f) is the extension of the horizontal cut posteriorly.
3.3. Model verification
When the tibia was prepared and loaded in the same manner asdescribed by Clarius et al. (Clarius et al., 2010), regions of high ROFwere observed in the corner between the horizontal and the vertical cutand in the region surrounding the keel. At high loads, these two regionscombined to create a line of high fracture risk extending to the tibialcortex (Fig. 6). The line matched the path of fractures observed
Fig. 3. The risk of fracture (ROF) varied through the gait cycle (a) and a linear correlation was observed with medial load (b).
Table 2ANOVA test of the null hypotheses that the surgical cut parameters do not influence the maximum ROF value, and the volume of failed elements. The ANOVA F-value(F), p-value (p) and significance (Sig) results (* = p < 0.05, ** = p < 0.01, *** = p < 0.001, NS = p > 0.5) are shown.
Parameter Maximum ROF value Volume of failed elements
F p Sig F p Sig
a (resection depth, mm) 183.4 2.2e-16 *** 1295.5 2.2e-16 ***c (vertical cut anterior, mm) 0.1 0.028 * 0.04 0.843 NSd (horizontal cut anterior, mm) 21.2 0.709 NS 21.3 4.3e-06 ***e (vertical cut posterior, mm) 4.9 2.2e-16 *** 2859.7 2.2e-16 ***f (horizontal cut posterior, mm) 628.8 4.8e-06 *** 315.4 2.2e-16 ***g (pin depth, mm) 0.8 0.365 NS 0.3 0.565 NS
E.C. Pegg, et al. Clinical Biomechanics 73 (2020) 46–54
50
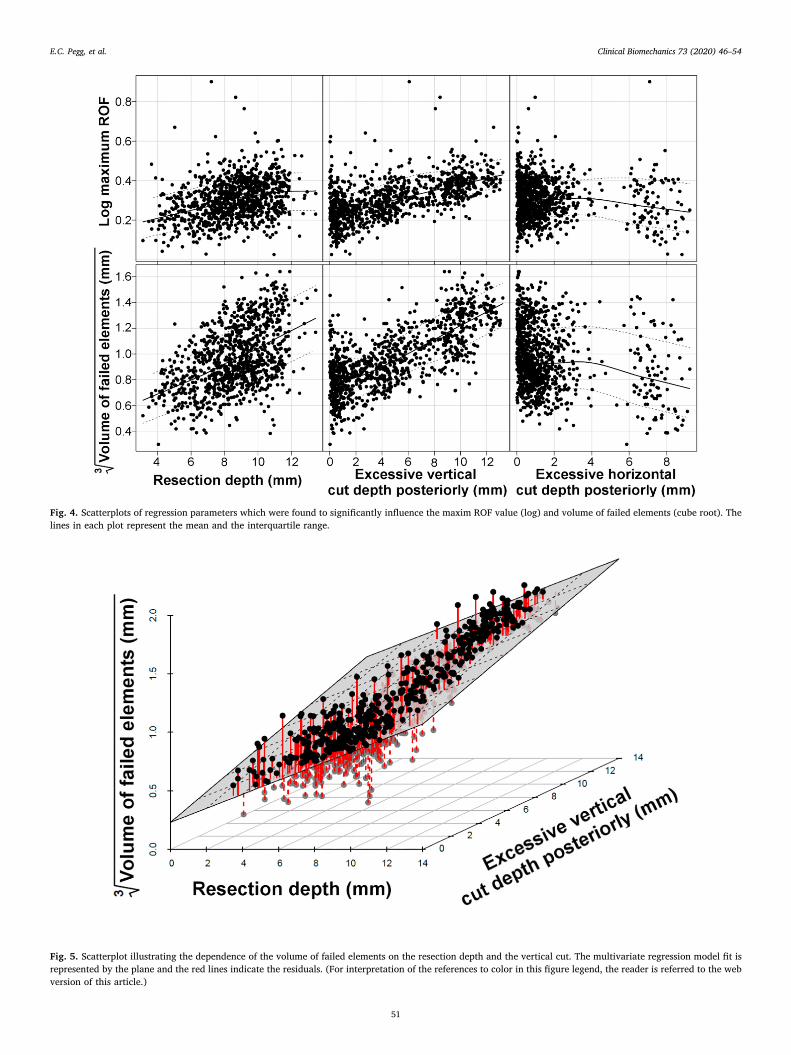
Fig. 4. Scatterplots of regression parameters which were found to significantly influence the maxim ROF value (log) and volume of failed elements (cube root). Thelines in each plot represent the mean and the interquartile range.
Fig. 5. Scatterplot illustrating the dependence of the volume of failed elements on the resection depth and the vertical cut. The multivariate regression model fit isrepresented by the plane and the red lines indicate the residuals. (For interpretation of the references to color in this figure legend, the reader is referred to the webversion of this article.)
E.C. Pegg, et al. Clinical Biomechanics 73 (2020) 46–54
51

clinically (Pandit et al., 2007), confirming that the ROF parameter is anindicator of tibial fracture risk.
The average failure load reported by Clarius et al. for a tibia with anexcessive vertical cut was 2.6 kN (range 1.08–5.04), and 3.9 kN (range2.35–8.50) for a the tibia with a perfect cut (Clarius et al., 2010). Thefinite element models when loaded under these conditions had corre-sponding maximum ROF values of 5.2 and 5.6, and volume of failedelements of 128 mm3 and 177 mm3, respectively. These results indicatethat a maximum ROF value above 5, with a failure volume>128 mm3,would represent a high fracture risk. From the 1000 models examinedin the Monte Carlo simulation, 0.3% had a maximum ROF>5; nonereached the volume threshold.
4. Discussion
This study used a probabilistic finite element modelling approach toinvestigate the influence of different surgical cuts used to prepare thetibia for unicompartmental knee replacement on the risk of peripros-thetic fracture. Of the surgical parameters investigated, excessive re-section depth and an extended posterior vertical saw cut were found tosignificantly increase the risk of fracture according to the regressionmodel. Furthermore, based on measurements of the Sawbone tibiasprepared by surgeons as part of an instructional course, the depths ofthe vertical saw cuts posteriorly are highly variable. This combinationof results is concerning, as high variability in a factor believed to in-crease the risk of fracture increases uncertainty in the surgical outcome.
The tibial saw guide is an important part of the surgical in-strumentation for making the vertical saw cut. The guide comprises arectangular block, which is pinned to the anterior side of the tibia(causing the pin holes described) and provides a horizontal surface tostop the saw blade when making the vertical cut. Although the guideprovides a stop anteriorly, there is no such stop posteriorly, and thesurgeon is required to estimate the correct cut angle (7 degrees). Theguide is also used to aid the horizontal cut, where the flat side of thereciprocating saw rests on the top of the block, which ensures the cut isstraight and has a 7 degree posterior slope (Biomet, 2011). If the sur-geon under-estimates the slope of the vertical cut, the horizontal andvertical cuts will not meet and the vertical cut will need to be extendedto enable the worn tibial plateau to be removed. If the surgeon over-estimates the slope, the vertical cut will be excessive, causing a pos-terior notch. It is, therefore, difficult for a surgeon to ensure that thevertical cut is not excessive with the current operative technique, andlimited posterior visibility makes it hard to identify cut depth intra-operatively.
The resection depth is controlled by the height at which the tibialguide is pinned. The operative technique suggests the level should be 2to 3 mm lower than the eroded bone (Biomet, 2011). Several studieshave suggested that errors in the vertical cut increase the risk of frac-ture (Clarius et al., 2009;Pandit et al., 2007; Rudol et al., 2007), andClarius et al. demonstrated this relationship experimentally (Clarius
et al., 2010). However, resection depth has been proposed by only oneother publication as a critical parameter and is largely overlooked inthe literature (Pandit et al., 2007). If clinicians were made aware thatexcessive resection can contribute to fracture, it would be simple forthem to modify their surgical practice accordingly.
Regardless of the manufacturer or implant type, all UKR designsrequire an L-shaped space to be created for the tibial component, whichrequires a horizontal resection cut and a vertical cut to be made by thesurgeon. This consistency in UKR surgical technique may explain whytibial plateau fracture is not restricted to only one device design (Kumarand Fiddian, 1997; Sloper et al., 2003; Van Loon et al., 2006; Yanget al., 2003). By knowing the surgical factors which may increase tibialfracture risk, surgeons and orthopaedic manufacturers can begin topropose solutions that can minimise the risk of fracture after UKR.
Interestingly, the finite element model which simulated loadingthroughout a whole gait cycle found a linear relationship between therisk of fracture and the medial load. Rudol et al. suggested that peri-prosthetic fracture after UKR may be linked to patient weight (Rudolet al., 2007), and our results indicate it could be a risk factor. Whetherhigh body mass index should be considered a contraindication for UKRis a controversial topic, with evidence both for (Berend et al., 2005) andagainst (Murray et al., 2013; Naal et al., 2009). Some case studies in theliterature have mentioned limiting weight-bearing and using medialunloading braces to offset the medial load in cases of peri-prostheticfracture to aid healing (Brumby et al., 2003; Van Loon et al., 2006), butnot as a preventative measure. In patients considered at risk, bracingcould be used as a non-invasive treatment.
Periprosthetic tibial fractures after UKR can occur intraoperativelyor post-operatively (Pandit et al., 2007; Rudol et al., 2007). Reports ofintraoperative fracture describe a high strain-rate impact load whichcauses the bone to fracture (Sloper et al., 2003; Van Loon et al., 2006).Post-operative fractures are associated with a combination of intra-operative damage and cumulative damage from cyclic loading of thebone (Carter and Caler, 1985). Studies of patient activities after kneereplacement have shown that in a typical day a patient will stand for21% of the time, walk for 8%, and climb stairs for 1%; the remainingtime is non-weight bearing (Huddleston et al., 2009). In terms of cyclicloading, gait is therefore the most likely activity to cause post-operativeperi-prosthetic fracture, though the largest medial contact forces occurfor stair ascent and descent (Mündermann et al., 2008). Our finitemodel did not examine the development of cumulative strains withinthe bone, but both static (Schileo et al., 2008) and fatigue mechanismsof bone fracture (Carter and Caler, 1985) have been related to strain.
It is important to consider the limitations of this work. The modelhas been created to represent the strains after UKR for one tibia to ahigh degree of accuracy, but no conclusions can be made regardingvariation within the population (e.g. in gait, bone shape, or bonedensity). The load data which were applied to the model were based onresults from an instrumented total knee replacement, rather than from aunicompartmental knee replacement. As UKR forces have never been
Fig. 6. Distribution of the risk of fracture through aperfectly cut tibia loaded at 3.9 kN (a), and a tibiawith excessive vertical cut loaded at 2.6 kN (b). Bothmodels represent conditions which caused tibialfracture in experiments performed by Clarius et al.The region most at risk of fracture extends diag-onally from the vertical cut to the tibial cortex, viathe keel.
E.C. Pegg, et al. Clinical Biomechanics 73 (2020) 46–54
52

measured directly in vivo, it is not possible to know whether the loaddistribution between the condyles is equivalent. However, an anatomicapproach was used to implant the instrumented TKR (Mündermannet al., 2008), and therefore alignment should have been similar to animplanted UKR with a similar load distribution between the condyles.This study also makes the assumption that the cuts made during aninstructional course are representative of a surgical scenario, but therewill be differences. For example, the Sawbone tibias will feel differentto real bone so feedback from the saw will be different, and the sawitself may be a different model to that used in theatre. Since this studywas performed new Microplasty instrumentation has also been in-troduced by the manufacturers which assist the surgeon with selectingan appropriate horizontal cut height, so should reduce the risk offracture. Furthermore, at the instructional course the surgeons will benew to the technique and more likely to make errors and have increasedvariability. Therefore the results of this study can be considered to re-present a worst-case scenario. Finally, our model assumed perfectfixation of the base of the tibial tray to the bone and so could notconsider component loosening or interference fit. Incorporating loos-ening and interference fit adds significant complexity to the model andis planned for inclusion in future work.
In conclusion, the probabilistic modelling approach used in thisstudy has provided unique insight into the importance of careful sur-gical preparation of the tibial plateau prior to UKR implantation. Theresults suggest that the cause of fracture is multifactorial and that tominimise the risk of fracture, a surgeon should;
• ensure that the vertical cut does not go too deep posteriorly
• be conservative with resection of the tibia
It may be possible to reduce the likelihood of an excessively deepvertical cut by altering the surgical technique. If the horizontal cut weremade before the vertical cut, a shim could be inserted into the hor-izontal saw cut to stop the vertical cut from going too deep. Surgeontraining and better communication of the fracture risks could encouragesurgeons to be more conservative when resecting the tibia. If ortho-paedic manufacturers and surgeons worked to implement these changesin operative technique, our results suggest that the risk of tibial plateaufracture after UKR could be reduced.
CRediT authorship contribution statement
Elise C. Pegg: Methodology, Software, Formal analysis,Visualization, Writing - original draft. Jonathan Walter: Methodology,Software, Formal analysis, Writing - review & editing. Darryl D.D'Lima: Resources. Benjamin J. Fregly: Supervision, Resources,Writing - review & editing. Harinderjit S. Gill: Methodology, Writing -review & editing. David W. Murray: Supervision, Writing - review &editing, Conceptualization.
Declaration of competing interest
Some of the authors have received funding from Biomet UKHealthcare Ltd. (the manufacturer of the implant examined in thisstudy), but the funding was unrelated to the present study.
Acknowledgements
The work was funded in part by NIH grant R01EB009351. Some ofthe authors have received funding from Biomet UK Healthcare Ltd. (themanufacturer of the implant examined in this study), but the fundingwas unrelated to the present study. Dr. Pegg's salary was funded by theOxford Orthopaedic Engineering Centre. We would like to thank thesurgeons who attended the instructional course, and Kyung Tae Kim,M.D., Ph.D. for providing data regarding cases of tibial fracture afterUKR in Seoul.
References
Bei, Y., Fregly, B.J., 2004. Multibody dynamic simulation of knee contact mechanics.Med. Eng. Phys. 26, 777–789. https://doi.org/10.1016/j.medengphy.2004.07.004.
Bennett, J.E., Li, G., Foreman, K., et al., 2015. The future of life expectancy and lifeexpectancy inequalities in England and Wales: Bayesian spatiotemporal forecasting.Lancet 386, 11–17. https://doi.org/10.1016/S0140-6736(15)60296-3.
Berend, K.R., Lombardi, A.V.J., Mallory, T.H., et al., 2005. Early failure of minimallyinvasive unicompartmental knee arthroplasty is associated with obesity. Clin. Orthop.Relat. Res. 440, 60–66. https://doi.org/10.1097/01.blo.0000187062.65691.e3.
Berger, R.A., Meneghini, R.M., Jacobs, J.J., et al., 2005. Results of unicompartmentalknee arthroplasty at a minimum of ten years of follow-up. JBJS 87, 999–1006.https://doi.org/10.2106/JBJS.C.00568.
Biomet, 2011. Oxford® Cementless Partial Knee Supplementary Surgical Technique. In.Biomet UK Ltd., Bridgend, UK.
Brumby, S.A., Carrington, R., Zayontz, S., et al., 2003. Tibial plateau stress fracture: acomplication of unicompartmental knee arthroplasty using 4 guide pinholes. J.Arthroplast. 18, 809–812. https://doi.org/10.1016/S0883-5403(03)00330-9.
Carter, D.R., Caler, W.E., 1985. A cumulative damage model for bone fracture. J. Orthop.Res. 3, 84–90. https://doi.org/10.1002/jor.1100030110.
Clarius, M., Aldinger, P.R., Bruckner, T., et al., 2009. Saw cuts in unicompartmental kneearthroplasty: an analysis of sawbone preparations. Knee 16, 314–316. https://doi.org/10.1016/j.knee.2008.12.018.
Clarius, M., Haas, D., Aldinger, P.R., et al., 2010. Periprosthetic tibial fractures in uni-compartmental knee arthroplasty as a function of extended sagittal saw cuts: anexperimental study. Knee 17, 57–60. https://doi.org/10.1016/j.knee.2009.05.004.
D'Lima, D.D., Townsend, C.P., Arms, S.W., et al., 2005. An implantable telemetry deviceto measure intra-articular tibial forces. J. Biomech. 38, 299–304. https://doi.org/10.1016/j.jbiomech.2004.02.011.
Della Rocca, G.J., Leung, K.S., Pape, H.-C., 2011. Periprosthetic fractures: epidemiologyand future projections. J. Orthop. Trauma 25, S66–S70. https://doi.org/10.1097/BOT.0b013e31821b8c28.
Delp, S.L., Anderson, F.C., Arnold, A.S., et al., 2007. OpenSim: open-source software tocreate and analyze dynamic simulations of movement. Biomedical Engineering, IEEETransactions on 54, 1940–1950. https://doi.org/10.1109/TBME.2007.901024.
Fishman, G.S., 1996. Monte Carlo. Springer-Verlag, New York.Fregly, B.J., D'Lima, D.D., Colwell, C.W., 2009. Effective gait patterns for offloading the
medial compartment of the knee. J. Orthop. Res. 27, 1016–1021. https://doi.org/10.1002/jor.20843.
Fregly, B.J., Besier, T.F., Lloyd, D.G., et al., 2012. Grand challenge competition to predictin vivo knee loads. J. Orthop. Res. 30, 503–513. https://doi.org/10.1002/jor.22023.
Gauthier, A., Kanis, J., Jiang, Y., et al., 2011. Epidemiological burden of postmenopausalosteoporosis in the UK from 2010 to 2021: estimations from a disease model. Arch.Osteoporos. 6, 179–188. https://doi.org/10.1007/s11657-011-0063-y.
Gray, H.A., Taddei, F., Zavatsky, A.B., et al., 2008. Experimental validation of a finiteelement model of a human cadaveric tibia. J. Biomech. Eng. 130, 031016. https://doi.org/10.1115/1.2913335.
Huddleston, J., Scarborough, D., Goldvasser, D., et al., 2009. 2009 Marshall Urist YoungInvestigator Award: how often do patients with high-flex total knee arthroplasty usehigh flexion? Clin. Orthop. Relat. Res. 467, 1898–1906. https://doi.org/10.1007/s11999-009-0874-y.
Kumar, A., Fiddian, N.J., 1997. Fracture of the medial tibial plateau following uni-compartmental knee replacement. Knee 4, 177–178. https://doi.org/10.1016/S0968-0160(97)00257-3.
Kumar, A., Chambers, I., Wong, P., 2008. Periprosthetic fracture of the proximal tibiaafter lateral unicompartmental knee arthroplasty. J. Arthroplast. 23, 615–618.https://doi.org/10.1016/j.arth.2007.04.036.
Lin, Y.-C., Walter, J.P., Banks, S.A., et al., 2010. Simultaneous prediction of muscle andcontact forces in the knee during gait. J. Biomech. 43, 945–952. https://doi.org/10.1016/j.jbiomech.2009.10.048.
Lindstrand, A., Stenström, A., Ryd, L., et al., 2000. The introduction period of uni-compartmental knee arthroplasty is critical. J. Arthroplast. 15, 608–616. https://doi.org/10.1054/arth.2000.6619.
Mündermann, A., Dyrby, C.O., D'Lima, D.D., et al., 2008. In vivo knee loading char-acteristics during activities of daily living as measured by an instrumented total kneereplacement. J. Orthop. Res. 26, 1167–1172. https://doi.org/10.1002/jor.20655.
Murray, D.W., Pandit, H., Weston-Simons, J.S., et al., 2013. Does body mass index affectthe outcome of unicompartmental knee replacement? Knee 20, 461–465. https://doi.org/10.1016/j.knee.2012.09.017.
Naal, F., Neuerburg, C., Salzmann, G., et al., 2009. Association of body mass index andclinical outcome 2 years after unicompartmental knee arthroplasty. Arch. Orthop.Trauma Surg. 129, 463–468. https://doi.org/10.1007/s00402-008-0633-7.
Naudie, D.D., Ammeen, D.J., Engh, G.A., et al., 2007. Wear and osteolysis around totalknee arthroplasty. J. Am. Acad. Orthop. Surg. 15, 53–64.
NJR, 2014. National Joint Registry 11th Annual Report.Pandit, H., Murray, D.W., Dodd, C.A., et al., 2007. Medial tibial plateau fracture and the
Oxford unicompartmental knee. Orthopedics 30, 28–31.Pedregosa, F., Varoquaux, G., Gramfort, A., et al., 2011. Scikit-learn: machine learning in
python. J. Mach. Learn. Res. 12, 2825–2830.Pegg, E.C., Walter, J., Mellon, S.J., et al., 2013. Evaluation of factors affecting tibial bone
strain after unicompartmental knee replacement. J. Orthop. Res. 31, 821–828.https://doi.org/10.1002/jor.22283.
Reinbolt, J.A., Haftka, R.T., Chmielewski, T.L., et al., 2007. Are patient-specific joint andinertial parameters necessary for accurate inverse dynamics analyses of gait? IEEETrans. Biomed. Eng. 54, 782–793. https://doi.org/10.1109/TBME.2006.889187.
E.C. Pegg, et al. Clinical Biomechanics 73 (2020) 46–54
53

Rudol, G., Jackson, M.P., James, S.E., 2007. Medial tibial plateau fracture complicatingunicompartmental knee arthroplasty. J. Arthroplast. 22, 148–150. https://doi.org/10.1016/j.arth.2006.01.005.
Schileo, E., Taddei, F., Cristofolini, L., et al., 2008. Subject-specific finite element modelsimplementing a maximum principal strain criterion are able to estimate failure riskand fracture location on human femurs tested in vitro. J. Biomech. 41, 356–367.https://doi.org/10.1016/j.jbiomech.2007.09.009.
Seeger, J.B., Haas, D., Jager, S., et al., 2012. Extended sagittal saw cut significantly re-duces fracture load in cementless unicompartmental knee arthroplasty compared tocemented tibia plateaus: an experimental cadaver study. Knee Surg. SportsTraumatol. Arthrosc. 20, 1087–1091. https://doi.org/10.1007/s00167-011-1698-3.
Simpson, D.J., Price, A.J., Gulati, A., et al., 2009. Elevated proximal tibial strains fol-lowing unicompartmental knee replacement—a possible cause of pain. Med. Eng.Phys. 31, 752–757. https://doi.org/10.1016/j.medengphy.2009.02.004.
Sloper, P.J.H., Hing, C.B., Donell, S.T., et al., 2003. Intra-operative tibial plateau fractureduring unicompartmental knee replacement: a case report. Knee 10, 367–369.https://doi.org/10.1016/S0968-0160(03)00003-6.
Van Loon, P., de Munnynck, B., Bellemans, J., 2006. Periprosthetic fracture of the tibialplateau after unicompartmental knee arthroplasty. Acta Orthop. Belg. 72, 369–374.
Yang, K.-Y., Yeo, S.-J., Lo, N.-N., 2003. Stress fracture of the medial tibial plateau afterminimally invasive unicompartmental knee arthroplasty: a report of 2 cases. J.Arthroplast. 18, 801–803. https://doi.org/10.1016/S0883-5403(03)00332-2.
E.C. Pegg, et al. Clinical Biomechanics 73 (2020) 46–54
54