Mini Review Rice in health and nutrition (01) 2014/2 IFRJ 21 (01) 2014 Rohman 430.pdf · Rice in...
12
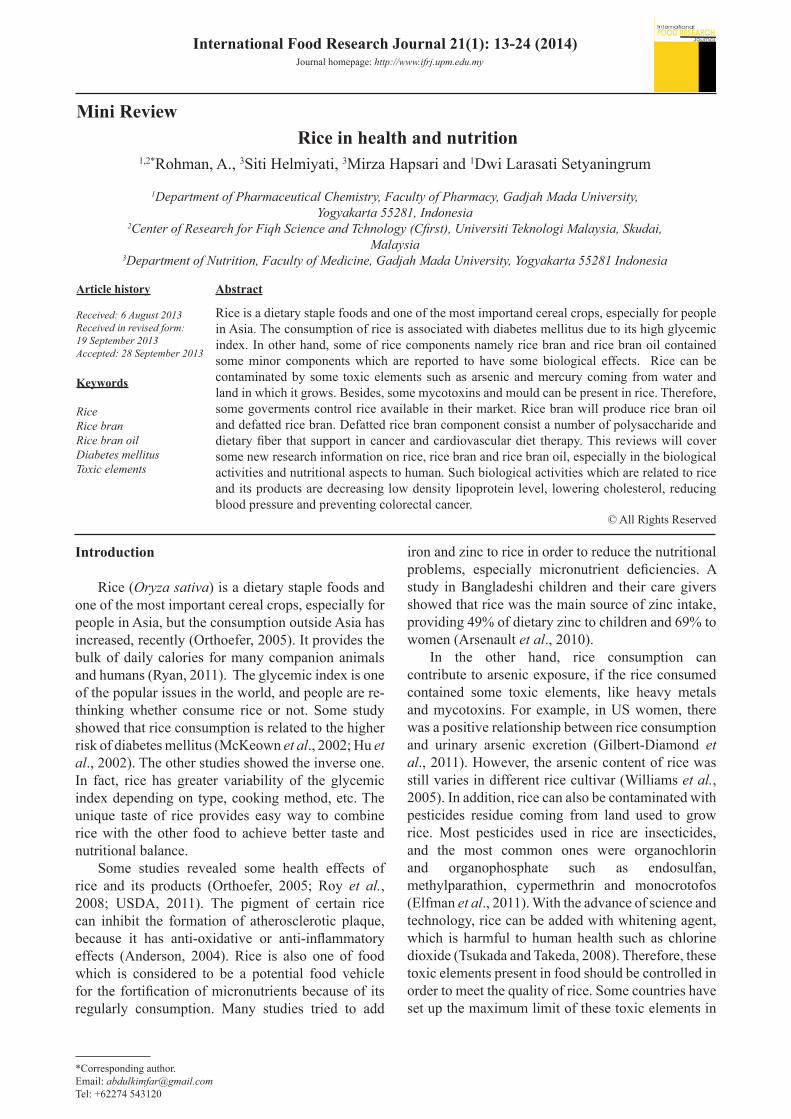
© All Rights Reserved *Corresponding author. Email: [email protected] Tel: +62274 543120 International Food Research Journal 21(1): 13-24 (2014) Journal homepage: http://www.ifrj.upm.edu.my 1,2* Rohman, A., 3 Siti Helmiyati, 3 Mirza Hapsari and 1 Dwi Larasati Setyaningrum 1 Department of Pharmaceutical Chemistry, Faculty of Pharmacy, Gadjah Mada University, Yogyakarta 55281, Indonesia 2 Center of Research for Fiqh Science and Tchnology (Cfirst), Universiti Teknologi Malaysia, Skudai, Malaysia 3 Department of Nutrition, Faculty of Medicine, Gadjah Mada University, Yogyakarta 55281 Indonesia Rice in health and nutrition Abstract Rice is a dietary staple foods and one of the most importand cereal crops, especially for people in Asia. The consumption of rice is associated with diabetes mellitus due to its high glycemic index. In other hand, some of rice components namely rice bran and rice bran oil contained some minor components which are reported to have some biological effects. Rice can be contaminated by some toxic elements such as arsenic and mercury coming from water and land in which it grows. Besides, some mycotoxins and mould can be present in rice. Therefore, some goverments control rice available in their market. Rice bran will produce rice bran oil and defatted rice bran. Defatted rice bran component consist a number of polysaccharide and dietary fiber that support in cancer and cardiovascular diet therapy. This reviews will cover some new research information on rice, rice bran and rice bran oil, especially in the biological activities and nutritional aspects to human. Such biological activities which are related to rice and its products are decreasing low density lipoprotein level, lowering cholesterol, reducing blood pressure and preventing colorectal cancer. Introduction Rice (Oryza sativa) is a dietary staple foods and one of the most important cereal crops, especially for people in Asia, but the consumption outside Asia has increased, recently (Orthoefer, 2005). It provides the bulk of daily calories for many companion animals and humans (Ryan, 2011). The glycemic index is one of the popular issues in the world, and people are re- thinking whether consume rice or not. Some study showed that rice consumption is related to the higher risk of diabetes mellitus (McKeown et al., 2002; Hu et al., 2002). The other studies showed the inverse one. In fact, rice has greater variability of the glycemic index depending on type, cooking method, etc. The unique taste of rice provides easy way to combine rice with the other food to achieve better taste and nutritional balance. Some studies revealed some health effects of rice and its products (Orthoefer, 2005; Roy et al., 2008; USDA, 2011). The pigment of certain rice can inhibit the formation of atherosclerotic plaque, because it has anti-oxidative or anti-inflammatory effects (Anderson, 2004). Rice is also one of food which is considered to be a potential food vehicle for the fortification of micronutrients because of its regularly consumption. Many studies tried to add iron and zinc to rice in order to reduce the nutritional problems, especially micronutrient deficiencies. A study in Bangladeshi children and their care givers showed that rice was the main source of zinc intake, providing 49% of dietary zinc to children and 69% to women (Arsenault et al., 2010). In the other hand, rice consumption can contribute to arsenic exposure, if the rice consumed contained some toxic elements, like heavy metals and mycotoxins. For example, in US women, there was a positive relationship between rice consumption and urinary arsenic excretion (Gilbert-Diamond et al., 2011). However, the arsenic content of rice was still varies in different rice cultivar (Williams et al., 2005). In addition, rice can also be contaminated with pesticides residue coming from land used to grow rice. Most pesticides used in rice are insecticides, and the most common ones were organochlorin and organophosphate such as endosulfan, methylparathion, cypermethrin and monocrotofos (Elfman et al., 2011). With the advance of science and technology, rice can be added with whitening agent, which is harmful to human health such as chlorine dioxide (Tsukada and Takeda, 2008). Therefore, these toxic elements present in food should be controlled in order to meet the quality of rice. Some countries have set up the maximum limit of these toxic elements in Keywords Rice Rice bran Rice bran oil Diabetes mellitus Toxic elements Article history Received: 6 August 2013 Received in revised form: 19 September 2013 Accepted: 28 September 2013 Mini Review
Transcript of Mini Review Rice in health and nutrition (01) 2014/2 IFRJ 21 (01) 2014 Rohman 430.pdf · Rice in...
© All Rights Reserved
*Corresponding author. Email: [email protected] Tel: +62274 543120
International Food Research Journal 21(1): 13-24 (2014)Journal homepage: http://www.ifrj.upm.edu.my
1,2*Rohman, A., 3Siti Helmiyati, 3Mirza Hapsari and 1Dwi Larasati Setyaningrum
1Department of Pharmaceutical Chemistry, Faculty of Pharmacy, Gadjah Mada University, Yogyakarta 55281, Indonesia
2Center of Research for Fiqh Science and Tchnology (Cfirst), Universiti Teknologi Malaysia, Skudai, Malaysia
3Department of Nutrition, Faculty of Medicine, Gadjah Mada University, Yogyakarta 55281 Indonesia
Rice in health and nutrition
Abstract
Rice is a dietary staple foods and one of the most importand cereal crops, especially for people in Asia. The consumption of rice is associated with diabetes mellitus due to its high glycemic index. In other hand, some of rice components namely rice bran and rice bran oil contained some minor components which are reported to have some biological effects. Rice can be contaminated by some toxic elements such as arsenic and mercury coming from water and land in which it grows. Besides, some mycotoxins and mould can be present in rice. Therefore, some goverments control rice available in their market. Rice bran will produce rice bran oil and defatted rice bran. Defatted rice bran component consist a number of polysaccharide and dietary fiber that support in cancer and cardiovascular diet therapy. This reviews will cover some new research information on rice, rice bran and rice bran oil, especially in the biological activities and nutritional aspects to human. Such biological activities which are related to rice and its products are decreasing low density lipoprotein level, lowering cholesterol, reducing blood pressure and preventing colorectal cancer.
Introduction
Rice (Oryza sativa) is a dietary staple foods and one of the most important cereal crops, especially for people in Asia, but the consumption outside Asia has increased, recently (Orthoefer, 2005). It provides the bulk of daily calories for many companion animals and humans (Ryan, 2011). The glycemic index is one of the popular issues in the world, and people are re-thinking whether consume rice or not. Some study showed that rice consumption is related to the higher risk of diabetes mellitus (McKeown et al., 2002; Hu et al., 2002). The other studies showed the inverse one. In fact, rice has greater variability of the glycemic index depending on type, cooking method, etc. The unique taste of rice provides easy way to combine rice with the other food to achieve better taste and nutritional balance.
Some studies revealed some health effects of rice and its products (Orthoefer, 2005; Roy et al., 2008; USDA, 2011). The pigment of certain rice can inhibit the formation of atherosclerotic plaque, because it has anti-oxidative or anti-inflammatory effects (Anderson, 2004). Rice is also one of food which is considered to be a potential food vehicle for the fortification of micronutrients because of its regularly consumption. Many studies tried to add
iron and zinc to rice in order to reduce the nutritional problems, especially micronutrient deficiencies. A study in Bangladeshi children and their care givers showed that rice was the main source of zinc intake, providing 49% of dietary zinc to children and 69% to women (Arsenault et al., 2010).
In the other hand, rice consumption can contribute to arsenic exposure, if the rice consumed contained some toxic elements, like heavy metals and mycotoxins. For example, in US women, there was a positive relationship between rice consumption and urinary arsenic excretion (Gilbert-Diamond et al., 2011). However, the arsenic content of rice was still varies in different rice cultivar (Williams et al., 2005). In addition, rice can also be contaminated with pesticides residue coming from land used to grow rice. Most pesticides used in rice are insecticides, and the most common ones were organochlorin and organophosphate such as endosulfan, methylparathion, cypermethrin and monocrotofos (Elfman et al., 2011). With the advance of science and technology, rice can be added with whitening agent, which is harmful to human health such as chlorine dioxide (Tsukada and Takeda, 2008). Therefore, these toxic elements present in food should be controlled in order to meet the quality of rice. Some countries have set up the maximum limit of these toxic elements in
Keywords
RiceRice branRice bran oilDiabetes mellitusToxic elements
Article history
Received: 6 August 2013Received in revised form: 19 September 2013Accepted: 28 September 2013
Mini Review

14 Rohman et al./IFRJ 21(1): 13-24
rice.
Nutrients and rice consumptionThe nutrients content of rice were varies
depending on the variety of rice soil, and the conditions they growth. Rice contributes to the major dietary energy for body. Pre-germinated brown rice has protein two times more than white rice, i.e. 14.6 g/100 g (brown rice) vs 7.3 g/100 g (white rice). In the other hand, the fat content is so high, namely 24.8 g/100 g for pre-germinated brown rice and 1.5 g/100 g for white rice (Seki et al., 2005). The amino acid profile of rice shows that glutamic and aspartic acids are the major amino acids present in rice, while lysine is the limiting amino acid (FAO, 2004). A new method has been developed to achieve high-lysine content of rice, using over-accumulation of lysine-rich BiP (binding protein) in the endosperm (Kawakatsu et al., 2010). Several types of rice (commercial samples of brown, parboiled brown, parboiled milled and milled rice) had similar protein and crude fat contents, however, the ash contents among types of rice were slightly different, mainly among milled samples (Heinemann et al., 2005). The nutrients content of several varieties of rice is shown in Table 1.
Rice is a good source of thiamine (vitamin B1), riboflavin (vitamin B2) and niacin (vitamin B3). Depa et al. (2008) reported that the level of vitamin in dehusked rice of three varieties namely Njavara, Jyothi and IR 64 Njavara contained 27 - 32% higher compared to the other two rice varieties. The high thiamine content in Njavara rice could be useful in treating vitamin B1 deficiencies such as muscle weakness and neuritis. One of the strategies for alleviation of micronutrient malnutrition including vitamins in rice is biofortification, for example via Provitamin A biofortification of rice endosperm and engineering higher folate levels in rice endosperm (Bhullar and Gruissem, 2013).
The processing method such as parboiling and milling influences the variability of rice nutrients content. The germ and bran contain high levels of minerals, protein and vitamins. Therefore, removal of the germ and bran from the brown rice produces milled rice which will decrease the nutrients compared to brown rice itself (uncooked) (Roy, 2008). Parboiled milled rice showed 18% ash enrichment in comparison with milled rice, and has higher contents of K and P. Lower contents of Mn, Ca and Zn were observed in parboiled rice, even though the contents of other nutritionally important elements were basically similar to milled rice (Heinemann et al., 2005). As a consequence, rice is fortified with some minerals such as iron (Fe) and zinc (Zn), to prevent diseases
associated with mineral deficiencies (Sperottoa et al., 2012).
To retain more thiamine, rice should be not highly milled. However, people usually prefer polished rice (WHO, 1999). The contribution of rice toward the percentage of total dietary energy, protein and fat in some countries was shown in Table 2 (FAO, 2001). Although rice is rich of nutrients, rice alone cannot supply all of the nutrients which are necessary for adequate nutrition. It needs to be complemented with the other food. Animal products and fish are useful addition to the diet, as they provide large amounts of essential amino acids and micronutrients. Pulses, such as beans, groundnuts and lentils, are also nutritional complements to the rice-based diet and help to complete the amino acid profile (FAO, 2004).
As mentioned above, one of the issues in food consumption is glycemic index (GI). Rice has known to have high GI, but International Rice Research Institute (2013) showed that GI of rice varied widely, depending on the type of rice. The variation in GI of rice is due to the differences in the proportion of starch, particularly the ratio of amylose-amylopectin. Only high-amylose varieties are potentially useful in low-GI diets (FAO, 2001). They classified white, brown and parboiled rice as high GI foods. In the other hand, the amylose content is not a good predictor of starch-digestion rate or glycemic response (Panlasigui et al., 1991). High-amylose rice varieties with similar chemical composition including amylase content that were cooked under the same conditions had differences in the starch digestion rate and the glycemic and insulin responses. The differences were not due to unabsorbed carbohydrate, but were related to their physicochemical properties, such as gelatinization temperature, minimum cooking time, amylograph consistency, and volume expansion upon cooking.
The methods of food processing affect the rate of starch then the glycemic index. Modern methods of food processing like extrusion, explosion puffing, and instantization appear to make the starch in these foods more readily digested because of the gelatinization process. In vitro study showed that the proportion
Table 1. The nutrients content of several varieties of 100 g rice (USDA, 2011)
RiceWater
(g)Energy(kcal)
Protein(g)
Total Lipid (g)
Carbohydrate (g)*
Fiber(g)
Rice, white, glutinous, raw 10.46 370 6.81 0.55 81.68 2.8Rice, white, glutinous, raw 76.63 97 2.02 0.19 21.09 1.0Rice flour, white 11.89 366 5.95 1.42 80.13 2.4Rice flour, brown 11.97 363 7.23 2.78 76.48 4.6Rice, brown, long-grain, raw 10.37 370 7.94 2.92 77.24 3.5Rice, brown, long-grain, cooked 73.09 111 2.58 0.90 22.96 1.8Rice, white, short-grain, raw 13.29 358 6.50 0.52 79.15 2.8Rice, white, short-grain, cooked 68.53 130 2.36 0.19 28.73
*Carbohydrate was determined by difference, fiber was total dietary.

Rohman et al./IFRJ 21(1): 13-24 15
of starch digested was significantly higher for the processed forms of rice, corn, and potato compared with the respective conventionally cooked foods. In human, the plasma glucose response as measured by the GI was significantly higher for five of the six processed forms of rice, corn, and potato compared to the respective traditional versions. Potato crisps were the exception, showing a similar response to that of boiled potatoes (Brand et al., 1985).
Rice in diabetes prevention and treatmentFoods with a high glycemic index (GI) have been
associated with increased risk of type-2 diabetes, because they are rapidly digested and can cause dramatic increase in blood sugar levels. GI is a widely accepted measure of the effect of carbohydrate foods including rice on human health (Jenkins et al., 2002). In other hand, glycemic load (GL) is an extension of the GI concept. The GL value incorporates the amount of rice in a serving in order to better gauge the impact of a diet on postprandial glucose response (Wolever et al., 1991). Based on GI, the diets including rice are grouped into three categories, namely low GI (55 or less), medium GI (56 - 69), and high GI (70 or more). Furthermore, based on GL, the diets are classified into low GL (10 or less), medium GL (11 - 19), and high GL (20 or more).
Glycemic index predicts the ranking of the glycemic potential of different meals in individual subjects. Low-GI diets result in modest improvements in overall blood glucose control in patients with insulin-dependent diabetes (type I) and non-insulin-dependent diabetes (type II). The mechanism may through the ability of low-GI diets to reduce insulin secretion and by lowering blood lipid concentrations in patients with hypertriglyceride (Wolever et al., 1991). The medium and high glycemic load (GL) rice that most consumed by Bangladeshi was tested for the GI and GL. The high GL rice has a significantly higher GI than medium one (Fatema et al., 2010). Several studies have revealed that high GI diet may have adverse effects on human health such as the risk
increase of chronic diseases such as cardiovascular disease (CVD), type II diabetes, and obesity. As a consequence, it is suggested to consume rice with low GI (Jenkins et al., 1981). GL is dependent upon the amount of the serving size; so that a smaller serving of this rice and an increased amount of vegetables or other low-carbohydrate dishes can balance the overall glycemic load of the complete diet as well as can provide satiety. Because of this atherogenic role of insulin, it is desirable to control the blood glucose of patients and keep their insulin level as low as possible (Fatema et al., 2010).
In Asian population (Chinese and Japanese), the higher consumption of white rice is associated with a significantly increased risk of type II diabetes (Hu et al., 2012). The prospective study conducted in Japan showed that elevated intake of white rice is associated with an increased risk of type II diabetes in women. Odds ratio for the highest (762 ± 103 g/dL) compared with the lowest quartiles (226 ± 100 g/dL) of rice intake was 1.65 (Nanri et al., 2010). Other study also revealed that intake of white rice was related to the higher risk of diabetes mellitus type II than brown rice (Sun et al., 2010). Table 3 shows the GI and glycemic load of several varieties of rice (Atkinson et al., 2008).
Based on Table 3, it is known that brown rice has the lower GI index than white rice. Therefore, brown rice is more suitable for patients susceptible for type II diabetes. The γ-aminobutyric acid (GABA) and dietary fiber of pre-germinated brown rice is higher that white rice (Seki et al., 2005). GABA is also known to potentiate the insulin secretion in pancreas (Sorenson et al., 1991). The administration of water-soluble/oil-soluble fraction-depleted pre-germinated brown rice bran, which is destarched and defatted bran to rat, can decrease the post-prandial blood glucose. This benefit may be derived from dietary fiber (Seki et al., 2005).
Rice toxicity and toxic contaminantsRice may accumulate considerable amounts of
essential elements contributing to human health, but some toxic elements can also be present in rice. Some
Table 2. Contribution of rice (rice-milled equivalent) as percentage of total dietary energy, protein and fat
CountrySupply(g/day)
Dietary energy(%)
Protein(%)
Fat(%)
Bangladesh 441.2 75.6 66.0 17.8Brazil 108.1 13.5 10.2 0.8Cambodia 448.6 76.7 69.6 17.3China 251.0 30.4 19.5 2.5Ecuador 129.9 16.6 15.5 0.8India 207.9 30.9 24.1 3.6Indonesia 413.6 51.4 42.9 8.1Japan 165.6 23.3 12.5 1.8Madagascar 251.5 46.6 43.6 11.8Malaysia 245.2 29.8 20.4 2.2Nepal 262.3 38.5 29.4 7.2Peru 127.8 18.8 14.7 1.7Sri Lanka 255.3 38.4 37.0 2.7Suriname 189.5 24.7 19.7 1.7Thailand 285.3 43.0 33.4 4.6United Arab Emirates 158.4 18.0 10.6 1.1Viet Nam 464.7 66.7 58.1 14.4
Source: FAO, 2001.
Table 3. The glycemic index and glycemic load of some rice (Brand et al., 1985)
Rice Glycemic index(Glucose = 100)
Glycemic loadper serving
White rice (Oryza sativa), boiled 69 ± 15 30
White rice, low amylose, boiled 17 7
White rice, high amylose, boiled 39 15
Milled white rice, high amylose, boiled 61 26
Brown rice, boiled 50 ± 19 17
Brown rice, high amylose, boiled 39 16
Parboiled, low amylose rice 51 19
Parboiled, high amylose rice 32 ± 2 12

16 Rohman et al./IFRJ 21(1): 13-24
toxins have been reported in rice or its products. Arsenic is of the heavy metals present in rice, besides mercury (Hg), cadmium (Cd), etc. Besides, some pesticide residues and mycotoxins were also reported in rice.
Heavy metalsSoils can be contaminated by highly toxic heavy
metals (such as As, Cu, Cd, Pb and Hg) from either aerial depositions or irrigation. The heavy metals are likely to induce a corresponding contamination in paddy (Nan et al., 2002). Paddy in or close to contaminated sites can uptake and accumulate these metals, and then exert potential risk to humans and animals (Fu et al., 2008). Malfunction of organs and chronic syndromes may be caused by ingestion of relatively low doses of toxic heavy metals over a long period present in rice. Arsenic is the most toxic heavy metal in rice, therefore, in this chapter; we highlight Arsenic level in rice as a representative of heavy metal.
The chemical form can make the considerable differences in arsenic (As) toxicity. The most toxic form of arsenic compounds is inorganic As (arsenite – As3+ and arsenate –As5+), which is also known as class 1 non-threshold carcinogen. This arsenic can be absorbed, distributed, and bounded to plasmatic
proteins and accumulated in liver and kidneys (Meharg et al., 2009). The metabolites of arsenics namely monomethylarsonic acid (MMA) and dimethylarsinic acid (DMA), are metabolites which are less toxic than parent arsenic. The bioavailability of arsenic species in different forms can help the rice assessment, leading to more accurate estimates of the daily intake of rice. Therefore, the identification of certain forms of arsenic species is the best way to estimate the risk of arsenic (Batista et al., 2011).
FAO have recommended that the daily arsenic intake is 15 µg of inorganic As/kg body weight (WHO, 2000), therefore, the toxic effects due to the cumulative arsenic exposure through rice consumption can easily occur in some regions of the world. As a consequence, some scientists have reported the levels of arsenic and other heavy metals in rice or its products. Batista et al. (2011) have reported the level of arsenic total and 5 forms of arsenic in 44 different rice samples (white, parboiled white, brown, parboiled brown, parboiled organic and organic white) from different Brazilian regions using liquid chromatography coupled to inductively coupled plasma mass spectrometry. The average level of total arsenic was 222.8 ng/g. The daily intake of inorganic arsenic (the most toxic form) from rice consumption was estimated as 10% of the Provisional Tolerable Daily Intake (PTDI)
Table 4. Arsenic concentration in rice in some countriesCountry Type of rice Arsenic total (µg/g as dry basis weight)
Mean (minimal – maximal)Inorganic Arsenic (µg/g as dry basis weight) Mean (minimal – maximal)
References
Australia Rice grain 0.03 (0.02–0.04) - William et al., 2006Bangladesh Rice grain with different varieties 0.08 (0.04 – 0.20) - Meharg and Rahman, 2003
White rice in market basket 0.13 (0.002–0.33) 0.08 (0.01–0.21) Meharg et al., 2009rice grain in households 0.13 (0.002 – 0.557) - Rahman et al., 2009
Rice (Boro season) 0.183 (0.108 – 0.331) - Duxbury et al., 2003Rice (Aman season) 0.117 (0.072 – 0.170) - Duxbury et al., 2003
Rice grain 0. 136 (0.040 – 0.270) - Das et al., 2004Rice grain 0.23 (0.04 - 0.65) Rahman et al., 2010
Rice in field 0.34 (0.15–0.59) Ohno et al., 2007Rice in the market 0.69 (0.41–0.98) 0.31 (0.23–0.39) Sun et al., 2008Rice in the field 0.13 (0.03–0.30) 0.08 (0.01–0.21) Williams et al.,2005
Canada Long grain rice 0.11 - 0.34 - Heitkemper et al., 2001China Rice in field 0.501 (0.283 – 0.725) - Xie et al., 1998
Rice in the market 0.14 (0.02–0.46) 0.16 (0.07–0.38) Meharg et al., 2009Rice in the market 0.82 (0.46–1.18) 0.50 (0.25–0.76) Sun et al., 2008
Egypt White rice 0.05 (0.01–0.58) - Meharg et al., 2009France White rice in market 0.28 (0.09–0.56) - Meharg et al., 2009India White rice in market 0.07 (0.07–0.31) 0.03 (0.02–0.07) Meharg et al., 2009
Rice grain 0.16 – 0.58 - Bhattacharya et al., 2010Rice straw 0.004 – 0.015 - Vicky-Singh et al., 2010
Italy Rice in the market 0.15 (0.07–0.33) 0.11 (0.07–0.16) Meharg et al., 2009Japan Rice in the market 0.19 (0.07–0.42) Meharg et al., 2009Spain Rice in the market 0.20 (0.05–0.82) Meharg et al., 2009
Rice in the market 0.188 ± 0.078 0.114 ± 0.046 Torres-Escribano et al., 2008Taiwan Rice in the shed 0.05 (b0.10–0.14) Lin et al., 2004
Rice during survey 1993 0.200 (0.190–0.210) Schoof et al., 1998Rice during survey 1995 0.13 (0.063–0.170) Schoof et al., 1998
Thailand Rice in the market 0.14 (0.01–0.39) - Meharg et al., 2009USA Rice in the market 0.25 (0.03–0.66) 0.10 (0.05–0.15) Meharg et al., 2009
Rice in surveyed market 0.30 (0.2–0.46) - Schoof et al., 1999Vietnam Rice in the market 0.21 (0.03–0.47) Phuong et al., 1999

Rohman et al./IFRJ 21(1): 13-24 17
with a daily ingestion of 88 g of rice, therefore, the average level of arsenic in Brazilian rice was lower than maximum level permissible of As in rice by FAO. Furthermore, inorganic arsenic (As3+, As5+) and dimethylarsinic acid are the main forms of arsenic spesies in all samples.
A study has been carried out to investigate the accumulation and distribution of arsenic in different fractions of rice grain collected in Bangladesh due to the soil contamination with arsenic. The study showed that arsenic content was about 28- and 75-folds higher in root than that of shoot and raw rice grain, respectively. The level of arsenic was higher in non-parboiled rice grain than that of parboiled rice. Two varieties of rice were studied during this study, namely BRRI dhan28 and BRRI hybrid dhan1. The arsenic concentrations in parboiled and non-parboiled brown rice of BRRI dhan28 were of 0.8 ± 0.1 and 0.5 ± 0.0 mg/ kg dry weight, respectively; while those of BRRI hybrid dhan1 were 0.8 ± 0.2 and 0.6 ± 0.2 mg/ kg dry weight, respectively (Azizur et al., 2007).
Pasias et al. (2013) have investigated the level of different arsenic species in rice and rice flour from different countries (Greece, Thailand and India). The content of total arsenic ranged from 42 μg/kg to 271 μg/kg for the rice samples and from 22.1 μg/kg to 170 μg/kg for the rice flour samples. The proportion of total inorganic arsenic was equal to (64 ± 19)%, whereas the respective percentage of As3+
to total inorganic arsenic was equal to (65 ± 12)%. Furthermore, the level of As5+ was determined by the difference of total inorganic As content minus the As3+ content. Some of the investigation related to arsenic content in some food was compiled in Table 4. This table can provide the useful information about the range of arsenic concentration in rice worldwide, and to predict the extent of possible dietary intake of
arsenic from rice (Azizur et al., 2011).
MycotoxinMycotoxin contamination in agriculture products
including rice is a serious problem for human health in the tropics and sub-tropics regions, where climatic conditions, agricultural and storage practices are conducive to fungal growth and toxin production (Park et al., 2005; Kumar et al., 2008). During the storage, some mycotoxins like aflatoxins, ochratoxin, fumonisin, trichothecenes (deoxynivalenol, nivalenol), and zearalenone can contaminate rice or its products (Gilbert, 2002). The food-borne mycotoxins likely to be of greatest significance for human health in tropical developing countries are the aflatoxins and fumonisins (Kumar et al., 2008).
Among the agricultural commodities evaluated, namely rice, wheat, corn, soybeans, and sorghum, rice was the best substrate for the production of aflatoxins (Shotwell et al., 1966). Aflatoxins (AFs) are a group of toxic, mutagenic, and carcinogenic secondary metabolites produced primarily by species of Aspergillus flavus and A. parasiticus (Xiulan et al., 2006). AFs have implicated as causative agents in the carcinogenesis of human hepatic and extrahepatic. From epidemiological studies, it is enough evidence that AFs are potent carcinogens, in connection with the incidence of liver cancer in populations exposed to AFs from contaminated foods (Rustom, 1997). Maximum amount of aflatoxins allowed in foodstuffs in some countries (unit, mgkg-1) for human consumption and for trading as follow: (Australia, 1 μg/kg; China, 20 μg/kg; EU, 2 μg/kg; India 30 μg/kg; Japan 10 μg/kg; and Malaysia 35 μg/kg) (Liu et al., 2005).
The most important member of AFs are aflatoxins B1, B2, G1 and G2 (Saleemullah et al., 2006), as shown in Figure 1. The International Agency for Research on Cancer (IARC) has taken into account AFs as
O
O
O
OCH3
OO
H
H
O
O
O
OCH3
OO
H
H
AFB2AFB1
O
O
O
OCH3
O
H
H
AFG1
O
O
O
O
O
OCH3
O
H
H
AFG2
O
O
Figure 1. The chemical structure of aflatoxin B1 (AFB1), aflatoxin B2 (AFB2), aflatoxin G1 (AFG1), and aflatoxin
G2 (AFG21)
Figure 2. The chemical structure of fumonisin B1 is 2S-amino-12S,16R-dimethyl-3S,5R,10R,14S,15R-
pentahydroxy-eicosane with the C-14 and C-15 hydroxy groups esterified by a terminal carboxyl group of
propane-1,2,3-tricarboxylic acid (tricarballylic acid); fumonisin B2 is 10-deoxy fumonisin B1; and fumonisin B3
is 5-deoxy fumonisin B1

18 Rohman et al./IFRJ 21(1): 13-24
probable human carcinogen. As a consequence, some rigorous programs have been developed by various government agencies in regulating aflatoxin levels in foods including rice to hinder human exposure to AFs (CAST, 2003). In food products, fumonisin B1 and aflatoxin B1 are considered to be most toxic members (Samapundoa et al., 2007). Fumonisin B1 is currently classified by IARC as a Group 2B (potentially carcinogenic substance), whereas aflatoxin B1 is classified as a Group 1 (carcinogenic) substance.
Some researchers have reported the presence of aflatoxin in rice in respective regions and countries. Recently, Almeida et al. (2012) have investigated several mycotoxins namely aflatoxin B1, B2, G1, and G2, ochratoxin A (OTA), zearalenone (ZON), deoxynivalenol (DON), and citreoviridin in 230 samples of processed rice and its sub-products or derived products in Brazil. The result showed that 166 rice samples analyzed, 55% had levels <0.11 mg/kg for Aflatoxins. While, 165 rice samples analyzed, 28% and 29% of samples were contaminated with OTA and ZON, with the levels from 0.20 to 0.24 mg/kg (OTA) and from 3.6 - 290.0 mg/kg (ZON), respectively. A survey has been carried out to assess the extent of aflatoxin B1, B2, G1 and G2 contamination of export-quality rice in Pakistan. A-519 batches of rice (including white, brown and sella rice) from various exporters were analyzed for aflatoxins (Firdous et al., 2012). Liu et al. (2005) has analyzed aflatoxins in 110 samples in whole grain rice and brown rice covering storage length from 1 yr to over 10 yr in China. The researchers found that the levels of aflatoxins are 3.87 and 0.88 mg/kg, respectively. No significant aflatoxin increase was observed in whole grain rice and brown rice over a 10-year storage period.
Fumonisin B1 (FB1) and fumonisin B2 (FB2) are the main members of family of mycotoxins produced by various fungan spesies belonging to the Gibberella fujikuroi complex (Hinojo et al., 2006). IARC classified FB1 and FB2 as group 2B or probably carcinogen. The chemical structure of fumonisin B1 is 2S-amino-12S,16R-dimethyl-3S,5R,10R,14S,15R-pentahydroxy-eicosane with the C-14 and C-15 hydroxy groups esterified by a terminal carboxyl group of propane-1,2,3-tricarboxylic acid (tricarballylic acid); fumonisin B2 is 10-deoxy fumonisin B1; and fumonisin B3 is 5-deoxy fumonisin B1 (Figure 2). FB1 is always the most abundant and toxic metabolite of this group of mycotoxins, representing for approximately 70% of the total concentration in naturally contaminated foods and feeds, followed by FB2 and FB3 (Murphy et al., 1993; Kim et al., 2004).
Although the maximum residue limit (MRL)
of FB1 in rice have not yet been established, to prevent risk of long-term and low-dose exposure of natural contamination, regular monitoring of FB1 in rice should be carried out. However, the MRL of FB1 in maize products is set by some regulatory authority bodies. European Union (2006) has stated that MRL of total FB1 and FB2 ranged from 0.2 to 2.0 μg/g in maize-based products and unprocessed maize. In addition, The Food and Drug Administration (FDA) has also released guidance related to the levels of total fumonisins in corn and corn-based products at 2.0 - 4.0 μg/g for foods and 5.0 - 100 μg/g for animal feeds (FDA, 2001).
Mallmann et al. (2001) have analyzed the level of FB1 in rice available in the market in Brazil. Among samples evaluated, 80% of samples were contaminated with FB1. The highest level of FB1 found is 14.21 µg/g and the lowest one is 1.14 µg/g, with average level of 4.95 µg/g. Currently, determination of FB1 contamination of rice samples and its relationship with the rate of esophageal cancer (EC) in a high risk area in northeastern Iran has been carried out by Alizadeh et al. (2012) from 22 geographical subdivisions of Golestan province of Iran. Among 66 sampples evaluated, 40.9% of samples were positive to be contaminated with FB1. The mean of FB1 levels found is 21.59 µg/g. FB1 level in rice samples obtained from high risk EC-area was significantly higher (43.8 µg/g) than that in low risk EC-area (8.93 µg/g). The authors concluded that the level of FB1 in rice samples has the positive correlation with the risk of EC. Tansakul et al. (2012) have evaluated the occurrence of FB1 and FB2 in red cargo rice from Thailand using sophisticated instrument of high-performance liquid chromatography with electrospray ionization ion trap mass spectrometry (LC-ESI-MS/MS). Among 54 samples from the retail markets, two samples were found to be naturally contaminated with FB1 at a trace level (lower than 5.0 ng/g). None of FB2 was found in any samples.
Besides AFB and FB1, some other mycotoxins which contaminated rice or rice products were also reported by some investigator(s). The presence of ochratoxin A (OTA), zearalenone (ZON), deoxynivalenol (DON), and citreoviridin (CTV) in rice in Brazil has been reported by Almeida et al. (2012). DON, nivalenol (NIV), and ZEA levels in rice in Korea were evaluated by Lee et al. (2011). A total of 201 samples of brown rice, polished rice, and two types of by-products, blue-tinged rice and discolored rice, were collected from rice stores maintained at 51 rice processing complexes in Korea. Mycotoxins found in discolored rice samples were DON at level of 59 - 1,355 ng/g, NIV in the range of 66 - 4,180 ng/g,

Rohman et al./IFRJ 21(1): 13-24 19
and ZEA at 25 - 3,305 ng/g. Polished rice samples were largely free from mycotoxins, although one sample was contaminated with NIV at level of 77.0 ng/g. Makun et al. (2011) have analyzed AF, OTA, ZON, DON, FB1, FB2, and patulin (PAT) in 21 rice samples from field (ten), store (six) and market (five) from the traditional rice-growing areas of Niger State, Nigeria. AFs were detected in all samples, at total AF concentrations of 28 - 372 μg/kg. OTA was found in 66.7% of the samples, also at high concentrations (134 - 341 μg/kg) that have to be considered as critical levels in aspects of nephrotoxicity. ZEA (53.4%), DON (23.8), FB1 (14.3%) and FB2 (4.8%) were also found in rice, although at relatively low levels. Riazipour et al. (2009) have analyzed T-2 toxin in domestic and imported rice in Iran. A- 140 samples of imported rice (125 samples of Thai and 25 samples of Pakistani rice) and 60 samples of Iranian rice were collected from warehouses of canteens of governmental offices in Tehran. All samples of rice were more or less contaminated with T-2 toxin, but the amount did not exceed the permissible limit.
Mould When cereal grains (rice) are colonized by
moulds, there is a significant risk of contamination with the secondary metabolites of these fungi. A number of these fungal compounds are endowed with toxic effects towards animals and human. Many species of Fusarium, Aspergillus, Penicillium and Alternaria are not only recognized as plant pathogens but also are sources of the important mycotoxins of concern in animal and human health (Placinta et al., 1999). Mould can contaminate rice during cultivation and handling of rice. If the environment condition fits, the mould can grow and produce mycotoxins. The fungi may later die due to increased temperature or dry periods, but once produced, the stable mycotoxins will remain in the rice (Fredlund et al., 2009).
Pacin et al. (2002) have isolated the species of Fusarium in newly harvested paddy rice, and low levels of Fusarium toxins have been detected in paddy rice. Aspergillus spp. are common contaminants of stored rice, besides some species of Alternaria and Penicillium have also been reported in rice (Park et al., 2005; Sales and Yoshizawa, 2005).
Some mould has been reported to be present in rice. Fredlund et al. (2009) have detected Aspergillus, Penicillium, Eurotium, Wallemia, Cladosporium, Epicoccum, Alternaria and Trichotecium in rice. The presence of Aspergillus flavus in 21% of the samples (99 rice samples taken from the Swedish retail market) indicated that incorrect management of rice during production and storage implies a risk of mould
growth and subsequent production of aflatoxin. The authors stated that high rice consumers may have an intake of 2 - 3 ng aflatoxin/kg bodyweight/day from rice alone. Park et al. (2005) reported the presence of Penicillium verrucosum as well as ochratoxin A in the most of evaluated rice samples produced in the northern region of Korea.
Rice bran and health and nutritionBran, germ, and endosperm play different roles
in the human body. In plant, the bran physically protects it from invaders. Bran consists of nutrients and phytochemicals to support the healthy plant. It has similar function in the human body. For humans, bran is also a source of energy and provides some protein, antioxidants, and B vitamins. Although the endosperm provides important nutrients, especially when fortified and enriched, there is a great need for diets to contain more whole grain (Orthoefer, 2005).
Rice bran consisted of 20.9% total dietary fiber in stabilized rice bran and 27.0% in parboiled rice bran. Composition of rice bran for crude protein, fat, fiber and carbohydrate are 12%, 15%, 7% and 31.1%, respectively. Rice bran also contain of 0.3 mg/g calcium, 5 mg/g magnesium, 9 mg/g phytin, 43 µg/g Zinc, 12 µg/g Thiamine, 1.8 µg/g Riboflavin and 267µg/g Niacin. Rice bran is rich in lipids, proteins, minerals, vitamins, phytin, trypsin inhibitor, lipase, and lectin. The high phosphorous content is among the highest of the cereal grains, which is about 11 mg/g. Rice bran is also high in silica (6 mg/g), probably because of the presence of rice hull fragments. Bran is high in B vitamins and tocopherol, but it contains only a little amount of vitamin A and vitamin C (Luh et al., 1991). Rice bran fraction will produce two major components, namely rice bran oil and defatted rice bran. A breakdown component from rice bran oil consist a number of fatty acid and flavonoid. Meanwhile, defatted rice bran component consist a number of polysaccharide and dietary fiber that support in cancer and cardiovascular diet therapy (Henderson et al., 2012).
Some researches have indicated that whole grain including rice bran is linked to reduced risk of obesity and weight gain. Whole grain intake was inversely related to body mass index (McKeown et al., 2002; Newby et al., 2003; Slavin, 2005; Rose, 2005). Those who consumed more whole grain consistently are less of weight gain compared to those who consumed fewer whole grain foods (Liu et al., 2003; Koh-Banerjee et al., 2004).
Higher consumption of rice bran as a whole grain was linked with a lowered risk of hypertension. Those who eating at least four daily servings of
20 Rohman et al./IFRJ 21(1): 13-24
whole grain compare to those eating less than one-half a daily serving were 23% less likely to have hypertension (Wang et al., 2007). Pins et al. (2002) found that those who eating a wholegrain as a part of healthy diet will reduce or stop their blood pressure medication compared to those who do not consume the wholegrain. Whole grain is one of the types of food in the Dietary Approaches to Stop Hypertension (DASH) that helped someone to lower blood pressure (Appel et al., 1997). Whole grains are related to decreased risk of stroke. This comes as the relationship between stroke and elevated blood pressure. A high cereal fiber diet from the rice bran and whole grain is one of a number of healthy lifestyle factors associated with a decreased risk of ischemic stroke (Kurth et al., 2006). Anderson and Pasupuleti (2008) found that whole grain intakes are associated with diabetes and metabolic syndrome. Metabolic syndrome is characterized by abdominal obesity, atherogenic dyslipidemia, elevated blood pressure, and insulin resistance, as well as prothrombotic and proinflammatory states. Metabolic syndrome is related to the development of type 2 diabetes and cardiovascular disease (CVD). Therefore, cereal fiber and whole grain appear to lower the risk of metabolic syndrome and are part of an important public health strategy.
Rice bran and its oil contain large concentrations of several compounds that could potentially prevent chronic diseases such as coronary heart disease and cancer. The epidemiological study showed an inverse association between whole grain ingestion and risk of CVD, including coronary heart disease (CHD), hypertension, and stroke. A meta-analysis study also showed that the regular intake of whole grain was associated with a 26% reduction in the risk of CHD (Anderson, 2004). Human studies show that whole grain decrease risk of cancers of the upper gut (La Vecchia et al., 2003) and colorectal cancer risk reduction from 35% to 50% (Wakai et al., 2006).
Rice in heart disease and cancerThere are lack studies that have been conducted to
conclude the association between certain compounds found in rice bran and health benefit effects. Bioactive food components such as γ-oryzanol, tocopherols, tocotrienols, polyphenols, phytosterols, and carotenoids are found in rice bran. It also contains essential amino acids and micronutrients that work together for health promotion. Selected compounds from rice bran have been investigated for the prevention and control of chronic disease through multiple mechanisms. Rice bran and its oil may have cardiovascular health benefits. Rice bran
supplementation in humans has the similar beneficial effects on lipoproteins (Ranhotra et al., 1989; Kestin et al., 1990; Cara et al., 1992). The result showed that oat bran was effective in lowering cholesterol’s level in human with moderate high blood cholesterol concentrations (Gerhardt and Gallo, 1998). Replacing the usual cooking oils with rice bran oil in hypercholesterol subject showed the decreasing of blood cholesterol’s level (Raghuram et al., 1989), and it also have the similar effect in middle-aged and elderly subjects (Lichtenstein et al., 1994). Rice bran oil contain 20% saturated fatty acids and it is equal amounts of oleic and linoleic fatty acids (Rukmini and Raghuram, 1991). The cholesterol-lowering properties in rice bran can be caused by unsaponifiable component present in rice bran oil (Sugano and Tsuji, 1997; Wilson et al., 2000). It includes phytosterols, triterpene alcohols, tocopherols, and tocotrienols, as possible hypocholesterolemic agents.
Evidence suggests that dietary rice bran may exert beneficial effects against breast, lung, liver, and colorectal cancer (Henderson et al., 2012). The potential chemopreventive agents in the bran are ferulic acid, tricin, β-sitosterol, γ-oryzanol, tocotrienols/tocopherols, and phytic acid (Barnes et al., 1983). The anticancer effects of the rice bran are mediated through the ability of these agents to induce apoptosis, inhibit cell proliferation, and alter cell cycle progression in malignant cells. These protect against tissue damage through the scavenging of free radicals and the blocking of chronic inflammatory responses. These have also been shown to activate anticancer immune responses as well as affecting the colonic tumor microenvironment in favor of enhanced colorectal cancer chemoprevention. In addition, the low cost of rice production and the accessibility of rice bran make it an appealing candidate for global dietary chemoprevention. Therefore, the establishment of dietary rice bran as a practical food-derived chemopreventive agent has the potential to have a significant impact on cancer prevention for the global population (Fan et al., 2000; Kannan et al., 2008).
References
Alizadeh, A. M., Roshandel, G., Roudbarmohammadi, S., Roudbary, M., Sohanaki, H., Ghiasian, S. A., Taherkhani, A., Semnani, S. and Aghasi, M. 2012. Fumonisin B1 Contamination of Cereals and Risk of Esophageal Cancer in a High Risk Area in Northeastern Iran. Asian Pacific Journal of Cancer Prevention 13(6): 2625 - 2628.
Almeida, M. I., Almeida, N. G., Carvalho, K. L., Gonçalves, G. A. A., Silva, C. N., Santos, E. A., Garcia, J. C.

Rohman et al./IFRJ 21(1): 13-24 21
and Vargas, E. A. 2012. Co-occurrence of aflatoxins B1, B2, G1 and G2, ochratoxin A, zearalenone, deoxynivalenol, and citreoviridin in rice in Brazil. Food Additives and Contaminants 29(4): 694 - 703.
Anderson, J. W. 2004. Whole grains and coronary heart disease: the whole kernel of truth. American Journal of Clinical Nutrition 80: 1459 - 60.
Anderson, J. W. and Pasupuleti, V. 2008. Future trends and directions. In Nutraceuticals, Glycemic Health and Diabetes, ed. V Pasupuleti, JW Anderson. Ames, IA: Blackwell, USA.
Appel, L. J., Moore, T. J., Obarzanek, E., Vollmer, W. M., Svetkey, L. P., et al. 1997. A clinical trial of the effects of dietary patterns on blood pressure. DASH Collaborative Research Group. New England Journal of Medicine 336(16): 1117 - 1124.
Arsenault, J. E., Yakes, E. A., Hossain, M. B., Islam, M. M., Ahmed, T., Hotz, C., Lewis, L., Rahman, A. S., Jamil, K. M. and Brown, K. H. 2010. The Current High Prevalence of Dietary Zinc Inadequacy among Children and Women in Rural Bangladesh Could Be Substantially Ameliorated by Zinc Biofortification of Rice. Journal of Nutrition 140: 1683 - 1690.
Atkinson, F. S., Foster-Powell, K. and Brand-Miller, J. C. 2008. International Tables of Glycemic Index and Glycemic Load Values. Diabetes Care 31(12): 2281 - 2283.
Azizur, Rahman M., Hasegawa, H., Mahfuzur, Rahman M., Arifur, Rahman M. and Miah, M. A. M. 2007. Accumulation of arsenic in tissues of rice plant (Oryza sativa L.) and its distribution in fractions of rice grain. Chemosphere 69: 942–948.
Azizur, Rahman M. and Hasegawa, H. 2011. High levels of inorganic arsenic in rice in areas where arsenic-contaminated water is used for irrigation and cooking. Science of the Total Environment 409: 4645 - 4655.
Barnes, D. S., Clapp, N. K., Scott, D. A., Oberst, D. L. and Berry, S. G. 1983. Effects of wheat, rice, corn, and soybean bran on 1,2-dimethylhydrazine-induced large bowel tumorigenesis in F344 rats. Nutrition and Cancer 5: 1 - 9.
Batista, B. L., Souza, J. M. O., De Souza, S. S. and Barbosa Jr, F. 2011. Speciation of arsenic in rice and estimation of daily intake of different arsenic species by Brazilians through rice consumption. Journal of Hazardous Materials 191: 342 - 348.
Bhattacharya, P., Samal, A. C., Majumdar, J. and Santra, S. C. 2010. Accumulation of arsenic and its distribution in rice plant (Oryza sativa L.) in Gangetic West Bengal, India. Paddy Water Environment 8: 63 - 70.
Bhullar, N. K. and Gruissem, W. 2013. Nutritional enhancement of rice for human health: The contribution of Biotechnology 31: 50 - 57.
Brand, J. C., Nicholson, P. L., Thorburn, A. W. and Truswell, A. S. 1985. Food processing and the glycemic index. American Journal of Clinical Nutrition 42: 1192-1196.
CAST. 2003. Mycotoxins: risks in plant, animal and humans (199 pp). In J. L. Richard, G. A. Payne (Eds). Council of Agricultural Science and Technology
(CAST) Task Force Report No. 139. Ames. Iowa.Cara, L., Dubois, C., Borel, P., et al. 1992. Effects of
oat bran, rice bran, wheat fiber, and wheat germ on postprandial lipemia in healthy adults. American Journal of Clinical Nutrition 55: 81 - 88.
Das, H. K., Mitra, A. K., Sengupta, P. K., Hossain, A., Islam, F. and Rabbani, G. H. Arsenic concentrations in rice, vegetables, and fish in Bangladesh: A preliminary study. Environmental International 30: 383 - 387.
Deepa, G., Singh, V. and Naidu, K. A. 2008. Nutrient composition and physicochemical properties of Indian medicinal rice – Njavara. Food Chemistry 106: 165–171.
Duxbury, J. M., Mayer, A. B., Lauren, J. G. and Hassan, N. 2003. Food chain aspects of arsenic contamination in Bangladesh: Effects on quality and productivity of rice. Journal of Environmental Science and Health 38: 61 - 69.
Elfman, L., Tooke, L. E. and Patring, J. D. M. 2011. Detection of pesticides used in rice cultivation in streams on the island of Leyte in the Philippines. Agricultural Water Management 101: 81 - 87.
European Commission. 2006. Commission Regulation (EC) No. 1881/2006 of 19 December 2006 setting maximum levels for certain contaminants in foodstuffs. Offcial Journal of the European Union. L364: 5 - 24.
Fan, H., Morioka, T. and Ito, E. 2000. Induction of apoptosis and growth inhibition of cultured human endometrial adenocarcinoma cells (Sawano) by an antitumor lipoprotein fraction of rice bran. Gynecologic Oncology 76: 170 - 175.
Fatema, K., Rahman, F., Sumi, N., Kobura, K. and Ali, L. 2010. Glycemic index of three common varieties of Bangladeshi rice in healthy subjects. African Journal of Food Science 4(8): 531 - 535.
FAO 2001. Nutritional contribution of rice and impact of biotechnology and biodiversity in rice-consuming countries. Downloaded from http://www.fao.org/docrep/006/Y4751E/y4751e05.htm.
FAO 2004. Rice is life. Downloaded from http://www.fao.org/rice2004/en/f-sheet/factsheet3.pdf.
Food and Drug Administration. 2001. Guidance for industry: fumonisin levels in human foods and animal feeds, FDA Final Guidance.
Firdous, S., Ejaz, N., Aman, T. and Khan, N. 2012. Occurrence of aflatoxins in export quality Pakistani rice. Food Additives and Contaminants: Part B: Surveillance. 5(2): 121-125.
Fredlund, E., Thim, A. M., Gidlund, A., Brostedt, S., Nyberg, M. and Olsen, M. 2009. Moulds and mycotoxins in rice from the Swedish retail market. Food Additives & Contaminants: Part A 26(4): 527-533.
Fu, J., Zhou, Q., Liu, J., Liu, W., Wang, T., Zhang, Q. and Jiang, G. 2008. High levels of heavy metals in rice (Oryza sativa L.) from a typical E-waste recycling area in southeast China and its potential risk to human health. Chemosphere 71: 1269 - 1275.
Gerhardt, A. L. and Gallo, N. B. 1998. Full-fat rice bran and oat bran similarly reduce hypercholesterolemia in

22 Rohman et al./IFRJ 21(1): 13-24
humans. Journal of Nutrition 128: 865 - 869.Gilbert, J. 2002. Validation of analytical methods for
determining mycotoxins in foodstuffs. Trends in Analytical Chemistry 21: 6 - 27.
Gilbert-Diamond, D., Cottingham, K. L., Gruber, J. F., Punshon, T., Sayarath, V., Gandolfi, A. J., Baker, E. R., Jackson, B. P., Folt, D. R. and Karagas, M. R. 2011. Rice consumption contributes to arsenic exposure in US women. Proceeding of the national Academy of Sciences of the United States of America 108: 1 - 5.
Heinemann, R. J. B., Fagundes, P. L., Pinto, E. A., Penteado, M. V. C. and Lanfer-Marquez, U. M. 2005. Comparative study of nutrient composition of commercial brown, parboiled and milled rice from Brazil. Journal of Food Composition and Analysis 18: 287–296.
Heitkemper, D. T., Vela, N. P., Stewart, K. R. and Westphal, C. S. 2001. Determination of total and speciated arsenic in rice by ion chromatography and inductively coupled plasma mass spectrometry. Journal of Analytical Atomic Spectrometry 16: 299–306.
Henderson, Angela J., Ollila, Cadie A., Kumar, A., Borresen, E. C., Raina, K., Agarwal, R. and Ryan, E. P. 2012. Chemopreventive Properties of Dietary Rice Bran: Current Status and Future Prospects. Advance in Nutrition 3: 643-653.
Hinojo, M. J., Medina, A., Valle-Algarra, F. M., Gimeno-Adelantado, J. V., Jimenez, M. and Mateo, R. 2006. Fumonisin production in rice cultures of Fusarium verticillioides under different incubation conditions using an optimized analytical method. Food Microbiology 23: 119 - 127.
Hu, E. A., Malik, V. and Sun, Q. 2012. White rice consumption and risk of type 2 diabetes: meta-analysis and systematic review. BMJ. 344: e1454 doi: 10.1136/bmj.e1454.
International Rice Research Institute 2013. Downloaded from www.irri.org.
Jenkins, D. J., Wolever, T. M., Taylor, R. H., Barker, H., Fielden, H., Baldwin, J. M., Bowling, A. C., Newman, H. C., Jenkins, A. L. and Goff, D. V. 1981. Glycemic index of foods: A physiological basis for carbohydrate exchange. American Journal of Clinical Nutrition 34(3): 362 - 366.
Jenkins, D. J., Kendall, C. W., Augustin, L. S., Franceschi, S., Hamidi, M., Marchie, A., Jenkins, A. L. and Axelsen, M. 2002. Glycemic index: Overview of implications in health and disease. American Journal of Clinical Nutrition 76(1): 266S - 273S.
Kannan, A., Hettiarachchy, N., Johnson, M. G. and Nannapaneni, R. 2008. Human colon and liver cancer cell proliferation inhibition by peptide hydrolysates derived from heat-stabilized defatted rice bran. Journal of Agricultural and Food Chemistry 56: 11643 - 11647.
Kawakatsu, T., Wang, S., Wakasa, Y. and Takaiwa, F. 2010. Increased lysine content in rice grains by ver-accumulation of BiP in the endosperm. Bioscience, Biotechnology and Biochemistry 74(12): 2529 - 2531.
Kestin, M., Moss, R., Clifton, P. M. and Nestel, P. J. 1990. Comparative effects of three cereal brans on plasma lipids, blood pressure, and glucosemetabolismin mildly hypercholesterolemic men. American Journal of Clinical Nutrition 52: 661 - 666.
Kim, E. K., Maragos, C. M. and Kendra, D. F. 2004. Liquid chromatographic determination of fumonisins B1,B2, and B3 in corn silage. Journal of Agricultural and Food Chemistry 52: 196 - 200.
Koh-Banerjee, P., Franz, M., Sampson, L., Liu, S., Jacobs, D. R Jr., et al. 2004. Changes in whole-grain, bran, and cereal fiber consumption in relation to 8-y weight gain among men. American Journal of Clinical Nutrition 80(5): 1237 - 45.
Kumar, V., Basu, M. S. and Rajendran, T. P. 2008. Review: Mycotoxin research and mycoflora in some commercially important agricultural commodities. Crop Protection 27: 891 - 905.
Kurth, T., Moore, S. C., Gaziano, J. M., Kase, C. S., Stampfer, M. J., et al. 2006. Healthy lifestyle and the risk of stroke in women. Archieves of Internal Medicine. 166(13): 1403 - 9.
La Vecchia, C., Chatenoud, L., Negri, E., Franceschi, S. 2003. Session, whole cereal grains, fibre and human cancer: wholegrain cereals and cancer in Italy. Proceedings of the Nutrition Society. 62(1): 45 - 49.
Lee, T., Lee, S. H., Lee, S. H., Shin, J. Y., Yun, J. C., Lee, Y. W., Ryu, J. G. 2011. Occurrence of Fusarium mycotoxins in rice and its milling by-products in Korea. Journal of Food Protection. 74(7): 1169 - 74.
Lichtenstein, A. H., Ausman, L. M., Carrasco, W., et al. 1994. Rice bran oil consumption and plasma lipid levels in moderately hypercholesterolemic humans. Arteriosclerosis, Thrombosis and Vascular Biology. 14: 549 - 556.
Lin, H. T., Wong, S. S., Li, G. C. 2004. Heavy metal content of rice and shellfish in Taiwan. Journal of Food and Drug Analysis. 12: 167 - 174.
Liu, S., Willett, W. C., Manson, J. E., Hu, F. B., Rosner, B., Colditz, G. 2003. Relation between changes in intakes of dietary fiber and grain products and changes in weight and development of obesity among middle-aged women. American Journal of Clinical Nutrition. 78(5): 920 - 927.
Liu, Z., Gao, J., Yu, J. 2005. Aflatoxins in stored maize and rice grains in Liaoning Province, China. Journal of Stored Products Research. 42: 468 - 479.
Luh, B. S., Barber, S., deBarger, C. B. 1991. Rice Utilization. In B.S. Luh, ed. Vol. II. New York: Van Nostrand Reinhold.
Makun, H. A., Dutton, M. F., Njobeh, P. B., Mwanza, M., Kabiru, A. Y. 2011. Natural multi-occurrence of mycotoxins in rice from Niger State, Nigeria. Mycotoxin Research. 27: 97 - 104.
McKeown, N. M., Meigs, J. B., Liu, S., Wilson, P. W., Jacques, P. F. 2002. Whole-grain intake is favorably associated with metabolic risk factors for type 2 diabetes and cardiovascular disease in the Framingham Offspring Study. American Journal of Clinical Nutrition. 76(2): 390 - 98.

Rohman et al./IFRJ 21(1): 13-24 23
Mallmann, C. A., Santurio, J. M., Almeida, C. A. A., Dilkin, P. 2001. Fumonisin B levels in cereals and feeds from southern Brazil. Arquivos do Instituto Biológico. 68(1): 41 - 45.
Meharg, A. A. and Rahman, M. 2003. Arsenic contamination of Bangladesh paddy eld soils: Implications for rice contribution to arsenic consumption. Environmental Science and Technology. 37: 229 - 34.
Meharg, A. A., Williams, P. N., Adomako, E., Lawgali, Y. Y., Deacon, D., Villada, A., Cambell, R. C. J., Sun, G., Zhu, Y. G., Feldmann, J., Raab, A., Zhao, F. J., Islam, R., Hossain, S., Yanai, J. 2009. Geographical variation in total and inorganic As content of polished (white) rice. Environmental Science and Technology 43: 1612 - 1617.
Murphy, P. A., Rice, L. G., Ross, P. F. 1993. Fumonisin B1, B2 and B3 content of Iowa, Wisconsin, and Illinois corn and corn screenings. Journal of Agricultural and Food Chemistry. 41: 263 - 266.
Nan, Z., Zhao, C., Li, J., Chen, F., Sun, W. 2002. Relations between soil properties and elected heavy metal concentrations in spring wheat (Triticum aestivum L.) grown in contaminated soils. Water, Air, Soil Pollutition. 133: 205–213.
Nanri, A., Mizoue, T., Noda, M., Takahashi, Y., Kato, M., Inoue, M., Tsugane, S. 2010. Rice intake and type 2 diabetes in Japanese men and women: the Japan Public Health Center–based Prospective Study. American Journal of Clinical Nutrition. 92: 1468 - 1477.
Newby, P. K., Muller, D., Hallfrisch, J., Qiao, N., Andres, R., Tucker, K. L. 2003. Dietary patterns and changes in body mass index and waist circumference in adults. American Journal of Clinical Nutrition. 77(6): 1417 - 1425.
Ohno, K., Yanase, T., Matsuo, Y., Kimura, T., Hamidur, Rahman M., Magara, Y., Matsui, Y. 2007. Arsenic intake via water and food by a population living in an arsenic-affected area of Bangladesh. The Science of the Total Environment. 381: 68 - 76.
Orthoefer, F. T. 2005. Rice Brain Oil. In Bailey’s Industrial Oil and Fat Products, Sixth Edition. New York: John Wiley & Sons, Inc.
Pacin, A., Gonzales, H., Etcheverry, M., Resnik, S., Vivas, L., Espin, S. 2002. Fungi associated with food and feed commodities from Ecuador. Mycopathologia. 156: 87 - 92.
Panlasigui, L. N., Thompson, L. U., Juliano, B. O., Perez, C. M., Yiu, S. H. 1991. Greenberg GR. Rice varieties with similar amylose content differ in starch digestibility and glycemic response in humans. American Journal of Clinical Nutrition. 54: 87l - 877.
Park, J. W., Choi, S. Y., Hwang, H. J., Kim, Y. B. 2005. Fungal mycoflora and mycotoxins in Korean polished rice destined for humans. International Journal of Food Microbiology. 103: 305 - 314.
Pasias, I. N., Thomaidis, N. S., Piperaki, E. A. 2013. Determination of total arsenic, total inorganic arsenic and inorganic arsenic species in rice and rice flour by electrothermal atomic absorption spectrometry. Microchemical Journal. 108: 1 - 6.
Phuong, T. D., Chuong, P. V., Khiem, D. T., Kokot S. Elemental content of Vietnamese rice. Part 1. Sampling, analysis and comparison with previous studies. Analyst 1999; 124: 553 - 560.
Pins, J. J., Geleva, D., Keenan, J. M., Frazel, C., O’Connor, P. J., Cherney, L. M. 2002. Do whole-grain oat cereals reduce the need for antihypertensive medications and improve blood pressure control? The Journal of Family Practice. 51(4): 353 - 359.
Placinta, C. M., D’Mello, J. P. F., Macdonald, A. M. C. 1999. A review of worldwide contamination of cereal grains and animal feed with Fusarium mycotoxins. Animal Feed Science and Technology. 78: 21 - 37.
Raghuram, T. C., Rao, U. B., Rukmini, C. 1989. Studies on hypolipidemic effects of dietary rice bran oil in human subjects. Nutrition Reports International. 39: 889 - 95.
Rahman, M. A., Owens, G., Naidu, R. 2009. Arsenic levels in rice grain and assessment of daily dietary intake of arsenic from rice in arsenic-contaminated regions of Bangladesh - implications to groundwater irrigation. Environmental, Geochemistry and Health. 31: 179 - 187.
Rahman, M. S., Miah, M. A. M., Khaled, H. M., Islam, A., Panaullah, G. M. 2010. Arsenic Concentrations in Groundwater, Soils, and Irrigated Rice in Southwestern Bangladesh. Communications in Soil Science and Plant Analysis. 41(16): 1889 - 1895.
Ranhotra, G. S., Gelroth, J. A., Reeves, R. D., Rudd, M. K., Durkee, W. R., Gardner, J. D. 1989. Short-term lipidemic response in otherwise healthy hypercholesterolemic men consuming foods high in soluble fiber. Cereal Chemistry. 66: 94 - 97.
Riazipour, M., Fooladi, A. A. I., Razzaghi-Abyaneh, M. 2009. Natural Occurrence of T-2 Toxin in Domestic and Imported Rice. Iranian Journal of Public Health. 38(4): 111 - 116.
Rose, N. E. 2005. Whole Grain Intake in College Students and its Association with Body Mass Index. Master thesis. Va. Polytech. Inst.
Roy, P., Ijiri, T., Okadome, H., Nei, D., Orikasa, T., Nakamura, N., Shiina, T. 2008. Effect of processing conditions on overall energy consumption and quality of rice (Oryza sativa L.). Journal of Food Engineering. 89: 343–348.
Rukmini, C. and Raghuram, T. C. 1991. Nutritional and biochemical aspects of the hypolipidemic action of rice bran oil: a review. Journal of the American College of Nutrition. 10: 593 - 601.
Rustom, I. Y. S. 1997. Aflatoxin in food and feed: occurrence, legislation and inactivation by physical methods. Food Chemistry. 59: 57 - 67.
Ryan, E. P. 2011. Bioactive food components and health properties of rice bran. Journal of the American veterinary Medical Association. 238: 593 - 600.
Saleemullah, Iqbal, A., Khalil, I. A. and Shah, H. 2006. Aflatoxin contents of stored and artificially inoculated cereals and nuts. Food Chemistry 98: 699–703.
Sales, A. and Yoshizawa, T. 2005. Updated profile of aflatoxin and Aspergillus section Flavi contamination

24 Rohman et al./IFRJ 21(1): 13-24
in rice and its byproducts from the Philippines. Food Additives and Contaminants 22: 429 - 436.
Samapundoa, S., De Meulenaer, B., Osei-Nimoha, D., Lamboni, Y., Debevere, J. and Devlieghere, F. 2007. Can phenolic compounds be used for the protection of corn from fungal invasion and mycotoxin contamination during storage?. Food Microbiology 24: 465 - 473.
Schoof, R. A., Yost, L. J., Crecelius, E., Irgolic, K., Goessler, W., Guo, H. R., et al. 1998. Dietary arsenic intake in Taiwanese districts with elevated arsenic in drinking water. Human and Ecological Risk Assessment 4: 117 - 135.
Schoof, R. A., Yost, L. J., Eickhoff, J., Crecelius, E. A., Cragin, D. W., Meacher, D. M. and Menzel, D. B. 1999. A market basket survey of inorganic arsenic in food. Food and Chemical Toxicology 37: 839 - 846.
Seki, T., Nagase, R., Torimitsu, M., Yanagi, M., Ito, Y., Kise, M., Mizukuchi, A., Fujimura, N., Hayamizu, K. and Ariga, T. 2005. Insoluble Fiber Is a Major Constituent Responsible for Lowering the Post-Prandial Blood Glucose Concentration in the Pre-Germinated Brown Rice. Biological and Pharmaceutical Bulletin 28(8): 1539 - 1541.
Shotwell, O. I., Hesseltine, C. W., Stubblefield, R. D. and Sorenson, W. G. 1966. Production of Aflatoxin on Rice. Applied Microbiology 14(3): 425 - 428.
Slavin, J. L. 2005. Dietary fiber and body weight. Nutrition 21(3): 411- 418
Sorenson, R. L., Garry, D. G. and Brelje, T. C. 1991. Structural and Functional Considerations of GABA in Islets of Langerhans β-Cells and Nerves. Diabetes 40: 1365 - 1374.
Sperottoa, R. A., Ricachenevsky, F. K., de Abreu Waldow, V. and Fettb, J. P. 2012. Iron biofortification in rice: It’s a long way to the top. Plant Science 190: 24 - 39.
Sugano, M. and Tsuji, E. 1997. Rice bran oil and cholesterol metabolism. Journal of Nutrition 127: 521S - 524S.
Sun, G. X., Williams, P. N., Carey, A. M., Zhu, Y. G., Deacon, C., Raab, A., Fieldmann, J., Islam, R. M. and Meharg, A. A. 2008. Inorganic arsenic in rice bran and its products are an order of magnitude higher than in bulk grain. Environmental Science and Technology 42: 7542 - 7546.
Sun, Q., Spiegelman, D., van Dam, R. M., Holmes, M. D., Malik, V. S. and Willett, W. C., Hu, F. B. 2010. White Rice, Brown Rice, and Risk of Type 2 Diabetes in US Men and Women. Archive Internal Medicine 170(11): 961 - 969.
Tansakul, N., Limsuwan, S. and Trongvanichnam, K. 2012. Fumonisin monitoring in Thai red cargo rice by reversed-phase high-performance liquid chromatography with electrospray ionization ion trap mass spectrometry. International Food Research Journal 19(4): 1561 - 1566.
Torres-Escribano, S., Leal, M., Vélez, D. and Montoro, R. 2008. Total and Inorganic Arsenic Concentrations in Rice Sold in Spain, Effect of Cooking, and Risk Assessments. Environmental Science and Technology
42: 3867 - 3872.Tsukada, H. and Takeda, A. 2008. Concentration of chlorine
in rice plant components. Journal of Radioanalytical and Nuclear Chemistry 278(2): 387 - 390.
U.S. Department of Agriculture, Agricul-tural Research Service: USDA National Nutrient Database for Standard Reference 2011. Downloaded from http://ndb.nal.usda.gov/ndb/foods/list.
Vicky-Singh, M. S., Preeti-Sharma, B. and Malhi, S. S. 2010. Arsenic in Water, Soil, and Rice Plants in the Indo-Gangetic Plains of Northwestern India. Communications in Soil Science and Plant Analysis 41(11): 1350 - 1360.
Wakai, K., Hirose, K., Matsuo, K., Ito, H., Kuriki, K., et al. 2006. Dietary risk factors for colon and rectal cancers: a comparative case-control study. Journal of Epidemiology. 16(3): 125 - 35.
Wang, L., Gaziano, J. M., Liu, S., Manson, J. E., Buring, J. E. and Sesso, H. D. 2007. Whole- and refined-grain intakes and the risk of hypertension in women. American Journal of Clinical Nutrition 6(2): 472 - 79.
WHO. 1999. Thiamine deficiency and its prevention and control in major emergencies.
WHO. 2000. Joint FAO/WHO Expert Committee on Food Additives (JECFA), Evaluation of Certain Food Additives and Contaminants. Fifty-third Report of the Joint FAO/WHO Expert Committee on Food Additives. WHO Technical Report Series 896. Geneva, Switzerland.
Williams, P. N., Price, A. H., Raab, A., Hossain, S. A., Feldmann, J. and Meharg, A. A. 2005. Variation in Arsenic Speciation and Concentration in Paddy Rice Related to Dietary Exposure. Environmental Science & Technology 39: 5531 - 5540.
Williams, P. N., Islam, M. R., Adomako, E. E., Raab, A., Hossain, S. A. and Zhu, Y. G., et al. 2006. Increase in rice grain arsenic for regions of Bangladesh irrigating paddies with elevated arsenic in groundwaters. Environmental Science and Technology 40: 4903 - 4908.
Wilson, T. A., Ausman, L. M., Lawton, C. W., Hegsted, M. and Nicolosi, R. J. 2000. Comparative cholesterol lowering properties of vegetable oils: beyond fatty acids. Journal of the American College of Nutrition 19: 601 - 607.
Wolever, T. M. S., Jenkins, D. J. A., Jenkins, A. L. and Josse, R. G. 1991. The glycemic index: methodology and clinical implications. American Journal of Clinical Nutrition 54: 846 - 854.
Xiulan, S., Xiaolian, Z., Jian, T., Xiaohong, G., Jun, Z. and Chu, F. S. 2006. Development of an immunochromatographic assay for detection of aflatoxin B1 in foods. Food Control 17: 256 - 262.