Mind the Gap: Understanding the Indigenous education gap ...
40
Glenn Fahey Mind the Gap: Understanding the Indigenous education gap and how to close it Research Report | June 2021
Transcript of Mind the Gap: Understanding the Indigenous education gap ...
Glenn Fahey
Mind the Gap: Understanding the Indigenous education gap and how to close it
Research Report | June 2021

Research Report 41
Mind the Gap: Understanding the Indigenous
education gap and how to close it
Glenn Fahey

Contents
Executive Summary ...............................................................................................1
Introduction ..........................................................................................................3
Closing the Gap in education ...................................................................................4
Many Indigenous students are succeeding, but many are not ......................................7
Indigenous students attract considerably higher resourcing than non-Indigenous peers .....8
The academic achievement gap ...............................................................................9
The school attendance gap ...................................................................................14
The early learning gap .........................................................................................17
The school and post-school attainment gap .............................................................19
Implications for policymakers ................................................................................22
Conclusion ..........................................................................................................26
Empirical methodology .........................................................................................26
Statistical tables ..................................................................................................27
Endnotes ............................................................................................................30


Mind the Gap: Understanding the Indigenous education gap and how to close it | 1
Indigenous educational disadvantage — compounded by complex and interrelated social, health, and employment outcomes — remains among the most pressing and persistent public policy challenges in Australia.
By school-leaving age, the average Indigenous Australian student is around two and a half years behind the average non-Indigenous one — with achievement levels more comparable to developing nation school systems than those of the wider Australian population.1 This severely limits the future educational and employment opportunities of these young learners, condemning many to prolonged economic and social disadvantage.
Truly ‘closing this gap’ is a moral, educational, and economic imperative. Dispiritingly poor education outcomes persist despite the best of intentions, considerable investment of resources, and countless programmes and policymaker initiatives.
The bipartisan and intergovernmental commitment to ‘Closing the Gap’, spanning more than a decade, has done little to move the needle in education outcomes — meaning much work remains to address Indigenous educational disadvantage.
Research findingsIndigenous students make similar academic progress in school, but have far lower starting scores on average
• By and large, Indigenous students make similar progress at school to their non-Indigenous peers.
Executive Summary
• However, they are more likely to start behind them — especially, but not exclusively, in remote schools.
• While there are some isolated examples of significant catch-up of students in remote majority-Indigenous schools, to date this has not been systematically replicated.
• This means that, for many Indigenous students, there is no academic catch-up with their peers.
• There is some evidence to suggest Indigenous students’ achievement is improving over time in some states, and that the achievement gap is slowly reducing — though progress against student achievement Closing the Gap targets has been mixed. International assessments indicate improvements in science, but reading results are mixed.
• High levels of NAPLAN non-participation (especially in remote areas and high schools) limits the ability to draw conclusions about the state of achievement for many Indigenous students. For example: only around half of the Northern Territory’s Indigenous students sit Year 9 NAPLAN tests.
There’s a wide distribution of Indigenous student outcomes and backgrounds
• 18 per cent of Indigenous students can be identified in an educationally vulnerable group by Year 3. They are mostly located in remote locations, come from families with parents who are not employed, from a non-English speaking background, in relatively small schools, and in a majority-Indigenous school.
2 | Mind the Gap: Understanding the Indigenous education gap and how to close it
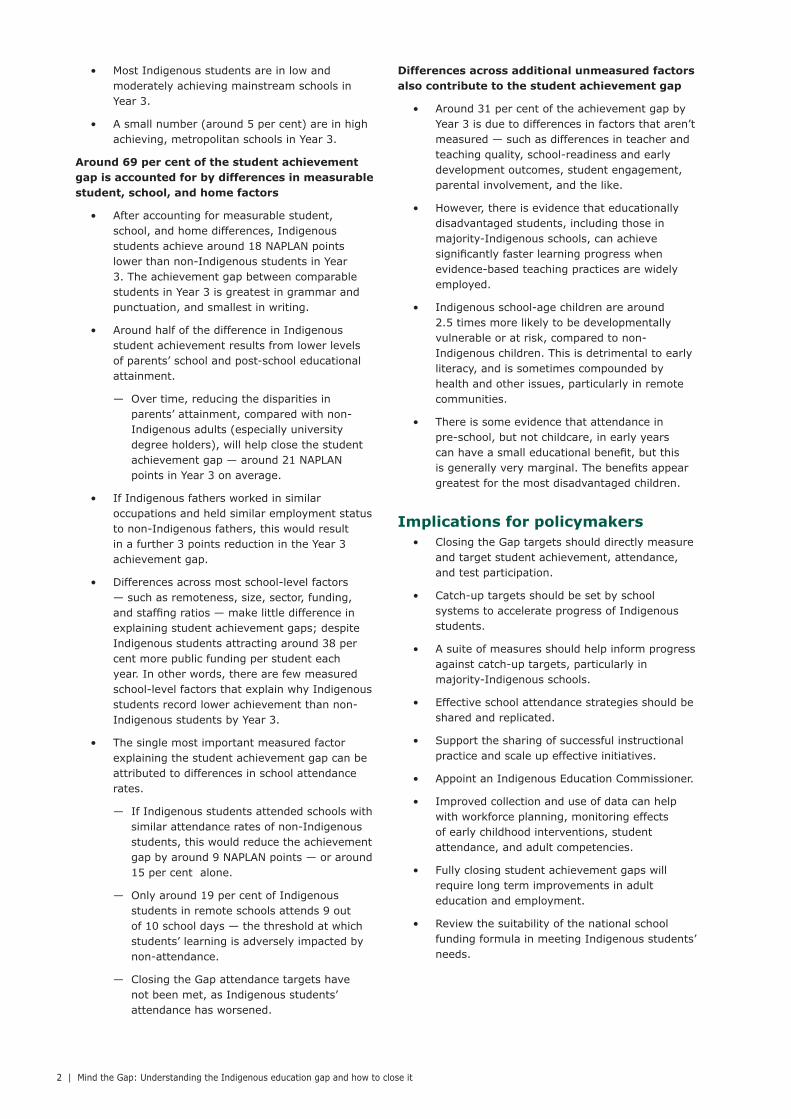
• Most Indigenous students are in low and moderately achieving mainstream schools in Year 3.
• A small number (around 5 per cent) are in high achieving, metropolitan schools in Year 3.
Around 69 per cent of the student achievement gap is accounted for by differences in measurable student, school, and home factors
• After accounting for measurable student, school, and home differences, Indigenous students achieve around 18 NAPLAN points lower than non-Indigenous students in Year 3. The achievement gap between comparable students in Year 3 is greatest in grammar and punctuation, and smallest in writing.
• Around half of the difference in Indigenous student achievement results from lower levels of parents’ school and post-school educational attainment.
— Over time, reducing the disparities in parents’ attainment, compared with non-Indigenous adults (especially university degree holders), will help close the student achievement gap — around 21 NAPLAN points in Year 3 on average.
• If Indigenous fathers worked in similar occupations and held similar employment status to non-Indigenous fathers, this would result in a further 3 points reduction in the Year 3 achievement gap.
• Differences across most school-level factors — such as remoteness, size, sector, funding, and staffing ratios — make little difference in explaining student achievement gaps; despite Indigenous students attracting around 38 per cent more public funding per student each year. In other words, there are few measured school-level factors that explain why Indigenous students record lower achievement than non-Indigenous students by Year 3.
• The single most important measured factor explaining the student achievement gap can be attributed to differences in school attendance rates.
— If Indigenous students attended schools with similar attendance rates of non-Indigenous students, this would reduce the achievement gap by around 9 NAPLAN points — or around 15 per cent alone.
— Only around 19 per cent of Indigenous students in remote schools attends 9 out of 10 school days — the threshold at which students’ learning is adversely impacted by non-attendance.
— Closing the Gap attendance targets have not been met, as Indigenous students’ attendance has worsened.
Differences across additional unmeasured factors also contribute to the student achievement gap
• Around 31 per cent of the achievement gap by Year 3 is due to differences in factors that aren’t measured — such as differences in teacher and teaching quality, school-readiness and early development outcomes, student engagement, parental involvement, and the like.
• However, there is evidence that educationally disadvantaged students, including those in majority-Indigenous schools, can achieve significantly faster learning progress when evidence-based teaching practices are widely employed.
• Indigenous school-age children are around 2.5 times more likely to be developmentally vulnerable or at risk, compared to non-Indigenous children. This is detrimental to early literacy, and is sometimes compounded by health and other issues, particularly in remote communities.
• There is some evidence that attendance in pre-school, but not childcare, in early years can have a small educational benefit, but this is generally very marginal. The benefits appear greatest for the most disadvantaged children.
Implications for policymakers• Closing the Gap targets should directly measure
and target student achievement, attendance, and test participation.
• Catch-up targets should be set by school systems to accelerate progress of Indigenous students.
• A suite of measures should help inform progress against catch-up targets, particularly in majority-Indigenous schools.
• Effective school attendance strategies should be shared and replicated.
• Support the sharing of successful instructional practice and scale up effective initiatives.
• Appoint an Indigenous Education Commissioner.
• Improved collection and use of data can help with workforce planning, monitoring effects of early childhood interventions, student attendance, and adult competencies.
• Fully closing student achievement gaps will require long term improvements in adult education and employment.
• Review the suitability of the national school funding formula in meeting Indigenous students’ needs.
Mind the Gap: Understanding the Indigenous education gap and how to close it | 3
Despite persistent educational disadvantage faced by Indigenous Australians — and the increased attention due to the Closing the Gap process for more than a decade — there remains limited understanding of the nature and source of the educational gap — let alone solutions for how to address and overcome it.
Yet, ensuring that all Indigenous Australians have educational opportunities that match those of non-Indigenous Australians is central to national aspirations and intergovernmental commitments. At the Education Council meeting of December 2019, policymakers committed to the Alice Springs (Mparntwe) Education Declaration:2
“Australian Governments commit to empowering Aboriginal and Torres Strait Islander students to reach their potential and to ensuring the education community works to ‘close the gap’ for young Aboriginal and Torres Strait Islander peoples.”
Despite this rhetoric, ideology often trumps evidence in many Indigenous affairs, not least in education research and practice.34 For instance, simple acknowledgement of educational gaps is routinely dismissed as perpetuating a so-called ‘deficit narrative’, rather than engaged with constructively to advance policy outcomes. 5
As a result, the gap in outcomes is matched by a gap in policy-relevant education research for policymakers to tap in helping deliver better outcomes. This research paper helps to address this by taking a closer look at the sources and extent of Indigenous educational disadvantage in Australia and proposing options for policymakers to better meet the ambition of truly closing the gap.
There is a well-established education research base studying the drivers of student achievement. Metanalyses show that around 60 per cent of the variation in student achievement is attributed to student and home factors, with the remaining influence largely attributed to school policies (around 10 per cent) and teaching quality (around 30 per cent).6
Studies show that the drivers of student achievement are consistent across contexts — in other words, the
research findings can be effectively generalised to all populations of students. Given that the drivers of student achievement are already well-known, for Indigenous and non-Indigenous students alike, this study is interested not necessarily in the drivers of achievement per se, but the drivers of observed differences in achievement between Australia’s Indigenous and non-Indigenous students. It is this latter analysis that can attribute the factors responsible for the student achievement gap, and how that gap may be reduced. To do so, Australian student record data is analysed to empirically decompose student achievement gaps into relevant factors.
Prima facie analysis of the gap doesn’t provide an accurate picture of educational disadvantage. This is because there are many factors that can determine student achievement — some measurable and some not — which may mean that straight comparisons can hide the true scale and source of the gap.
Because the average Indigenous and non-Indigenous student don’t start with the same ‘endowments’ — such as having differing parental backgrounds, different propensity to live in more regional and remote locations, or schools that differ in size — analysis must observe the effect of difference in endowments, rather than mistakenly assuming all differences are the result of Indigeneity.
For instance, Indigenous children are disproportionately more likely to be located outside major cities and to have parents without university educational backgrounds — two factors with a strong negative correlation to student achievement — but it is important to not conflate differences in achievement with differences in likelihood that children live in different locations or have different parental backgrounds (for further discussion, see the appendix on Empirical Methodology).
A number of data sources are used to further analyse trends in Indigenous educational outcomes, including data related to NAPLAN, international assessments, early development indicators, studies of Australian youth, and Census data.
Introduction
4 | Mind the Gap: Understanding the Indigenous education gap and how to close it
The Closing the Gap process effectively commenced at the December 2007 meeting of the Coalition of Australian Governments (COAG). While initially motivated to achieve more equitable health and life expectancy outcomes, policymakers recognised the need to encompass a wider range of measures — including in education — to deliver meaningful broader improvements in the lives of Indigenous Australians. Importantly, while Closing the Gap represented the first comprehensive, whole-of-government approach to address educational gaps, it was far from the first pledge of its kind. A decade earlier, far more ambitious aspirational targets were committed to by education ministers, but were subsequently abandoned.
By the end of 2008, COAG approved the National Indigenous Reform Agreement (NIRA) along with six ‘Closing the Gap’ targets — including two school education and one early education target (see Table). In May 2014, COAG agreed to a new additional target on school attendance, and in 2015, to extend the original early education target that had since been achieved.
Throughout 2017 and 2018 consultations were carried out to update the Closing the Gap framework, with new draft targets identified. In particular, the new draft targets proposed bolstered measures of student achievement in school — both reducing the proportion of students at the bottom end of the achievement scale and increasing the proportion at the top end. This would bring the targets into closer alignment with the wider key performance measures of schooling used in the annual National Report on Schooling in Australia, prepared by the Australian Curriculum, Assessment, and Reporting Authority (ACARA).
In 2020, a new National Agreement on Closing the Gap was announced, with increased emphasis on partnership with Indigenous peak bodies. In the 2020 report, progress against targets was assessed (since many were due to expire) and the final new targets to be carried forward were announced. In the area of education, all schooling outcome targets were excluded, other than the original attainment target (which was already on track to be met). Instead, a greater emphasis was placed on both (i) post-schooling attainment and participation in work and/or study and (ii) pre-schooling participation and development.
Closing the Gap in education
Mind the Gap: Understanding the Indigenous education gap and how to close it | 5
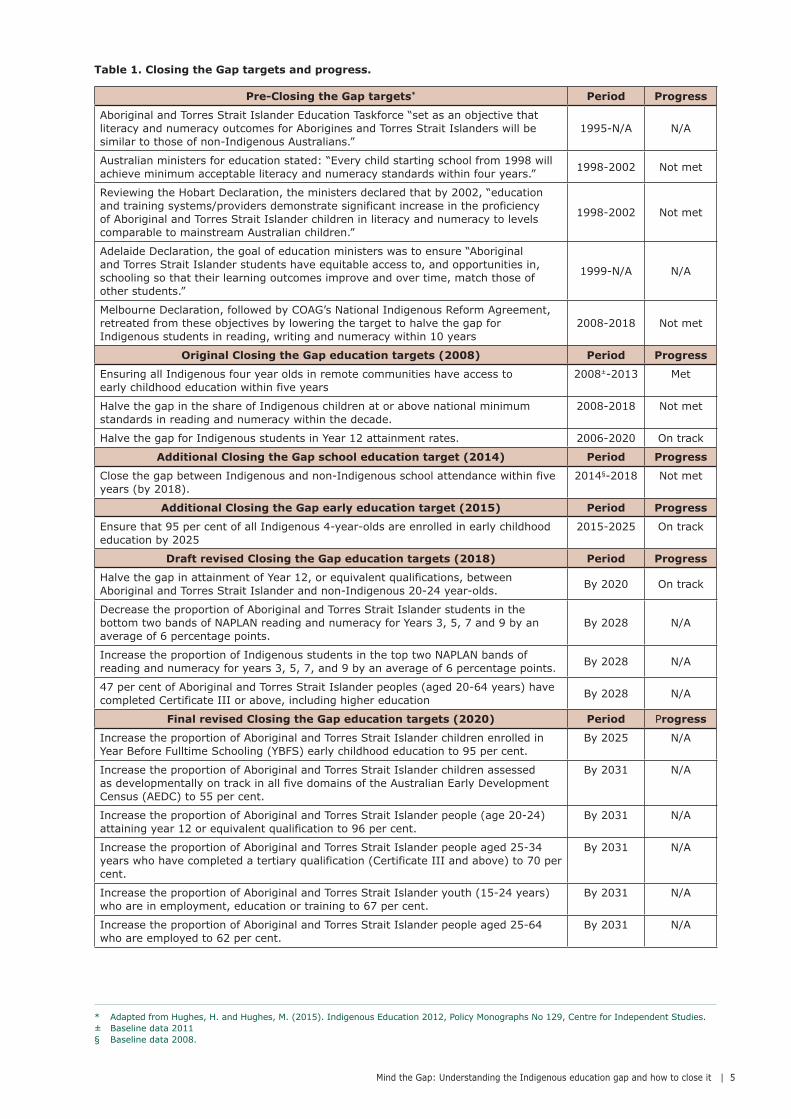
Table 1. Closing the Gap targets and progress.
Pre-Closing the Gap targets* Period Progress
Aboriginal and Torres Strait Islander Education Taskforce “set as an objective that literacy and numeracy outcomes for Aborigines and Torres Strait Islanders will be similar to those of non-Indigenous Australians.”
1995-N/A N/A
Australian ministers for education stated: “Every child starting school from 1998 will achieve minimum acceptable literacy and numeracy standards within four years.” 1998-2002 Not met
Reviewing the Hobart Declaration, the ministers declared that by 2002, “education and training systems/providers demonstrate significant increase in the proficiency of Aboriginal and Torres Strait Islander children in literacy and numeracy to levels comparable to mainstream Australian children.”
1998-2002 Not met
Adelaide Declaration, the goal of education ministers was to ensure “Aboriginal and Torres Strait Islander students have equitable access to, and opportunities in, schooling so that their learning outcomes improve and over time, match those of other students.”
1999-N/A N/A
Melbourne Declaration, followed by COAG’s National Indigenous Reform Agreement, retreated from these objectives by lowering the target to halve the gap for Indigenous students in reading, writing and numeracy within 10 years
2008-2018 Not met
Original Closing the Gap education targets (2008) Period Progress
Ensuring all Indigenous four year olds in remote communities have access to early childhood education within five years
2008±-2013 Met
Halve the gap in the share of Indigenous children at or above national minimum standards in reading and numeracy within the decade.
2008-2018 Not met
Halve the gap for Indigenous students in Year 12 attainment rates. 2006-2020 On track
Additional Closing the Gap school education target (2014) Period Progress
Close the gap between Indigenous and non-Indigenous school attendance within five years (by 2018).
2014§-2018 Not met
Additional Closing the Gap early education target (2015) Period Progress
Ensure that 95 per cent of all Indigenous 4-year-olds are enrolled in early childhood education by 2025
2015-2025 On track
Draft revised Closing the Gap education targets (2018) Period Progress
Halve the gap in attainment of Year 12, or equivalent qualifications, between Aboriginal and Torres Strait Islander and non-Indigenous 20-24 year-olds. By 2020 On track
Decrease the proportion of Aboriginal and Torres Strait Islander students in the bottom two bands of NAPLAN reading and numeracy for Years 3, 5, 7 and 9 by an average of 6 percentage points.
By 2028 N/A
Increase the proportion of Indigenous students in the top two NAPLAN bands of reading and numeracy for years 3, 5, 7, and 9 by an average of 6 percentage points. By 2028 N/A
47 per cent of Aboriginal and Torres Strait Islander peoples (aged 20-64 years) have completed Certificate III or above, including higher education By 2028 N/A
Final revised Closing the Gap education targets (2020) Period Progress
Increase the proportion of Aboriginal and Torres Strait Islander children enrolled in Year Before Fulltime Schooling (YBFS) early childhood education to 95 per cent.
By 2025 N/A
Increase the proportion of Aboriginal and Torres Strait Islander children assessed as developmentally on track in all five domains of the Australian Early Development Census (AEDC) to 55 per cent.
By 2031 N/A
Increase the proportion of Aboriginal and Torres Strait Islander people (age 20-24) attaining year 12 or equivalent qualification to 96 per cent.
By 2031 N/A
Increase the proportion of Aboriginal and Torres Strait Islander people aged 25-34 years who have completed a tertiary qualification (Certificate III and above) to 70 per cent.
By 2031 N/A
Increase the proportion of Aboriginal and Torres Strait Islander youth (15-24 years) who are in employment, education or training to 67 per cent.
By 2031 N/A
Increase the proportion of Aboriginal and Torres Strait Islander people aged 25-64 who are employed to 62 per cent.
By 2031 N/A
* Adapted from Hughes, H. and Hughes, M. (2015). Indigenous Education 2012, Policy Monographs No 129, Centre for Independent Studies.± Baseline data 2011§ Baseline data 2008.
6 | Mind the Gap: Understanding the Indigenous education gap and how to close it
Past schooling targets were largely unmet and new targets are watered downAs shown in Table 1, national targets for schooling have largely been unmet — with achievement and attendance targets not reached, while the attainment target is on track and has been extended into the next decade. This is despite the targets being relatively unambitious, compared to earlier ones.
In the case of the student achievement targets, just 13 of 64 measures were reached. For the attendance target, the gap worsened rather than improved.
The current Closing the Gap targets retain no explicit measures for student achievement and attendance — though still recognising these as a “potential driver” for improved school attainment and post-schooling outcomes.
Moreover, there also are no targets for participation rates in NAPLAN testing. This is problematic because if students are failing to participate in NAPLAN, there is no systematic way to track students’ achievement against national standards of literacy and numeracy. Because the only school target that has been retained is Year 12 attainment, there are no targets applicable throughout the duration of the schooling years.
New schooling targets are focussed on absolute, rather than relative, gainsA lack of progress against Closing the Gap targets doesn’t necessarily mean that absolute improvements weren’t achieved — since many of the original targets were relative (that is, measured according to relative measures compared to non-Indigenous students).
Updated targets, however, have reduced the emphasis on relative achievements — that is, closing the gap — in favour of absolute targets (such as, reaching a specific level). This has both positive and negative consequences.
First, it reduces the arguably perverse nature of relative targets — where ‘improvements’ can
be recorded simply by non-Indigenous students performing worse, rather than Indigenous students recording actual improvements. Absolute gains, not relative ones, ultimately are the marker that matters. This is also important because it focusses on actual achievements, rather than deficits 7 — which is often argued to be better supported from relevant communities.8
However, it’s also true that ‘gap’ targets concentrate attention on common goals between Indigenous and non-Indigenous Australians — which can be a unifying, rather than dividing, force because different standards and expectations are not applied on the basis of Indigeneity . It’s also more practical in terms of identifying appropriate targets for states and territories, because setting a single national measure makes little sense given very different starting points and population compositions. In addition, relative targets are moving, rather than static, which can be more appropriate for longer term indicators (that is, because it accounts for possible external factors).
States and territories have few objective targets to support education improvementsAs states and territories have primary responsibility for schooling, they also set their own policy objectives above and beyond those established in the national commitments. In theory, these objectives mean there are supplementary or intermediate targets relevant to the needs of Indigenous students in respective states and territories.
However, there are relatively few objective, explicit targets set by states and territories. In some cases, there are detailed policy documents that make aspirational and platitudinal statements; while in others, there are relevant measures identified, but targets are not clearly set. In several other cases, such as for Tasmania, targets note (for example) that there will be an ‘increase’ in trained teachers or similar goals, but don’t indicate in a tangible way if this is to keep pace with Indigenous student enrolments.
Mind the Gap: Understanding the Indigenous education gap and how to close it | 7
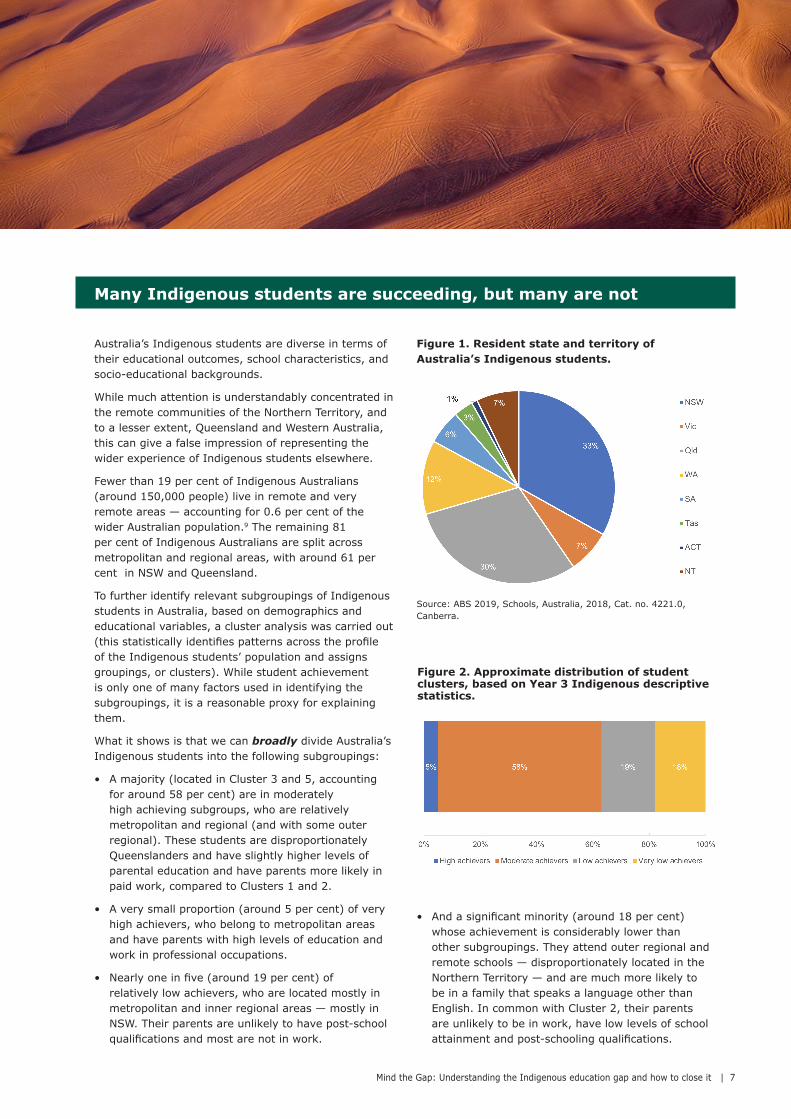
Australia’s Indigenous students are diverse in terms of their educational outcomes, school characteristics, and socio-educational backgrounds.
While much attention is understandably concentrated in the remote communities of the Northern Territory, and to a lesser extent, Queensland and Western Australia, this can give a false impression of representing the wider experience of Indigenous students elsewhere.
Fewer than 19 per cent of Indigenous Australians (around 150,000 people) live in remote and very remote areas — accounting for 0.6 per cent of the wider Australian population.9 The remaining 81 per cent of Indigenous Australians are split across metropolitan and regional areas, with around 61 per cent in NSW and Queensland.
To further identify relevant subgroupings of Indigenous students in Australia, based on demographics and educational variables, a cluster analysis was carried out (this statistically identifies patterns across the profile of the Indigenous students’ population and assigns groupings, or clusters). While student achievement is only one of many factors used in identifying the subgroupings, it is a reasonable proxy for explaining them.
What it shows is that we can broadly divide Australia’s Indigenous students into the following subgroupings:
• A majority (located in Cluster 3 and 5, accounting for around 58 per cent) are in moderately high achieving subgroups, who are relatively metropolitan and regional (and with some outer regional). These students are disproportionately Queenslanders and have slightly higher levels of parental education and have parents more likely in paid work, compared to Clusters 1 and 2.
• A very small proportion (around 5 per cent) of very high achievers, who belong to metropolitan areas and have parents with high levels of education and work in professional occupations.
• Nearly one in five (around 19 per cent) of relatively low achievers, who are located mostly in metropolitan and inner regional areas — mostly in NSW. Their parents are unlikely to have post-school qualifications and most are not in work.
Many Indigenous students are succeeding, but many are not
Figure 2. Approximate distribution of student clusters, based on Year 3 Indigenous descriptive statistics.
• And a significant minority (around 18 per cent) whose achievement is considerably lower than other subgroupings. They attend outer regional and remote schools — disproportionately located in the Northern Territory — and are much more likely to be in a family that speaks a language other than English. In common with Cluster 2, their parents are unlikely to be in work, have low levels of school attainment and post-schooling qualifications.
Figure 1. Resident state and territory of Australia’s Indigenous students.
Source: ABS 2019, Schools, Australia, 2018, Cat. no. 4221.0, Canberra.
8 | Mind the Gap: Understanding the Indigenous education gap and how to close it
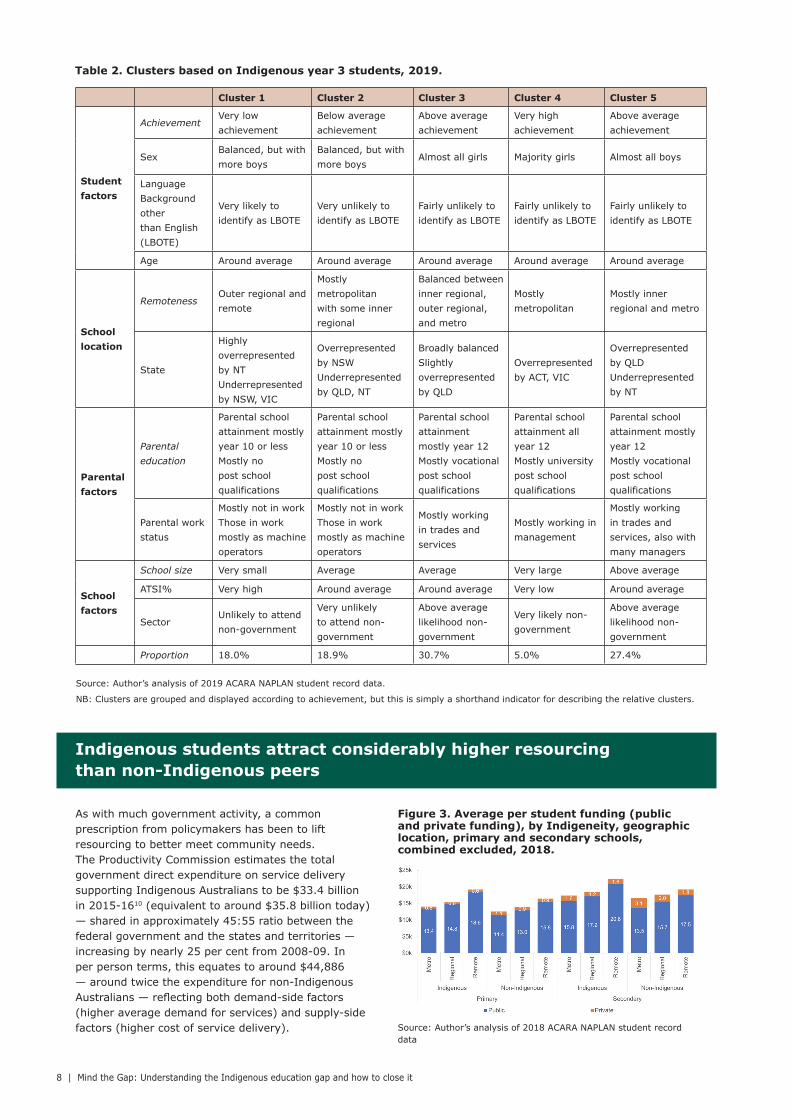
Table 2. Clusters based on Indigenous year 3 students, 2019.
Cluster 1 Cluster 2 Cluster 3 Cluster 4 Cluster 5
Student factors
AchievementVery low achievement
Below average achievement
Above average achievement
Very high achievement
Above average achievement
SexBalanced, but with more boys
Balanced, but with more boys
Almost all girls Majority girls Almost all boys
Language Background other than English (LBOTE)
Very likely to identify as LBOTE
Very unlikely to identify as LBOTE
Fairly unlikely to identify as LBOTE
Fairly unlikely to identify as LBOTE
Fairly unlikely to identify as LBOTE
Age Around average Around average Around average Around average Around average
School location
RemotenessOuter regional and remote
Mostly metropolitan with some inner regional
Balanced between inner regional, outer regional, and metro
Mostly metropolitan
Mostly inner regional and metro
State
Highly overrepresented by NT Underrepresented by NSW, VIC
Overrepresented by NSW Underrepresented by QLD, NT
Broadly balanced Slightly overrepresented by QLD
Overrepresented by ACT, VIC
Overrepresented by QLD Underrepresented by NT
Parental factors
Parental education
Parental school attainment mostly year 10 or less Mostly no post school qualifications
Parental school attainment mostly year 10 or less Mostly no post school qualifications
Parental school attainment mostly year 12 Mostly vocational post school qualifications
Parental school attainment all year 12 Mostly university post school qualifications
Parental school attainment mostly year 12 Mostly vocational post school qualifications
Parental work status
Mostly not in work Those in work mostly as machine operators
Mostly not in work Those in work mostly as machine operators
Mostly working in trades and services
Mostly working in management
Mostly working in trades and services, also with many managers
School factors
School size Very small Average Average Very large Above average
ATSI% Very high Around average Around average Very low Around average
SectorUnlikely to attend non-government
Very unlikely to attend non-government
Above average likelihood non-government
Very likely non-government
Above average likelihood non-government
Proportion 18.0% 18.9% 30.7% 5.0% 27.4%
Indigenous students attract considerably higher resourcing than non-Indigenous peers
As with much government activity, a common prescription from policymakers has been to lift resourcing to better meet community needs. The Productivity Commission estimates the total government direct expenditure on service delivery supporting Indigenous Australians to be $33.4 billion in 2015-1610 (equivalent to around $35.8 billion today) — shared in approximately 45:55 ratio between the federal government and the states and territories — increasing by nearly 25 per cent from 2008-09. In per person terms, this equates to around $44,886 — around twice the expenditure for non-Indigenous Australians — reflecting both demand-side factors (higher average demand for services) and supply-side factors (higher cost of service delivery). Source: Author’s analysis of 2018 ACARA NAPLAN student record
data
Figure 3. Average per student funding (public and private funding), by Indigeneity, geographic location, primary and secondary schools, combined excluded, 2018.
Source: Author’s analysis of 2019 ACARA NAPLAN student record data.
NB: Clusters are grouped and displayed according to achievement, but this is simply a shorthand indicator for describing the relative clusters.
Mind the Gap: Understanding the Indigenous education gap and how to close it | 9
Education expenditure alone directed to Indigenous Australians is around $6.2 billion in 2020 terms — including around $4.3 billion on schooling (though this is likely underestimated because of subsequent changes in school funding arrangements). In per-student terms (based on 2018 data), the average Indigenous students’ school receives around 38 per cent more than non-Indigenous students in public funding ($17,744 compared to $12,860) — and around 18 per cent more in total funding (because parents of non-Indigenous students contribute around 60 per cent higher fees and other contributions).
The highest levels of funding are attracted by schools in remote locations and for combined schools (partly reflecting additional resourcing that comes from a combination of being relatively small and having composite classes). It also partly reflects that there are specific loadings that are attracted based on students’ Indigeneity, and higher propensity to attract socio-educationally disadvantaged and disability loadings. However, increased funding is not always reflected in greater access to teaching resources — indeed, there is very little transparency that funding is ultimately delivered to schools in most need.
The academic achievement gap
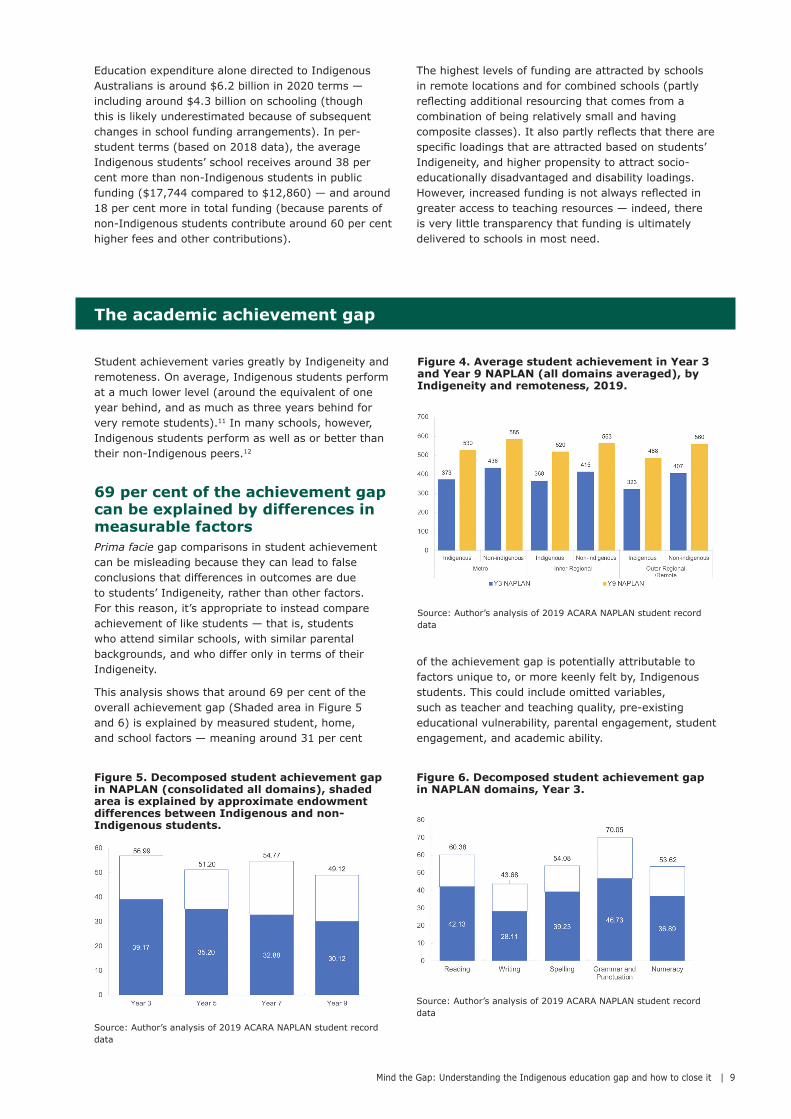
Student achievement varies greatly by Indigeneity and remoteness. On average, Indigenous students perform at a much lower level (around the equivalent of one year behind, and as much as three years behind for very remote students).11 In many schools, however, Indigenous students perform as well as or better than their non-Indigenous peers.12
69 per cent of the achievement gap can be explained by differences in measurable factorsPrima facie gap comparisons in student achievement can be misleading because they can lead to false conclusions that differences in outcomes are due to students’ Indigeneity, rather than other factors. For this reason, it’s appropriate to instead compare achievement of like students — that is, students who attend similar schools, with similar parental backgrounds, and who differ only in terms of their Indigeneity.
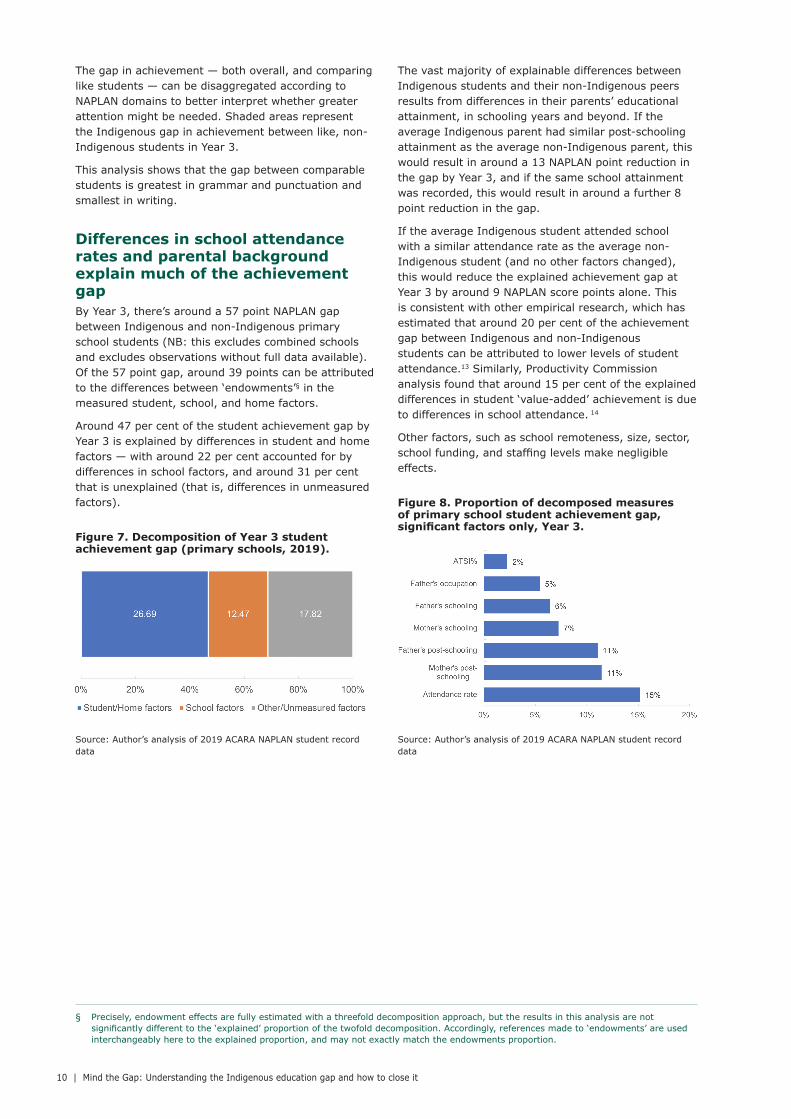
This analysis shows that around 69 per cent of the overall achievement gap (Shaded area in Figure 5 and 6) is explained by measured student, home, and school factors — meaning around 31 per cent
Figure 4. Average student achievement in Year 3 and Year 9 NAPLAN (all domains averaged), by Indigeneity and remoteness, 2019.
Source: Author’s analysis of 2019 ACARA NAPLAN student record data
of the achievement gap is potentially attributable to factors unique to, or more keenly felt by, Indigenous students. This could include omitted variables, such as teacher and teaching quality, pre-existing educational vulnerability, parental engagement, student engagement, and academic ability.
Figure 5. Decomposed student achievement gap in NAPLAN (consolidated all domains), shaded area is explained by approximate endowment differences between Indigenous and non-Indigenous students.
Figure 6. Decomposed student achievement gap in NAPLAN domains, Year 3.
Source: Author’s analysis of 2019 ACARA NAPLAN student record data
Source: Author’s analysis of 2019 ACARA NAPLAN student record data
10 | Mind the Gap: Understanding the Indigenous education gap and how to close it
The gap in achievement — both overall, and comparing like students — can be disaggregated according to NAPLAN domains to better interpret whether greater attention might be needed. Shaded areas represent the Indigenous gap in achievement between like, non-Indigenous students in Year 3.
This analysis shows that the gap between comparable students is greatest in grammar and punctuation and smallest in writing.
Differences in school attendance rates and parental background explain much of the achievement gap By Year 3, there’s around a 57 point NAPLAN gap between Indigenous and non-Indigenous primary school students (NB: this excludes combined schools and excludes observations without full data available). Of the 57 point gap, around 39 points can be attributed to the differences between ‘endowments’§ in the measured student, school, and home factors.
Around 47 per cent of the student achievement gap by Year 3 is explained by differences in student and home factors — with around 22 per cent accounted for by differences in school factors, and around 31 per cent that is unexplained (that is, differences in unmeasured factors).
Figure 7. Decomposition of Year 3 student achievement gap (primary schools, 2019).
Source: Author’s analysis of 2019 ACARA NAPLAN student record data
The vast majority of explainable differences between Indigenous students and their non-Indigenous peers results from differences in their parents’ educational attainment, in schooling years and beyond. If the average Indigenous parent had similar post-schooling attainment as the average non-Indigenous parent, this would result in around a 13 NAPLAN point reduction in the gap by Year 3, and if the same school attainment was recorded, this would result in around a further 8 point reduction in the gap.
If the average Indigenous student attended school with a similar attendance rate as the average non-Indigenous student (and no other factors changed), this would reduce the explained achievement gap at Year 3 by around 9 NAPLAN score points alone. This is consistent with other empirical research, which has estimated that around 20 per cent of the achievement gap between Indigenous and non-Indigenous students can be attributed to lower levels of student attendance.13 Similarly, Productivity Commission analysis found that around 15 per cent of the explained differences in student ‘value-added’ achievement is due to differences in school attendance. 14
Other factors, such as school remoteness, size, sector, school funding, and staffing levels make negligible effects.
Figure 8. Proportion of decomposed measures of primary school student achievement gap, significant factors only, Year 3.
Source: Author’s analysis of 2019 ACARA NAPLAN student record data
§ Precisely, endowment effects are fully estimated with a threefold decomposition approach, but the results in this analysis are not significantly different to the ‘explained’ proportion of the twofold decomposition. Accordingly, references made to ‘endowments’ are used interchangeably here to the explained proportion, and may not exactly match the endowments proportion.

Mind the Gap: Understanding the Indigenous education gap and how to close it | 11
Student achievement gaps are greatest in remote locations and cities, and lowest in regional locationsFurther analysis, based on remoteness and school type, shows that student achievement gaps are greatest in remote areas and in major cities.
Though there is a clear achievement gap, students progress at similar paceDespite the clear gap in achievement, it’s important to note, however, that progress — that is, the gain from one test to the next — is effectively the same between Indigenous and non-Indigenous students (though other research suggests the same isn’t true for very remote students, who make very little progress15). This indicates that, on average, comparable Indigenous students progress at similar pace to their non-Indigenous peers, but they are more likely to start further behind them.
Figure 9. Average student gain in NAPLAN, 2017-2019, by remoteness.
Source: Author’s analysis of 2019 ACARA NAPLAN student record data.
Table 3. Decomposition of measurable, explained differences in Indigenous student achievement in NAPLAN, by remoteness.
Primary Secondary
Metro Regional Remote Metro Regional Remote
Year 3
Explained 33.79 22.43 28.86 - - -
Unexplained 18.75 17.27 25.26 - - -
Total gap 52.54 39.70 54.12 - - -
Unexplained %
36% 43% 47% - - -
Year 5
Explained 31.22 21.26 24.22 - - -
Unexplained 15.13 15.94 24.20 - - -
Total gap 46.35 37.20 48.42 - - -
Unexplained %
33% 43% 50% - - -
Year 7
Explained - - - 30.26 18.71 22.86
Unexplained - - - 21.26 18.28 33.14
Total gap - - - 51.52 37.00 56.00
Unexplained %
- - - 41% 49% 59%
Year 9
Explained - - - 27.61 16.80 19.55
Unexplained - - - 17.10 20.56 23.54
Total gap - - - 44.70 37.36 43.09
Unexplained %
- - - 38% 55% 55%
Avg unexplained %
34% 43% 48% 40% 52% 57%
In short, because Indigenous students progress at similar pace to their non-Indigenous peers, there is no reason they cannot also achieve at the same level. This means that closing the educational gap requires both correcting the disadvantage responsible for the early schooling gap and ensuring there is an accelerated catch-up in achievement during the remaining primary school years.
NB: Totals here are broken down slightly differently than in some other figures in the analysis, so should not be directly compared.
12 | Mind the Gap: Understanding the Indigenous education gap and how to close it
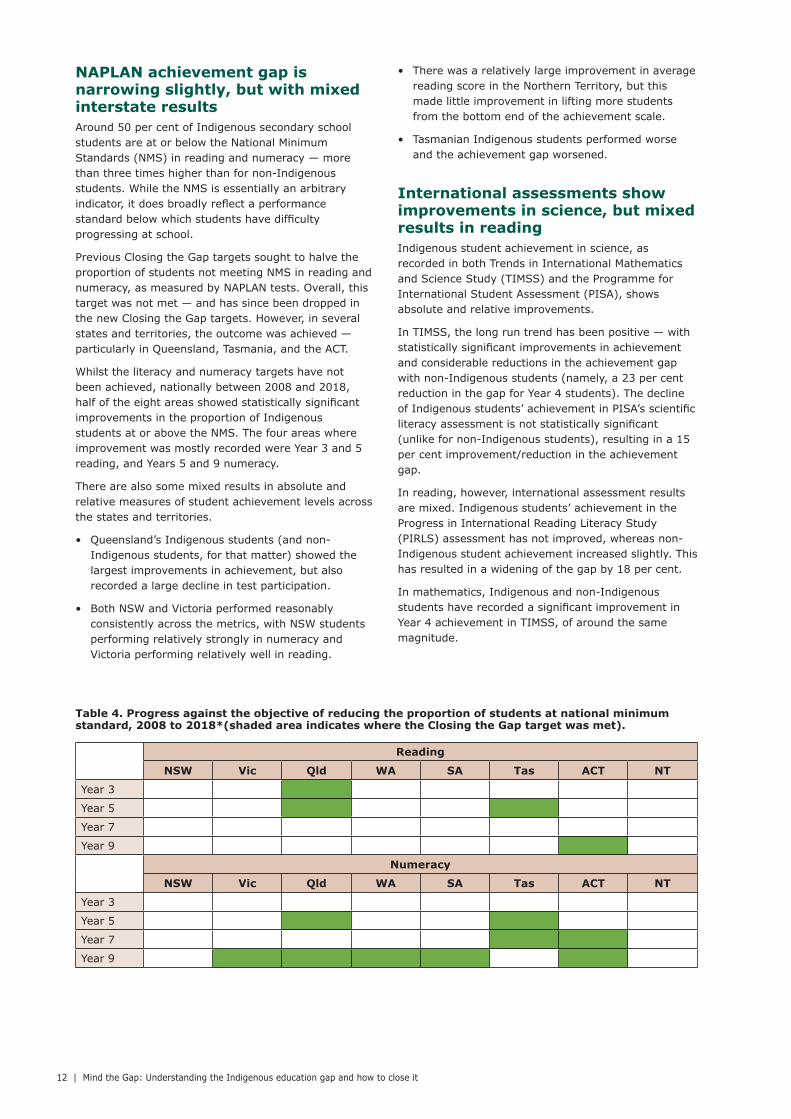
NAPLAN achievement gap is narrowing slightly, but with mixed interstate resultsAround 50 per cent of Indigenous secondary school students are at or below the National Minimum Standards (NMS) in reading and numeracy — more than three times higher than for non-Indigenous students. While the NMS is essentially an arbitrary indicator, it does broadly reflect a performance standard below which students have difficulty progressing at school.
Previous Closing the Gap targets sought to halve the proportion of students not meeting NMS in reading and numeracy, as measured by NAPLAN tests. Overall, this target was not met — and has since been dropped in the new Closing the Gap targets. However, in several states and territories, the outcome was achieved — particularly in Queensland, Tasmania, and the ACT.
Whilst the literacy and numeracy targets have not been achieved, nationally between 2008 and 2018, half of the eight areas showed statistically significant improvements in the proportion of Indigenous students at or above the NMS. The four areas where improvement was mostly recorded were Year 3 and 5 reading, and Years 5 and 9 numeracy.
There are also some mixed results in absolute and relative measures of student achievement levels across the states and territories.
• Queensland’s Indigenous students (and non-Indigenous students, for that matter) showed the largest improvements in achievement, but also recorded a large decline in test participation.
• Both NSW and Victoria performed reasonably consistently across the metrics, with NSW students performing relatively strongly in numeracy and Victoria performing relatively well in reading.
• There was a relatively large improvement in average reading score in the Northern Territory, but this made little improvement in lifting more students from the bottom end of the achievement scale.
• Tasmanian Indigenous students performed worse and the achievement gap worsened.
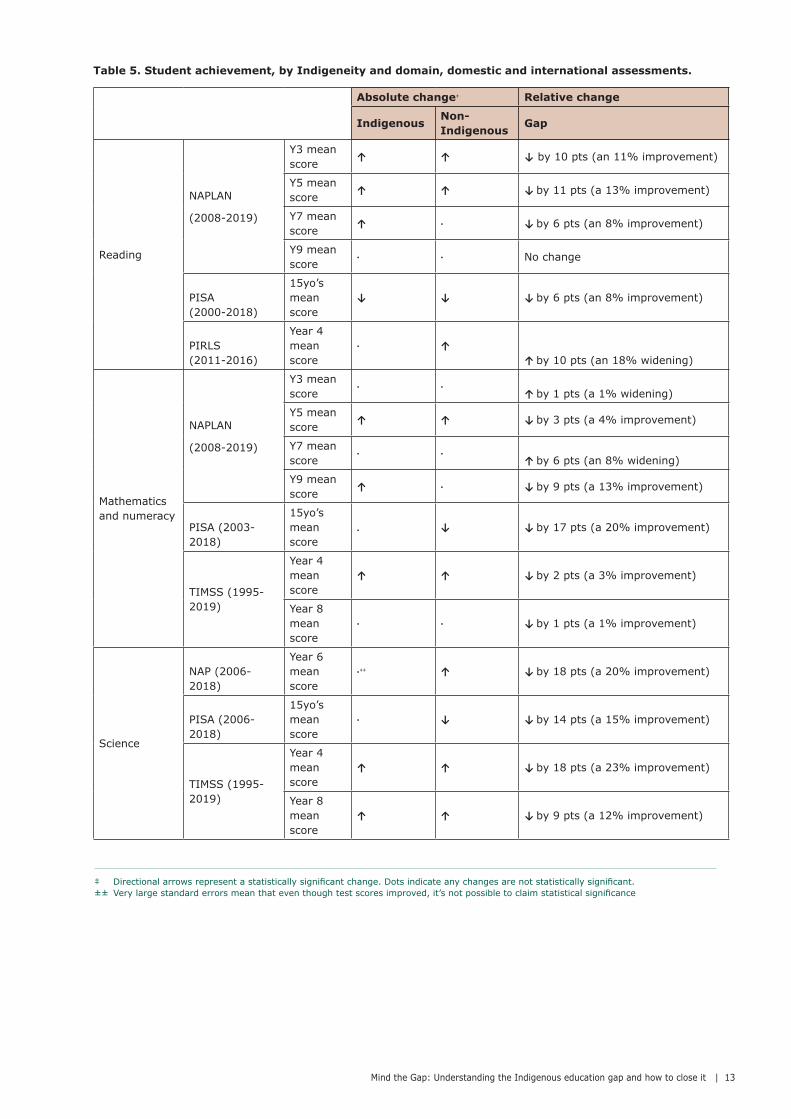
International assessments show improvements in science, but mixed results in readingIndigenous student achievement in science, as recorded in both Trends in International Mathematics and Science Study (TIMSS) and the Programme for International Student Assessment (PISA), shows absolute and relative improvements.
In TIMSS, the long run trend has been positive — with statistically significant improvements in achievement and considerable reductions in the achievement gap with non-Indigenous students (namely, a 23 per cent reduction in the gap for Year 4 students). The decline of Indigenous students’ achievement in PISA’s scientific literacy assessment is not statistically significant (unlike for non-Indigenous students), resulting in a 15 per cent improvement/reduction in the achievement gap.
In reading, however, international assessment results are mixed. Indigenous students’ achievement in the Progress in International Reading Literacy Study (PIRLS) assessment has not improved, whereas non-Indigenous student achievement increased slightly. This has resulted in a widening of the gap by 18 per cent.
In mathematics, Indigenous and non-Indigenous students have recorded a significant improvement in Year 4 achievement in TIMSS, of around the same magnitude.
Table 4. Progress against the objective of reducing the proportion of students at national minimum standard, 2008 to 2018*(shaded area indicates where the Closing the Gap target was met).
Reading
NSW Vic Qld WA SA Tas ACT NT
Year 3
Year 5
Year 7
Year 9
Numeracy
NSW Vic Qld WA SA Tas ACT NT
Year 3
Year 5
Year 7
Year 9
Mind the Gap: Understanding the Indigenous education gap and how to close it | 13
Table 5. Student achievement, by Indigeneity and domain, domestic and international assessments.
Absolute change‡ Relative change
Indigenous Non-
Indigenous Gap
Reading
NAPLAN
(2008-2019)
Y3 mean score
↑ ↑ ↓ by 10 pts (an 11% improvement)
Y5 mean score
↑ ↑ ↓ by 11 pts (a 13% improvement)
Y7 mean score
↑ ∙ ↓ by 6 pts (an 8% improvement)
Y9 mean score
∙ ∙ No change
PISA (2000-2018)
15yo’s mean score
↓ ↓ ↓ by 6 pts (an 8% improvement)
PIRLS (2011-2016)
Year 4 mean score
∙ ↑↑ by 10 pts (an 18% widening)
Mathematics and numeracy
NAPLAN
(2008-2019)
Y3 mean score
∙ ∙↑ by 1 pts (a 1% widening)
Y5 mean score
↑ ↑ ↓ by 3 pts (a 4% improvement)
Y7 mean score
∙ ∙↑ by 6 pts (an 8% widening)
Y9 mean score
↑ ∙ ↓ by 9 pts (a 13% improvement)
PISA (2003-2018)
15yo’s mean score
. ↓ ↓ by 17 pts (a 20% improvement)
TIMSS (1995-2019)
Year 4 mean score
↑ ↑ ↓ by 2 pts (a 3% improvement)
Year 8 mean score
∙ ∙ ↓ by 1 pts (a 1% improvement)
Science
NAP (2006-2018)
Year 6 mean score
∙‡‡ ↑ ↓ by 18 pts (a 20% improvement)
PISA (2006-2018)
15yo’s mean score
∙ ↓ ↓ by 14 pts (a 15% improvement)
TIMSS (1995-2019)
Year 4 mean score
↑ ↑ ↓ by 18 pts (a 23% improvement)
Year 8 mean score
↑ ↑ ↓ by 9 pts (a 12% improvement)
‡ Directional arrows represent a statistically significant change. Dots indicate any changes are not statistically significant.±± Very large standard errors mean that even though test scores improved, it’s not possible to claim statistical significance
14 | Mind the Gap: Understanding the Indigenous education gap and how to close it
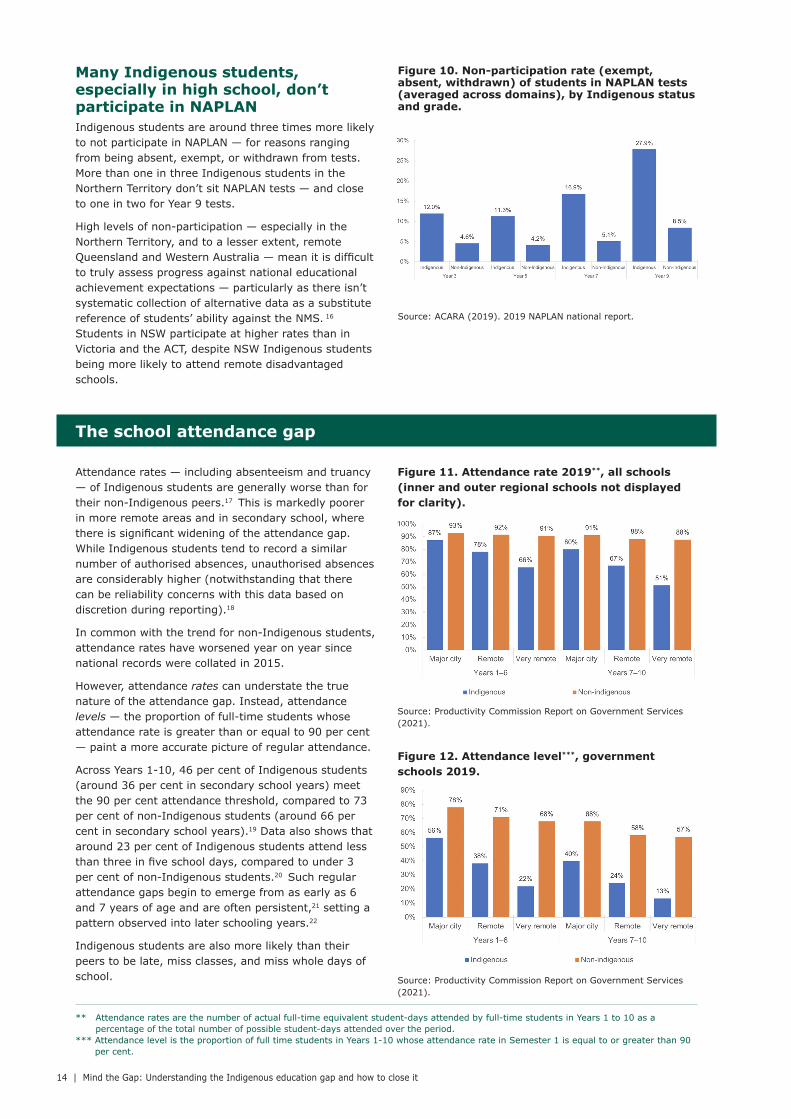
Many Indigenous students, especially in high school, don’t participate in NAPLANIndigenous students are around three times more likely to not participate in NAPLAN — for reasons ranging from being absent, exempt, or withdrawn from tests. More than one in three Indigenous students in the Northern Territory don’t sit NAPLAN tests — and close to one in two for Year 9 tests.
High levels of non-participation — especially in the Northern Territory, and to a lesser extent, remote Queensland and Western Australia — mean it is difficult to truly assess progress against national educational achievement expectations — particularly as there isn’t systematic collection of alternative data as a substitute reference of students’ ability against the NMS. 16 Students in NSW participate at higher rates than in Victoria and the ACT, despite NSW Indigenous students being more likely to attend remote disadvantaged schools.
Figure 10. Non-participation rate (exempt, absent, withdrawn) of students in NAPLAN tests (averaged across domains), by Indigenous status and grade.
The school attendance gap
Source: ACARA (2019). 2019 NAPLAN national report.
Attendance rates — including absenteeism and truancy — of Indigenous students are generally worse than for their non-Indigenous peers.17 This is markedly poorer in more remote areas and in secondary school, where there is significant widening of the attendance gap. While Indigenous students tend to record a similar number of authorised absences, unauthorised absences are considerably higher (notwithstanding that there can be reliability concerns with this data based on discretion during reporting).18
In common with the trend for non-Indigenous students, attendance rates have worsened year on year since national records were collated in 2015.
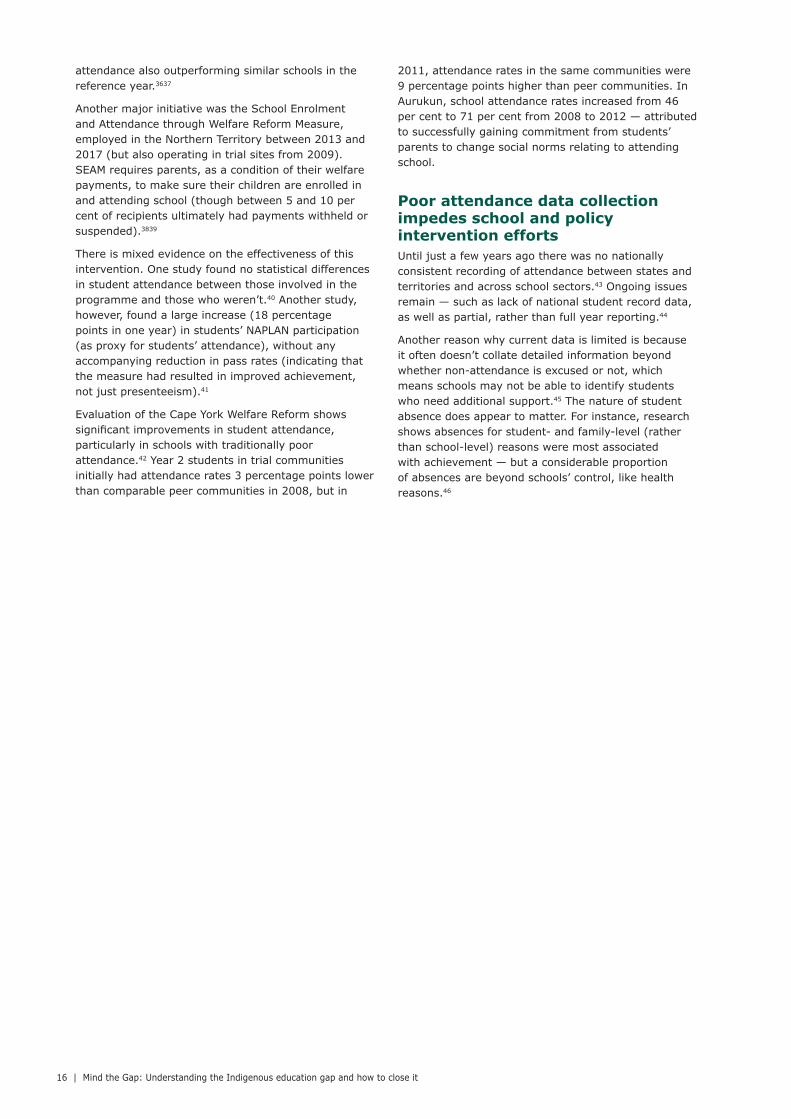
However, attendance rates can understate the true nature of the attendance gap. Instead, attendance levels — the proportion of full-time students whose attendance rate is greater than or equal to 90 per cent — paint a more accurate picture of regular attendance.
Across Years 1-10, 46 per cent of Indigenous students (around 36 per cent in secondary school years) meet the 90 per cent attendance threshold, compared to 73 per cent of non-Indigenous students (around 66 per cent in secondary school years).19 Data also shows that around 23 per cent of Indigenous students attend less than three in five school days, compared to under 3 per cent of non-Indigenous students.20 Such regular attendance gaps begin to emerge from as early as 6 and 7 years of age and are often persistent,21 setting a pattern observed into later schooling years.22
Indigenous students are also more likely than their peers to be late, miss classes, and miss whole days of school.
Figure 11. Attendance rate 2019**, all schools (inner and outer regional schools not displayed for clarity).
Figure 12. Attendance level***, government schools 2019.
Source: Productivity Commission Report on Government Services (2021).
Source: Productivity Commission Report on Government Services (2021).
** Attendance rates are the number of actual full-time equivalent student-days attended by full-time students in Years 1 to 10 as a percentage of the total number of possible student-days attended over the period.
*** Attendance level is the proportion of full time students in Years 1-10 whose attendance rate in Semester 1 is equal to or greater than 90 per cent.

Mind the Gap: Understanding the Indigenous education gap and how to close it | 15
Poor attendance contributes to lower achievementWhile it’s true that increasing attendance alone is not sufficient to improve education outcomes,23 there is a strong relationship between attendance and achievement — with the academic penalty for non-attendance greater for more disadvantaged students.
24 Productivity Commission research finds a significant relationship between the school attendance rates and student achievement for Indigenous students, but not so for non-Indigenous students.25
Other research shows that children who frequently miss more than half a day of school a week (less than 90 per cent attendance) suffer an academic penalty — pointing to the relevance of attendance levels over attendance rates, as discussed earlier.26
The impact of poor attendance has been observed especially in terms of literacy outcomes.27 In particular, poor acquisition of phonological awareness skills and early literacy skills (such as letter recognition and word identification processing) has been associated with irregular attendance. 28
Poor attendance results from complex factorsA number of explanations for Indigenous students’ non-attendance are proposed by researchers and practitioners, including some that are common with non-Indigenous students, such as lack of parental insistence that children go to school, limited teaching quality, and bullying and teasing.29 Others that are more specifically considered with reference to Indigenous students are those related to disaffection with mainstream schooling, high mobility, Indigenous intergroup tensions and community unrest, family pressures, sickness, and cultural obligations surrounding deaths.30
The explanations also often differ according to who is asked. For instance, parents and students tend to stress school-related factors (for example, poor teaching and failure to engage students), while educators tend to stress parental attitudes and the home environment (for example, poor parental attitudes to school).31
In a study of Year 1 school attendance in the Northern Territory, estimates were made for how many days of improved or worsened attendance could be attributed to various social and community factors.32 This found that overcrowded housing resulted in 35 fewer days at school per year, coming from a non-English speaking household resulted in 11 fewer days, and having attended more than one school in a year resulted in attending for nine fewer days. On the other hand, having previously attended more than 30 days of preschool resulted in 18 more days at school per year, having an employed parent or carer resulted in 11 more days, and having a parent or carer who completed year ten (or higher) at school resulted in 10 more days.
Figure 13. Percentage of students who reported the following at least three times in the preceding two weeks (prior to the PISA assessment).
Source: OECD (2019). Programme for International Student Assessment 2018.
A related factor is that Indigenous parents’ expectations of student attendance (such as with self-report measures) appear to differ markedly from observed, actual measures — namely, because in one study of surveyed parents, 96 per cent of those with Indigenous children aged 4-14 reported their child usually attends school.33
Some strategies are working to lift student attendance, but success is multifacetedWhile a range of approaches are employed in schools and systems, direct approaches tend to involve either offering incentives for regular attendance or sanctions for non-attendance, while indirect approaches are centred around upgrading wider teaching practices, which, in turn, may address the source of students’ non-attendance.34
Other related within-school approaches include developing improved transportation linkages (through better coordination with public transport or through staff assisting students to access school), incorporating nutritional programmes, and consistent attendance monitoring (typically with the support of Aboriginal and Torres Strait Islander Education Officers (AIEOs)), while out-of-school approaches include developing partnerships between schools, families, and community, as well as, in some cases, applying punitive consequences on parents for student non-attendance.35
One national policy initiative, in place since 2014, has been the Remote Schools Attendance Strategy (RSAS), operating in 84 schools. The RSAS involves employing staff in schools, along with community members, to work together in implementing community plans to encourage students to attend school. An interim review of the programme indicated improved attendance in around 72 per cent of schools in Queensland and the Northern Territory (though this declined to around 56 per cent of participating schools by 2016), with
16 | Mind the Gap: Understanding the Indigenous education gap and how to close it
attendance also outperforming similar schools in the reference year.3637
Another major initiative was the School Enrolment and Attendance through Welfare Reform Measure, employed in the Northern Territory between 2013 and 2017 (but also operating in trial sites from 2009). SEAM requires parents, as a condition of their welfare payments, to make sure their children are enrolled in and attending school (though between 5 and 10 per cent of recipients ultimately had payments withheld or suspended).3839
There is mixed evidence on the effectiveness of this intervention. One study found no statistical differences in student attendance between those involved in the programme and those who weren’t.40 Another study, however, found a large increase (18 percentage points in one year) in students’ NAPLAN participation (as proxy for students’ attendance), without any accompanying reduction in pass rates (indicating that the measure had resulted in improved achievement, not just presenteeism).41
Evaluation of the Cape York Welfare Reform shows significant improvements in student attendance, particularly in schools with traditionally poor attendance.42 Year 2 students in trial communities initially had attendance rates 3 percentage points lower than comparable peer communities in 2008, but in
2011, attendance rates in the same communities were 9 percentage points higher than peer communities. In Aurukun, school attendance rates increased from 46 per cent to 71 per cent from 2008 to 2012 — attributed to successfully gaining commitment from students’ parents to change social norms relating to attending school.
Poor attendance data collection impedes school and policy intervention effortsUntil just a few years ago there was no nationally consistent recording of attendance between states and territories and across school sectors.43 Ongoing issues remain — such as lack of national student record data, as well as partial, rather than full year reporting.44
Another reason why current data is limited is because it often doesn’t collate detailed information beyond whether non-attendance is excused or not, which means schools may not be able to identify students who need additional support.45 The nature of student absence does appear to matter. For instance, research shows absences for student- and family-level (rather than school-level) reasons were most associated with achievement — but a considerable proportion of absences are beyond schools’ control, like health reasons.46
Mind the Gap: Understanding the Indigenous education gap and how to close it | 17
Analysis in this paper shows that the educational disadvantage faced by Indigenous students is evident at or before Year 3. This points to the need for policy to address the factors contributing to disproportionate underachievement in the early years of school and those prior to students being of school age.
Further provision of early childhood education and care (ECEC; alternatively, pre-school and childcare) has been advanced as a key tool in reducing vulnerabilities of young children and resulting disadvantage — including a Closing the Gap target dedicated to increasing enrolment in ECEC. While Indigenous children have a lower attendance rate in preschool than non-Indigenous children this is effectively accounted for by socioeconomic factors.47
In 2017, around 95 per cent of Indigenous 4-year-olds were enrolled in early childhood education, in line with the target — though only 68 per cent attended preschool for at least 600 hours per year (the recommendation under the National Partnership Agreement on Universal Access to Early Childhood Education).48 However, there can be significant disparity in the quality and effectiveness of ECEC services, as well as varying instructional attention, from predominantly play-based to being explicitly pre-literacy focussed.
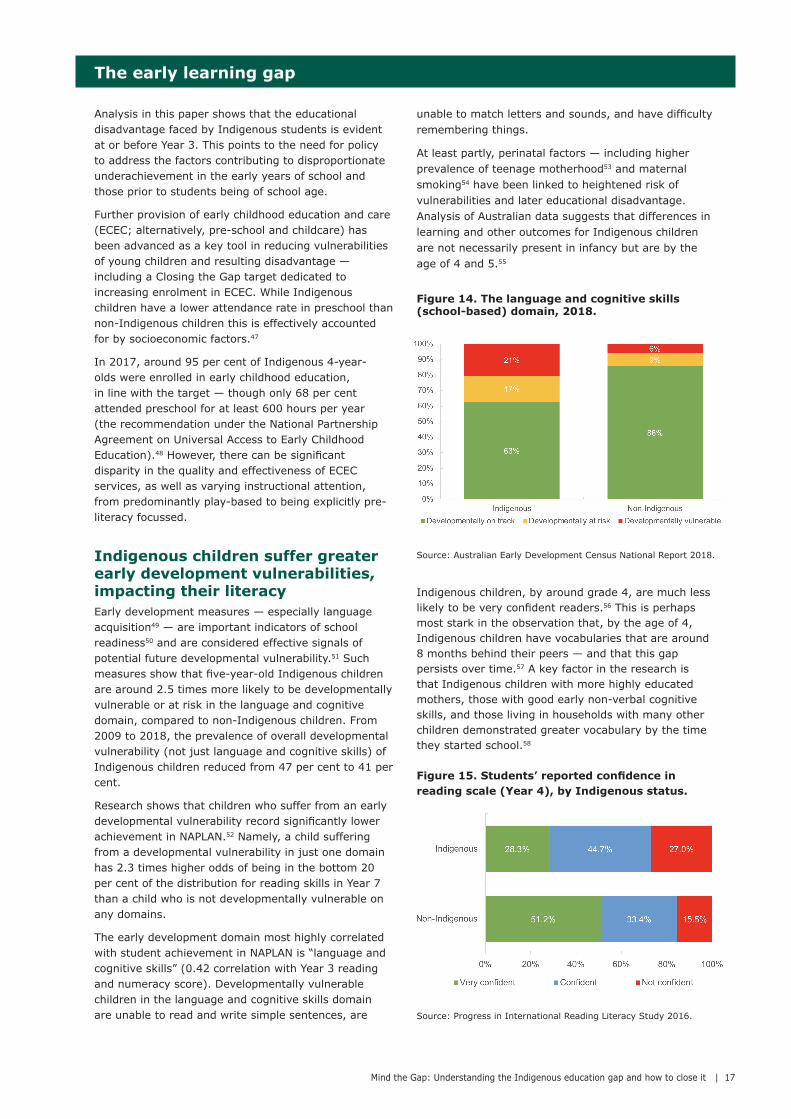
Indigenous children suffer greater early development vulnerabilities, impacting their literacyEarly development measures — especially language acquisition49 — are important indicators of school readiness50 and are considered effective signals of potential future developmental vulnerability.51 Such measures show that five-year-old Indigenous children are around 2.5 times more likely to be developmentally vulnerable or at risk in the language and cognitive domain, compared to non-Indigenous children. From 2009 to 2018, the prevalence of overall developmental vulnerability (not just language and cognitive skills) of Indigenous children reduced from 47 per cent to 41 per cent.
Research shows that children who suffer from an early developmental vulnerability record significantly lower achievement in NAPLAN.52 Namely, a child suffering from a developmental vulnerability in just one domain has 2.3 times higher odds of being in the bottom 20 per cent of the distribution for reading skills in Year 7 than a child who is not developmentally vulnerable on any domains.
The early development domain most highly correlated with student achievement in NAPLAN is “language and cognitive skills” (0.42 correlation with Year 3 reading and numeracy score). Developmentally vulnerable children in the language and cognitive skills domain are unable to read and write simple sentences, are
unable to match letters and sounds, and have difficulty remembering things.
At least partly, perinatal factors — including higher prevalence of teenage motherhood53 and maternal smoking54 have been linked to heightened risk of vulnerabilities and later educational disadvantage. Analysis of Australian data suggests that differences in learning and other outcomes for Indigenous children are not necessarily present in infancy but are by the age of 4 and 5.55
Figure 14. The language and cognitive skills (school-based) domain, 2018.
The early learning gap
Source: Australian Early Development Census National Report 2018.
Indigenous children, by around grade 4, are much less likely to be very confident readers.56 This is perhaps most stark in the observation that, by the age of 4, Indigenous children have vocabularies that are around 8 months behind their peers — and that this gap persists over time.57 A key factor in the research is that Indigenous children with more highly educated mothers, those with good early non-verbal cognitive skills, and those living in households with many other children demonstrated greater vocabulary by the time they started school.58
Figure 15. Students’ reported confidence in reading scale (Year 4), by Indigenous status.
Source: Progress in International Reading Literacy Study 2016.
18 | Mind the Gap: Understanding the Indigenous education gap and how to close it
Literacy proficiency can be adversely impacted by hearing impairments — with Indigenous children with a hearing difficulty scoring around 7 per cent lower in NAPLAN achievement, compared to those without.
59 Over 90 per cent of Indigenous children suffer an episode of otitis media before they are 5 years old,60 with the highest prevalence of this, and related hearing impairment, found in the most disadvantaged socioeconomic areas.61 This has been linked to greater likelihood of hearing difficulty and difficulties with speech, language and learning,62 with an elevated risk of developing long-term speech and language problems for those that experience early-onset otitis media (under 12 months).63
Studies show that Indigenous children suffering from otitis media demonstrate poorer early literacy skills than their peers — particularly poorer phonological awareness, reading and spelling skills.64 The effects of hearing loss are especially complicated for children whose first language isn’t English, because of greater difficulty discriminating between English consonants more than those in the native language.65
In some Western Australian schools with majority-Indigenous populations, soundfield systems have been made available to schools to provide amplification of teachers’ voices and improve students’ capacity to effectively listen in class.66
Some argue that comprehensive developmental screening and early intervention should be made available in remote majority-Indigenous communities, coordinated through preschools and schools. Where available, telehealth services, with the support of educators, have been piloted, supporting children’s speech, language, behavioural needs.67
Despite relatively high attendance in pre-school and childcare, this has little academic benefitThe evidence supporting greater ECEC participation is mixed. Justifications for expanding access to ECEC tend to follow three main claims: “(i) children who attend ECEC perform better in core academic skills than children who do not attend ECEC; (ii) children benefit
more from attending ECEC for more hours per week; and (iii) the longer a child is in ECEC the better.”68
However, Australian research shows there are no overall, longer term academic benefits gained from participating in ECEC. 69 And international research also shows — after accounting for differences amongst participants — no benefit in student cognitive achievement by the end of kindergarten.70
Looking at specific domains, participation in ECEC isn’t associated with short term gains, for Indigenous students, in language, literacy, or mathematical competency, but there may be some gains in acquired vocabulary (at least when measured by the ACER’s Renfrew vocabulary test, which allows children to answer in either English or their first language)71 as well as possible longer-term gains in reading achievement at the age of 8-10. 72
Research has also accounted for the intensity and duration of ECEC — rather than just whether a child attended — and this also indicates no overall academic benefit.73 If anything, Australian research shows that children with more intensive and longer duration in ECEC suffer greater behavioural difficulties.74
To the extent that marginal academic gains are recorded for ECEC, these tend to be attributable only to preschool attendance, but not to childcare — possibly reflecting that the capped hours and adherence to an educational curriculum in preschool is better suited than childcare arrangements.75 Namely, attending preschool may confer some benefits to Indigenous children in terms of cognitive and developmental outcomes, but the number of hours they attend makes no statistical difference. The number of hours spent in childcare is related to poorer cognitive and developmental outcomes.76
In all, the empirical research findings don’t support policy objectives for more and longer (from one to two years) ECEC as a panacea in reducing the educational gap.77 However, there is a strong case that for many students, particularly those at high risk of developmental vulnerability, that a structured ECEC programme that mediates pre-literacy skill deficits could have a considerable impact on students’ future educational outcomes.
Mind the Gap: Understanding the Indigenous education gap and how to close it | 19
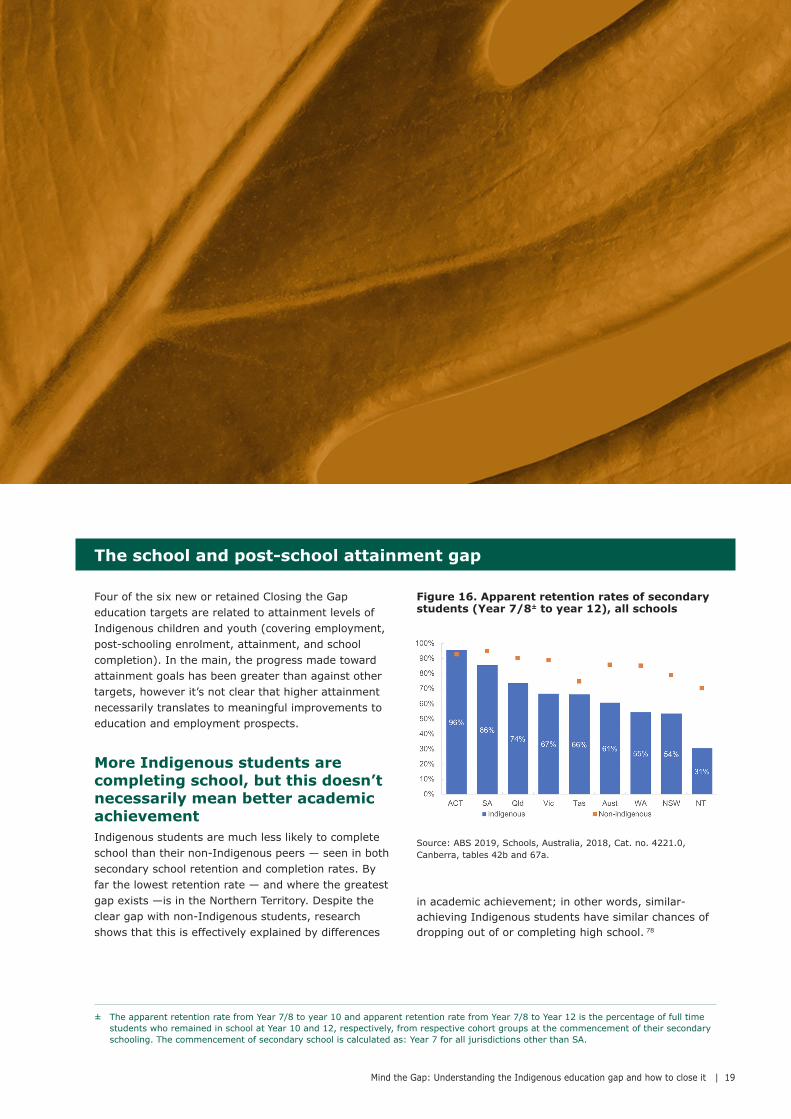
Four of the six new or retained Closing the Gap education targets are related to attainment levels of Indigenous children and youth (covering employment, post-schooling enrolment, attainment, and school completion). In the main, the progress made toward attainment goals has been greater than against other targets, however it’s not clear that higher attainment necessarily translates to meaningful improvements to education and employment prospects.
More Indigenous students are completing school, but this doesn’t necessarily mean better academic achievementIndigenous students are much less likely to complete school than their non-Indigenous peers — seen in both secondary school retention and completion rates. By far the lowest retention rate — and where the greatest gap exists —is in the Northern Territory. Despite the clear gap with non-Indigenous students, research shows that this is effectively explained by differences
Figure 16. Apparent retention rates of secondary students (Year 7/8± to year 12), all schools
The school and post-school attainment gap
± The apparent retention rate from Year 7/8 to year 10 and apparent retention rate from Year 7/8 to Year 12 is the percentage of full time students who remained in school at Year 10 and 12, respectively, from respective cohort groups at the commencement of their secondary schooling. The commencement of secondary school is calculated as: Year 7 for all jurisdictions other than SA.
Source: ABS 2019, Schools, Australia, 2018, Cat. no. 4221.0, Canberra, tables 42b and 67a.
in academic achievement; in other words, similar-achieving Indigenous students have similar chances of dropping out of or completing high school. 78
20 | Mind the Gap: Understanding the Indigenous education gap and how to close it
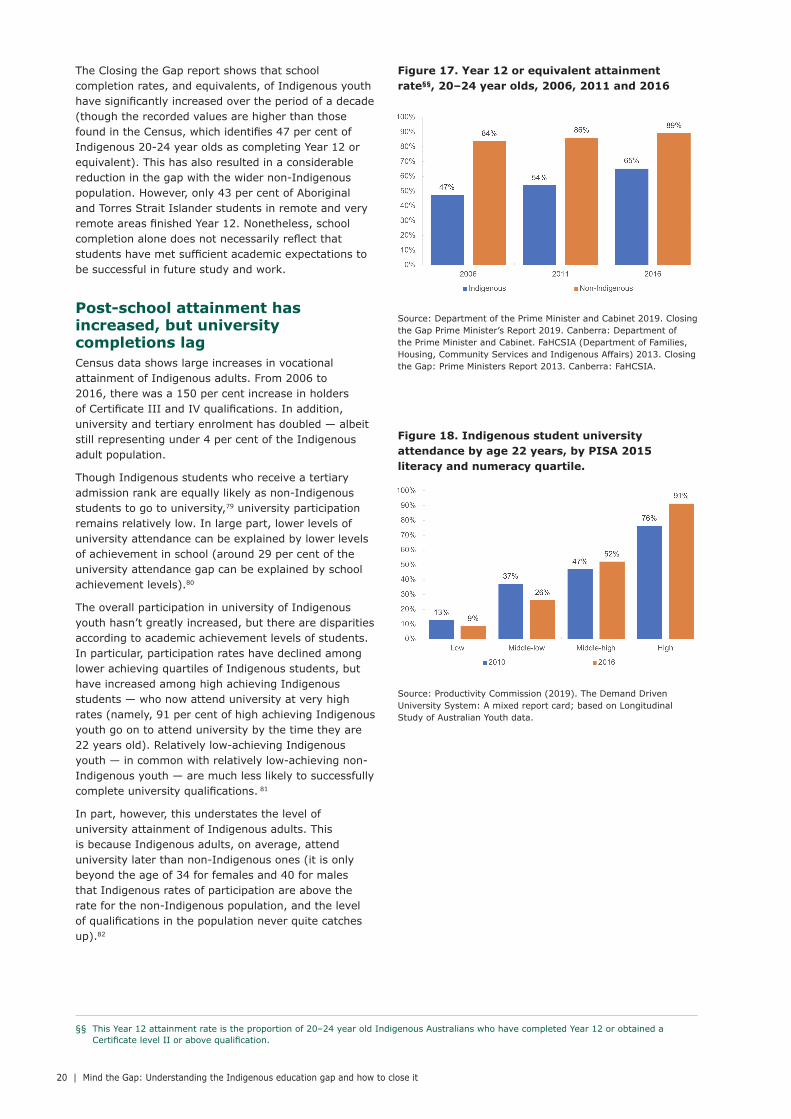
The Closing the Gap report shows that school completion rates, and equivalents, of Indigenous youth have significantly increased over the period of a decade (though the recorded values are higher than those found in the Census, which identifies 47 per cent of Indigenous 20-24 year olds as completing Year 12 or equivalent). This has also resulted in a considerable reduction in the gap with the wider non-Indigenous population. However, only 43 per cent of Aboriginal and Torres Strait Islander students in remote and very remote areas finished Year 12. Nonetheless, school completion alone does not necessarily reflect that students have met sufficient academic expectations to be successful in future study and work.
Post-school attainment has increased, but university completions lagCensus data shows large increases in vocational attainment of Indigenous adults. From 2006 to 2016, there was a 150 per cent increase in holders of Certificate III and IV qualifications. In addition, university and tertiary enrolment has doubled — albeit still representing under 4 per cent of the Indigenous adult population.
Though Indigenous students who receive a tertiary admission rank are equally likely as non-Indigenous students to go to university,79 university participation remains relatively low. In large part, lower levels of university attendance can be explained by lower levels of achievement in school (around 29 per cent of the university attendance gap can be explained by school achievement levels).80
The overall participation in university of Indigenous youth hasn’t greatly increased, but there are disparities according to academic achievement levels of students. In particular, participation rates have declined among lower achieving quartiles of Indigenous students, but have increased among high achieving Indigenous students — who now attend university at very high rates (namely, 91 per cent of high achieving Indigenous youth go on to attend university by the time they are 22 years old). Relatively low-achieving Indigenous youth — in common with relatively low-achieving non-Indigenous youth — are much less likely to successfully complete university qualifications. 81
In part, however, this understates the level of university attainment of Indigenous adults. This is because Indigenous adults, on average, attend university later than non-Indigenous ones (it is only beyond the age of 34 for females and 40 for males that Indigenous rates of participation are above the rate for the non-Indigenous population, and the level of qualifications in the population never quite catches up).82
§§ This Year 12 attainment rate is the proportion of 20–24 year old Indigenous Australians who have completed Year 12 or obtained a Certificate level II or above qualification.
Figure 17. Year 12 or equivalent attainment rate§§, 20–24 year olds, 2006, 2011 and 2016
Figure 18. Indigenous student university attendance by age 22 years, by PISA 2015 literacy and numeracy quartile.
Source: Department of the Prime Minister and Cabinet 2019. Closing the Gap Prime Minister’s Report 2019. Canberra: Department of the Prime Minister and Cabinet. FaHCSIA (Department of Families, Housing, Community Services and Indigenous Affairs) 2013. Closing the Gap: Prime Ministers Report 2013. Canberra: FaHCSIA.
Source: Productivity Commission (2019). The Demand Driven University System: A mixed report card; based on Longitudinal Study of Australian Youth data.
Mind the Gap: Understanding the Indigenous education gap and how to close it | 21
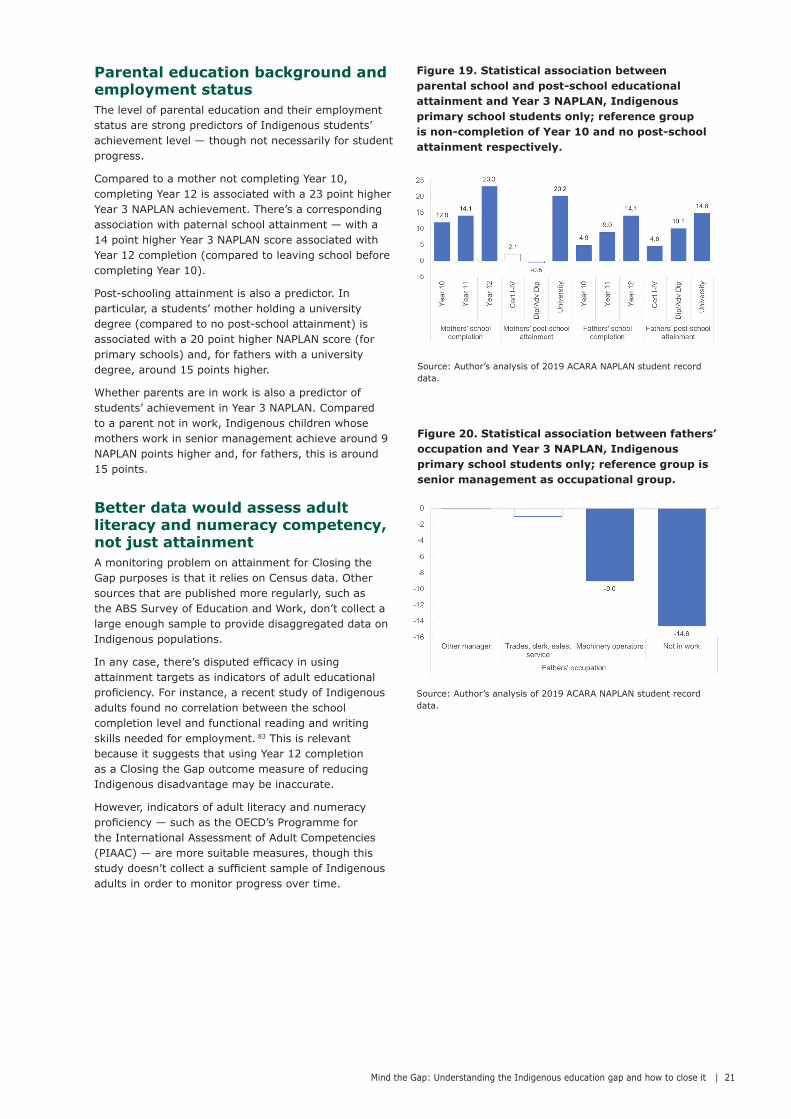
Parental education background and employment statusThe level of parental education and their employment status are strong predictors of Indigenous students’ achievement level — though not necessarily for student progress.
Compared to a mother not completing Year 10, completing Year 12 is associated with a 23 point higher Year 3 NAPLAN achievement. There’s a corresponding association with paternal school attainment — with a 14 point higher Year 3 NAPLAN score associated with Year 12 completion (compared to leaving school before completing Year 10).
Post-schooling attainment is also a predictor. In particular, a students’ mother holding a university degree (compared to no post-school attainment) is associated with a 20 point higher NAPLAN score (for primary schools) and, for fathers with a university degree, around 15 points higher.
Whether parents are in work is also a predictor of students’ achievement in Year 3 NAPLAN. Compared to a parent not in work, Indigenous children whose mothers work in senior management achieve around 9 NAPLAN points higher and, for fathers, this is around 15 points.
Better data would assess adult literacy and numeracy competency, not just attainmentA monitoring problem on attainment for Closing the Gap purposes is that it relies on Census data. Other sources that are published more regularly, such as the ABS Survey of Education and Work, don’t collect a large enough sample to provide disaggregated data on Indigenous populations.
In any case, there’s disputed efficacy in using attainment targets as indicators of adult educational proficiency. For instance, a recent study of Indigenous adults found no correlation between the school completion level and functional reading and writing skills needed for employment. 83 This is relevant because it suggests that using Year 12 completion as a Closing the Gap outcome measure of reducing Indigenous disadvantage may be inaccurate.
However, indicators of adult literacy and numeracy proficiency — such as the OECD’s Programme for the International Assessment of Adult Competencies (PIAAC) — are more suitable measures, though this study doesn’t collect a sufficient sample of Indigenous adults in order to monitor progress over time.
Figure 19. Statistical association between parental school and post-school educational attainment and Year 3 NAPLAN, Indigenous primary school students only; reference group is non-completion of Year 10 and no post-school attainment respectively.
Source: Author’s analysis of 2019 ACARA NAPLAN student record data.
Figure 20. Statistical association between fathers’ occupation and Year 3 NAPLAN, Indigenous primary school students only; reference group is senior management as occupational group.
Source: Author’s analysis of 2019 ACARA NAPLAN student record data.
22 | Mind the Gap: Understanding the Indigenous education gap and how to close it
Closing the Gap targets should directly measure and target student achievement, attendance, and test participationCurrent Closing the Gap targets for education don’t explicitly focus on the essential measures for schooling that will improve outcomes. For instance, targeting increased school completion rates may not necessarily translate to improved literacy and numeracy of Indigenous school leavers, nor greater post-schooling education and employment opportunities. It may instead lead to perverse, unintended outcomes.
Policymakers should reintroduce explicit targets to reduce the gap in student achievement. Benchmarking of system-wide NAPLAN student achievement for metropolitan and regional students should be against proficiency standards — as used in the NAP sample assessments and international assessments — rather than against the National Minimum Standards (NMS). Proficiency standards are agreed to be ‘challenging but reasonable’ and reflective of students demonstrating more than the minimal skills expected for their year level. An appropriate interim benchmark for remote students is against the National Minimum Standards, particularly in the Northern Territory. The NMS reflect students’ ability to demonstrate basic knowledge and understanding needed to function at their year level.
This research has shown that school attendance is the single greatest school-level factor in reducing the student achievement gap between Indigenous and non-Indigenous students in Year 3. It also shows that in most schools, Indigenous students are much less likely to attend 9 out of 10 school days. Policymakers should reintroduce an explicit attendance level target, with an objective of at least 60 per cent of Indigenous
students in cities and regional areas attending 9 out of 10 school days, and a target of at least 50 per cent in remote areas.
The most educationally vulnerable children are disproportionately those who don’t sit NAPLAN at all. Without participation in NAPLAN, there is no systematic indicator of students’ achievement against national expectations. This can be particularly problematic for some remote Indigenous children as they are disproportionately likely to change schools, meaning there may be a lack of continuity in addressing educational needs. Policymakers should introduce a NAPLAN test participation target of Indigenous students of at least 90 per cent in all domains and year levels.
Catch-up targets should be set by school systems to accelerate progress of Indigenous studentsNational Closing the Gap targets alone can be far removed from the work of systems, schools, and educators. For this reason, targets should be better integrated with those of school systems, with explicit targets — reflecting that systems can be in vastly different positions — for Indigenous students’ achievement, attendance, and NAPLAN test participation.
This research shows that Indigenous students, on average, progress at around the same pace as their non-Indigenous peers. However, they start considerably behind them — meaning there’s no evidence these students, by and large, are catching up.
Every school system should express targets for catch-up to reflect that Indigenous students will be required to progress at faster rates. This is a reasonable
Implications for policymakers
Mind the Gap: Understanding the Indigenous education gap and how to close it | 23
expectation, given that Indigenous students typically attract around 38 per cent more funding that non-Indigenous students, and that there are already isolated examples of schools delivering catch-up. Many non-Indigenous students from disadvantaged backgrounds demonstrate considerable catch-up in the Year 3 to Year 5 period, but this is not systematically being replicated for Indigenous students. Targets should relate to current achievement, not longer-term, future aspirational objectives.
The catch-up targets for school systems should be informed by an objective that the average Indigenous student achieve at around the same level, by Year 5, as a comparable (similarly socio-educationally advantaged) non-Indigenous Australian student. This research suggests this requires an average increase in student progress (Year 3 to Year 5) of at least 15 NAPLAN points in metropolitan and regional schools, and around 25 points in remote schools, compared to what is currently being achieved. This means an increase in Indigenous student gain of 28 per cent in metropolitan schools, 20 per cent in regional schools, and 31 per cent in remote schools. In addition, this research shows that closing the school attendance gap alone would reduce the achievement gap by around 9 points.
School systems would benefit from further integrating and aligning targets to the school-level, such as through accountability measures like the School Success Model being piloted in NSW (which involves target setting, tailored support to schools, professional learning and rich data analysis).
An additional objective for majority-Indigenous schools should be to record at least 50 per cent of students making above average progress across NAPLAN domains (compared to similarly advantaged and similar starting score students). This statistic is now published by ACARA and reported on the MySchool website to assist in transparency and accessibility for comparative purposes.
A suite of measures should help inform progress against catch-up targets, particularly in majority-Indigenous schoolsStudent achievement gaps are clearly present from Year 3 or earlier. In addition to increasing the learning progress of those students who start behind their peers through catch-up targets, it’s necessary for schools to reduce this initial gap by mediating early literacy deficits.
Schools’ ability to reduce the early literacy gap can be limited because some students present to school with considerable pre-existing language and cognitive difficulties. Policy interventions that help identify and remediate early language deficits, such as the Year 1 Phonics Screening Check, can assist in early intervention, in combination with schools’ use of early development indicators, Progressive Achievement Test results, and in-class practice.
Policymakers should also consider the feasibility of adopting wider and nationally-consistent school readiness indicators (including assessment of basic pre-literacy skills) at the end of kindergarten to further assist in identifying students who require additional support before advancing into Year 1.
While it’s true that in some of Australia’s lowest performing schools (disproportionately those that are remote majority-Indigenous schools), NAPLAN may not necessarily be the most suitable assessment for some students, the adaptive testing facility of the online assessment platform may mediate some of the past concerns with the pen and paper standardised assessment.
Literacy deficits for some Indigenous children from a non-English speaking background may be contributing to an overstatement of the achievement gap in numeracy. In order to assess whether language barriers are significantly contributing to mismeasurement of numeracy capabilities, it is recommended that ACARA work with a small sample of priority schools in administering the Year 5 numeracy NAPLAN assessment in local Indigenous language (where a suitable consensus can be established for an appropriate alternative to English). The trial should be limited to assessing whether students’ numeracy, compared to similar ability students, varies according to the language that the numeracy assessment is taken in. It should not be considered as an option for the literacy domains, as these explicitly are designed to reflect all Australian students’ literacy capability in English.
There is little evidence that higher use of childcare alone will deliver academic improvements, though there is some evidence that greater access to high-quality, structured pre-school programmes could improve early literacy, and improve future school attendance moderately.
Effective school attendance strategies should be shared and replicatedClosing the school attendance gap between Indigenous and non-Indigenous students would reduce the achievement gap by around 9 NAPLAN points by Year 3. This is by far the greatest measured school-level factor contributing to the achievement gap.
To date, there is limited, generalisable evidence on effective policy and school practices for sustained improvements in student attendance. This reflects a combination of poor data availability, relatively few macro policies to evaluate, and also that there appears to be important locally-specific contexts explaining relative success of strategies. Nonetheless, better highlighting and explaining cases of success could help schools and systems replicate approaches as applicable to them.
There are some isolated cases of majority-Indigenous schools recording consistently high student attendance. For instance, the attendance rate at the Coen school in
24 | Mind the Gap: Understanding the Indigenous education gap and how to close it
the Cape York Aboriginal Australian Academy is in line with the Queensland state average and recorded an attendance level of 53 per cent — the highest of any remote majority-Indigenous school in Australia.84
There is some evidence that national policy efforts in recent years — including those involving related welfare reform measures — may assist increasing student attendance in some especially disadvantaged communities, but such interventions should be properly targeted and may not be suitable in all contexts.
The independent Australian Education Research Organisation (AERO) should collate and evaluate the strategies of Australia’s relatively high attendance majority-Indigenous schools to investigate sources of success. This analysis could be informed by case studies from relevant schools that are part of the RSAS.
Support the sharing of successful instructional practice and scale up effective initiativesThere is evidence of isolated cases of success in majority-Indigenous schools and of Indigenous students achieving significant academic catch-up. However, there is limited translation and sharing of successful practice and there are few opportunities to scale up successful approaches.
This gap was recently observed by the NSW Productivity Commission in its recommendation that AERO prioritise research on the elements of best-practice teaching for Indigenous students. Further fieldwork that highlights common practices and school policies of the highest performing majority-Indigenous schools would also provide an opportunity to share important knowledge.
Potentially scalable initiatives should include evidence-based instructional programmes in schools, models for improving professional development, and effective pre-literacy programmes in preschools (including those with explicit literacy approaches).
Appoint an Indigenous Education CommissionerThe 2019 Napthine Review recommended the appointment of a Regional Education Commissioner, with a wide mandate, but this posting has not been filled. Given the considerable policy need in addressing the educational disadvantage faced across Australia’s majority-Indigenous schools, a related, or substitute, appointment of an Indigenous Education Commissioner is warranted.
Intervention is also justified due to the federal government’s significant financial contribution made across the suite of Indigenous Affairs programmes and leadership in addressing disadvantage of Indigenous Australians.
The Commissioner should report to the federal Education Minister, and coordinate activities with states and territories and system authorities. Potential responsibilities include:
• Investigating and evaluating the demonstrated efficacy of initiatives operating in majority-Indigenous schools that should be scaled up. The remit of initiatives should include evidence-based instructional programmes in schools, models for improving professional development, and effective pre-literacy programmes in preschools.
• Negotiating system catch-up targets and monitoring progress.
• Monitoring the allocation of existing funding arrangements and activity against relevant reform directions as specified in National School Reform Agreements.
• Exploring opportunities to enhance resource sharing, including cross-sectoral school collaboration, as well as sharing of effective whole-of-community support approaches.
• Reporting on the teacher workforce needs of communities and identifying opportunities to better utilise local Indigenous workforces in supporting teachers’ work.
• Reporting on the state of unmet needs for students suffering from learning difficulties and other special needs in majority-Indigenous schools.
Improved collection and use of data can help with workforce planning, effects of early childhood interventions, student attendance, and adult competenciesDespite improvements in recent years in data collection and availability, many issues remain.
There is limited access and usage of databases of national teacher workforce capabilities and resources — which inhibits planning and resource allocation.
The Australian Teacher Workforce Data (ATWD) was conceived from the Teacher Education Ministerial Advisory Group recommendations, which handed down its recommendations in 2014, and was endorsed by Education Council in 2016. Secure access to the ATWD should be made available for research purposes following release of the Second Wave of data, scheduled to be in mid-2021. The AERO should collaborate with researchers to prioritise policy-relevant research to help inform policymakers on teacher workforce planning.
In order to assist research efforts, national student attendance data — both attendance rates and levels — should be linked to student-record data under ACARA’s
Mind the Gap: Understanding the Indigenous education gap and how to close it | 25
management. In addition to this, Australian Early Development Census (AEDC) should be incorporated into existing student record data. To further improve the longitudinal value of research data, whether children attended ECEC and the relevant quality rating (against the ACEQA National Quality Framework) of their primary ECEC provider should be also be collated in a nationally consistent database.
To improve monitoring of adult competencies in literacy and numeracy, policymakers should increase the sample of Indigenous adults in the Second Wave (2022-2023) of the OECD’s Programme for the International Assessment of Adult Competencies (PIAAC). This is relevant because higher levels of parental competencies in literacy and numeracy is related to higher levels of parental involvement and engagement in schooling, which could assist in delivering further improvements in students’ educational outcomes.
Fully closing student achievement gaps will require long term improvements in adult education and employmentThis paper finds that a significant proportion of the observed student achievement gap is explained by differences in parental employment and education. Around half of the student achievement gap in Year 3 would be closed if Indigenous children’s parents had similar education and employment levels of non-Indigenous peers.
For this reason, wider efforts to improve access to education and employment for Indigenous adults is expected to translate into improved student achievement in schools over the long term. Recent CIS research has provided a potential framework to support economic development — with both business and job creation — of regional and remote majority-Indigenous communities.85 To provide sustainable and meaningful employment, market economies need to be supported in Indigenous communities (particularly small business development), rather than local economies being propped up by government service delivery alone.
Previous Closing the Gap school completion targets appear to be translating into increased retention of students in school. However, additional efforts will be required by systems and schools to ensure that senior secondary schooling is of value to students, and not just perfunctory.
By and large, there does not appear to be considerable remaining concerns for access to post-schooling opportunities, including for university-ready Indigenous school leavers — though non-completion of university remains an issue. 91 per cent of high-achieving Indigenous youth are attending or have completed university, but post-schooling outcomes for Indigenous youth and adults in more remote areas remains
limited. While vocational attainment has increased considerably, policymakers should assess the suitability of some qualifications in generating sustainable employment and identify strategies to increase attainment of higher vocational qualifications (not just introductory certificates).
While Closing the Gap targets to lift post-schooling attainment and employment are warranted given the findings of this research, more precise measures could also be used. This is because post-school attainment is only a proxy for adult literacy and numeracy competency. Moreover, given that this analysis primarily identifies university completion as an important factor, school completion measures should, in time, instead set targets about the awarding of Australian Tertiary Admission Rank (ATAR).
Review the suitability of the national school funding formula in meeting Indigenous students’ needsMore transparent data on school funding should be made available and should remain a focus of the national and respective state Audit Offices. Namely, it should be clear how much each of the relevant formula loadings contribute to the increased funding for Indigenous students.
The National School Resourcing Board should investigate how appropriately the school resourcing standard (the national school funding formula) translates to resources and needs of majority-Indigenous schools.
Among the items to consider are:
• the feasibility of removing the Indigeneity loading and replacing it with more accurate recording of other loadings;
• reassessment of the Language Background other than English loading so that the needs of non-English speaking Indigenous learners are assigned a commensurate rate to the higher servicing cost and need;
• assess whether student disability needs are currently being accurately reflected in school resourcing;
• whether the unit costs are correctly recorded — namely, because school enrolments and attendees on Census counting days can be considerably mismatched in some majority-Indigenous schools;
• the feasibility of including a specific loading to reflect the cost of boarding school students (evaluated with respect to current suitability of measures within the welfare system, namely the ABSTUDY payment), in relevant schools.
26 | Mind the Gap: Understanding the Indigenous education gap and how to close it
The aspiration to ‘close the gap’ and overcome Indigenous educational disadvantage is a laudable goal for Australia’s policymakers.
This paper’s analysis shows there remain considerable obstacles to redressing student achievement gaps that are present by Year 3 of schooling. It’s also clear that in the most disadvantaged communities, addressing education outcomes requires coordinated policy interventions spanning economic development, community engagement, health and social policy.
But there are some reasons for optimism, too. Despite concerns for declining standards and quality of teaching
and teachers across Australia, there are also many highly capable educators and practitioners delivering impactful practice and with the expertise needed to reverse poor educational outcomes.
Isolated examples of highly effective interventions and programmes that are helping students to overcome the educational odds can be scaled up by policymakers. Elevating existing practices, rather than necessarily reinventing the wheel, will be a marker for success in the years to come.
Conclusion
Empirical methodology
All Australian school students (other than those with special exemptions or parental permissions) are required to participate in the National Assessment Program for Literacy and Numeracy (NAPLAN). NAPLAN assesses students at specific year levels (Year 3, Year 5, Year 7, and Year 9) in the domains of: grammar and punctuation; reading; spelling; writing; and numeracy (and all but the writing assessment are marked dichotomously). Test scores range from 0 to 1000 and are designed to support comparisons both across individual schools and over time. Scores are constructed so that any given score represents the same level of achievement over time, by scaling scores within a given domain so that it is consistent across schooling levels in that particular year. For the purpose of this analysis, test scores are largely averaged at relevant Year 3 level across all domains.
All Australian primary schools are included in the analysis (though where marked, combined and secondary schools are also included). Special schools are excluded because of relatively high NAPLAN exemption rates and due to differences in student intakes and staffing makeup, compared to mainstream schools. Combined schools are omitted from some parts of econometric modelling because datasets provide only school-level aggregation of variables — including funding levels — which vary based on whether students are enrolled in primary or secondary schooling years.
In the main, the key dependent variable of interest is the Year 3 composite NAPLAN score. While many econometric studies in education are typically interested in value-added modelling and similar (often to test the effect of an intervention or assess factors impacting on particular student achievement), this isn’t necessarily the case for this study. Instead, analysis
for this paper’s purposes is more descriptive and better suited to cross-sectional data, without any lagged variables (particularly for the decomposition analysis).
The Australian Curriculum, Assessment, and Reporting Authority (ACARA) collates deidentified student record data (achievement in NAPLAN, students’ age at time of assessment, sex, Indigenous status, language background status, and whether they have changed school within two years). Some parental demographic data is also collated and matched to students’ data (parents’ occupational status, schooling attainment, and non-school attainment).
While schools are not identified, it is possible to impute approximate school size based on number of enrolments, participation rate in NAPLAN assessments, an approximate school parental education index, proportion of student population that records Indigenous status, and the same for Language background other than English status. For additional school level factors, a customised data request was fulfilled by ACARA. This includes school attendance rate, attendance level, FTE teachers, FTE non-teachers, school type (primary, secondary, combined, special), recurrent public funding per student (2018 values), and private funding per student (including fees and other contributions).
Three methods were used throughout this report. Cluster analysis is used to assist in identifying and classifying subgroupings within the Indigenous student record data. Oaxaca-Blinder decomposition is used to empirically decompose the student achievement gap between Indigenous and non-Indigenous students. And mixed effect modelling is used to empirically estimate the statistical association between relevant explanatory variables of interest.
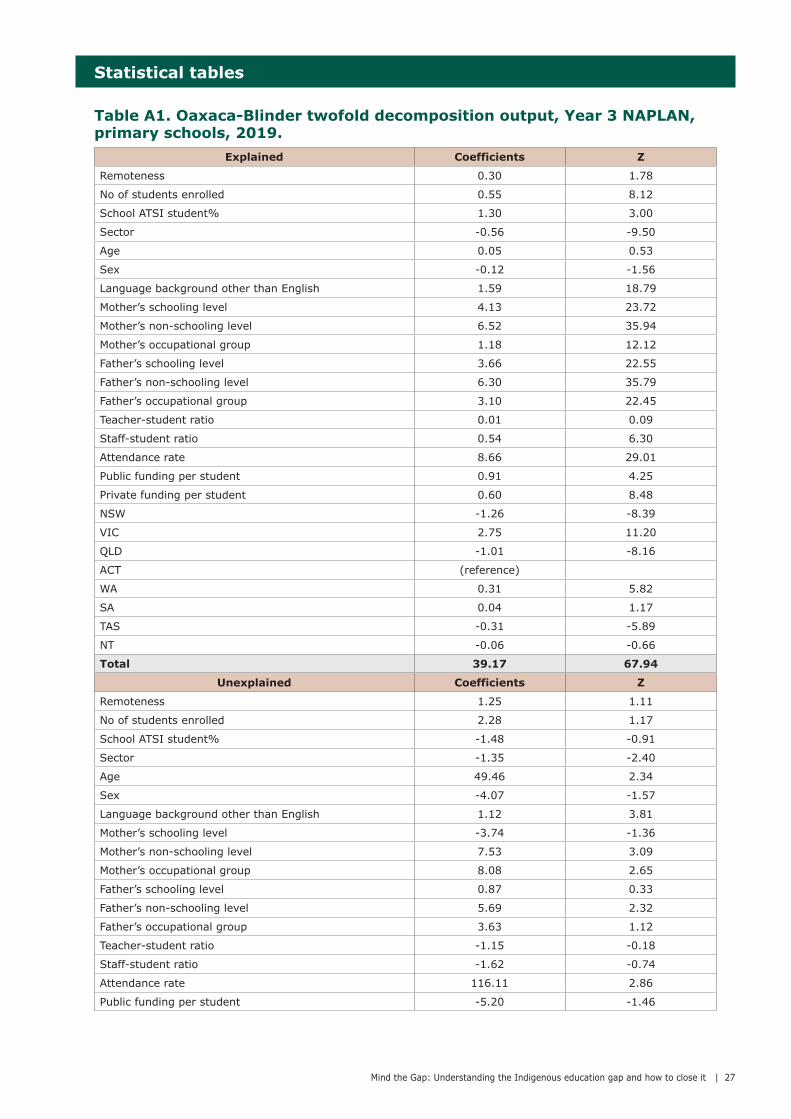
Mind the Gap: Understanding the Indigenous education gap and how to close it | 27
Table A1. Oaxaca-Blinder twofold decomposition output, Year 3 NAPLAN, primary schools, 2019.
Explained Coefficients Z
Remoteness 0.30 1.78
No of students enrolled 0.55 8.12
School ATSI student% 1.30 3.00
Sector -0.56 -9.50
Age 0.05 0.53
Sex -0.12 -1.56
Language background other than English 1.59 18.79
Mother’s schooling level 4.13 23.72
Mother’s non-schooling level 6.52 35.94
Mother’s occupational group 1.18 12.12
Father’s schooling level 3.66 22.55
Father’s non-schooling level 6.30 35.79
Father’s occupational group 3.10 22.45
Teacher-student ratio 0.01 0.09
Staff-student ratio 0.54 6.30
Attendance rate 8.66 29.01
Public funding per student 0.91 4.25
Private funding per student 0.60 8.48
NSW -1.26 -8.39
VIC 2.75 11.20
QLD -1.01 -8.16
ACT (reference)
WA 0.31 5.82
SA 0.04 1.17
TAS -0.31 -5.89
NT -0.06 -0.66
Total 39.17 67.94
Unexplained Coefficients Z
Remoteness 1.25 1.11
No of students enrolled 2.28 1.17
School ATSI student% -1.48 -0.91
Sector -1.35 -2.40
Age 49.46 2.34
Sex -4.07 -1.57
Language background other than English 1.12 3.81
Mother’s schooling level -3.74 -1.36
Mother’s non-schooling level 7.53 3.09
Mother’s occupational group 8.08 2.65
Father’s schooling level 0.87 0.33
Father’s non-schooling level 5.69 2.32
Father’s occupational group 3.63 1.12
Teacher-student ratio -1.15 -0.18
Staff-student ratio -1.62 -0.74
Attendance rate 116.11 2.86
Public funding per student -5.20 -1.46
Statistical tables
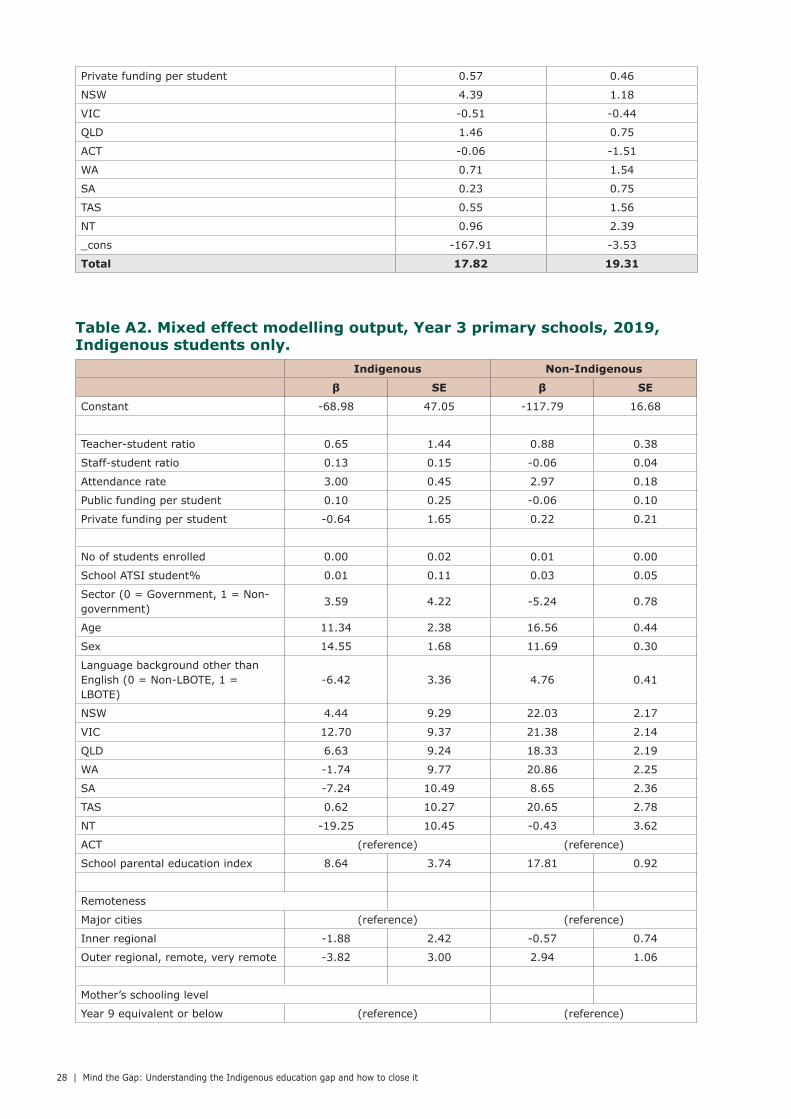
28 | Mind the Gap: Understanding the Indigenous education gap and how to close it
Private funding per student 0.57 0.46
NSW 4.39 1.18
VIC -0.51 -0.44
QLD 1.46 0.75
ACT -0.06 -1.51
WA 0.71 1.54
SA 0.23 0.75
TAS 0.55 1.56
NT 0.96 2.39
_cons -167.91 -3.53
Total 17.82 19.31
Table A2. Mixed effect modelling output, Year 3 primary schools, 2019, Indigenous students only. Indigenous Non-Indigenous
β SE β SE
Constant -68.98 47.05 -117.79 16.68
Teacher-student ratio 0.65 1.44 0.88 0.38
Staff-student ratio 0.13 0.15 -0.06 0.04
Attendance rate 3.00 0.45 2.97 0.18
Public funding per student 0.10 0.25 -0.06 0.10
Private funding per student -0.64 1.65 0.22 0.21
No of students enrolled 0.00 0.02 0.01 0.00
School ATSI student% 0.01 0.11 0.03 0.05
Sector (0 = Government, 1 = Non-government)
3.59 4.22 -5.24 0.78
Age 11.34 2.38 16.56 0.44
Sex 14.55 1.68 11.69 0.30
Language background other than English (0 = Non-LBOTE, 1 = LBOTE)
-6.42 3.36 4.76 0.41
NSW 4.44 9.29 22.03 2.17
VIC 12.70 9.37 21.38 2.14
QLD 6.63 9.24 18.33 2.19
WA -1.74 9.77 20.86 2.25
SA -7.24 10.49 8.65 2.36
TAS 0.62 10.27 20.65 2.78
NT -19.25 10.45 -0.43 3.62
ACT (reference) (reference)
School parental education index 8.64 3.74 17.81 0.92
Remoteness
Major cities (reference) (reference)
Inner regional -1.88 2.42 -0.57 0.74
Outer regional, remote, very remote -3.82 3.00 2.94 1.06
Mother’s schooling level
Year 9 equivalent or below (reference) (reference)
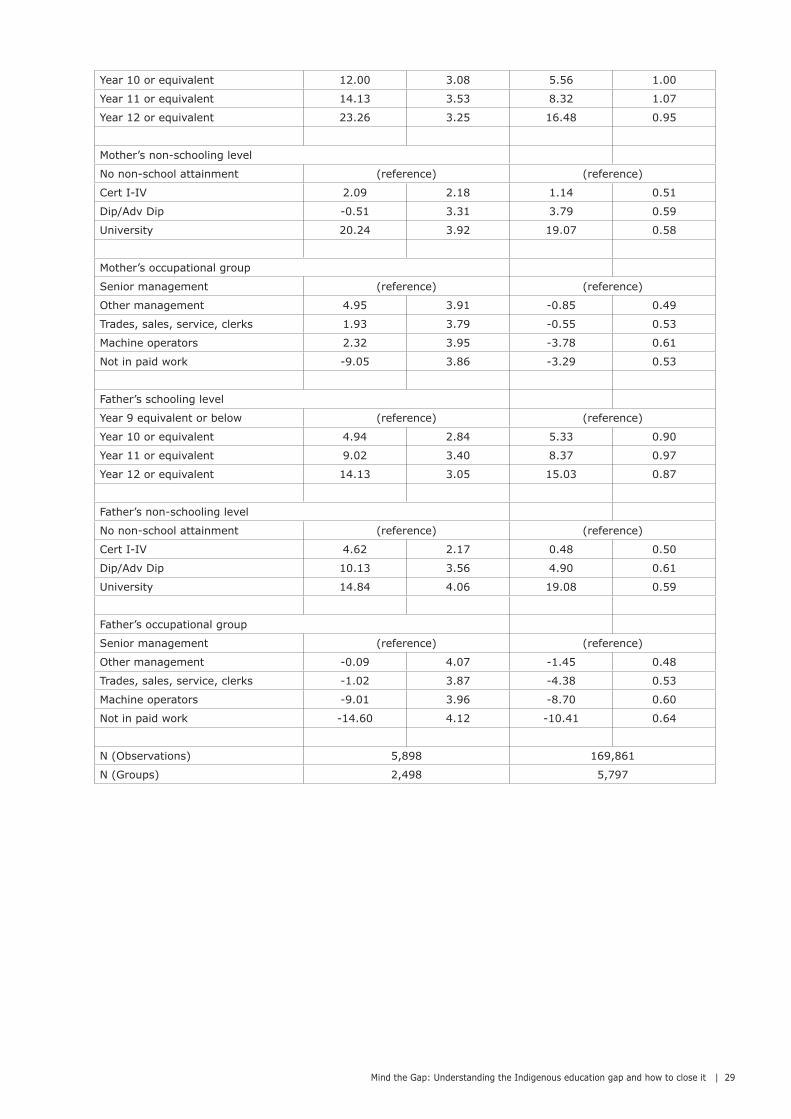
Mind the Gap: Understanding the Indigenous education gap and how to close it | 29
Year 10 or equivalent 12.00 3.08 5.56 1.00
Year 11 or equivalent 14.13 3.53 8.32 1.07
Year 12 or equivalent 23.26 3.25 16.48 0.95
Mother’s non-schooling level
No non-school attainment (reference) (reference)
Cert I-IV 2.09 2.18 1.14 0.51
Dip/Adv Dip -0.51 3.31 3.79 0.59
University 20.24 3.92 19.07 0.58
Mother’s occupational group
Senior management (reference) (reference)
Other management 4.95 3.91 -0.85 0.49
Trades, sales, service, clerks 1.93 3.79 -0.55 0.53
Machine operators 2.32 3.95 -3.78 0.61
Not in paid work -9.05 3.86 -3.29 0.53
Father’s schooling level
Year 9 equivalent or below (reference) (reference)
Year 10 or equivalent 4.94 2.84 5.33 0.90
Year 11 or equivalent 9.02 3.40 8.37 0.97
Year 12 or equivalent 14.13 3.05 15.03 0.87
Father’s non-schooling level
No non-school attainment (reference) (reference)
Cert I-IV 4.62 2.17 0.48 0.50
Dip/Adv Dip 10.13 3.56 4.90 0.61
University 14.84 4.06 19.08 0.59
Father’s occupational group
Senior management (reference) (reference)
Other management -0.09 4.07 -1.45 0.48
Trades, sales, service, clerks -1.02 3.87 -4.38 0.53
Machine operators -9.01 3.96 -8.70 0.60
Not in paid work -14.60 4.12 -10.41 0.64
N (Observations) 5,898 169,861
N (Groups) 2,498 5,797
30 | Mind the Gap: Understanding the Indigenous education gap and how to close it
1 Thomson, S.; De Bortoli, L.; Underwood, C.; and Schmid, M. (2019). Programme for International Student Assessment 2018: Reporting Australia’s results Volume 1 Student Performance, Australian Council for Educational Research.
2 Education Council (2019). Alice Springs (Mparntwe) Education Declaration.
3 Mellor, S. and Corrigan, M. (2004). The Case for Change : A review of contemporary research on Indigenous education outcomes, Australian Education Review, No. 47, Australian Council for Educational Research.
4 Griffiths, A. (2011). The Components of Best-Practice Indigenous Education: A Comparative Review, Australian Journal of Indigenous Education, 40, pp. 69–80.
5 Mellor, S. and Corrigan, M. (2004). The Case for Change : A review of contemporary research on Indigenous education outcomes, Australian Education Review, No. 47, Australian Council for Educational Research.
6 Hattie, J. (2003). Teachers make a difference: What is the research evidence? Paper presented at the Building Teacher Quality: What does the research tell us ACER Research Conference, Melbourne, Australia. Retrieved from http://research.acer.edu.au/research_conference_2003/4/ .
7 Armstrong, S.; Buckley, S.; Lonsdale, M. et al (2012). Starting school: A strengths-based approach towards Aboriginal and Torres Strait Islander children, Report prepared by the Australian Council for Educational Research, for the Department of Families, Housing, Community Services and Indigenous Affairs.
8 Craven, R. G.; Ryan, R. M.; Mooney, J. et al (2016). Toward a positive psychology of Indigenous thriving and reciprocal research partnership model, Contemporary Educational Psychology, 47, pp. 32-43.
9 Australian Institute of Health and Welfare, Profile of Indigenous Australians 2019.
10 SCRGSP (Steering Committee for the Review of Government Service Provision) (2017). 2017 Indigenous Expenditure Report, Productivity Commission, Canberra.
11 Goss, P. (2017). Attachment to Submission to Review of Regional, Rural and Remote Education, Grattan Institute.
12 Purdie, N.; Reid, K.; and Buckley, S. (2011). Literacy learning: what works for young Indigenous students? Lessons from the longitudinal literacy and numeracy study for Indigenous students, Literacy Learning: The Middle Years, 19 (3), pp. 51-59.
13 Biddle, N. (2014). Developing a Behavioural Model of School Attendance: Policy Implications for Indigenous Children and Youth, CAEPR, ANU.
14 Productivity Commission (2016). Indigenous Primary School Achievement, Commission Research Paper, Canberra.
15 Goss, P. (2017). Attachment to Submission to Review of Regional, Rural and Remote Education, Grattan Institute.
16 Lee, P.; Fasoli, L.; Ford, L. et al (2014). Indigenous Kids and Schooling in the Northern Territory An introductory overview and brief history of Aboriginal Education in the Northern Territory, Batchelor Institute of Indigenous Tertiary Education, Northern Territory.
17 Bourke, C.; Rigby, K.; and Burden, J. (2000). Better practice in school attendance: Improving the school attendance of Indigenous students, Canberra : Department of Education, Training and Youth Affairs.
18 Hafekost, K.; Lawrence, D.; O’Leary, C. et al. (2017). Maternal alcohol use disorder and child school attendance outcomes for non-Indigenous and Indigenous children in Western Australia: a population cohort record linkage study, BMJ Open, 7, e015650.
19 Productivity Commission (2021). Report on Government Services.
20 Hafekost, K.; Lawrence, D.; O’Leary, C. et al. (2017). Maternal alcohol use disorder and child school attendance outcomes for non-Indigenous and Indigenous children in Western Australia: a population cohort record linkage study, BMJ Open, 7, e015650.
21 Daraganova, G.; Mullan, K.; and Edwards, B. (2014). Attendance in primary school: factors and consequences, Occasional Paper No. 51, Department of Social Services, Canberra.
22 Mellor, S. and Corrigan, M. (2004). The Case for Change : A review of contemporary research on Indigenous education outcomes, Australian Education Review, No. 47, Australian Council for Educational Research.
23 Barnes, B.K. (2004). Aboriginal Student Attendance: Including the results of the Review’s survey of attendance. Sydney: NSW Aboriginal Education Review.
24 Hancock, K. J.; Shepherd, C. C. J.; Lawrence, D.; and Zubrick, S. R. (2013). Student attendance and educational outcomes: Every day counts. Report for the Department of Education, Employment and Workplace Relations, Canberra.
25 Productivity Commission (2016). Indigenous Primary School Achievement, Commission Research Paper, Canberra.
26 Zubrick, S.R.; Silburn, S. R.; De Maio, J. A.; Shepherd, C.; Griffin, J. A.; Dalby, R. B.; Mitrou, F. G.; Lawrence, D. M.; Hayward, C.; Pearson, G.; Milroy, H.; and Cox, M. J. (2006). The Western Australian Aboriginal Child Health Survey: Improving the Educational Experiences of Aboriginal Children and Young People. Perth: Curtin University of Technology and Telethon Institute for Child Health Research.
Endnotes
Mind the Gap: Understanding the Indigenous education gap and how to close it | 31
27 Ehrich, J.; Wolgemuth, J. R.; Helmer, J. et al (2010). Attendance, performance and the acquisition of early literacy skills: A comparison of Indigenous and non-Indigenous school children, Australian Journal of Learning Difficulties, 15 (2), pp. 131-149.
28 Ehrich, J.;.Wolgemuth, J. R.; Helmer, J.; Oteng, G.; Lea, T.; Bartlett, C.; Smith, H.; and Emmett, S. (2010). Attendance, performance and the acquisition of early literacy skills: A comparison of Indigenous and non-Indigenous school children, Australian Journal of Learning Difficulties, 15 (2), pp. 131-149.
29 Department of Employment and Workplace Relations (DEWR) (2006). Halls Creek Engaging Families trial, February–July 2006 — evaluation report. Canberra, ACT, Australia.
30 Groome, H. and Hamilton, A. (1995). Meeting the educational needs of Aboriginal adolescents. National Board of Employment, Education and Training, Commissioned Report No.35. Canberra, ACT: Australian Government Publishing Service.
31 Purdie, N. and Buckley, S. (2010). School attendance and retention of Indigenous Australian students, e Closing the Gap Clearinghouse, Issues Paper No. 1, Australian Institute of Health and Welfare and Australian Institute of Family Studies.
32 Silburn S., Guthridge S., McKenzie J., Su J-Y., He V., Haste S. (2018). Early Pathways to School Learning: Lessons from the NT Data Linkage Study. Darwin: Menzies School of Health Research.
33 Australian Bureau of Statistics (2017). National Aboriginal and Torres Strait Islander Social Survey, 2014-15, Cat 4714.0.
34 Purdie, N. and Buckley, S. (2010). School attendance and retention of Indigenous Australian students, e Closing the Gap Clearinghouse, Issues Paper No. 1, Australian Institute of Health and Welfare and Australian Institute of Family Studies.
35 Australian Institute of Health and Welfare (2014). SCSEEC successful school attendance strategies evidence-based project: Summary report. Canberra: AIHW.
36 Department of Prime Minister and Cabinet (2015). Remote School Attendance Strategy: Interim Progress Report, October 2015, Australian Government, Canberra.
37 Department of Prime Minister and Cabinet (2018). Understanding family perspectives of school attendance in remote communities, Australian Government, Canberra.
38 Goldstein, R. and Hiscox, M. J. (2019). School Enrolment and Attendance Measure Randomized Controlled Trial: Full Report, National Indigenous Australians Agency, Australian Government.
39 Australian National Audit Office (ANAO) (2104). The Improving School Enrolment and Attendance through Welfare Reform Measure, Performance Audit 2013-14.
40 Goldstein, R. and Hiscox, M. J. (2019). School Enrolment and Attendance Measure Randomized Controlled Trial: Full Report, National Indigenous Australians Agency, Australian Government.
41 Justman, M. and Peyton, K. (2018). Enforcing Compulsory Schooling through Credible Coercion: Lessons from Australia’s Northern Territory Intervention, Economic Record, 94 (306), pp. 223-238.
42 Department of Families, Housing, Community Services, and Indigenous Affairs (2012). Cape York Welfare Reform: Evaluation, Australian Government: Canberra.
43 ACARA (2015). National Standards for Student Attendance Data Reporting 2015, prepared in conjunction with the Student Attendance Data Working Group.
44 Baxter, L. P. and Meyers, N. M. (2019). Indigenous (and all) students’ school attendance: Investigating data collection methods, Issues in Educational Research, 29 (4), pp. 1068-1088.
45 Hancock, K. J.; Gottfried, M. A.; and Zubrick, S. R. (2018). Does the reason matter? How student-reported reasons for school absence contribute to differences in achievement outcomes among 14–15 year olds, British Education Research Journal, 44 (1), pp. 141-174.
46 Hancock, K. J.; Gottfried, M. A.; and Zubrick, S. R. (2018). Does the reason matter? How student-reported reasons for school absence contribute to differences in achievement outcomes among 14–15 year olds, British Education Research Journal, 44 (1), pp. 141-174.
47 Biddle, N. (2007). Indigenous Australians and preschool education Who is attending? Australasian Journal of Early Childhood Education, 32 (3), pp. 9-16.
48 Department of Prime Minister and Cabinet (2020). Closing the Gap Report, Australian Government: Canberra.
49 Brinkman, S.; Sayers, M.; Goldfield, S.; and Kline, J. (2009). Population monitoring of language and cognitive development in Australia: The Australian Early Development Index, International Journal of Speech-Language Pathology, 11 (5), pp. 419-430.
50 Janus, M. and Offord, D. R. (2007). Development and Psychometric Properties of the Early Development Instrument (EDI): A Measure of Children’s School Readiness, Canadian Journal of Behavioural Science, 39 (1), pp. 1-22.
51 Sayers, M.; Coutts, M.; Goldfeld, S.; Oberklaid, D.; Brinkman, S.; and Silburn, S. (2007). Building Better Communities for Children: Community Implementation and Evaluation of the Australian Early Development Index, Early Education and Development, 18 (3), pp. 519-534.
52 Brinkman, S.; Gregory, T.; Harris, J.; Hart, B.; Blackmore, S.; and Janus, M. (2013). Associations Between the Early Development Instrument at Age 5, and Reading and Numeracy Skills at Ages 8, 10 and 12: a Prospective Linked Data Study, Child Indicators Research, 6, pp. 695-708.
32 | Mind the Gap: Understanding the Indigenous education gap and how to close it
53 Guthridge, S.; Li, L.; Silburn, S. et al (2015). Impact of perinatal health and socio-demographic factors on school education outcomes: A population study of Indigenous and non-Indigenous children in the Northern Territory, Paediatrics and Child Health, 51, pp. 778-786.
54 Guthridge, S.; Li, L.; Silburn, S. et al (2015). Impact of perinatal health and socio-demographic factors on school education outcomes: A population study of Indigenous and non-Indigenous children in the Northern Territory, Paediatrics and Child Health, 51, pp. 778-786.
55 Wake, M, Sanson, A, Berthelsen, D, Hardy, P, Misson, S, Smith, K, Ungerer,J and the LSAC Research Consortium (2008). How well are Australian infants and children aged 4 to 5 years doing?, Social Policy Research Paper no. 3.
56 ACER (2017). Progress in International Reading Literacy Study: Reporting Australia’s results, 2016.
57 Taylor, C. L.; Christensen, D.; Lawrence, D.; Mitrou, F., and Zubrick, S. R. (2013). Risk factors for children’s receptive vocabulary development from four to eight years in the longitudinal study of Australian children. PloS One, 8 (9), e73046.
58 Short, K.; Eadie, P.; Descallar, J.; Comino, E.; and Kemp, L. (2017). Longitudinal vocabulary development in Australian urban Aboriginal children: Protective and risk factors, Child: Care, Health and Development, 43, pp. 906-917.
59 Su, J.; Guthridge, S.; He, V. Y.; Howard, D.; and Leach, A. J. (2020). The impact of hearing impairment on early academic achievement in Aboriginal children living in remote Australia: a data linkage study, BMC Public Health, 20 (1).
60 Mahadevan, M.; Navarro-Locsin, G. ; Tan, H. K. K.; et al (2012). A review of the burden of disease due to otitis media in the Asia-Pacific, International Journal of Pediatric Otorhinolaryngology, 76, pp. 623-635.
61 Simpson, A.; Enticott, J. C.; and Douglas, J. (2017). Socioeconomic status as a factor in Indigenous and non-Indigenous children with hearing loss: analysis of national survey data, Australian Journal of Primary Health, 23, pp. 202-207.
62 Zubrick S. R.; Lawrence D. M.; Silburn S. R.; et al. (2004). The Western Australian Aboriginal Child Health Survey: the health of Aboriginal children and young people. Perth: Telethon Institute for Child Health Research.
63 Williams, C. J., and Jacobs, A. M. (2009). The impact of otitis media on cognitive and educational outcomes. Medical Journal of Australia, 191 (9), s69–s72.
64 Walker, N. and Wigglesworth, G. (2001). The Effect of Conductive Hearing Loss on Phonological Awareness, Reading and Spelling of Urban Aboriginal Students. The Australian and New Zealand Journal of Audiology, 23 (1), pp. 37–51.
65 Aithal, S.; Yonovitz, A.; and Aithal, V. (2008). Perceptual Consequences of Conductive Hearing Loss: Speech Perception in Indigenous Students Learning English as a ‘School’ Language, The Australian and New Zealand Journal of Audiology, 30 (1), pp. 1–18.
66 Western Australian Government (2020). Inquiry into Education in Remote and Complex Environments: Western Australian Whole-of-Government Submission.
67 Royal Far West (2020). Submission on Inquiry into Education in Remote and Complex Environments by the House Standing Committee on Employment, Education and Training, Submission No 32
68 Little, C. W.; Larsen, S.; Byrne, B.; Logan, J. A. R.; Olson, R. K.; and Coventry, W. L. (2020). Exploring the Influence of Early Childhood Education and Care on the Etiology of Achievement, Behavior Genetics, 50, pp. 387-400.
69 Coley, R. L.; Lombardi, C. M.; and Sims, J. (2015). Long-term implications of early education and care programs for Australian children, Educational Psychology, 107(1), pp. 284–299.
70 Lipsey, M. W.; Hofer, K. G.; Dong, N.; Farran, D. C.; and Bilbrey, C. (2013). Evaluation of the Tennessee Voluntary Prekindergarten Program: Kindergarten and First Grade Follow-Up Results from the Randomized Control Design (Research Report). Nashville, TN: Vanderbilt University, Peabody Research Institute.
71 Holzinger, L. A. and Biddle, N. (2015). The relationship between early childhood education and care (ECEC) and the outcomes of Indigenous children: evidence from the Longitudinal Study of Indigenous Children (LSIC), CAEPR Working Paper No. 103/2015, Centre for Aboriginal Economic Policy Research, Australian National University.
72 Holzinger, L. A. and Biddle, N. (2015). The relationship between early childhood education and care (ECEC) and the outcomes of Indigenous children: evidence from the Longitudinal Study of Indigenous Children (LSIC), CAEPR Working Paper No. 103/2015, Centre for Aboriginal Economic Policy Research, Australian National University.
73 Little, C. W.; Larsen, S.; Byrne, B.; Logan, J. A. R.; Olson, R. K.; and Coventry, W. L. (2020). Exploring the Influence of Early Childhood Education and Care on the Etiology of Achievement, Behavior Genetics, 50, pp. 387-400.
74 Coley, R. L.; Lombardi, C. M.; and Sims, J. (2015). Long-Term Implications of Early Education and Care Programs for Australian Children, Educational Psychology, 107 (1), pp. 284-299.
75 Holzinger, L. A. and Biddle, N. (2015). The relationship between early childhood education and care (ECEC) and the outcomes of Indigenous children: evidence from the Longitudinal Study of Indigenous Children (LSIC), CAEPR Working Paper No. 103/2015, Centre for Aboriginal Economic Policy Research, Australian National University.
Mind the Gap: Understanding the Indigenous education gap and how to close it | 33
76 Holzinger, L. A. and Biddle, N. (2015). The relationship between early childhood education and care (ECEC) and the outcomes of Indigenous children: evidence from the Longitudinal Study of Indigenous Children (LSIC), CAEPR Working Paper No. 103/2015, Centre for Aboriginal Economic Policy Research, Australian National University.
77 Fox, S. and Geddes, M. (2016). Preschool - Two Years are Better Than One: Developing a Preschool Program for Australian 3 Year Olds – Evidence, Policy and Implementation, Mitchell Institute Policy Paper No. 03/2016. Mitchell Institute, Melbourne.
78 Schellekens, M.; Ciarrochi, J.; Dillon, A.; Sahdra, B.; Brockman, R.; Mooney, J. ; and Parker, P. (2020). The Role of Achievement, Gender, SES, Location, and Policy in Explaining the Indigenous Gap in High-School Completion. 10.35542/osf.io/tu3fb.
79 Biddle, N. and Cameron, T. (2012). Potential factors influencing Indigenous education participation and achievement, NCVER Research Report, Adelaide.
80 Productivity Commission (2019). The Demand Driven University System: A Mixed Report Card, Commission Research Paper, Canberra.
81 Productivity Commission (2019). The Demand Driven University System: A Mixed Report Card, Commission Research Paper, Canberra.
82 Biddle, N. (2010). A Human Capital Approach to the Educational Marginalisation of Indigenous Australians, CAEPR Working Paper, No. 67/2010, Centre for Aboriginal Economic Policy Research, Australian National University.
83 Lin, S., Williamson, F., Beetson, J. et al (2020). Quantifying low English literacy in Australian Aboriginal communities: a correlational study, Australian Educational Researcher, https://doi.org/10.1007/s13384-020-00388-7.
84 Good to Great Schools Australia (2017). Implementation Report: Learning from the first two years of Literacy for Remote Schools Program 2015-2017, Cairns.
85 Mundine, N. W. and Henderson, E. (2021). Back to basics: A new model for business creation in remote Indigenous communities, Analysis Paper No 21, Centre for Independent Studies: Sydney.
Level 1, 131 Macquarie St, Sydney NSW 2000 • phone: 02 9438 4377 • email: [email protected]
About the Author
Research Report 41 (RR41) • ISSN: 2204-8979 (Printed) 2204-9215 (Online) • ISBN: 978-1-925744-85-9
Published June 2021 by the Centre for Independent Studies Limited. Views expressed are those of the authors and do not necessarily reflect the views of the Centre’s staff, advisors, directors or officers.
© Centre for Independent Studies (ABN 15 001 495 012), 2019
This publication is available from the Centre for Independent Studies. Visit cis.org.au
Glenn FaheyGlenn is education research fellow and author of several CIS research papers. His most recent Research Report is Dollars and Sense: Time for Smart Reform of Australian School Funding. He is a former consultant in education governance at the OECD’s Centre for Educational Research and Innovation.
Acknowledgements This research project was possible thanks to the generous support of the Susan McKinnon Foundation.
Research contained in this paper was accessed through a data use agreement with the Australian Curriculum, Assessment, and Reporting Authority.
Related work Lorraine Hammond, Confronting Indigenous educational disadvantage: A Kimberley perspective, CIS Analysis Paper 20 (AP20).
Jacinta Price, Worlds Apart: Remote Indigenous disadvantage in the context of wider Australia, CIS Policy Paper 34 (PP34).