The Millennium Development Goals and Performance Millennium Development Goals Website

ACTAUNIVERSITATIS
UPSALIENSISUPPSALA
2012
Digital Comprehensive Summaries of Uppsala Dissertationsfrom the Faculty of Medicine 839
Millennium Development Goalsin Nicaragua
Analysing progress, social inequalities, andcommunity actions
WILTON PÉREZ
ISSN 1651-6206ISBN 978-91-554-8532-0urn:nbn:se:uu:diva-183273

Dissertation presented at Uppsala University to be publicly examined in Rosénsalen,Akademiska sjukhuset, Entrance 95/96 nbv, Uppsala, Friday, December 14, 2012 at 13:00 forthe degree of Doctor of Philosophy (Faculty of Medicine). The examination will be conductedin English.
AbstractPérez, W. 2012. Millennium Development Goals in Nicaragua: Analysing progress, socialinequalities, and community actions. Acta Universitatis Upsaliensis. Digital ComprehensiveSummaries of Uppsala Dissertations from the Faculty of Medicine 839. 62 pp. Uppsala.ISBN 978-91-554-8532-0.
The world has made important efforts to meet the Millennium Development Goals (MDG) by2015. However, it is still insufficient and inequalities prevail in the poorest settings. We trackedselected MDG, barriers for their achievement, and community actions that help to acceleratethe pace of their accomplishment in two Nicaraguan communities (León and Cuatro Santos).
In the first two studies we track the progress of MDG4 (reduce child mortality) using theunder-five mortality rate. Inequalities in mortality were mainly assessed by means of maternaleducation, but other social stratifications were performed on rural-urban residence and sub-regional comparisons between both communities. The last two studies describe communityinterventions in Cuatro Santos and their association with progress toward MDG1 (povertyreduction). Participation in interventions and poverty were visualized geographically in thisremote rural community between 2004 and 2009. Other selected MDG targets were also tracked.
These communities will possibly meet MDG4 even before 2015. In León, MDG progresshas been accompanied by a decline in child mortality. Despite social inequalities with regardto mortality persisting in education and places of residence, these have decreased. However,it is crucial to reduce neonatal mortality if MDG4 is to be achieved. For example, in Leónthe percentage of under-five deaths in the neonatal period has doubled from 1970 to 2005. Inthe remote rural area of Cuatro Santos, progress has been accelerated and no child mortalitydifferences were observed despite the level of a mother’s education.
Cuatro Santos has also progressed in the reduction of poverty and extreme poverty.The participation of the population in such community interventions as microcredit, homegardening, technical training, safe drinking water, and latrines has increased. Microcredit wasan intervention that was unequally distributed in this rural area, where participation was lowerin poor and extremely poor households than in non-poor households. In those households thattransitioned from poor to non-poor status, microcredit, home gardening, and technical trainingwere associated with this transition. Furthermore spatial analysis revealed that clusters of lowparticipation in interventions overlapped with clusters of high poverty households.
Keywords: Millennium Development Goals, child survival, poverty, inequality, interventions,spatial model, Nicaragua
Wilton Pérez, Uppsala University, Department of Women's and Children's Health,International Maternal and Child Health (IMCH), Akademiska sjukhuset, SE-751 85 Uppsala,Sweden.
© Wilton Pérez 2012
ISSN 1651-6206ISBN 978-91-554-8532-0urn:nbn:se:uu:diva-183273 (http://urn.kb.se/resolve?urn=urn:nbn:se:uu:diva-183273)

To the memory of Mi Tía Maura

List of Papers
This thesis is based on the following papers, which are referred to in the text by their Roman numerals.
I Pérez W, Peña R, Persson LÅ, Källestål C. (2011) Tracking progress towards equitable child survival: neonatal mortality challenges to meet the MDG 4. BMC Public Health, 11:455*
II Pérez W, Eriksson L, Zelaya Blandon E, Persson LÅ, Källestål C, Peña R. (2012) Comparing progress towards the child mortality Mil-lennium Development Goal in León and Cuatro Santos, Nicaragua, 1990–2008. Manuscript
III Pérez W, Zelaya Blandon E, Persson LÅ, Peña R, Källestål C. (2012) Progress towards millennium development goal 1 in northern rural Nicaragua: Findings from a health and demographic surveil-lance site. International Journal for Equity in Health, 11:43*
IV Pérez W, Selling K, Nazmul S, Peña R, Källestål C, Persson LÅ, Ze-laya Blandon E. Community development actions to achieve the Millennium Development Goals. An analysis based on a surveillance site in Cuatro Santos, Nicaragua. Manuscript
*The article has been published in an open-access journal.


Contents
Introduction ................................................................................................... 11 Human development ................................................................................. 11 Millennium Development Goals .............................................................. 12 MDG progress in the world: poverty and child survival .......................... 13 The effect of social inequalities on MDG ................................................ 15 MDG in Latin-America: progress, and challenges ................................... 16 MDG in Nicaragua: Goal 1 and Goal 4 .................................................... 17 Interventions to help reduce poverty and improve child survival in low-income countries ....................................................................................... 19 Demographic Surveillance: a tool for monitoring MDG .......................... 20 Rationale of this study .............................................................................. 22
Aims .............................................................................................................. 23
Methods ......................................................................................................... 24 Study setting ............................................................................................. 24 Health and demographic surveillance site ................................................ 24 Study designs and participants ................................................................. 26 Data collection .......................................................................................... 26 Community interventions in Cuatro Santos .............................................. 28 Operationalization of variables ................................................................. 29 Statistical analysis ..................................................................................... 31 Ethics considerations ................................................................................ 32
Results ........................................................................................................... 33 Child mortality and inequality: Papers 1 and 2 ........................................ 33 Community actions and MDG progress: Papers 3 and 4 .......................... 37
Discussion ..................................................................................................... 42 The MDG4 progress ................................................................................. 42 Community interventions to achieve MDG1 ............................................ 44 Methodological considerations ................................................................. 47
Conclusions ................................................................................................... 49
Acknowledgements ....................................................................................... 50
References ..................................................................................................... 52
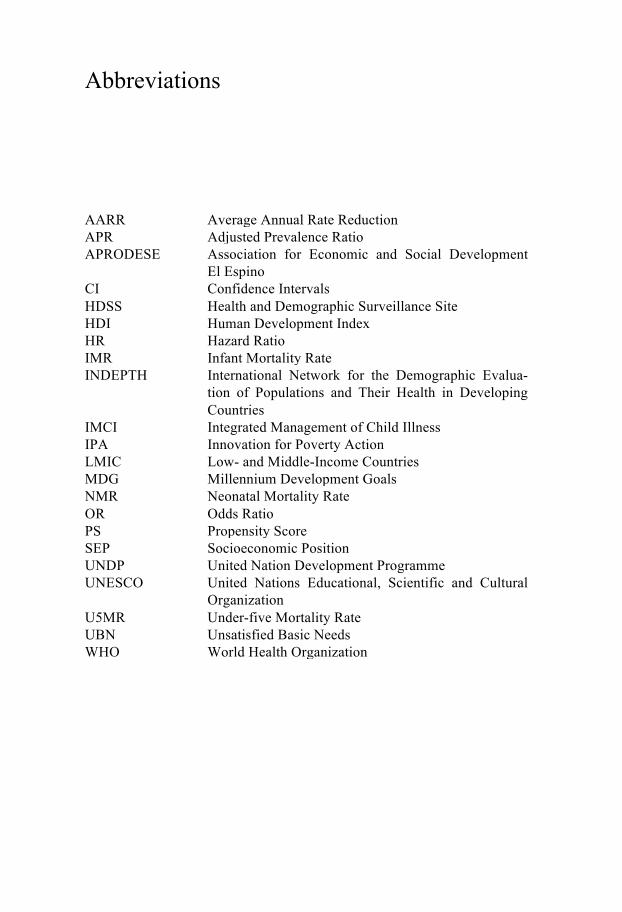
Abbreviations
AARR Average Annual Rate Reduction APR Adjusted Prevalence Ratio APRODESE Association for Economic and Social Development
El Espino CI Confidence Intervals HDSS Health and Demographic Surveillance Site HDI Human Development Index HR Hazard Ratio IMR Infant Mortality Rate INDEPTH International Network for the Demographic Evalua-
tion of Populations and Their Health in Developing Countries
IMCI Integrated Management of Child Illness IPA Innovation for Poverty Action LMIC Low- and Middle-Income Countries MDG Millennium Development Goals NMR Neonatal Mortality Rate OR Odds Ratio PS Propensity Score SEP Socioeconomic Position UNDP United Nation Development Programme UNESCO United Nations Educational, Scientific and Cultural
Organization U5MR Under-five Mortality Rate UBN Unsatisfied Basic Needs WHO World Health Organization

Glossary
Confidence interval: Used for statistical inference, it is the range of values where the true parameter is expected to be within a certain level of confi-dence (generally stated as 95%).
Formative evaluation: Process evaluation to assess the performance of an intervention before it has been concluded. Hazard ratio: Employed in survival analysis, it is the ratio of time to event between two groups. Infant mortality rate: The probability of dying before the age of one year, expressed per 1000 live births. Neonatal mortality rate: The probability of dying during the first month of life, expressed per 1000 live births. Prevalence ratio: A ratio of the prevalence of an outcome in a certain group and the prevalence of the same outcome in other group (group might be the exposure level). Propensity score: The probability of treatment or intervention assignment conditional on the observed baseline characteristics. Spatial scan test: Statistical method used to detect if spatial clusters of an event have occurred by chance. Under-five mortality rate: The probability of a child dying by age of five years, expressed per 1000 live births.

Preface
In 2002 I graduated as a mathematician from the National University of Le-ón, Nicaragua. I then was hired as a research assistant at the Center for De-mographic and Health Research (CIDS) in the unit of Demography and Child Health. My work was primarily concerned with the quality control of data collection at the Health and Demographic Surveillance Site in León. In 2008 I defended a Masters thesis on “Pattern of Migration in the León Mu-nicipality”.
During the course of several meetings with people from the community, I had the opportunity of disseminating information gathered by the Health and Demographic Surveillance Site (HDSS) on issues related to demography, health, and socio-economic conditions in León and Cuatro Santos. I enjoyed the discussions and witnessing the ability of people to utilize the HDSS data to solve practical problems in their communities. In 2009, I was accepted as a PhD candidate in International Maternal and Child Health at Uppsala Uni-versity. My studies focused on monitoring Millennium Development Goals in local contexts in Nicaragua as part of a sandwich program between Swe-den and Nicaragua, funded by Sida/Sarec.

11
Introduction
Human development In October 2012, the planet earth received inhabitant number 7 billion; by 2050 a population of around 9 billion is expected (1). This rapid population growth challenges the balance between such basic resources as food and health for human development.
To define and understand human development is complex. A conceptual-ization like “the process of enlarging people’s choices” from Amartya Sen’s work on human capabilities has been considered as one approach. Choices here refer to all the alternatives people have for assuring their well-being (2,3). The United Nations Development Programme report utilized concepts similar to this definition enclose, and in creating a Human Development Index (HDI) containing three dimensions: health, knowledge, and standard of living. The index has been criticized for not including other dimensions of human development (e.g., justice, civil participation), for failing to account for social stratification (i.e., gender), and for giving equal weight to dimen-sions or adding together these different dimensions (4-6). Nevertheless, the HDI is one of the first attempts to visualize human development beyond an economic perspective. The index has values ranging from 0 (low human development) to 1 (high human development).
Since 1990 the United Nations has produced reports using the HDI that show the level of human development of worldwide countries (7). In 1990 that HDI went from 0.19 (Nigeria) to 0.87 (Australia); by 2011 the spectrum extended from 0.29 (Congo) to 0.94 (Norway) (8). Global assessments show that human development has improved from 0.59 in 1990 to 0.68 in 2011. However, this trend is not the same everywhere, China, for example, has the highest increase of development, going from 0.49 in 1990 to 0.69 in 2011. On the other hand, Congo has maintained its HDI at 0.29 since 1990. In countries with low HDI children die at an early age, people have less educa-tion, and they live in precarious environments without access to safe drink-ing water or sanitation. A way forward toward increasing human develop-ment was the Millennium Development Goal (MDG) initiative.

12
Millennium Development Goals In the year 2000, 147 nations worldwide committed to reduce the level of poverty in low- and middle-income countries (LMIC) along with those so-cial conditions related to it, such as a high burden of morbidity, mortality, unhealthy living conditions, and social injustice. The plan designed for this purpose was called Millennium Development Goals. By 2012 the total num-ber of nations that have joined has risen to 192 (9).
The principles of human development along with sustainable develop-ment are endorsed in strategies to define, measure, monitor, and evaluate actions undertaken to meet the MDG (10). The MDG have three primary characteristics: First, they have a specified time period in which to be ac-complished. Even when they were ratified in 2000, their inception point was 1990, and the deadline set as 2015. Second, progress should be monitored and continuously evaluated. This is possible as the MDG have a framework of eight goals, 18 targets, and 48 quantifiable indicators (Table 1). Third, the will of each nation to improve the lives of its people forms the cornerstone of the project.
Table 1. Millennium Development Goals and selected targets
MDG Target MDG1: Eradicate extreme hunger and poverty Halve the proportion of people that live on less
than $1.25 a day between 1990 and 2015 MDG2: Achieve universal primary education Ensure that, by 2015, 100% of country’s chil-
dren will complete a full course of primary schooling
MDG3: Promote gender equality Eliminate gender disparity in primary and secondary school by 2015
MDG4: Reduce child mortality Reduce by two-thirds the under-five mortality rate between 1990 and 2015
MDG5: Improve maternal health Reduce by three-quarters the maternal mortali-ty ratio between 1990 and 2015
MDG6: Combat HIV/AIDS, malaria, and other diseases
Have halted by 2015 and begun to reverse the incidence of malaria and other major diseases
MDG7: Ensure environmental sustainability Halve the proportion of people without sus-tainable access to safe drinking water and basic sanitation
MDG8: Develop a global partnership for development
In cooperation with developing countries, develop and implement strategies for decent and productive work for youth

13
MDG progress in the world: poverty and child survival
The global situation About 1.3 billion people were living on less than $1.25 a day at the end of 2008, and between 850 and 920 million were undernourished (11,12). In 2011, an estimated 61 million children were not in school (13). In 2011, 6.9 million children under age five died and 274,000 maternal deaths occurred (14,15). In this year about 34 million people were living with HIV (16); 783 million did not have access to safe drinking water, and 1.1 billion lacked adequate sanitary facilities (17).
The United Nations has been issuing annual reports on the progress of MDG since 2005. If a country is making progress toward a specific MDG, then it is considered “on track” or “target met”. Otherwise its progress is “insufficient”. There has not been uniform progress towards all the MDG in all countries (18,19). The World Bank estimates that about two-thirds of developing countries are on track to achieve the MDG. More than 90% are progressing in education (MDG2) and gender equality (MDG3), 88% in access to safe water (MDG7, target 3), and between 77% and 80% in reduc-tion of poverty and hunger (MDG1, targets 1 & 3). Nonetheless, slow pro-gress has been observed in the case of the health-related MDG (child mortal-ity and maternal mortality (20-23).
Poverty: definition, measure, and millennium progress Poverty reflects how people live in term of financial resources or social dep-rivations (e.g., health)(24). It is a theoretical and methodological challenge to attempt to define poverty (25,26).
Ways of measuring poverty serve different needs. Poverty measurements illustrate the burden of poor people, enable comparisons, assess trends, aid in implementing solutions, and evaluate policies aimed at poverty reduction. Monetary (e.g., household income or household consumption) and non-monetary (e.g., multiple poverty indicators, wealth index based on assets) approaches are used to measure poverty (27,28).
Worldwide, the proportion of people living on less than $1.25 a day has dropped from 47% in 1990 to 24% in 2008; therefore, the first target of MDG1 has been met (13). However, some places have reached MDG1 faster than others (Figure 1). Slow progress has occurred in sub-Saharan Africa and in southern Asia where only 20% to 35% of the countries are expected to achieve the MDG1 poverty reduction target by 2015.
Discussions about ways to assess MDG progress have continued, espe-cially in those countries whose initial conditions were at a very low state (29). For example, most sub-Saharan Africa regions started with highest levels of poverty or mortality in comparison with the rest of the world, im-plying a greater challenge to meet goals. Although most extremely poor

14
countries might not succeed in halving poverty or meeting other MDG, some have reduced poverty levels faster than at any other time (30,31).
Child survival Children are highly dependent on their environment during the first few years of life (i.e., parents, caretakers, health system). It is a time when they experience rapid brain growth and acquire skills and learning (32). Child survival statistics are an indicator of human rights, social development, and health care (33,34). They provide crucial information for mobilizing re-sources to improve the environment for the well-being of children. The Con-vention on Rights of the Child explicitly states that all children have the right to life, and nations have the obligation to ensure this commitment (35).
Approximately 90% of all deaths that occur before the age of 14 happen before the age of five (36). The under-five mortality rate is used as a sum-mary health indicator to assess child health and survival. It is commonly subdivided into neonatal (< 28 days of life), infant (< 1 year) and childhood (from 1 to 4 years) mortality rates. Neonatal mortality is strongly associated with accessibility, availability, and quality of health care services (37,38). Infant and childhood mortality is related to socio-economic development (39). Under-five mortality is the target of the fourth MDG.
Epidemiology and millennium progress The objective of MDG4 is to reduce the under five-mortality rate (U5MR) and the infant mortality rate (IMR) by two-thirds between 1990 and 2015. This two-third target is approximately the portion of child deaths that could be prevented in low- and middle-income settings by scaling-up affordable interventions (40).
About 205 million children worldwide died before the age of five be-tween 1990 and 2011. Fifty percent of those deaths occurred between 1990 and 1998. The U5MR has declined over the decades from 11.9 million in 1990, to 9.3 million in 2000, and to 6.9 million in 2011 (14). More than 80% of these deaths are concentrated in two regions: sub-Saharan Africa and southern Asia. The reduction of deaths dropped the U5MR from 87 per 1000 live births in 1990 to 51 deaths per 1000 in 2011. One-third of world’s coun-tries had rates higher than the global average in 2011. Almost 90% of these countries are located in Africa, where the highest rate (187 deaths per 1000 live births) occurred in Sierra Leone in 2011.
The U5MR experienced a faster decline from 2000 to 2011 than during the first decade of the MDG (30% vs. 16%). These figures are still insuffi-cient to reach MDG4, for which an annual average rate reduction (AARR) of at least 4.4%, as opposed to the current AARR of 2.2%, would be needed (15). Less than one-fifth of all countries might achieve MDG4 by 2015. Of the 75 countries that account for more than 95% of the global child deaths under age five, 23 are on track toward MDG4. These countries are part of
15
the continued surveillance performed by the Countdown to 2015 initiative, which seeks to enhance coverage of effective interventions, promote equity, and support national commitments to improve child and maternal health (41).
Causes of child deaths: the newborn challenge Almost two-thirds of child deaths in LMIC are attributable to infectious dis-eases (42). Pneumonia, diarrhea, and malaria account for 36% of under-five deaths. In countries with high mortality, such as in Africa, 4 out of 10 deaths are attributable to these deaths conditions (43,44). Nevertheless, deaths from the same conditions were higher in the past, and a 4% annual reduction in diarrhea and a 3% annual reduction in pneumonia have been observed be-tween 2000 and 2010 (44). In one-fifth of all child deaths, the underlying cause was malnutrition (45).
A drop in mortality after the first month of life has been achieved during the 1980s. After 1990, progress in the reduction of child mortality has con-tinued. However slow progress has been made in improving newborn sur-vival (37). Neonatal deaths declined from 4.4 to 2.9 million between 1990 and 2011. Two-fifths of all under-five deaths occur during the first 28 days of life. Approximately 75% of all neonatal deaths happen during the first week, and about 50% during the first day (46). Ten countries are responsible for 65% of all neonatal deaths worldwide: four are in Africa (Nigeria, Ethio-pia, Congo, and Tanzania) and the rest in Asia (India, Pakistan, China, Bang-ladesh, Indonesia, and Afghanistan) (44). Almost three-quarters of those deaths are due to preterm birth complications, sepsis, and intrapartum-related conditions (42). More than 90% of these deaths are in Countdown countries. Worldwide the AARR of 2.1% between 2000 and 2010 in the neonatal peri-od is still low to make progress toward MDG4 (47,48).
The effect of social inequalities on MDG Certain population groups have less social advantages than others, and these disproportions affect outcomes in life. Most health outcomes for example, are worse for individuals who have greater socio-economic disadvantages than others (49). These differences are called social inequalities in the field of health (50). However, health differences do not only apply to wealth. De-pending on outcome, available data, and public priorities, such inequalities may also be found in other social aspects including gender, age, ethnicity, race, education, occupation, or geography, generally summed up as socio-economic position (SEP) (51-53). A female newborn in Bangladesh has less chance to survive there than a male newborn. In Vietnam neonatal mortality is an invisible public health problem among minority ethnic groups (54). In Estonia, despite a great reduction, infant mortality is still higher in mothers

16
with low education than in mothers with high education (55). The Commis-sion of Social Determinants of Health is a global network that assesses the impact of reducing social inequalities (inequities) on health outcomes (56).
Tackling social inequalities is a key issue for the MDG (57-59). Of the eight MDG, one (MDG3) explicitly addresses improving equity (unfair so-cial inequalities). However, the assessment of inequality is implied in the remaining MDG. For example, the number of poor people is higher in rural than in urban populations. In LMIC underweight children are almost three times more prevalent among poor than among rich children. Primary school attendance is 1.4 times higher in wealthy families than in poor families. The U5MR is three times greater in children born to mothers with low education than to mothers with high education (32,60). Moreover, in excess of 80% of households without access to safe drinking water are rural (61).
An intervention may introduce social inequalities during the scale-up pro-cess (62), a situation historically recognized as the ‘inverse care law’, whereby less medical care is available for those who need it most (63). Thus, although the US is a rich nation with advanced medical technology, infant mortality is 54% higher among black than among white infants. The inverse equity hypothesis, which shares similarities with the inverse care law, fo-cused attention on the trend toward widening inequalities once an interven-tion is underway (64). Studies have found that skilled birth attendance is an intervention that does not universally provide coverage to the less advan-taged, although rapid progress is being made to narrow inequalities (65-67).
MDG in Latin-America: progress, and challenges With 47 countries and a population of 591 million, Latin America has an average HDI of 0.73, ranging from 0.45 in Haiti to 0.85 in Chile. The popu-lation in the region is young (37% below the age of 18), and more than three-quarters of the inhabitants live in cities (8). Despite having an HDI similar to more developed regions, the Latin-American subcontinent has the highest social inequalities in the world (68).
Progress on MDG is mixed in the area, with considerable differences among the countries (Table 2). Overall, progress has been made in poverty reduction, education, equality, child health, and safe water, but not with re-gard to maternal mortality, MDG5. Mexico will reach at least one target of the eight MDG. Haiti, on the other hand, has the lowest probability of reach-ing the MDG by 2015 (69).

17
Table 2. Millennium development goal trends in Latin America and Caribbe-ana
MDG target 1990 Last available data 2015 target
MDG1: < $1.25/day 12% 6% (2008) 6% MDG2: Primary school enrol-ment
94% 95% (2010) 100%
MDG3: Gender disparity prima-ry/secondary education
97/107b 97/108 (2010) 97 to 103c
MDG4d: Child mortality 54 23 (2012) 18 MDG5d: Maternal mortality, Latin America/Caribbean
130/280 72/190 (2010) 33/70
MDG6e: HIV incidence 0.04 0.03 (2010) 0.02 MDG7: Access to an improved water source
85% 94% 93%
a MDG report 2012 (13) b Available for 1999 c Accepted target for gender parity index d per 1000 live births e per 100,000 inhabitants
Although there has been progress, Latin America and the Caribbean continue to face challenges in meeting the MDG. The region estimates that it will need economic growth of at least 2.9% to reduce poverty. However, beyond macroeconomic development; the region has the highest and most persistent income and social inequalities in the world—almost one-fifth greater than sub-Saharan Africa (70,71). These inequalities affect MDG targets. For ex-ample, poverty is lower in urban areas compared to rural areas. Despite low levels of malnutrition, it remains 2.6 higher in rural than in urban areas. More than 94% of the population of Latin America has access to safe drink-ing water, but the percentage is lower in rural and poor households (72). The expansion of immunization has reduced child mortality (73), but among the poorest and mothers with low education, child mortality is almost three times greater than among the wealthiest and best educated mothers. Evi-dence has suggested that national economic growth in Latin America im-proves health for all when inequalities are narrowed (74).
MDG in Nicaragua: Goal 1 and Goal 4 Nicaragua is a country with 5 million inhabitants and an HDI of 0.59, locat-ed at the Central American isthmus (9). The population structure typical of most LMIC, is predominantly young (49% under age 19). It is divided into three regions: Pacific, Central, and Caribbean. Spanish is the official lan-guage, but in the Caribbean region English and minority ethnic languages
18
are also spoken. The capital of Managua in the pacific region has a concen-tration of one-quarter of Nicaraguan population. Because the country is lo-cated in the tropical zone, there is a wet season from May to November, and a dry season from December to April.
Nicaragua was ruled by a dictatorship between 1933 and 1979. It was a period of great inequality with one-third of the health resources allocated to the capital — where only 25% of the population lived (75). The years after the Sandinista revolution of 1979 were characterized by low economic growth but increased provision of social services (e.g., education and health) targeted at the poor through a massive communitarian participation called the brigadistas (76,77). Then a civil war during the mid- 1980s plus an eco-nomic embargo imposed by the US weakened the country’s economy and affected social services, including health. By the end of 1987, 10% of the national budget was allocated to health service — but almost 40% was allo-cated to the military (78). Unfortunately, due o its location, Nicaragua is also prone to natural disasters (earthquakes, hurricanes, volcanic eruptions). Be-tween 1990 and 2009 alone, $2.7 billion was lost to natural calamities (79).
Nicaragua is one of the signatory nations to the MDG. However, since it is a poor country, Nicaragua’s data in tracking the MDG is uneven. The es-timated under-reporting in counting deaths was 39% in 2009 for the civil registration system (80).
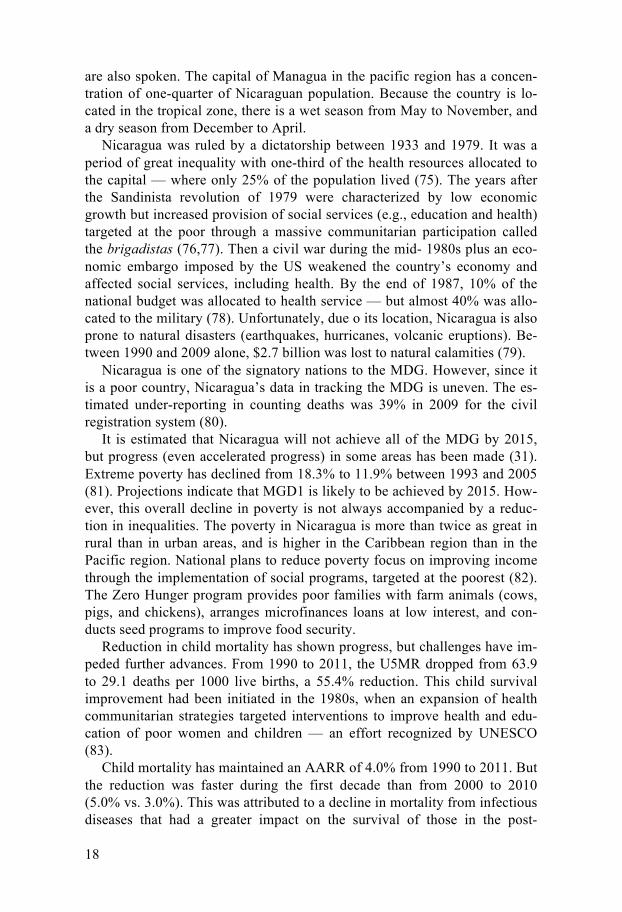
It is estimated that Nicaragua will not achieve all of the MDG by 2015, but progress (even accelerated progress) in some areas has been made (31). Extreme poverty has declined from 18.3% to 11.9% between 1993 and 2005 (81). Projections indicate that MGD1 is likely to be achieved by 2015. How-ever, this overall decline in poverty is not always accompanied by a reduc-tion in inequalities. The poverty in Nicaragua is more than twice as great in rural than in urban areas, and is higher in the Caribbean region than in the Pacific region. National plans to reduce poverty focus on improving income through the implementation of social programs, targeted at the poorest (82). The Zero Hunger program provides poor families with farm animals (cows, pigs, and chickens), arranges microfinances loans at low interest, and con-ducts seed programs to improve food security.
Reduction in child mortality has shown progress, but challenges have im-peded further advances. From 1990 to 2011, the U5MR dropped from 63.9 to 29.1 deaths per 1000 live births, a 55.4% reduction. This child survival improvement had been initiated in the 1980s, when an expansion of health communitarian strategies targeted interventions to improve health and edu-cation of poor women and children — an effort recognized by UNESCO (83).
Child mortality has maintained an AARR of 4.0% from 1990 to 2011. But the reduction was faster during the first decade than from 2000 to 2010 (5.0% vs. 3.0%). This was attributed to a decline in mortality from infectious diseases that had a greater impact on the survival of those in the post-

19
neonatal and childhood age group. The neonatal mortality rate has declined from 22.4 in 1990 to 13 in 2011. However, in 1990 approximately 30% of under-five deaths were neonatal, a figure that has risen to 45% in 2001 (23,84). Social inequalities of mortality are also a large barrier to survival rates. The U5MR is lower in urban areas, among mothers with greater edu-cational level or in rich families. Under these circumstances the country is currently not on track toward reaching MDG4.
Interventions to help reduce poverty and improve child survival in low-income countries
Poverty Countries devise plans at the national level to combat poverty and promote economic growth. Every year, these anti-poverty strategies are presented in a “Poverty Reduction Strategy Paper” that is required of its members by the International Monetary Fund and the World Bank to support the fight against poverty in LMIC (85). Most of the help provided by outside agencies comes in the form of loans.
Although governments run anti-poverty programs, there are few evi-dence-based evaluations that have measured the impact of these programs. For example, Innovation for Poverty Action (IPA) is an initiative that im-plements interventions in LMIC from Latin America, to Africa, and to Asia using randomized controlled trials to reduce poverty by addressing in health, education, and employment (86). If a program proves to have a benefit, the next step is to scale it up.
Examples of interventions with a proven positive effect:
• Deworm the world initiative: 25% of dewormed children had less days of school absence than the control group (no participation).
• Remedial education: Working outside the classroom improves the grades of students with low classroom performance.
• Incentives for vaccines: High vaccination rates in children are achieved when parents receive a small non-cash incentive in re-turn.
• Investment vouchers: Providing farmers with funds to buy ferti-lizer at harvest time increases income.
• Free mosquito netting: Distributing insecticide-treated bed nets reduce the incidence of malaria especially in pregnant women.
• Chlorine dispensers: Chlorine dispensers at water sources im-prove health for less than $0.5 a year.

20
• Reminders to save: Sending reminders via SMS increase savings and financial goals among a bank’s clients.
The Millennium Village is another example of how affordable and sus-
tainable programs that help reduce poverty and hunger may be implemented at the local level (87). Impact is measured through non-randomized evalua-tion designs (e.g., before and after). Among the most common programs millennium villages have are:
• Increased food production • Malaria control • Village clinics • Construction of safe drinking water sources • Empower villagers to develop capacity-building • Introduce diversified agriculture • Improve clean water and promote health • Strengthen partnerships at the village level
Child survival Up to 63% of child deaths and 73% of neonatal deaths can be averted annu-ally if life saving interventions have high coverage (> 90%) (40,88). Breast-feeding and oral rehydration therapy may prevent 30% of all under-five deaths in LMIC. With 14 low-cost and high coverage interventions in the neonatal period it is possible to eliminate almost 60% of deaths, even in set-tings with a high neonatal mortality rate (> 45 deaths per 1000 live births) (88). Studies have analyzed the impact of community interventions on the reduction of childhood mortality in Africa. The evidence is not conclusive, but it suggests that community health workers are an effective way of im-proving child survival in poor settings (89). Further, actions have been taken to ensure child survival by the family, the community, and the health system through an initiative called Integrated Management of Childhood Illness (IMCI). Affordable interventions are available for the management of child-hood diseases that cause a high burden of deaths in LMIC. Improving the skills of health personnel or introducing better health practices in the family and the community are the main interventions used by IMCI (90). The IMCI initiative has also improved communications between health workers and caregivers, resulting in the early detection of disease in the child and ena-bling prompt treatment at a community health unit (91).
Demographic Surveillance: a tool for monitoring MDG Timely high-quality data are needed to monitor the MDG. This favors high-income countries whose statistical systems track birth demographic and epi-demiological dynamics. For example in Sweden, a “person number” or indi-

21
vidual ID serves for several purposes, but is mainly used to record demo-graphic information (birth, socioeconomic status, migration, living condi-tions, and death). However, in poor places data from civil registrations are either incomplete or simply not collected, with the result that two-thirds of the population is invisible to the public agenda (92,93). In many LIMC the level of underreporting is negatively correlated with age, and children espe-cially newborns are not included in the statistic registers (54). These limita-tions challenge researchers who wish to perform analyzes to convince policy makers to secure their country’s data (94,95).
All the MDG have targets with relative quantitative indicators. In order to measure the targets, a numerator (defining the event or case) and a denomi-nator (representing the population) are required. Four of the MDG (1,2,3, and 7) contain targets that can be collected from a national census that counts every person or national household surveys where a probabilistic sample is chosen. However, census or households surveys have difficulties linking data at the individual level. For the health-related millennium goals, the implementation of national reproductive surveys has served to generate relevant baseline data for child and maternal targets. Demographic health surveys and multiple indicator cluster surveys have filled in the gap with good data in these areas (96,97). The period for each survey is generally every five years, i.e., shorter than the census.
Other sources of data are the demographic surveillance sites (HDSS) (98). Basically a HDSS collects, analyzes, interprets, and evaluates demographic and epidemiological data about a population cohort. It is generally estab-lished in communities that represent a region of the country. There are ap-proximately 45 HDSS around the world, under the supervision of the Inter-national Network for the Demographic Evaluation of Populations and Their Health (INDEPTH). Most HDSS are located in Africa and Asia (99) and the populations considered may vary between 50,000 and 200,000 people. Based on a probabilistic approach, a sample is selected and then a baseline meas-urement performed. Periodic routines collect vital events (births, deaths, and migration), background characteristics of residents, and housing conditions (Figure 2). The time interval between each data collection varies, depending on the outcome sought and the resources available. Most HDSS update in-formation every three months (100).
HDSS has been seen as a opportunity for those at the local level to ana-lyze MDG progress, monitor trends in social inequalities, evaluate the im-pact of interventions on the population, and establish an ongoing dialogue between evidence-based practice and policy (101,102).

22
Rationale of this study Aggregated analysis of MDG progress cannot assure that it has been homo-geneous at either the global or national level. Community data (e.g., census, survey, or surveillance) help to identify relevance of the effect of social ine-qualities on MDG in the public agenda of policymakers and stakeholders.
In poor contexts, the reduction of poverty and inequalities is likely possi-
ble. The initiative known as the Millennium Villages in Africa promises to be one example of success towards the achievement of MDG. However, evidence is scant.
This thesis focuses its analysis on the progress of selected MDG and
community interventions from a perspective of social inequality. Figure 1 illustrates an overview of the studies performed.
Figure 1. Overview of the studies in this thesis

23
Aims
The overall aim of this thesis was to monitor selected MDG, assess barriers to achieving them, and evaluate forces driving their progress in typical Nica-raguan communities.
Specific aims:
Papers 1 and 2 1. Analyze the trends of under-five and neonatal mortality rates as indica-tors of MDG4, and the inequality gap by mother’s education. 2. Compare the level and trend of under-five mortality in three Nicaragu-an settings (urban, rural, and remote rural).
Papers 3 and 4 3. Measure and monitor the level of poverty (MDG1) and its transition in a remote rural community; describe a set of community interventions; and measure the impact on the reduction of the poverty. 4. Analyze the progress of a set of MDG in a remote rural community, and the spatial distribution of community interventions in that area.

24
Methods
Study setting The data upon which this thesis is based derives from two Nicaraguan com-munities, the León municipality and Cuatro Santos. León is located close to the Pacific region of Nicaragua about 93 km from the capital of Managua and covers a territorial extension of 820 km2 (Figure 2). It is divided into three sub-districts with a population of 174,051, about 80% of which is ur-ban. Almost half of the residents of León are under age 18 (103). León has a teaching hospital, which is also referral hospital for the Pacific region, and each sub-district has a health centre and neighborhood health posts providing curative and preventive health services. Cuatro Santos, on the other hand, is a mountainous rural province of 292 km2. It consists of four municipalities situated 250 km to the northwest of the capital. Its population is estimated at 25,000 inhabitants. Primary health care services are provided by general practitioners and nurses. The closest hospi-tal is about 130 km from the area. The HDI of Cuatro Santos was 0.52 in 2002, whereas the León municipality had an HDI of 0.74 (104). Agriculture and raising livestock dominate the economy in the rural areas, while a labor market are typical of the urban areas.
Health and demographic surveillance site An HDSS was established in León in 2003. It was built from a cluster-sampling framework begun in 1993. The estimated sample size of the base-line was 50,000 inhabitants representing 30% of the total population distrib-uted in 50 clusters. A cluster was defined as a geographical area with a popu-lation of 700 to 1000 inhabitants. Two follow-ups were carried out in 2005 and one in 2008. In Cuatro Santos, the HDSS baseline was established in 2004 covering the total population of these municipalities. Follow-ups took place in 2007 and 2009.

25
Information in the HDSS was updated during follow-ups for each household and family member, and a unique ID allowed tracking them. Background data such as education, employment, vital events (deaths, births, and migra-tion), and housing conditions (type of water, sanitation, floor and wall con-struction) were linked through the ID of each inhabitant and house. Birth histories of women in their reproductive years (15 to 49) recorded data on child survival.
Figure 2. The León and Cuatro Santos study areas (shaded areas) in Nicaragua

26
Study designs and participants The four papers in this thesis are based on data from both HDSS (León and Cuatro Santos). Table 3 describes the study design and other related infor-mation. In papers 1 and 2 retrospective surveys recorded the full birth histo-ries of women of reproductive age (15 to 49 years). Birth and survival status were obtained for every child.
In León, four reproductive surveys were performed: 1993, 2002, two in 2005, and one in 2008. All were carried out in the same study clusters, and records were linked to the HDSS baseline. In Cuatro Santos, retrospective surveys were made in 2004, 2007, and 2009. Using maternal IDs, the birth histories were updated during data collection. A total of 49,972 live births and 2,653 under-five deaths occurred in León between 1970 and 2005. In total, 48% of live births and 27% of under-five deaths were reported from 1990 to 2005. In Cuatro Santos, 12,879 live births and 408 under-five deaths occurred from 1990 to 2008. Verbal autopsies (VA) were used to ascertain cause of death.
Papers 3 and 4 utilized data from baseline and follow-up in Cuatro San-tos. A total of 4,451 and 5,037 households were interviewed in 2004 and 2009, and a panel of 3,852 households was set up to represent the house-holds present in both years.
Data collection For papers 1 and 2, female field workers conducted interviews with mothers in a private setting. Supervisors carried out quality control during fieldwork. If an error was found in the questionnaire, the field worker returned for a re-interview. Data collection was facilitated by the use of a local events calen-dar to approximate the dates of births and deaths. Age of the mother at deliv-ery, parity, and domicile was also obtained. Birth histories of mothers who migrated from the study area were not updated, but such histories were col-lected from mothers who migrated into the area.
The HDSS recorded data for those child deaths that occurred to mothers residing in the study area. A VA was used to ascertain the cause of death in the study area. This standard VA was developed by WHO and INDEPTH and was translated from English to Spanish and adapted to the context (105). Three physicians in León and two in Cuatro Santos read the VAs and deter-mined the most probable cause of death using the International Classification of Diseases, 10th edition. One VA for neonatal and another for deaths that occurred between 28 days and 59 months of life were utilized.

27
Table 3. Research methods utilized in papers 1 to 4 Papers Study area Study design
and period Sample Size Exposure Outcome
Paper 1 León munici-pality
Retrospective survey, 1970 to 2005
49,972 births Maternal education
Under-five mortality; neonatal mortality
Paper 2 León munici-
pality and Cuatro Santos
Retrospective survey, 1990 to 2005 in León and 1990 to 2008 in Cuatro Santos Verbal autop-sies
24,385 births in León 12,879 births in Cuatro Santos 59 in León, and 39 in Cuatro Santos
Maternal education Domicile (urban León, rural León, and Cuatro Santos)
Under-five mortality Under-five mortality
Paper 3 Cuatro Santos Household
cohort, 2004-2009 Panel of poor households, 2004 to 2009
4,451 house-holds (2004)-HDSS base-line; and 5,037 house-holds (2009)-follow-up 3,852 house-holds
Microcredit, home garden, and technical education
Poverty tran-sition (poor to non-poor)
Paper 4 Cuatro Santos Descriptive,
2004 to 2009 4,451 house-holds (2004), baseline and 5,037 house-holds (2009), follow-up
Poverty clus-ters
Microcredit, home garden-ing, and tech-nical training Education, gender equity education, selected health MDG
In papers 3 and 4, data on housing conditions, literacy, and reproductive issues from the HDSS in Cuatro Santos in 2004 and 2009 were used. By 2009 a questionnaire asking for participation in interventions related to in-stallation of piped drinking water and latrines, microcredit, participation in home gardens, and telecommunications was added during the HDSS update of all households. The spatial position of every household in the HDSS was determined with Geographical Position System technology.

28
Community interventions in Cuatro Santos In October 1998, Hurricane Mitch struck Nicaragua, affecting 867,752 peo-ple (one-fifth of the population), severely damaging the country’s infrastruc-ture (roads, agriculture, homes) and economy, and killing 3,045 people (106). The region mostly affected was the northern part, where Cuatro San-tos is located. In the 14 years since, the local government and non-governmental organizations (NGOs) have launched a series of interventions in microfinance, home gardening, technical training, telecommunications, Internet, housing construction, school breakfasts, safe drinking water, and sanitation (107).
Microcredit A small-scale microcredit project began in 1998, just before Hurricane Mitch struck. Since then, two NGO microfinance banks called CEPRODEL and the NGO APRODESE began to provide loans in Cuatro Santos. CEPRODEL loans varied from US $1,000 to US $5,000; APRODESE loans were up to US $250. The main purpose of the loans was to finance agricultural and in-dustrial activities. It is estimated that about US $5 million was invested in microcredit programs in Cuatro Santos.
Home gardening Home gardens were encouraged in the area through a participatory process of farm planning. The main products for cultivation were vegetables, fruits, cassava, corn, and beans. Most of the harvest was for consumption, but some could be sold to pay for uniforms and school supplies for the children. An estimated of 800 families have participated in the seed project bank (Elmer Zelaya Blandón, personal communication, September 2012).
Technical training An educational center was established in Cuatro Santos offering courses free of charge. The classes, which ran from 700 to 1,300 hours, were certified by National Technological Institute (INATEC). According to INATEC 1,600 women and men have been trained in carpentry, soldering, electricity, com-puter science, baking, agriculture, and solar energy, between 1998 and 2012. Some students who graduated also received a small credit with which to purchase basic equipment and start their own business, and the best students were given scholarships to study at the university.
Safe drinking water Local governments and NGOs have provided safe drinking water to approx-imately 27% of the houses that had not such access. However, since water systems are driven by pumps that require electricity, which in turn is only available along the main road, remote households could be benefit from the
29
safe water initiative. However, recent actions are giving priority to commu-nities further than 5 km from the man road by using gravity or renewable energy systems.
School breakfasts A food intervention was implemented to attract children to enter the public school system. It focused mainly on primary schools and consisted of a glass of milk fortified with vitamins A and D, and a cookie made of soy. The pro-gram initially began in a village school in Cuatro Santos. After three weeks, 30 children who had dropped out returned to school. In 2002, two municipal-ities in Cuatro Santos adopted this program in their schools. By 2007, the Ministry of Education had instituted student breakfasts in all public schools in Nicaragua, an action that the National Parliament made into law.
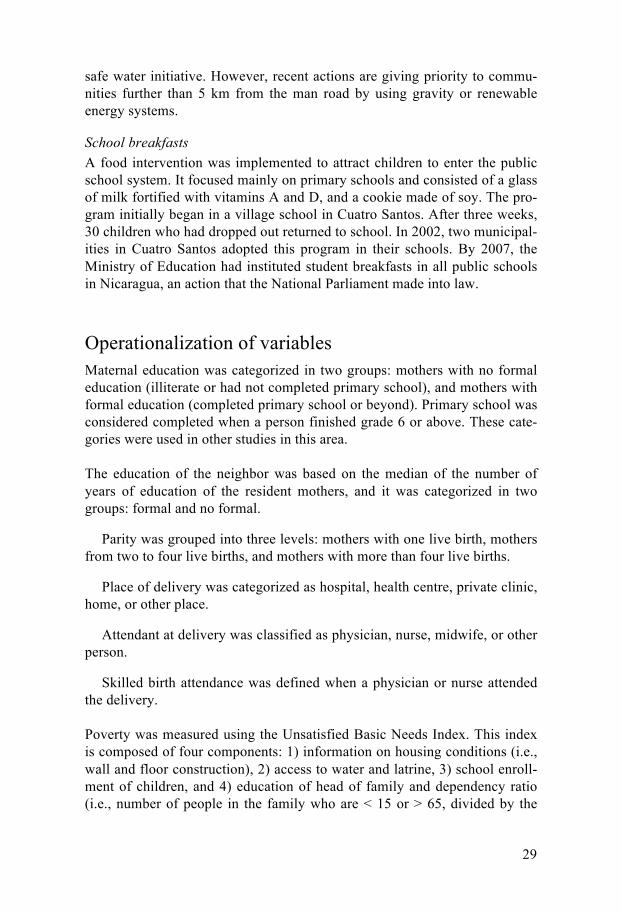
Operationalization of variables Maternal education was categorized in two groups: mothers with no formal education (illiterate or had not completed primary school), and mothers with formal education (completed primary school or beyond). Primary school was considered completed when a person finished grade 6 or above. These cate-gories were used in other studies in this area.
The education of the neighbor was based on the median of the number of years of education of the resident mothers, and it was categorized in two groups: formal and no formal.
Parity was grouped into three levels: mothers with one live birth, mothers from two to four live births, and mothers with more than four live births.
Place of delivery was categorized as hospital, health centre, private clinic, home, or other place.
Attendant at delivery was classified as physician, nurse, midwife, or other person.
Skilled birth attendance was defined when a physician or nurse attended the delivery.
Poverty was measured using the Unsatisfied Basic Needs Index. This index is composed of four components: 1) information on housing conditions (i.e., wall and floor construction), 2) access to water and latrine, 3) school enroll-ment of children, and 4) education of head of family and dependency ratio (i.e., number of people in the family who are < 15 or > 65, divided by the
30
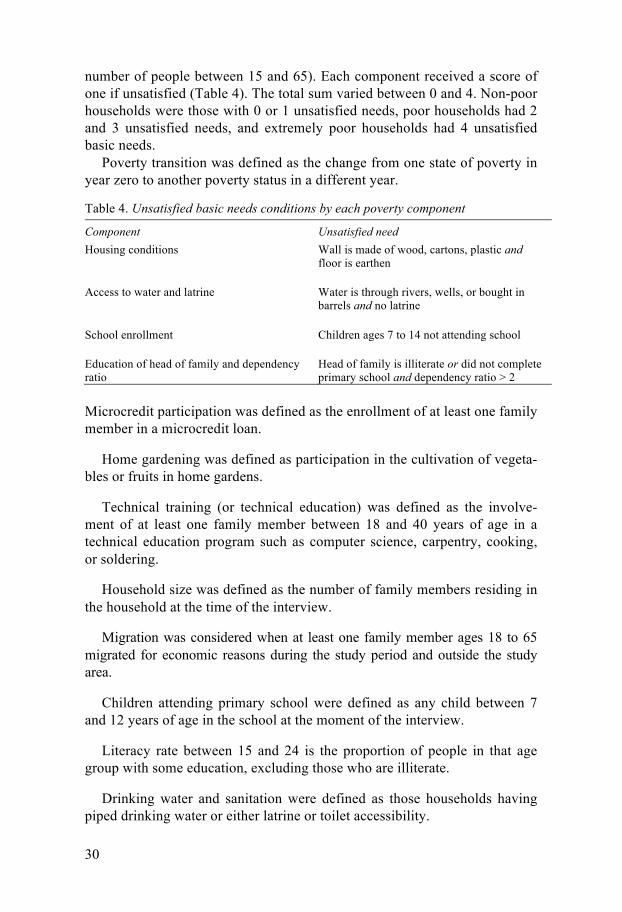
number of people between 15 and 65). Each component received a score of one if unsatisfied (Table 4). The total sum varied between 0 and 4. Non-poor households were those with 0 or 1 unsatisfied needs, poor households had 2 and 3 unsatisfied needs, and extremely poor households had 4 unsatisfied basic needs.
Poverty transition was defined as the change from one state of poverty in year zero to another poverty status in a different year.
Table 4. Unsatisfied basic needs conditions by each poverty component
Component Unsatisfied need Housing conditions Wall is made of wood, cartons, plastic and
floor is earthen Access to water and latrine Water is through rivers, wells, or bought in
barrels and no latrine School enrollment Children ages 7 to 14 not attending school Education of head of family and dependency ratio
Head of family is illiterate or did not complete primary school and dependency ratio > 2
Microcredit participation was defined as the enrollment of at least one family member in a microcredit loan.
Home gardening was defined as participation in the cultivation of vegeta-bles or fruits in home gardens.
Technical training (or technical education) was defined as the involve-ment of at least one family member between 18 and 40 years of age in a technical education program such as computer science, carpentry, cooking, or soldering.
Household size was defined as the number of family members residing in the household at the time of the interview.
Migration was considered when at least one family member ages 18 to 65 migrated for economic reasons during the study period and outside the study area.
Children attending primary school were defined as any child between 7 and 12 years of age in the school at the moment of the interview.
Literacy rate between 15 and 24 is the proportion of people in that age group with some education, excluding those who are illiterate.
Drinking water and sanitation were defined as those households having piped drinking water or either latrine or toilet accessibility.

31
Statistical analysis In paper 1, neonatal, infant, and under-five mortality rates were measured from 1970 to 2005. To reduce random variation in the time series of mortali-ty, rates were smoothed using 3 years moving averages. The U5MR trend was stratified by domicile (urban vs. rural). The place of delivery and at-tendance at birth between 2003 and 2005 was measured and stratified by domicile, and tested using Chi2. Significant differences were assessed when p < 0.05. Cox regression was used to measure inequality in neonatal and under-five mortality by maternal education and reported as a hazard ratio and its 95% CI over the course of three time periods from 1970 to 2005. The model was adjusted by parity and domicile.
In Paper 2 the U5MR and AARR of the U5MR were compared in urban León, rural León, and Cuatro Santos between 1990 and 2008 with smoothed rates. The projected U5MR by 2015 in each setting was calculated in two scenarios: the first considered an AARR of 4.4% (the required to achieve MDG4), and second used the last observed AARR. A Cox regression with robust standard errors was conducted between the level of education of the mother relative to the level of education of the neighborhood and under-five mortality for three time periods: 1990 to 1994, 1995 to 1999, and 2000 to 2005. The model was adjusted for maternal age, parity, and domicile (urban León, rural León, and Cuatro Santos). The proportion of deaths by cause was measured for all deaths that occurred after the HDSS baseline.
In paper 3, poverty levels were measured in 2004 and 2009. The amount of participation in the interventions was compared between the non-poor, poor, and extremely poor in 2004 and 2009. Significant differences were considered when the 95% CI overlapped.
The association between interventions and the poverty transitions was as-sessed using propensity score (PS) models to balance the distribution of con-founders between the intervention and the control group. For each of the interventions (microcredit, home gardening, and technical training) PS val-ues were computed using logistic regression. The predictors for the PS were the others two interventions as long as the sex head of household, age of head of household, and presence of at least one person between 15 and 65 years of age who out-migrated from the study area to another place for eco-nomic reasons (i.e., employment). Once the PS was computed, the interven-tion and the PS values were then included in a multivariate model where the transition from poor to non-poor was the outcome. The prevalence ratio (PR) with its 95% CI measured the association between participation in the inter-vention and the poverty transition (from poor to non-poor). The c-statistic and the Brier’s score were used to assess the predictive capacity of the mod-el. Values for the c-statistic > 0.80 or a Brier’s score < 0.25 were considered good.

32
For paper 4, we compared selected MDG obtained from the HDSS in Cu-atro Santos in 2004 and 2009. Poverty, education, educational gender equali-ty, under-five mortality, skilled birth attendance, adolescent birth rate, access to safe drinking water, and sanitation were target indicators. The level of participation in interventions was assessed. Therefore, we computed the proportion cumulative interventions in 2004 and 2009, so that by 2009 the total number of interventions is included (some interventions happened be-fore the HDSS baseline).
We conducted a spatial cluster analysis using a spatial scan statistics test for poverty in 2004 and 2009, and for the total number of interventions a house had participated in. Interventions included were safe drinking water, latrines, microcredit, home gardening, and technical training. In this geo-graphical analysis a high cluster and a low cluster were derived. High clus-ters occurred when the observed frequency of the event (poverty or interven-tion) is higher than expected; conversely, low clusters occur when that fre-quency is lower than the expected. If there is no difference between the ob-served and the expected frequencies, there is no clustering. Significant spatial clustering was considered when the p-value was less than 5%.
A multinomial logistic regression was performed in order to examine the odds of single interventions on the poverty clusters. These clusters were those identified using the spatial technique. The independent variables were cumulative participation in the interventions in 2004 and 2009. The depend-ent variable was coded as high cluster, low cluster, and no cluster. No cluster was considered the category of reference. The OR with its 95% CI were used to measure the odds of receiving the single intervention. The association was positive when the OR > 1 (meaning a high odds of receiving the interven-tion), and negative when OR < 1 (meaning a low odds of receiving the inter-vention). Significance was assessed when 1 was not included in the 95% CI of the OR.
All data used in this thesis were stored in Microsoft Access 2000. The sta-tistical analysis was performed with SPSS 20.0 and Stata 12.0. SatScan free software and ArcGIS 3.0 were used for the spatial analysis.
Ethics considerations The Ethic Committee of the National University of León, Nicaragua, ap-proved the HDSS in León and Cuatro Santos. During fieldwork, informed verbal consent was obtained from the head of household and from mothers interviewed. All participants were told they could discontinue the interview at any time and without having to give any reason. Meetings were held in the community to disseminate the results of the study.

33
Results
Child mortality and inequality: Papers 1 and 2
Progress toward MDG4 In León the U5MR rate dropped from 105 per 1000 live births to 28 per 1000 between 1990 and 2005. The IMR trend was almost the same as the U5MR. Neonatal mortality decreased, but after 1998 the neonatal mortality rate (NMR) increased from 10 per 1000 to 19 per 1000. In the early 1970s, neonatal deaths accounted for 45% of all under-five deaths; and from 2003 to 2005 it increased to 83%. Only 3% of all deliveries occurred at home, more so in rural (9.6%) than in urban areas (0.5%). Deliveries with skilled birth attendance were higher (p < 0.01) in the urban (99.4%) than rural areas (88%).
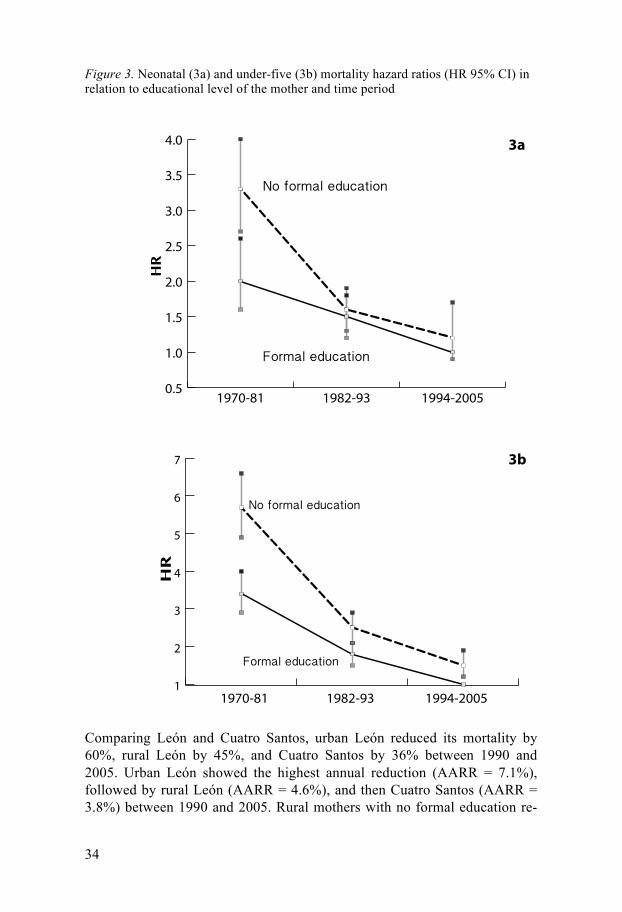
The U5MR was higher in rural than in urban areas (p = 0.01). In 1993 the percentage of women with formal education was 37%, rising to 72% in 2002. The U5MR declined to 66% in the no formal education group and to 71% in the formal education group. Mothers with formal education had low-er a U5MR than mothers with no formal education; in both groups the rate showed a reduction. The gap in neonatal and under-five mortality by mater-nal education (no formal education vs. formal education) was reduced be-tween 1970 and 2005 (Figure 3a and 3b). The gap was pronounced during the period 1970–1981. However, between 1982 and 1993, the gap was very small for neonatal mortality and differences were not significant. For the period 1994–2005 the gap tended to increase, but significant differences were observed only in under-five mortality.
34
Figure 3. Neonatal (3a) and under-five (3b) mortality hazard ratios (HR 95% CI) in relation to educational level of the mother and time period
Comparing León and Cuatro Santos, urban León reduced its mortality by 60%, rural León by 45%, and Cuatro Santos by 36% between 1990 and 2005. Urban León showed the highest annual reduction (AARR = 7.1%), followed by rural León (AARR = 4.6%), and then Cuatro Santos (AARR = 3.8%) between 1990 and 2005. Rural mothers with no formal education re-

35
ported an AARR of 0.7%, the lowest percentage of any subgroup in the study (Figure 4). By 2015, the expected U5MR using an AARR = 4.4% will be: 16.2 per 1000 in urban León, 18.4 per 1000 in rural León, and 13.7 per 1000 in Cuatro Santos. On the other hand, the expected U5MR by 2015 based on the observed AARR indicates that the three settings will meet the goal, but urban León will reach it before that deadline.
Between 1990 and 1994, the highest risk of mortality occurred among mothers with no formal education whose neighbors also had no formal edu-cation (HR = 1.7; 95% CI, 1.2–2.5), while the lowest risk was among moth-ers with formal education residing among neighbors with formal education (HR = 1.1; 95% CI, 0.9–1.5) (Table 5). During the two time periods (1995 to 1999 and 2000 to 2005), the association between maternal education relative to the education in the neighborhood was not significant.
Table 5. Maternal education and the relative education in neighborhood on under-five mortality in León and Cuatro Santos, Nicaragua, 1990 to 2005 Education (mother–neighborhood)
Hazard Ratioa 95% CI
1990–1994 Formal–Formal 1.1 0.9–1.5 Formal–No formal 1.6 1.1–2.3 No formal–Formal 1.4 1.07–2.0 No formal–No formal 1.7 1.2–2.5 1995–1999 Formal–Formal 0.7 0.5–1.06 Formal–No formal 0.9 0.5–1.4 No formal–Formal 1.2 0.7–1.9 No formal–No formal 1.2 0.8–1.7 2000–2005 Formal–Formal 1 Formal–No formal 1.1 0.7–1.7 No formal–Formal 1.2 0.7–2.1 No formal–No formal 1.4 0.9–2.2 a Adjusted for domicile (urban León, rural León, and Cuatro Santos), maternal age, and parity

36
Figure 4. Under age five mortality rate and annual average reduction rate (AARR) by maternal education and time period in León (urban and rural) and Cuatro Santos, Nicaragua, 1990 to 2008, expressed as three-year moving average
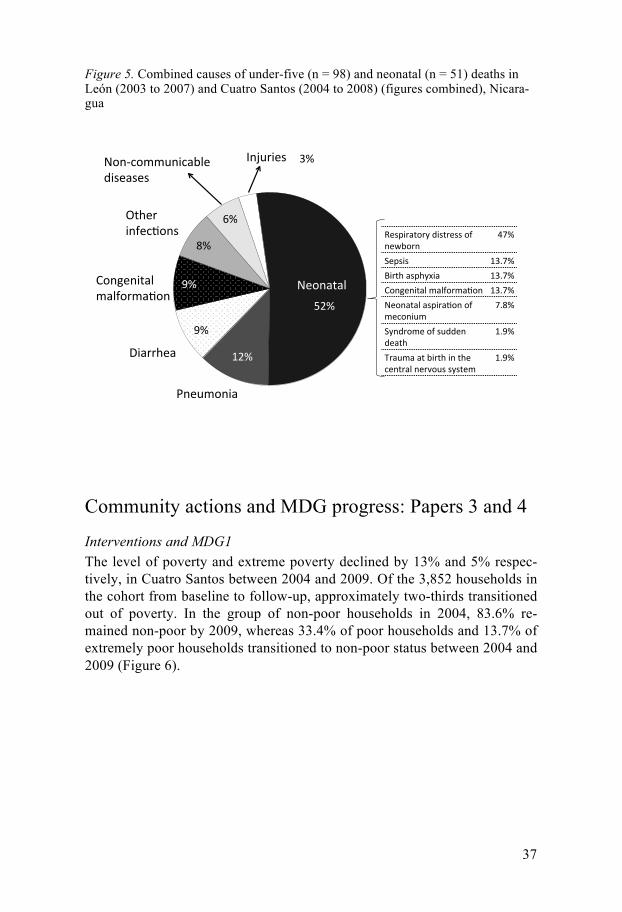
Causes of child deaths A total of 98 under-five VAs were performed, 59 in León and 39 in Cuatro Santos (Figure 5). In León, 3 VAs were refused by interviewees and 9 could not be conducted because the parents had migrated away from the area. In Cuatro Santos, only one VA could no be performed due to out-migration. Neonatal mortality was the primary cause of death in both settings. The per-centage was greater in León (59%) than in Cuatro Santos (40%). Sixty per-cent of the deaths occurred in a hospital, 5% in a health centre, and 35% at home. Respiratory distress was the main cause of neonatal death in León and Cuatro Santos. Pneumonia and diarrhea were the first and second causes of death after the first month.
For those deaths that occurred after the first month but before five years of age, most deaths in León were in the hospital (83%). In Cuatro Santos 58% of the deaths in the same period took place at home or somewhere other than hospital or health centre. Diarrhea and pneumonia accounted for 66% of the deaths of children under age 5 in León after the first month of life and 45% in Cuatro Santos.
0!
10!
20!
30!
40!
50!
60!
70!
1991!93! 95! 94! 99! 01! 03!04! 1991!93! 95! 97! 99! 01! 03!04! 1991!93! 95! 97! 99! 01! 03! 05! 07!
AARR = 6.2%!
AARR = 5.5%!
AARR = 0.7%!
AARR = 7.7%!
AARR = 3.2%!
AARR = 3.5%!
Urban León! Rural León! Cuatro Santos!
Dea
ths
per
1000
live
bir
ths!
No formal education!Formal education!
Period!
37
Figure 5. Combined causes of under-five (n = 98) and neonatal (n = 51) deaths in León (2003 to 2007) and Cuatro Santos (2004 to 2008) (figures combined), Nicara-gua
Community actions and MDG progress: Papers 3 and 4
Interventions and MDG1 The level of poverty and extreme poverty declined by 13% and 5% respec-tively, in Cuatro Santos between 2004 and 2009. Of the 3,852 households in the cohort from baseline to follow-up, approximately two-thirds transitioned out of poverty. In the group of non-poor households in 2004, 83.6% re-mained non-poor by 2009, whereas 33.4% of poor households and 13.7% of extremely poor households transitioned to non-poor status between 2004 and 2009 (Figure 6).
!"#$
!"#$
%"#$
&#$
&#$
'#$
(#$
)#$
*+,-./+01$
201334,1$
5/+6,+0718$.189/3.1:/+$
;74,3$$0+9,<:/+=$
>/+?</..-+0<1@8,$A0=,1=,=$
B+C-30,=$
D,=E0317/3F$A0=73,==$/9$+,G@/3+$
HI#$
J,E=0=$ %)KI#$
L0374$1=E4FM01$ %)KI#$
5/+6,+0718$.189/3.1:/+$ %)KI#$
>,/+1718$1=E031:/+$/9$.,</+0-.$
IK'#$
JF+A3/.,$/9$=-AA,+$A,174$
%K&#$
N31-.1$17$@0374$0+$74,$<,+7318$+,3O/-=$=F=7,.$
%K&#$
>,/+1718$

38
Figure 6. Panel of households that transitioned out of poverty from 2004 to 2009 (n = 3,852)
Interventions with regard to safe water, latrines, microcredit, home garden-ing, and technical training increased since 1990, although most interventions were implemented between 2005 and 2009. In analyzing the distribution of these interventions by poverty level, non-poor people tended to be given more microcredit assistance (Table 6). However, no significant differences were observed in the distribution of home gardening interventions. In 2004, technical training was unequal, however, by 2009 differences were not sig-nificant.
Table 6. Distribution of microcredit, home gardens, and technical training interven-tions rate per 1000 by poverty level, Cuatro Santos, Nicaragua, 2004 and 2009
Program 2004 2009 Microcredit Population ages 15–65 Population ages 15–65 Non-poor 3,044 2.3 (7) [1.0–4.9]a 6,229 27.9 (174) [24.0–32.4] Poor and extremely poor 9,039 1.2 (11) [0.6–2.2] 8,439 14.8 (125) [12.3–17.6] Home gardens Households Non-poor 1,095 6.4 (7) [2.8–13.7] 2,111 36.0 (76) [28.6–45.0] Poor and extremely poor 3,356 6.9 (23) [4.4–10.4] 2,926 40.0 (117) [33.3–47.8] Technical training Population ages 18–40 Non-poor 1,831 12.6 (23) [8.1–19.1] 3,514 14.2 (50) [10.6–18.8] Poor and extremely poor 5,228 2.7 (14) [1.5–4.6] 4,980 13.8 (69) [10.8–17.5] aData are presented as rate (n) with 95% CI. Italics indicate significant differences
!"#$%&
'$#"%&
(#'%&
""#)%&
$"#!%&
*#!%& +%&
'"#+%&
+,#"%&
-./01..2&3&/&4&,+,5&
6..2&3&/&4&*78+)5&
9:;2<=<>?&6..2&3&/&4&*,,5&
!""#$%&'()*+,)-$
!"".$%/0**01234-$
-./01..2&6..2&9:;2<=<>?&1..2&

39
Microcredit (APR = 1.28; 95% CI, 1.14–1.46), home gardening (APR = 1.20; 95% CI 1.02–1.41), and technical training (APR = 1.27; 95% CI, 1.10–1.46) were associated to the transition from poor to non-poor during the pe-riod of the study (Table 7) Table 7. Estimated association between interventions and poverty transition, Cuatro Santos, Nicaragua, 2004 to 2009 (n = 2,574) Intervention Model poor to non-
poor APRa (95%CI) c-statistic Brier’s score for
each propensity score model
Microcredit (yes) 1.29 (1.14–1.46) 0.61 0.16 Technical training (yes) 1.20 (1.02–1.41) 0.66 0.09 Home gardening (yes) 1.27 (1.10–1.46) 0.61 0.11 aAPR: adjusted prevalence ratio
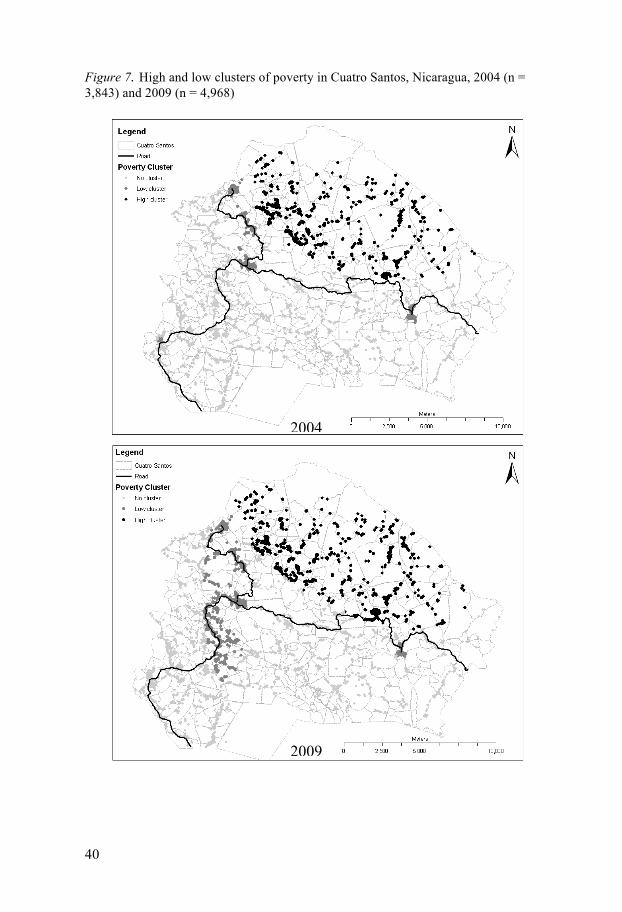
In the spatial analysis in 2004, we found a high cluster of poverty and three small clusters with lower risk of poverty. By 2009, only the high cluster of poverty remained in the same area (Figure 7). Same spatial analysis on inter-ventions showed a large high cluster of intervention in 2004 (Figure 8). However, by 2009 high clusters had disappeared, as well as other small low clusters. A low cluster of interventions appeared in 2009. The multinomial analysis between each intervention and clusters of poverty indicated that technical training and safe water installations were positively associated (OR > 1) with clusters of low poverty in 2004, but technical training, home gar-dening, and latrines were negatively associated (OR < 1) in high clusters high poverty. The same analysis in 2009 showed that in low clusters of pov-erty all the interventions were positively associated except home gardening, and in high clusters of poverty microcredit, safe water, and latrines were negatively associated.
Other MDG in Cuatro Santos We reported the trend of other MDG in Cuatro Santos by 2004 and 2009. For the MDG2, the enrollment of children of school age was 88% in both years. The literacy rate of people ages 15 to 24 increased from 93% in 2004 to 97% by 2009. MDG3, the gender parity index (girls vs. boys) showed that primary school enrollment there was not inequality gap, but in secondary education the gender parity index was 1.2 in 2004 and 1.3 in 2009. The ado-lescent birth rate declined from 61/1000 to 48/1000 in the same period. The percentage of people with access to piped drinking water increased from 18% to 28%. Access to toilets or latrines was 73% in 2004 and increased to 80% by 2009.
40
Figure 7. High and low clusters of poverty in Cuatro Santos, Nicaragua, 2004 (n = 3,843) and 2009 (n = 4,968)
2004
2009

41
Figure 8. High and low clusters of any intervention in Cuatro Santos, Nicaragua, 2004 (n = 3,843) and 2009 (n = 4,968)
2004
2009

42
Discussion
The MDG4 progress
Under-five mortality reduction, newborn survival challenge The decline of child mortality in Nicaragua is well known (108-110). Reduc-tions were initiated even before the MDG, when the national political agenda focused on improving the health of socio-economically disadvantaged popu-lations, such as women and children in remote rural areas (77,111,112). De-creasing mortality related to infectious diseases contributed greatly to in-creasing child survival.
In our study of the León municipality, this trend was also observed. Since 1997 child mortality has dropped to a level where most under-five deaths occur during the first month of life. This pattern is also found in other LMIC, suggesting that more emphasis on the health of newborns is needed to achieve MDG4 by 2015 (113,114). Newborn survival is greatly dependent on a country’s health system. In León, most deliveries take place in hospitals and are attended by a physician. In the early 1990s an intervention was car-ried out in León’s regional hospital that reduced neonatal mortality from 56/1000 to 11/1000 live births from baseline in 1985 to 1993 (115). The intervention involved weekly audits and introduction of educational and hygienic measures among the neonatology staff. On the community level, the NMR since 1985 has been reduced to 10/1000, although it has since in-creased.
Equitable child survival by maternal education Social inequalities decelerate progress toward MDG4. Maternal education has been studied as one of the SEP indicators associated with child survival (116-120). Mothers with greater knowledge understand healthcare instruc-tions, and are familiar with access to health services, and implement preven-tive measures to improve child health and survival (119). It is estimated that an increase of one year of maternal education will reduce child mortality by 9% (121)

43
Statistics from the Demographic Health Survey 2006–07 in Nicaragua re-port that illiterate mothers experience up to three times greater child mortali-ty than mothers with some education (122). This gap is greater than that found by comparing child mortality between the lowest and the highest quin-tiles of wealth.
In the areas we studied, maternal education resulted in reductions in both neonatal and under-five mortality. According to the inverse equity hypothe-sis, the reduction of mortality would occurred first in groups of mothers with formal education and later in mothers with no formal education (64). How-ever, this was not the case in the León municipality or in Cuatro Santos. Access to education especially for women has improved; for example, at the national level it is reported that the education of women who are of repro-ductive age increased from 33% in 1998 to 76% in 2006–2007. This pro-gress enhances the opportunities to improve economic conditions and access to health services for women. Recently, a study found that countries with rapid expansion of life saving interventions were narrowing inequalities (67).
Despite the overall reduction showed in rural León to meet MDG4 by 2015, inequalities have widened. The AARR indicated that the child mortali-ty rate among mothers with no formal education will make it impossible to achieve the millennium goal, perhaps suggesting that the inverse equity hy-pothesis is occurring in this area.
We found the educational mortality gap in the remote rural area of Cuatro Santos to be smaller than in the rural area of León. Both regions share simi-larities in work activity, with agriculture and raising livestock being the main sources of income. Moreover, rural León has more access to health services, while in Cuatro Santos severe cases need to be transported by ambulance to the nearest hospital 130 km away. This child mortality pattern has been found in other places. For example, one study in Brazil found that child mor-tality in remote areas was the lowest (123). Furthermore, evidence from Mil-lennium Villages in Africa indicates that child mortality is lower in areas where community interventions have been established than in non-millennium villages (124). Such community actions may strengthen social cohesion among the villagers.
Social cohesion is the capacity of people to create an environment of trust among one another (125). One study in a poor area in Ethiopia found that increased social networking among women of reproductive age was associ-ated with an improvement in child survival (126). Similarly, a study by Peña et al. (2000) in León found that infant mortality was lower among poor mothers residing in a poor neighborhood than among poor mothers with non-poor neighbors, perhaps the result of a strong social network when people share the same socio-economic position (110). A study in rural areas of Bu-tajira found that people who did not participate in organizations had the highest risk of child mortality (127). Cuatro Santos is an area that has recent-

44
ly experienced positive socio-economic development: NGOs and the local government are involving people in projects, and this may be increasing the social cohesion of the population more than in other places such as the León municipality. These issues need to be explored further, especially in León, where data on participation in interventions has not been collected.
Urban–rural differences in mortality The locations we have studied are all on track toward MDG4, and are likely to meet that goal by 2015. Mortality in the urban area of León was lower than in rural León and Cuatro Santos. This difference is consistent with evi-dence from other settings in LMIC (128). In urban areas, certain socio-economic indicators tend to be better than in rural areas, and access to health services is clearly more available. However, although urban León has health centres, a referral hospital, and private clinics according to the trends from 1997 to 2005, child mortality has increased. The same has occurred in other places, suggesting that urbanization may have a negative impact on child survival for populations that have settled (e.g., slums) where environmental conditions are not good for health (129).
Community interventions to achieve MDG1 Interventions that reduce poverty have been innovative and on the increase. If they are successful, the poor will become non-poor, something described in the literature as a poverty transition (130,131). We assessed the poverty in Cuatro Santos using the Unsatisfied Basic Need Index (UBNI). We found poverty to be high there, and greater than at the national level. However, the reduction reported was larger than at the national level. But poverty assess-ment reports have shown that despite poverty being higher in rural than ur-ban areas, reduction has been achieved more rapidly in rural areas (132).
In rural areas, the reduction of poverty has focused on investment in agricul-ture and livestock. However, non-farm activities have been gaining ground in improving the rural economy. We assessed the association between a set of community developmental interventions and the transition of families from poor to non-poor status.
Safe water and sanitation Providing safe drinking water and sanitation are both targets for MDG7. Progress toward this goal advances MDG1 and other MDG as well. Lack of these basic needs is linked to poor health (133). Child health is dependent on these essentials. Diseases related to the lack of safe drinking water and sani-tation may increase financial costs (e.g., transport or medicine) that pro-foundly affect the low financial resources of rural families. Also, rural fami-
45
lies have traversed great distances to obtain safe drinking water, and children are often responsible for this task.
We found that the access to piped drinking water increased from 18% in 2004 to 28% in 2009. Similar figures are found at the national and interna-tional level from rural areas (17,103). A study conducted in Cuatro Santos found that water installations were inequitably distributed: households close to the main road had more benefit of that intervention because water installa-tion depends on access to electrical power. Latrine interventions have in-creased in the area, reaching a proportion of 80%, higher than that reported on the national level; similar figures have been reported in the rural area of the León municipality.
Microcredit, home gardens, and technical education Findings from Cuatro Santos revealed that microcredit, home gardens, and technical training were associated with poverty transition from poor to non-poor. This initiative began in Bangladesh with founding of the Grameen Bank as an alternative to incentivize investment among the poorest, help reduce, and increase growth in LMIC (134,135).
The impact of microcredit on different components of poverty has been found heterogeneous in LMIC. Some methodological aspects of studies that have been conducted prevent us from getting a clear picture of the role of microcredits. Randomized control trials are best able to evaluate the effect of interventions like microcredit, but this interventions design is less used in many contexts.
A systematic review of studies conducted in sub-Saharan Africa found a positive impact of microcredits on housing investment. Negative associa-tions were found with regard child educational enrollment. In one country, school enrollment was higher for boys than girls among microcredits clients (136). Moreover, microcredit was found to have no impact on job creation. On the other hand, a review of studies in Latin America found more positive associations between microcredits and housing investment, business perfor-mance, education, and school enrollment (137). We found microcredit par-ticipation higher among the non-poor than it was for the poor and extremely poor population. This pattern has also been found in other settings in Latin America (138). High interest rates in applying for a loan might limit poor and extremely poor people from seeking microcredit.
Our findings indicate that participation in home gardening was associated with a poverty transition from poor to non-poor. The involvement in this activity was equal between poor or extremely poor and non-poor households. Home gardening is an agricultural intervention where a small plot of land is used for to cultivate crops (139). The gardens are generally close to the household and are more common in rural areas. The impact of home garden-ing varies according to the literature. Most reports are focused on nutritional

46
outcomes (e.g., consumption, diet, vitamin A, and child anthropometric indi-cators), and few consider the direct effect on poverty reduction.
Between the association of home gardening and nutritional outcomes, household income generation is a mediating factor. A systematic review performed in sub-Saharan settings found five studies where home gardening improved household income, however, only one showed significant differ-ences (140). A broader review in several worldwide regions found seven out of nine studies where home gardening strengthened human capital with the use of nutritional education and gender considerations, especially because women were the principal managers of home gardens. Four out of these sev-en studies showed that home gardening improved household income (141). A study in Bangladesh also concluded that women involved in home garden-ing gain power for making decisions, raise family income, and contribute more to the household (i.e., education, clothing, and health). However, re-views find that most studies of this kind exhibit methodological problems that limit conclusions on the benefits of home gardens, as those studies gen-erally do not reach statistical power.
Our study did not measure the income generated from home gardens. However, as stated earlier, depending on the size, type of crops, and seasons, a part of the produce may be sold to complement needs in the household. A study of Nicaraguan families with home gardens revealed that at least 60% of the family income came from the home gardens (142). The general popu-lation might also gain benefit from the fruits or vegetables available through home gardens, and home gardens may enhance their participation in other social programs such as safe water or sanitation.
Technical training or technical and vocational education programs provide skills for work; generally it is to those who have not completed secondary school, for whom it may accelerate their entry into the labor market (143). Traditionally, technical training was considered as a poor educational choice and with higher costs than the general education (i.e., secondary), but less expensive than a career at the university. In rural areas this type of education may encourage the disadvantage to continue their formal studies, but in a way that will generate income. However, access to technical training still is unequal in many countries. For example, in India access to technical training in rural areas is 3%, but in urban it is 6%. A similar situation was observed in sub-Saharan African countries such as Tanzania (144), where access to a non-farm related job is difficult, technical training might be seen as an in-vestment (145). Thus, a study performed in Uganda found that young people are more likely to pursue a technical education when they have access to unconditional credit (146).
Technical education was found to be unequal between poor or extremely poor and non-poor people in 2004, but this gap disappeared by 2009. How-ever, technical training was also associated with a reduction of poverty in

47
our panel of households. In Nicaragua, unemployment is higher in rural than in urban areas, but the proportion of people with a technical education is higher in rural (48%) than in urban (28%) areas (103). The returns from technical training may be through self-employment, migration to other plac-es for a job with a better salary, or continuing to study at a higher level.
Spatial clustering has had many applications in public health surveillance (147). The identification of clusters for certain health conditions helps to prioritize interventions. We have used this technique to identify concentra-tions of poor households and community interventions. We found that high clusters of poverty overlapped with clusters with low coverage of total inter-ventions. Participation in some individual interventions (e.g., microcredit, safe water, and latrines) was more likely to be found in high clusters of households of low poverty; by contrast, home gardening participation was found less in clusters of low poverty.
Methodological considerations
Papers 1 and 2: Child mortality For this study, child mortality was measured using full birth histories (148,149). This method is used in settings without good registration systems but may be the subject of biases. One such is recall bias, which occurs when the respondent does not remember when either childbirth or death took place. Early deaths (e.g., neonatal) might be underreported due to this bias in mothers with low SEP. A local calendar with dates of special events aided during the data collection to narrow down the precise dates of mortality reg-istered in the HDSS.
Maternal deaths, in-migration, and out-migration may also affect child mortality estimation, and its differentiation by SEP. Births histories were not obtained for mothers who had died. However, the magnitude of maternal mortality in Nicaragua and mainly in the region where the study was per-formed is less likely to bias our child mortality estimations. Background characteristics of mothers involved in internal migration may differ from the rest of the population in place of origin or destination. However, no data about migration status of mother was asked before the baseline. This issue should be explored more closely in future studies.
Education was measured at the moment of the interview in León and Cu-atro Santos. A misclassification bias might have occurred for differences in mortality by maternal education for long periods of time before the date of the interview. Mothers may have improved their educational level from non-formal to formal, and this could consequently result in underestimating the mortality level of the non-formal educational group in the past. After the

48
baseline of the HDSS, this type of bias has been minimized in continually updating figures on maternal education.
The low rejection rate (< 0.1%) of participation during interviews report-ed in both settings enhances the ability to generalize our results to other are-as. However, both settings are located in the Pacific region of Nicaragua and findings of this study cannot be generalized to areas such as the Central and Caribbean regions of the country, where life styles differ from those in our study. During the last year of the study period, the number of child deaths grew very small, and in the case of Cuatro Santos, it limited our power to find statistical significance in the analysis regarding social inequalities and child mortality.
Papers 3 and 4: Poverty, interventions, and other MDG In the HDSS, no data for measuring the level of poverty based on the $1.25 subsistence amount was collected. Instead, the HDSS based its poverty as-sessment on unsatisfied basic needs, as previously used in the same areas of Nicaragua.
Data on participation in interventions was obtained only in Cuatro Santos. Information about who provided the intervention was not collected. There-fore, the participation might have been selective for certain population groups. NGOs and government agencies target populations differently, in accordance with their plans. In order to model the complex structure be-tween interventions and poverty transition a propensity score approach was implemented. However, we are aware that residual confounding due to other unobserved variables may remain in this relationship.
Although the HDSS has a longitudinal nature by design, it was not in-tended to measure the numbers of children who began first grade and com-pleted the last grade of primary school, one of the targets of MDG2. For example, children might not continue attending school because of a change in residence, and it cannot be considered as a dropout.

49
Conclusions
At the time of writing, three years remain to the end of the MDG. Since 2000, we have been witnessing how this global commitment has been play-ing out in various countries.
We found that the under-five mortality rate in our study settings in Nicara-gua was reduced sufficiently to achieve MDG4. Narrowing social inequali-ties suggests accelerating progress. Even in the poorest areas, if children of low socio-economic position can benefit from life saving interventions, then achieving MDG4 is possible. Furthermore, efforts to reduce neonatal mortal-ity rate are crucial. A major investment in the provision of healthcare is re-quired to insure an equitable approach to good quality health services so that newborn lives might be saved. The solution exists, if there is a will to put it into place.
We identified a set of interventions associated with the transition from poor to non-poor. Although some of them were unequally distributed, it in-dicates that poor rural populations are motivated to participate in different community actions designed to strengthen social cohesion and combat the poverty. We found that access to safe water is a persistent challenge, particu-larly in remote rural areas. In certain areas where poverty was concentrated, participation in interventions designed to help overcome impoverishment was low.
This thesis reveals the necessity of monitoring aspects of human devel-opment in different social stratifications. Further, this work provides the Nicaraguan government, NGOs and stakeholders working on MDG in simi-lar contexts with transferable and eminent lessons on which interventions have a great impact and how they are being scaled-up. There are undeniable limitations and challenges to be considered when analyzing data, or intro-ducing interventions strategies. Data is an investment for the present and the future. It is hoped that the good will of a nation makes 2015 not only the end of MDG, but the beginning of a new plan— A plan where equity and sus-tainability become bases to reach the next generation of goals.
50
Acknowledgements
This thesis was prepared at the International Maternal and Child Health (IMCH), Department of Women’s and Children Health, Uppsala University, Sweden, in collaboration with the Autonomous National University of Nica-ragua (UNAN-León). I am grateful to the Swedish International Develop-ment Agency (Sida/SAREC) for funding my PhD studies.
None of this would have been possible without the support of my supervi-
sors: Carina Kållestäl, my main supervisor, for your continuous guidance, mo-
tivation, and inspiration during many hours of discussion in this long pro-cess. Your constructive criticism of all my PhD work, as well as the chal-lenge and enrichment you brought to my research are without price in this world. Thank you!
Rodolfo Peña, the person responsible for introducing me to the world of
research in epidemiology. Doctor . . . you always believed in me! Thank you for sharing your knowledge and friendship.
Lars-Åke Persson, who opened the door to my doctoral studies at IMCH.
Your enthusiasm in gathering human resources to improve the health of poor children and women is admirable.
I would also like to appreciate my gratitude to my co-authors: Elmer Ze-
laya Blandón, Leif Eriksson, Katarina Selling, and Sohel Nazmul, who shared their knowledge and thereby improved the manuscripts.
My appreciation to the administrative and academic staff at IMCH, past
and present. Special thanks to Cristina Bachelet for her generous support, Kristine Eklund for solving computer issues, and Birguitta Olsson for taking care of financial matters and ordering books for me. Birguita Essén, for monitoring my progress toward the PhD.
To my fellows from Sweden and Nicaragua, Emma Nga, Mats, Soorej,
Annika, Petrida, Columba, Wahhed, Hanna, Jill, Malin, Wanjiku, Elazar, Amal, Aimable, Ashraful, Duc, Mariano and Claudia, for the good times;

51
and especially to Pauline for checking my English in the abstracts, Shiring for lifting me up when things looked dark, and William Ugarte for being like a brother, providing me with advice and sharing his energy, despite the enormous pressure of his own work.
To all my friends outside of work, especially Mey Ling Cordero, for you
support; Martha Garret and Claes Granqvist for making sure I never felt lonely in Uppsala.
I am deeply grateful to my family. My six-year-old nephew, Jefferson, for
these brief but enthusiastic Skype meetings every Sunday, and for adding so much happiness to my life. I love you with all my heart! Finally, last but not least, My Tía Maura (Aunt Maura) for being the person in charge of my education . . . I am here because of you.
Finis coronat opus
Uppsala October 2012 Wilton Pérez

52
References
1. Bloom DE. 7 billion and counting. Science 2011;333(6042):562. 2. Bhanojirao B. Human development report 1990: Review and as-
sessment. World Development 1991;19(10):1451-1460. 3. Desai M. Human development: Concepts and measurement. Euro-
pean Economic Review 1991;35(2–3):350-357. 4. McGillivray M. The human development index: Yet another re-
dundant composite development indicator? World Development 1991;19(10):1461 - 1468.
5. Kelley AC. The human development index: Handle with care. Population and Development Review 1991:315-24.
6. Hopkins M. Human development revisited: A new UNDP report. World Development 1991;19(10):1469-1473.
7. United Nations. 21 years of human development reports; Availa-ble from: http://hdr.undp.org/en/reports/. Accessed 31 August 2012.
8. United Nations Development Programme. International human de-velopment indicators database;
Available from: http://hdrstats.undp.org/en/tables/. Accessed 31 August 2012.
9. United Nations General assembly. Resolution 2 session 55 United Nations Millennium Declaration. 2000, United Nations: New York.
10. Sachs JD. From millennium development goals to sustainable de-velopment goals. Lancet 2012; 379(9832):2206-11.
11. The World Bank. Poverty & equity data; Available from: http://povertydata.worldbank.org/poverty/home/. Accessed 19 Sep-tember 2012.
12. Fanzo JC, Pronyk PM. A review of global progress toward the mil-lennium development goal 1 hunger target. Food Nutr Bull 2011, Jun;32(2):144-58.
13. United Nations. Millennium development report 2012. Available from: http://www.un.org/millenniumgoals/pdf/MDG%20Report%202012.pdf. Accessed 29 August 2012.
14. UNICEF. Levels and trends in child mortality: report 2012. 2012, UNICEF: New York.

53
15. Lozano R, Wang H, Foreman KJ, Rajaratnam JK, Naghavi M, Marcus JR, et al. Progress towards millennium development goals 4 and 5 on maternal and child mortality: An updated systematic analysis. Lancet 2011;378(9797):1139-65.
16. Word Health Organization, UNAIDS. Global HIV/AIDS response: Epidemic update and health sector progress towards universal ac-cess: Progress report 2011. Geneva: WHO; 2011.
17. Joint Monitoring Programme for Water Supply and Sanitation. Progress on drinking water and sanitation: 2012 update. Geneva: WHO and UNICEF; 2012.
18. Rassool GH. Many countries not on target to reach health-related millennium development goals. J Adv Nurs 2004;46(4):456.
19. Health-related millennium development goals out of reach for many countries. Bull World Health Organ 2004;82(2):156-7.
20. Kmietowicz Z. Some countries make good progress on child and maternal deaths while others stagnate. BMJ 2012;344:e4065.
21. Ebrahim GJ. Millennium development goals as road map to relief of chronic poverty. J Trop Pediatr 2011;57(3):153-6.
22. Bruns B, Mingat A, Rakotomalala R. Achieving universal primary education by 2015: A chance for every child. World Bank Publica-tions; 2003.
23. Lozano R, Wang H, Foreman KJ, Rajaratnam JK, Naghavi M, Marcus JR, et al. Progress towards millennium development goals 4 and 5 on maternal and child mortality: An updated systematic analysis. Lancet 2011;378(9797):1139 - 1165.
24. Adler NE, Ostrove JM. Socioeconomic status and health: What we know and what we don't. Ann N Y Acad Sci 2006;896:3-15.
25. Ravallion M. On multidimensional indices of poverty. Journal of Economic Inequality 2011.
26. Chambers R. What is poverty? Concepts and measures. Poverty in focus. UNDP. International centre (IPC); 2006.
27. Haughton J, Khandker S. Measuring poverty. In: Handbook on poverty and inequality. Washington: The World Bank; 2009. p. 9-35.
28. Rutstein SO, Johnson K, MEASURE. The DHS wealth index. MEASURE DHS; 2004.
29. Clemens MA, Kenny CJ, Moss TJ. The trouble with the MDGs: Confronting expectations of aid and development success. World Development 2007;35(5):735-51.
30. Easterly W. How the millennium development goals are unfair to Africa. World Development 2009;37(1):26 - 35.
31. Steer L, Levy S, Geddes M. Millennium development goals report card: Measuring progress across countries. London: Overseas De-velopment Institute 2010.

54
32. Grantham-McGregor S, Cheung YB, Cueto S, Glewwe P, Richter L, Strupp B. Developmental potential in the first 5 years for chil-dren in developing countries. Lancet 2007;369(9555):60 - 70.
33. UNICEF. The state of the world's children. Celebrating 20 years of the convention on the rights of the child. New York: United Na-tions Children's Fund 2009.
34. UNICEF. State of the world's children 2008: child survival. New York: UNICEF; 2007.
35. Assembly UNG. Convention on the rights of the child. United Na-tions, Treaty Series 1989;1577:3.
36. Mathers C, Fat DM, Boerma JT. The global burden of disease: 2004 update. World Health Organization; 2008.
37. Martines J, Paul VK, Bhutta ZA, Koblinsky M, Soucat A, Walker N, et al. Neonatal survival: A call for action. Lancet 2005;365(9465):1189-1197.
38. Okwaraji YB, Edmond KM. Proximity to health services and child survival in low- and middle-income countries: A systematic review and meta-analysis. BMJ Open 2012;2(4).
39. Schell CO, Reilly M, Rosling H, Peterson S, Ekström AM. Socio-economic determinants of infant mortality: A worldwide study of 152 low-, middle-, and high-income countries. Scand J Public Health 2007;35(3):288-97.
40. Jones G, Steketee RW, Black RE, Bhutta ZA, Morris SS. How many child deaths can we prevent this year? Lancet 2003;362(9377):65- 71.
41. Bhutta ZA, Chopra M, Axelson H, Berman P, Boerma T, Bryce J, et al. Countdown to 2015 decade report (2000-10): Taking stock of maternal, newborn, and child survival. Lancet 2010;375(9730):2032-44.
42. Liu L, Johnson HL, Cousens S, Perin J, Scott S, Lawn JE, et al. Global, regional, and national causes of child mortality: An updat-ed systematic analysis for 2010 with time trends since 2000. Lan-cet 2012;379(9832):2151-61.
43. Bhutta ZA. Dealing with childhood pneumonia in developing countries: How can we make a difference? Arch Dis Child 2007;92(4):286.
44. Bochi-Pinto C, Velebit L, Shibuya K. Estimating child mortality due to diarrhoea in developing countries. Bull World Health Organ 2008;86(9):710.
45. Black RE, Allen LH, Bhutta ZA, Caulfield LE, de Onis M, Ezzati M, et al. Maternal and child undernutrition: Global and regional exposures and health consequences. Lancet 2008;371(9608):243-260.

55
46. Lawn JE, Cousens S, Zupan J, Lancet Neonatal Survival Steering Team. 4 million neonatal deaths: When? Where? Why? Lancet 2005;365(9462):891-900.
47. Lawn JE, Kinney MV, Black RE, Pitt C, Cousens S, Kerber K, et al. Newborn survival: A multi-country analysis of a decade of change. Health Policy Plan 2012;27(suppl 3):iii6-iii28.
48. Paul VK. The current state of newborn health in low income coun-tries and the way forward. Seminars in Fetal and Neonatal Medi-cine 2006;11(1):7-14.
49. Marmot M. Social determinants of health inequalities. The Lancet 2005;365(9464):1099-104.
50. Solar O, Irwin A. A conceptual framework for action on the social determinants of health. Geneva: World Health Organization; 2007.
51. Galobardes B, Lynch J, Smith GD. Measuring socioeconomic posi-tion in health research. Br Med Bull 2007;81(1):21-37.
52. Nolen LB, Braveman P, Dachs JNW, Delgado I, Gakidou E, Moser K, et al. Strengthening health information systems to address health equity challenges. Bull World Health Organ 2005;83(8):597-603.
53. Mackenbach JP, Kunst AE. Measuring the magnitude of socio-economic inequalities in health: An overview of available measures illustrated with two examples from Europe. Social Sci-ence & Medicine 1997;44(6):757-71.
54. Målqvist M. Neonatal mortality: An invisible and marginalised trauma. Glob Health Action 2011;4.
55. Koupil I, Rahu K, Rahu M, Karro H, Vågerö D. Major improve-ments, but persisting inequalities in infant survival in Estonia 1992--2002. The European Journal of Public Health 2006;17(1):8-16.
56. Commission on Social Determinants of Health. CSDH final report: closing the gap in a generation: health equity through action on the social determinants of health. Geneva: World Health Organization; 2008.
57. Zarocostas J. World's most vulnerable are being left behind in ef-forts to reach millennium development goals, says UN chief. BMJ 2011;343:d4269.
58. Victora CG. The millennium development goals and the inverse care law: No progress where it is most needed? J Epidemiol Com-munity Health 2008;62(11):938-9.
59. Gwatkin DR. How much would poor people gain from faster pro-gress towards the millennium development goals for health? Lan-cet 2005;365(9461):813-7.
60. UNICEF. The state of the world's children 2012. New York: UNICEF; 2012.
56
61. UNICEF. Progress for children: Achieving the MDGs with equity (no 9). New York: UNICEF; 2010.
62. White M, Adams J, Heywood P. How and why do interventions that increase health overall widen inequalities within populations? In: Social inequality and public health. The Policy Press; 2009. p. 65-81.
63. Tudor Hart J. The inverse care law. The Lancet 1971;297(7696):405-12.
64. Victora CG, Vaughan JP, Barros FC, Silva AC, Tomasi E. Ex-plaining trends in inequities: Evidence from Brazilian child health studies. The Lancet 2000;356(9235):1093-8.
65. Barros AJD, Ronsmans C, Axelson H, Loaiza E, Bertoldi AD, França GVA, et al. Equity in maternal, newborn, and child health interventions in countdown to 2015: A retrospective review of sur-vey data from 54 countries. The Lancet 2012;379(9822):1225-33.
66. Fenn B, Kirkwood BR. Inequities in neonatal survival interven-tions: Evidence from national surveys. Archives of Disease in Childhood. Fetal and Neonatal Edition 2007;92(5):F361.
67. Victora CG, Barros AJ, Axelson H, Bhutta ZA, Chopra M, França GV, et al. How changes in coverage affect equity in maternal and child health interventions in 35 countdown to 2015 countries: An analysis of national surveys. Lancet 2012;380(9848):1149-1156.
68. Barreto SM, Miranda JJ, Figueroa JP, Schmidt MI, Munoz S, Kuri-Morales PP, Silva JB. Epidemiology in Latin America and the Car-ibbean: Current situation and challenges. Int J Epidemiol 2012;41(2):557-71.
69. Economic Commission for Latin America and the Caribbean. Achieving the millennium development goals with equality in Lat-in America and the Caribbean: Progress and challenges. Santiago de Chile: ECLAC; 2012.
70. Programa de las Naciones Unidas para el Desarrollo. Regional hu-man development report for Latin America and the Caribbean 2010: Acting on the future breaking the inter-generational trans-mision of inequality. 1 ed. San Jose, C.R.:; 2010.
71. Inter-American Development Bank. The millennium development goals in Latin America and the Caribbean: Progress, priorities and IDB support for their implementation. Inter-American Develop-ment Bank (IADB). Washington: IADB; 2005.
72. Soares LC, Griesinger MO, Dachs JN, Bittner MA, Tavares S. In-equities in access to and use of drinking water services in Latin America and the Caribbean. Rev Panam Salud Publica 2002;11(5-6):386-96.
73. Mitra AK, Rodriguez-Fernandez G. Latin America and the Carib-bean: Assessment of the advances in public health for the achieve-
57
ment of the millennium development goals. International Journal of Environmental Research and Public Health 2010;7(5):2238-55.
74. Biggs B, King L, Basu S, Stuckler D. Is wealthier always healthi-er? The impact of national income level, inequality, and poverty on public health in Latin America. Soc Sci Med 2010;71(2):266 - 273.
75. Gardfield RM, Taboada E. Health services and revolution: The Nicaraguan experience. Oxford: Oxfam, 1989.
76. Garfield R, Williams G. From chaos to crisis: Prior to 1979. In: Health and revolution. The Nicaraguan experience. Oxford: Oxfam Oxford; 1989b. p. 11-22.
77. Lefton D. Nicaragua: Health care under the sandinistas. Can Med Assoc J 1984;130(6):781-4.
78. Garfield RM. War-related changes in health and health services in Nicaragua. Soc Sci Med 1989;28(7):669 - 676.
79. Pan American Health Organization, World Health Organization. Health in the Americas. Regional outlook and countries profiles. Washington: PAHO; 2012.
80. Pan American Health Organization. Health situation in the Ameri-cas. Basic indicators 2012. Washington: PAHO;2012.
81. United Nations Statistics Division. Millennium Development Goals indicators. The official United Nations site of the MDG in-dicators-Nicaragua; Available from: http://unstats.un.org/unsd/mdg/Data.aspx?cr=558. Accessed 18 September 2012.
82. International Monetary Fund. Nicaragua: Poverty reduction strate-gy paper - progress report on national human development plan as of 2010;Available from: http://www.imf.org/external/pubs/ft/scr/2011/cr11323.pdf. Ac-cessed 17 September 2012.
83. Sandiford p, Lankshear C, Montenegro MM. The Nicaraguan Lit-eracy crusade – How lasting were its benefits? Development in Practice 1994; 4(1):35-49.
84. Rajaratnam JK, Marcus JR, Flaxman AD, Wang H, Levin-Rector A, Dwyer L, et al. Neonatal, postneonatal, childhood, and under-5 mortality for 187 countries, 1970--2010: A systematic analysis of progress towards millennium development goal 4. The Lancet 2010;375(9730):1988-2008.
85. International Monetary Fund. Poverty reduction strategy papers (PRSP); Available from: http://www.imf.org/external/np/prsp/prsp.aspx. Accessed 12 Sep-tember 2012.
86. Innovations for poverty action; Available from: http://poverty-action.org/. Accessed 12 September 2012.

58
87. Sanchez P, Palm C, Sachs J, Denning G, Flor R, Harawa R, et al. The african millennium villages. Proceedings of the National Academy of Sciences 2007;104(43):16775-80.
88. Darmstadt GL, Bhutta ZA, Cousens S, Adam T, Walker N, de Ber-nis L. Evidence-based, cost-effective interventions: How many newborn babies can we save? Lancet 2005;365(9463):977 - 988.
89. Christopher JB, Le May A, Lewin S, Ross DA. Thirty years after alma-ata: A systematic review of the impact of community health workers delivering curative interventions against malaria, pneumo-nia and diarrhoea on child mortality and morbidity in sub-Saharan Africa. Hum Resour Health 2011;9(1):27.
90. Lambrechts T, Bryce J, Orinda V. Integrated management of childhood illness: A summary of first experiences. Bull World Health Organ 1999;77(7):582-94.
91. Paranhos VD, Pina JC, de Mello DF. Integrated management of childhood illness with the focus on caregivers: An integrative liter-ature review. Rev. Latino-Am. Enfermagem 2011;19(1):203-11.
92. Mathers CD, Ma Fat D, Inoue M, Rao C, Lopez AD. Counting the dead and what they died from: An assessment of the global sta-tus of cause of death data. Bull World Health Organ 2005;83(3):171-177.
93. Byass P. The unequal world of health data. PLoS Med 2009;6(11):e1000155.
94. Walker N, Bryce J, Black RE. Interpreting health statistics for pol-icymaking: The story behind the headlines. Lancet 2007;369(9565):956 - 963.
95. McCann MF. The millennium development goals: A challenge to epidemiologists. Epidemiology 2007;18(6):653-7.
96. MEASURE DHS. Demographic and health surveys; Available from: http://www.measuredhs.com/. Accessed 11 September 2012.
97. UNICEF. Multiple indicator cluster surveys; Available from: http://www.childinfo.org/mics.html. Accessed 11 September 2012.
98. Baiden F, Hodgson A, Binka F. Demographic surveillance sites and emerging challenges in international health. Bull World Health Organ 2006;84(3):163.
99. INDEPTH Network; Available from: http://www.indepth-network.org/. Accessed 11 September 2012.
100. Diwan VK. FilaBavi, a demographic surveillance site, an epidemi-ological field laboratory in Vietnam. Scand J Public Health 2003;31(62 suppl):3-7.
101. Ngom P, Binka FN, Phillips JF, Pence B, Macleod B. Demograph-ic surveillance and health equity in sub-Saharan Africa. Health Pol-icy Plan 2001;16(4):337-44.

59
102. Byass P. Person, place and time — but who, where, and when? Scand J Public Health2001;29:84.
103. Instituto nacional de información y desarrollo- INIDE de Nicara-gua [National institute of information and development-Nicaragua]; Available from: http://www.inide.gob.ni/. Accessed 21 September 2012.
104. United Nations Development Programme. Human development re-port Nicaragua 2002. Conditions of hope. New York: UNDP; 2002.
105. Zahr CA. Verbal autopsy standards: Ascertaining and attributing cause of death. Geneva: World Health Organization; 2007.
106. Economic Commission for Latin America and the Caribbean. Nic-aragua. Nicaragua. Evaluación de los daños ocasionados por el Huracán Mitch, 1998. Sus implicaciones para el desarrollo económico y social y el medio ambiente [Nicaragua: Assessment of the damage caused by hurricane Mitch 1998– Implications for economic and social development and for the environment]. Mexi-co: ECLAC;1999.
107. Zelaya EB. MDGs in northern Chinandega, Nicaragua. Experienc-es to share [unpublished].
108. Sandiford P, Morales P, Gorter A, Coyle E, Smith GD. Why do child mortality rates fall? An analysis of the Nicaraguan experi-ence. Am J Public Health 1991;81(1):30-7.
109. Peña R, Wall S, Persson LA. The effect of poverty, social inequity, and maternal education on infant mortality in Nicaragua, 1988-1993. Am J Public Health 2000;90(1):64-9.
110. Garfield RM. Declining child mortality rates in Nicaragua. Am J Public Health 1992;82(9):1291-2.
111. Garfield RM, Vermund SH. Health education and community par-ticipation in mass drug administration for malaria in Nicaragua. Soc Sci Med 1986;22(8):869-77.
112. Scholl EA. An assessment of community health workers in Nicara-gua. Soc Sci Med 1985;20(3):207-14.
113. Bhattarai HK. Neonatal mortality in Nepal: A public health con-cern. Health Prospect 2012;10:37-8.
114. Hoa DP, Nga NT, Målqvist M, Persson L. Persistent neonatal mor-tality despite improved under-five survival: A retrospective cohort study in northern Vietnam. Acta Paediatrica 2008;97(2):166-70.
115. Aleman J, Brännström I, Liljestrand J, Peña R, Persson LA, Steidinger J. Saving more neonates in hospital: An intervention towards a sustainable reduction in neonatal mortality in a Nicara-guan hospital. Trop Doct 1998;28(2):88-92.

60
116. LeVine RA, Rowe ML. Maternal literacy and child health in less-developed countries: Evidence, processes, and limitations. Journal of Developmental & Behavioral Pediatrics 2009;30(4):340.
117. Basu AM, Stephenson R. Low levels of maternal education and the proximate determinants of childhood mortality: A little learning is not a dangerous thing. Soc Sci Med 2005;60(9):2011-23.
118. Weinberger MB. The relationship between women's education and fertility: Selected findings from the world fertility surveys. Interna-tional Family Planning Perspectives 1987:35-46.
119. Sandiford P, Cassel J, Montenegro M, Sanchez G. The impact of women's literacy on child health and its interaction with access to health services. Population Studies 1995;49(1):5-17.
120. Bicego GT, Boerma JT. Maternal education and child survival: A comparative study of survey data from 17 countries. Soc Sci Med 1993;36(9):1207-1227.
121. Gakidou E, Cowling K, Lozano R, Murray CJ. Increased educa-tional attainment and its effect on child mortality in 175 countries between 1970 and 2009: A systematic analysis. Lancet 2010;376(9745):959-74.
122. Encuesta Nicaraguense de demografía y salud ENDESA 2006/07, informe final - Nicaragua [Nicaraguan demographic health survey 2006/07, last report]; Available from: http://apps.who.int/medicinedocs/en/m/abstract/Js18997es/. Accessed 4 October 2012.
123. Sousa A, Hill K, Dal Poz MR. Sub-national assessment of ine-quality trends in neonatal and child mortality in Brazil. Int J Equity Health 2010;9(1):21.
124. Pronyk PM, Muniz M, Nemser B, Somers M-A, McClellan L, Palm CA, et al. The effect of an integrated multisector model for achieving the millennium development goals and improving child survival in rural sub-Saharan Africa: A non-randomised controlled assessment. Lancet 2012;379(9832):2179 - 2188.
125. Kawachi I, Kennedy BP. Socioeconomic determinants of health : Health and social cohesion: Why care about income inequality? BMJ 1997;314(7086):1037.
126. Fantahun M, Berhane Y, Wall S, Byass P, Högberg U. Women's involvement in household decision-making and strengthening so-cial capital-crucial factors for child survival in Ethiopia. Acta Pae-diatr 2007;96(4):582-9.
127. Shamebo D, Sandström A, Muhe L, Freij L, Krantz I, Lönnberg G, Wall S. The Butajira project in Ethiopia: a nested case-referent study of under-five mortality and its public health determinants. Bull World Health Organ 1993;71(3-4):389-96.
61
128. Houweling TA, Kunst AE. Socio-economic inequalities in child-hood mortality in low- and middle-income countries: A review of the international evidence. Br Med Bull 2010;93:7-26.
129. Macassa G, Ghilagaber G, Bernhardt E, Burström B. Trends in in-fant and child mortality in Mozambique during and after a period of conflict. Public Health 2003;117(4):221-7.
130. Yaqub S. Poverty dynamics in developing countries. Institute of Development Studies; 2000.
131. Baulch B, Hoddinott J. Economic mobility and poverty dynamics in developing countries. The Journal of Development Studies 2000;36(6):1-24.
132. The World Bank. Nicaragua poverty assessment. Report No. 39736-NI. Washington: World Bank;n2008.
133. Bartram J, Lewis K, Lenton R, Wright A. Focusing on improved water and sanitation for health. The Lancet 2005;365(9461):810-2.
134. Yunus M. Grameen bank, microcredit and millennium develop-ment goals. Economic and Political Weekly 2004;39(36):4077-80.
135. Pereira S, Mourao P. Why does the microcredit borrowing rate dif-fer across countries? A cross-country study. International Journal of Social Economics 2012;39(8):536-50.
136. Rooyen CV, Stewart S, de Wet T. The impact of microfinance in sub-Saharan Africa: A systematic review of the evidence. World Development 2012;40(11):2249-2262.
137. Multilateral Investment Fund. What is the evidence of micro-finance impact? A review of microfinance impact evaluations in latin america and the caribbean; Available from: http://www5.iadb.org/mif/HOME/Knowledge/tabid/426/language/en-US/Default.aspx?idPublication=54703. Accessed 4 October 2012.
138. Mosley P. Microfinance and poverty in Bolivia. Journal of Devel-opment Studies 2001;37(4):101-32.
139. Marsh RR. Household food security through home gardening: Evi-dence from bangladesh. In: Adapting Social Science to the Chang-ing Focus of International Agricultural Research: Proceedings of a Rockefeller Foundation--Ilca Social Science Research Fellows Workshop Held at Ilca, Addis Ababa, Ethiopia, 14-18 November 1994. ; 2004f. p. 158.
140. Masset E, Haddad L, Cornelius A, Isaza-Castro J. A systematic re-view of agricultural interventions that aim to improve nutritional status of children. London: EPPI-Centre, Social Science Research Unit, Institute of Education, University of London; 2011.

62
141. Berti PR, Krasevec J, FitzGerald S. A review of the effectiveness of agriculture interventions in improving nutrition outcomes. Pub-lic Health Nutr 2004;7(5):599-609.
142. Méndez VE, Lok R, Somarriba E. Interdisciplinary analysis of homegardens in Nicaragua: Micro-zonation, plant use and socioec-onomic importance. Agroforestry Systems 2001;51(2):85-96.
143. Bishop JH, Mane F. The impacts of career-technical education on high school labor market success. Economics of Education Review 2004;23(4):381-402.
144. Garcia M, Fares J. The three pillars of policy: Lessons from inter-national experience. In: Youth in Africa’s Labor Market; 2008. p. 67.
145. The World Bank. Jobs and living standards. In: World develop-ment report 2013. Jobs. Washington: The World Bank; 2012. p. 76-93.
146. Blattman C, Fiala N, Martinez S. Employment generation in rural Africa: Mid-term results from an experimental evaluation of the youth opportunities program in northern Uganda, 2012.
147. Elliott P, Wartenberg D. Spatial Epidemiology: Current approaches and future challenges. Environ Health Perspect 2004; 112(9):998-1006.
148. MEASURE DHS - assessment of the quality of data used for direct estimation of infant and child mortality in DHS-II surveys (eng-lish) 161; Available from: http://measuredhs.com/publications/publication-op3-occasional-papers.cfm. Accessed 4 October 2012.
149. Rajaratnam JK, Tran LN, Lopez AD, Murray CJL. Measuring un der-five mortality: Validation of new low-cost methods. PLoS Med 2010;7(4):e1000253.


Acta Universitatis UpsaliensisDigital Comprehensive Summaries of Uppsala Dissertationsfrom the Faculty of Medicine 839
Editor: The Dean of the Faculty of Medicine
A doctoral dissertation from the Faculty of Medicine, UppsalaUniversity, is usually a summary of a number of papers. A fewcopies of the complete dissertation are kept at major Swedishresearch libraries, while the summary alone is distributedinternationally through the series Digital ComprehensiveSummaries of Uppsala Dissertations from the Faculty ofMedicine.
Distribution: publications.uu.seurn:nbn:se:uu:diva-183273
ACTAUNIVERSITATIS
UPSALIENSISUPPSALA
2012


![[Millennium Development Goals 1 and 3] By [Author Name ... · MILLENNIUM DEVELOPMENT GOALS 1 & 3 4 were termedas “Millennium Development Goals” and United Nations Millennium Declaration](https://static.fdocuments.us/doc/165x107/5edb6813ad6a402d66659cfd/millennium-development-goals-1-and-3-by-author-name-millennium-development.jpg)