Migration and Fuel Use in Rural Mexico Dale T. Manning UC-Davis USAEE/IAEE North American Conference...
42
Migration and Fuel Use in Rural Mexico Dale T. Manning UC-Davis USAEE/IAEE North American Conference July 2013
-
Upload
muriel-mosley -
Category
Documents
-
view
214 -
download
0
Transcript of Migration and Fuel Use in Rural Mexico Dale T. Manning UC-Davis USAEE/IAEE North American Conference...
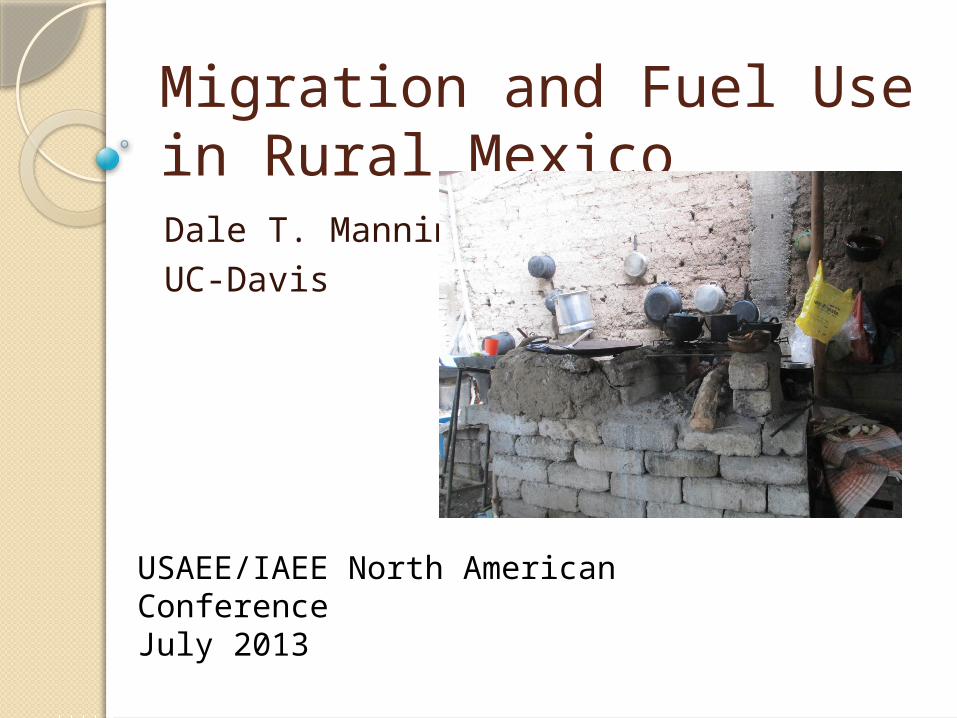
Migration and Fuel Use in Rural MexicoDale T. ManningUC-Davis
USAEE/IAEE North American ConferenceJuly 2013
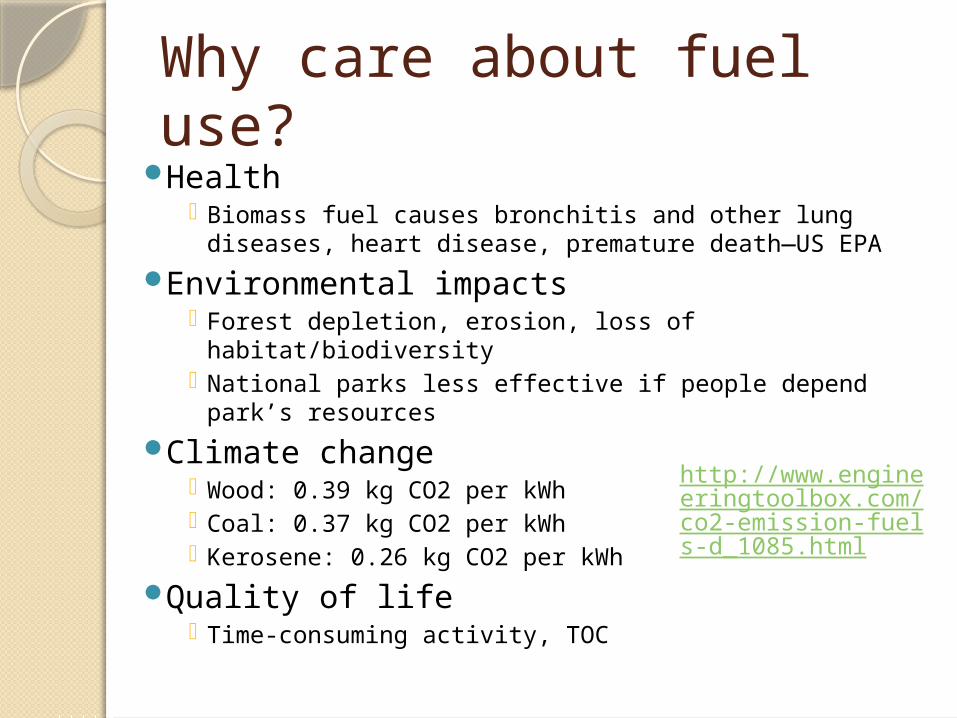
Health Biomass fuel causes bronchitis and other lung
diseases, heart disease, premature death—US EPA
Environmental impacts Forest depletion, erosion, loss of habitat/biodiversity National parks less effective if people depend park’s
resources
Climate change Wood: 0.39 kg CO2 per kWh Coal: 0.37 kg CO2 per kWh Kerosene: 0.26 kg CO2 per kWh
Quality of life Time-consuming activity, TOC
Why care about fuel use?
http://www.engineeringtoolbox.com/co2-emission-fuels-d_1085.html
2 theories of fuel choiceFuel ladder Fuel stacking
Main contributions
1. Present theoretical model of fuel choice
2. Use model to show how migration changes fuel-choice incentives
3. Show empirical impact of out-migration on household fuel use
Research question
How does rural out-migration affect fuel choice in rural Mexico?
Important because rural-urban migration is a part of development process!
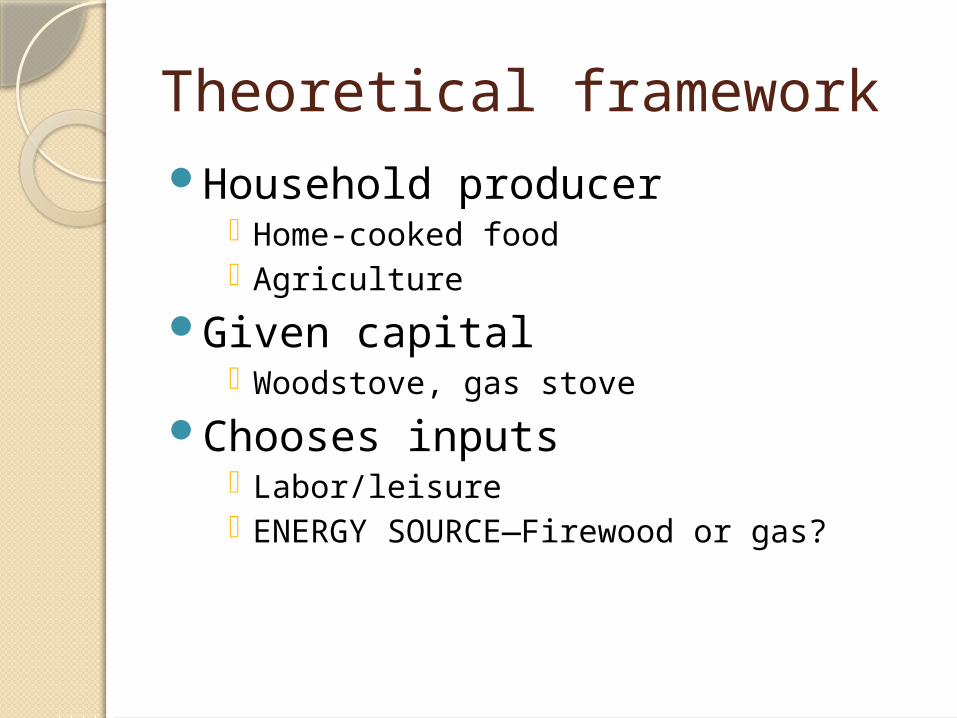
Theoretical frameworkHousehold producer
Home-cooked food Agriculture
Given capital Woodstove, gas stove
Chooses inputs Labor/leisure ENERGY SOURCE—Firewood or gas?
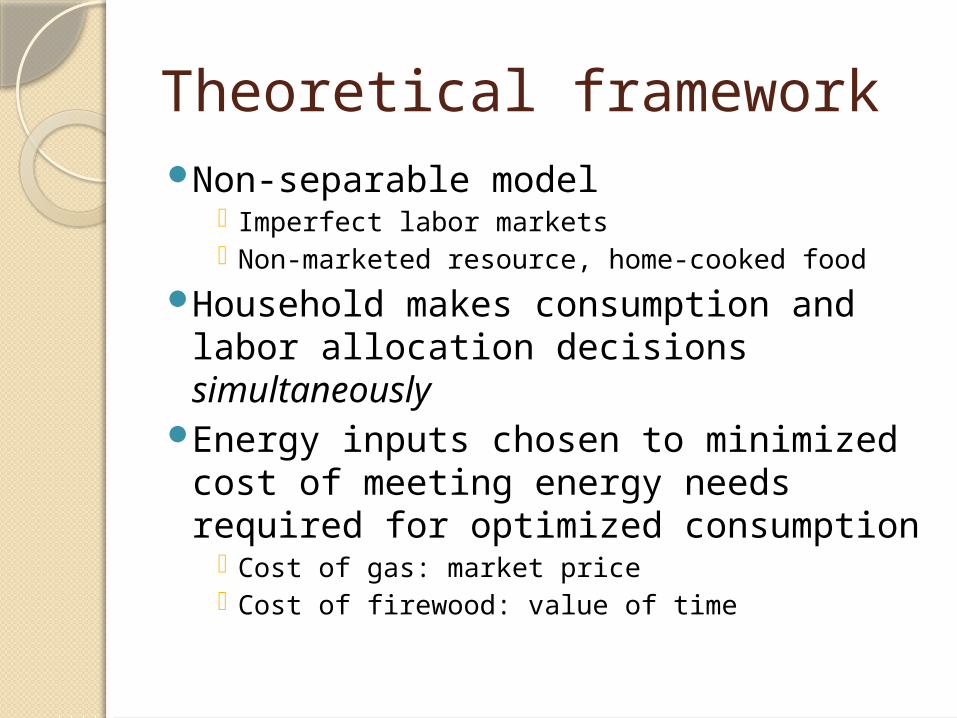
Theoretical frameworkNon-separable model
Imperfect labor markets Non-marketed resource, home-cooked food
Household makes consumption and labor allocation decisions simultaneously
Energy inputs chosen to minimized cost of meeting energy needs required for optimized consumption
Cost of gas: market price Cost of firewood: value of time
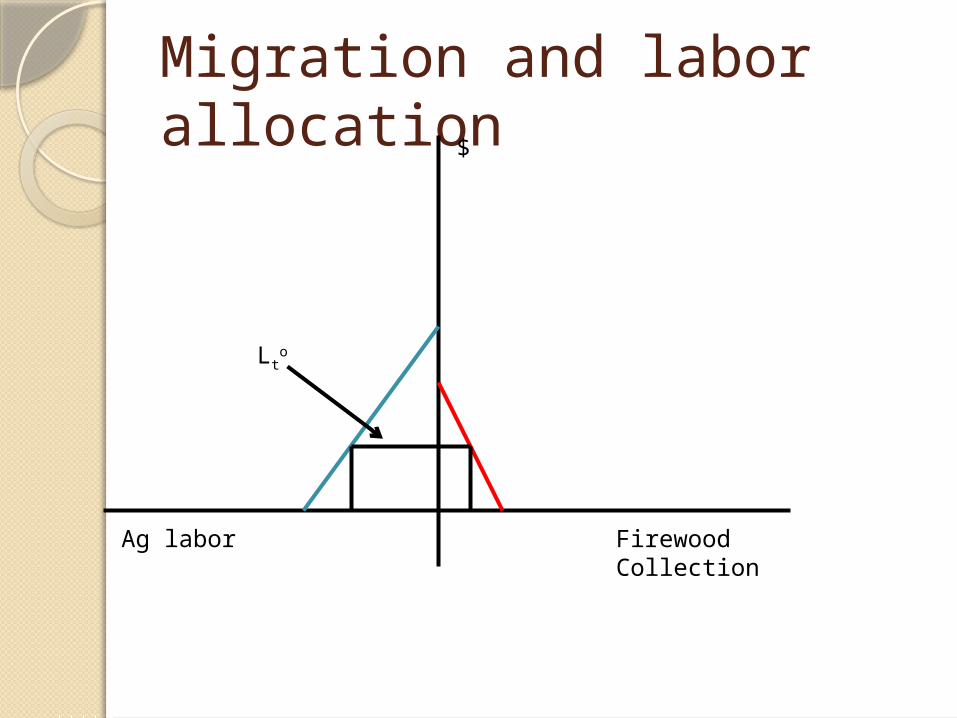
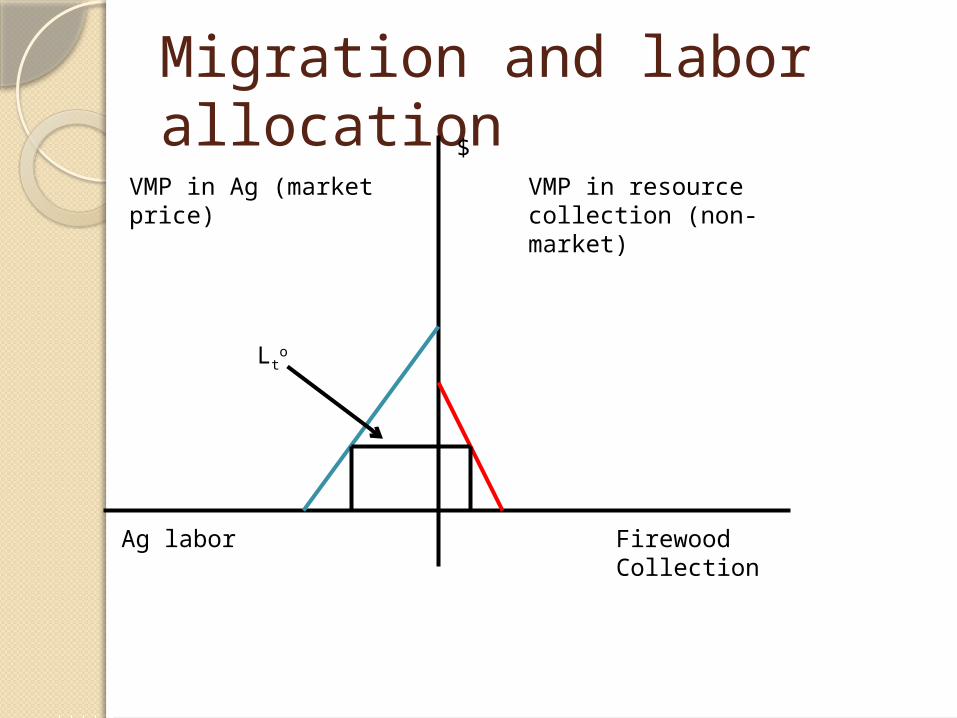
Migration and labor allocation
Ag labor
$
Firewood Collection
Lto
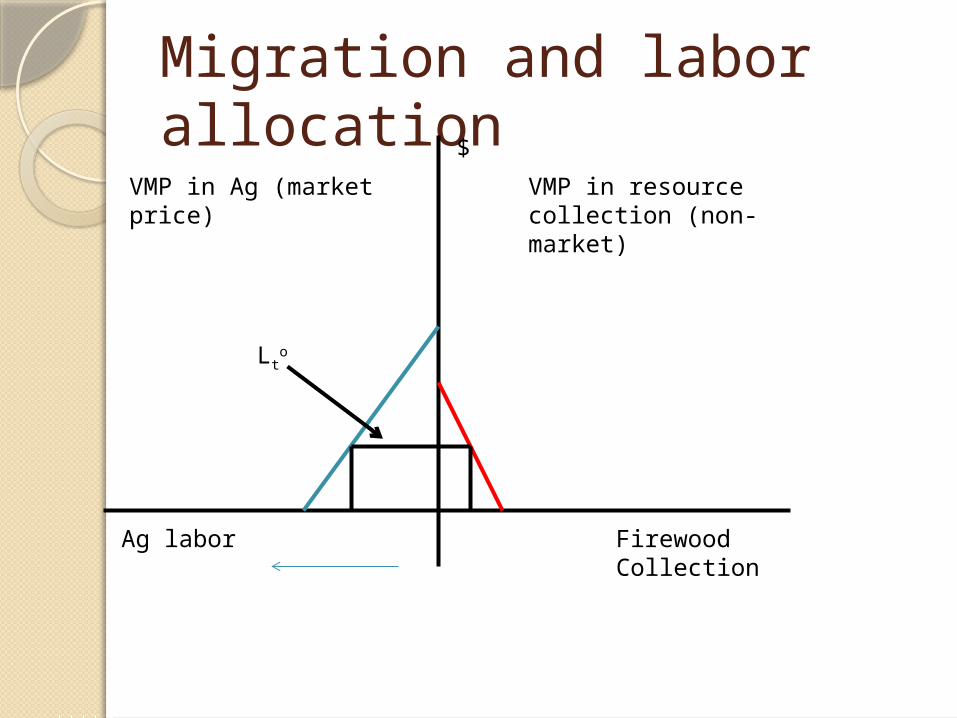
Migration and labor allocation
Ag labor
$
Firewood Collection
Lto
VMP in Ag (market price)
VMP in resource collection (non-market)

Migration and labor allocation
Ag labor
$
Firewood Collection
Lto
VMP in Ag (market price)
VMP in resource collection (non-market)
Migration and labor allocation
Ag labor
$
Firewood Collection
Lto
VMP in Ag (market price)
VMP in resource collection (non-market)
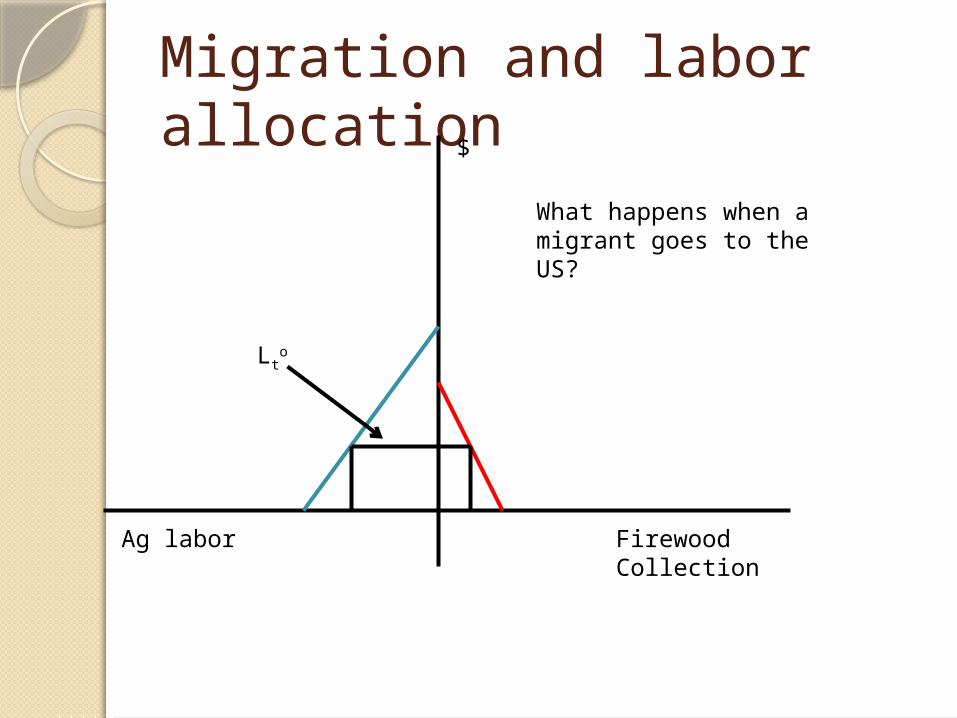
Migration and labor allocation
Ag labor
$
Firewood Collection
Lto
What happens when a migrant goes to the US?
Migration and labor allocation
Ag labor
$
Firewood Collection
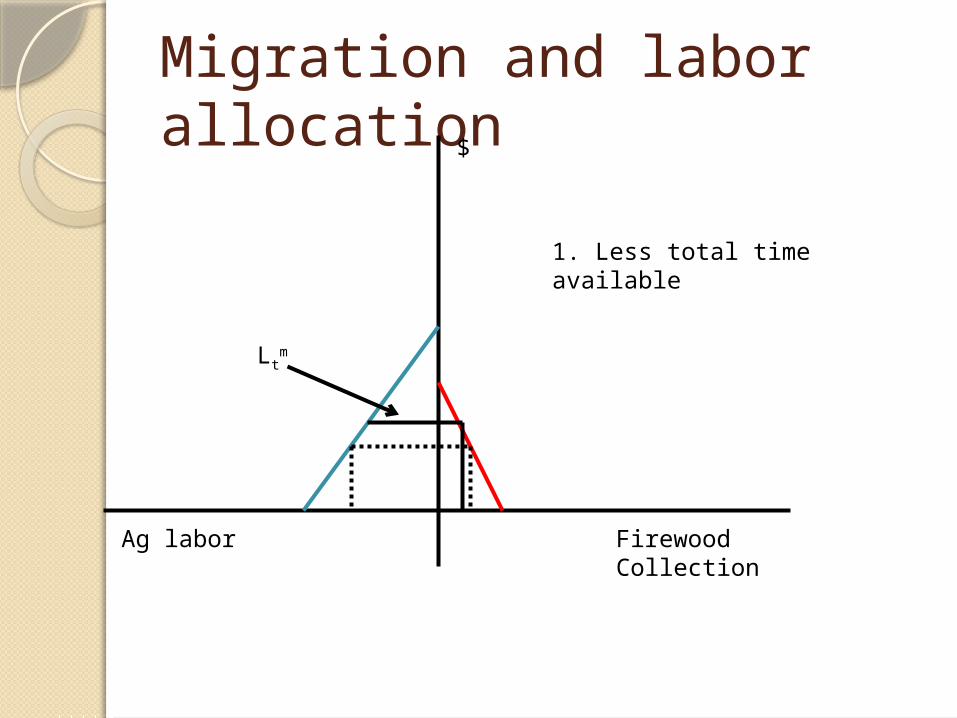
Ltm
1. Less total time available
Migration and labor allocation
Ag labor
$
Firewood Collection
Ltm
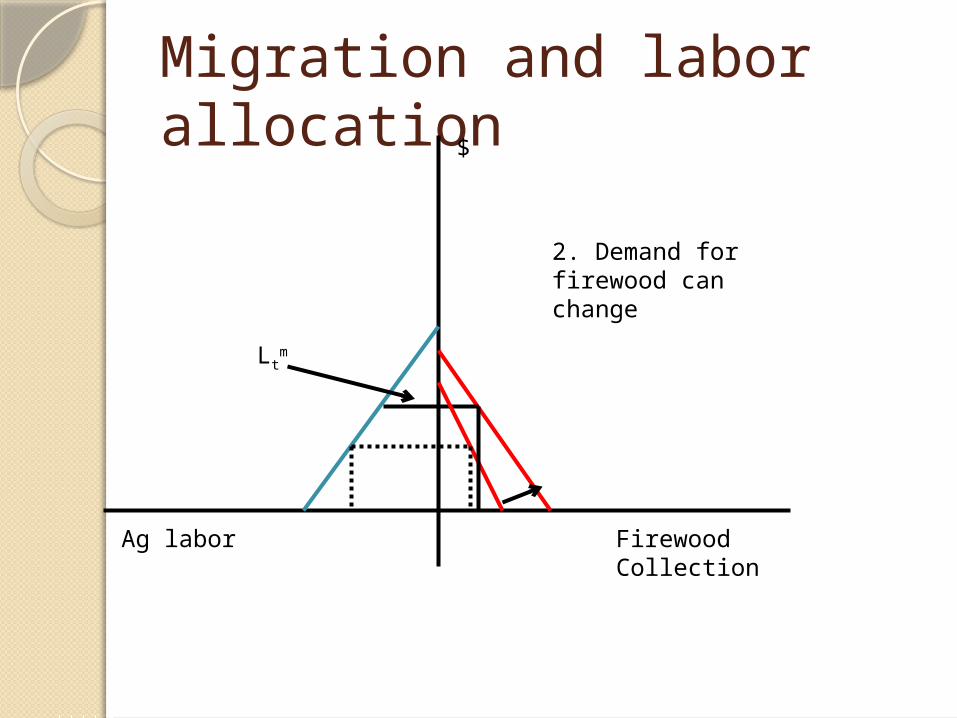
2. Demand for firewood can change
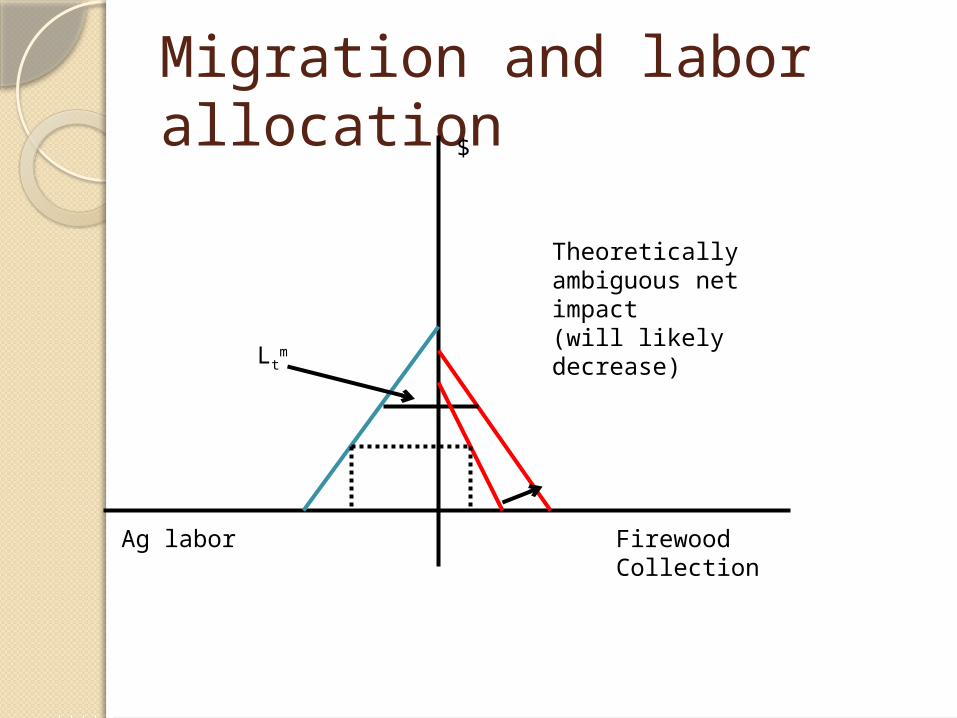
Migration and labor allocation
Ag labor
$
Firewood Collection
Ltm
Theoretically ambiguous net impact(will likely decrease)
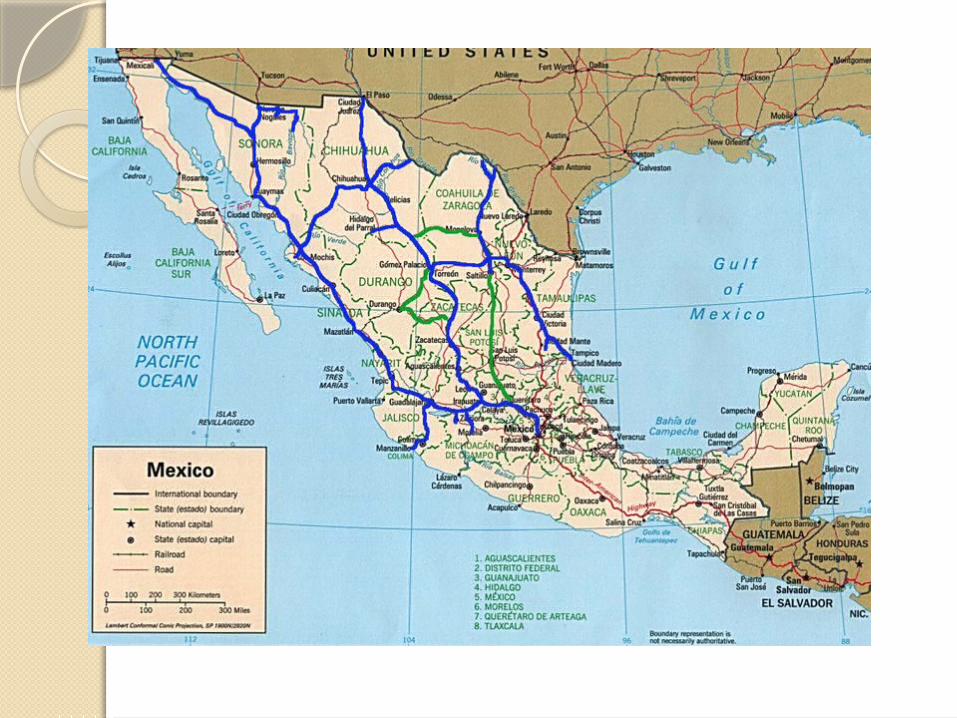
Theoretically ambiguousInvestigate empiricallyRural Mexico
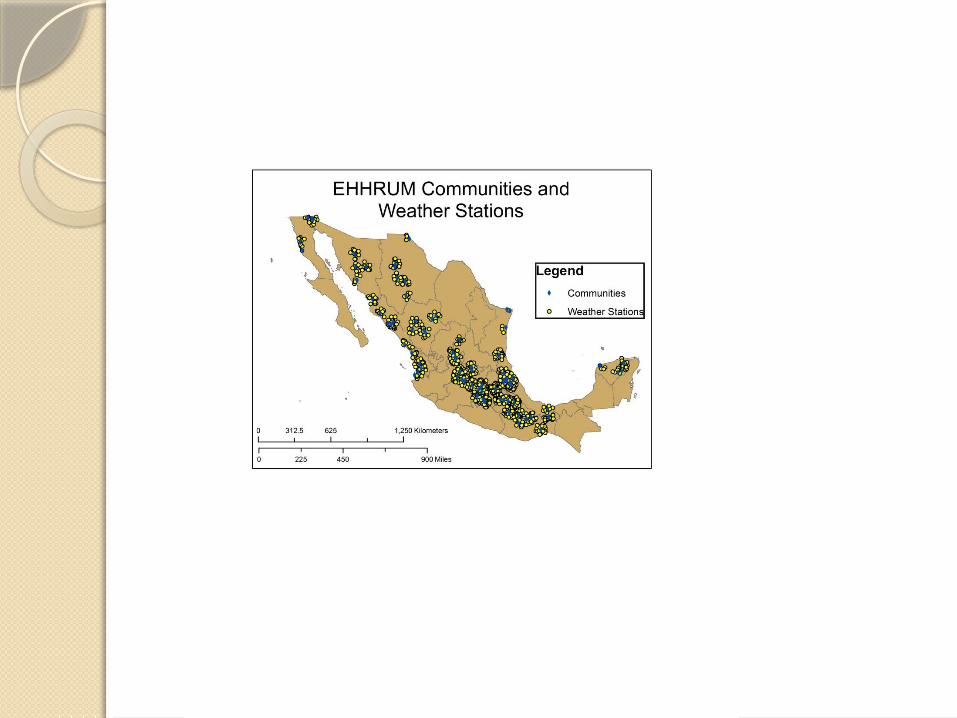
National Household Survey of Rural Mexico
Representative of rural Mexico 80 communities, 14 states, 5 regions 1543 households
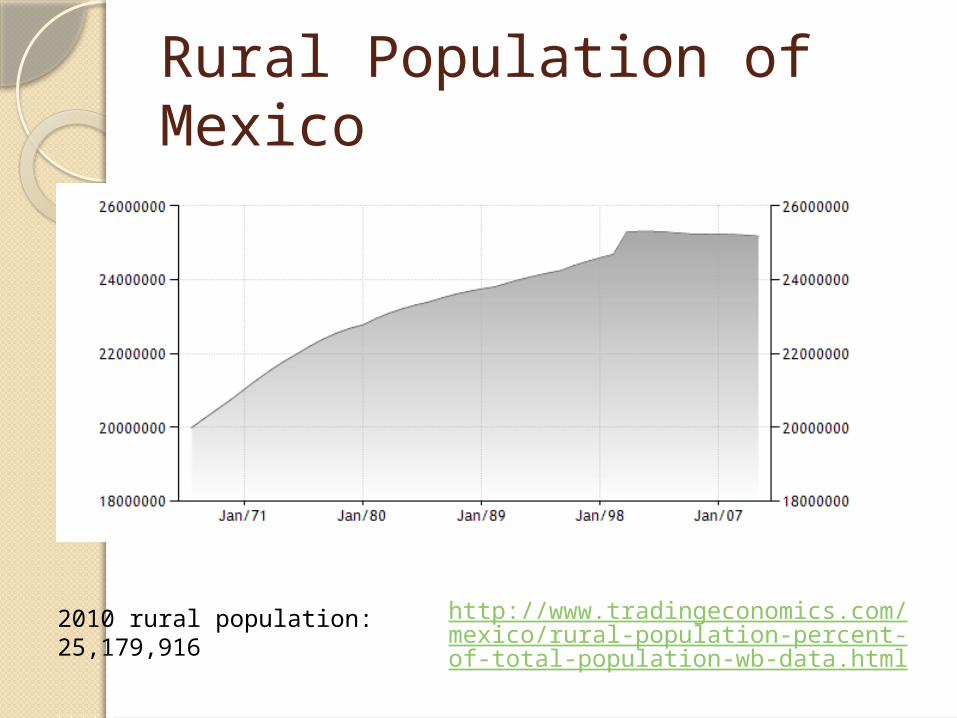
Rural Population of Mexico
http://www.tradingeconomics.com/mexico/rural-population-percent-of-total-population-wb-data.html
2010 rural population: 25,179,916
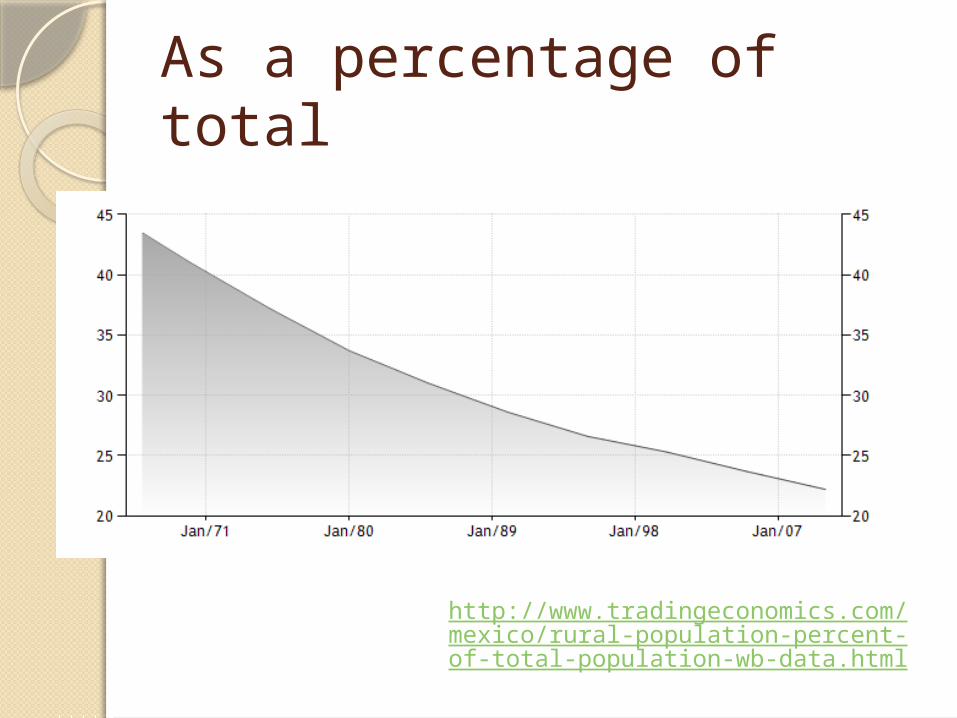
As a percentage of total
http://www.tradingeconomics.com/mexico/rural-population-percent-of-total-population-wb-data.html
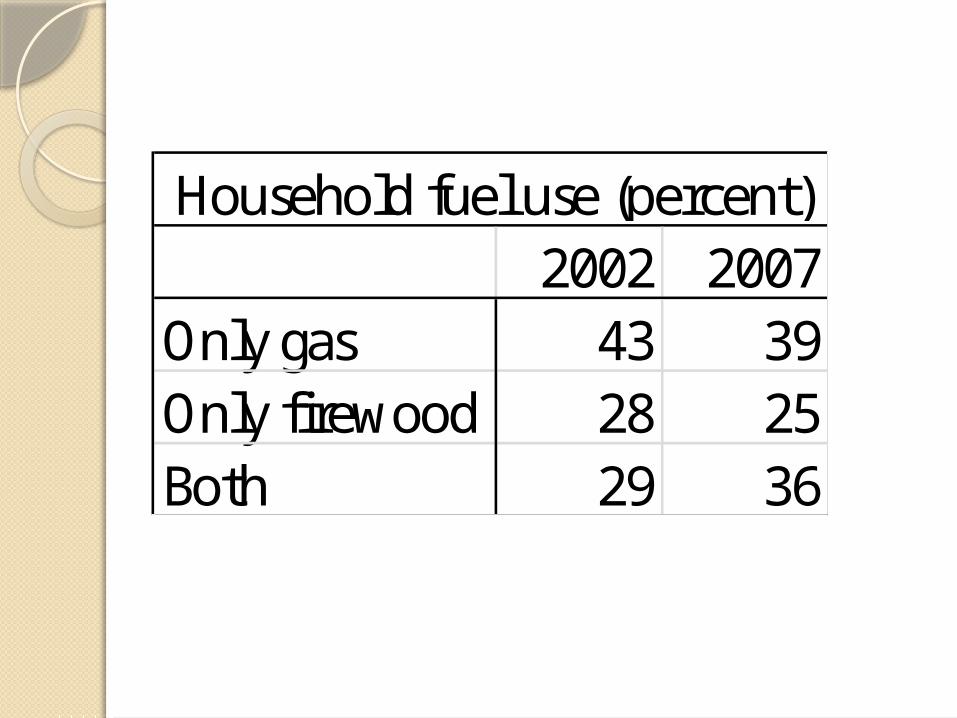
2002 2007Only gas 43 39Only firewood 28 25Both 29 36
Household fuel use (percent)
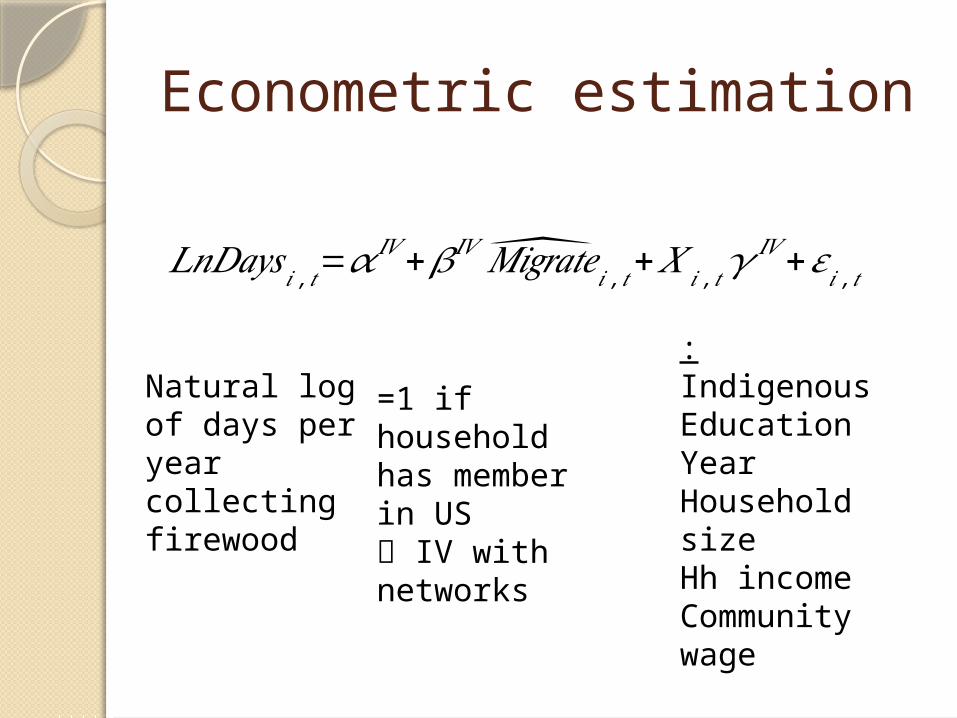
Econometric estimation
𝐿𝑛𝐷𝑎𝑦𝑠𝑖 ,𝑡=𝛼 𝐼𝑉+𝛽𝐼𝑉 �̂�𝑖𝑔𝑟𝑎𝑡𝑒𝑖 ,𝑡+ 𝑋𝑖 ,𝑡𝛾𝐼𝑉+𝜀𝑖 , 𝑡
Natural log of days per year collecting firewood
=1 if household has member in US IV with networks
:IndigenousEducationYearHousehold sizeHh incomeCommunity wage
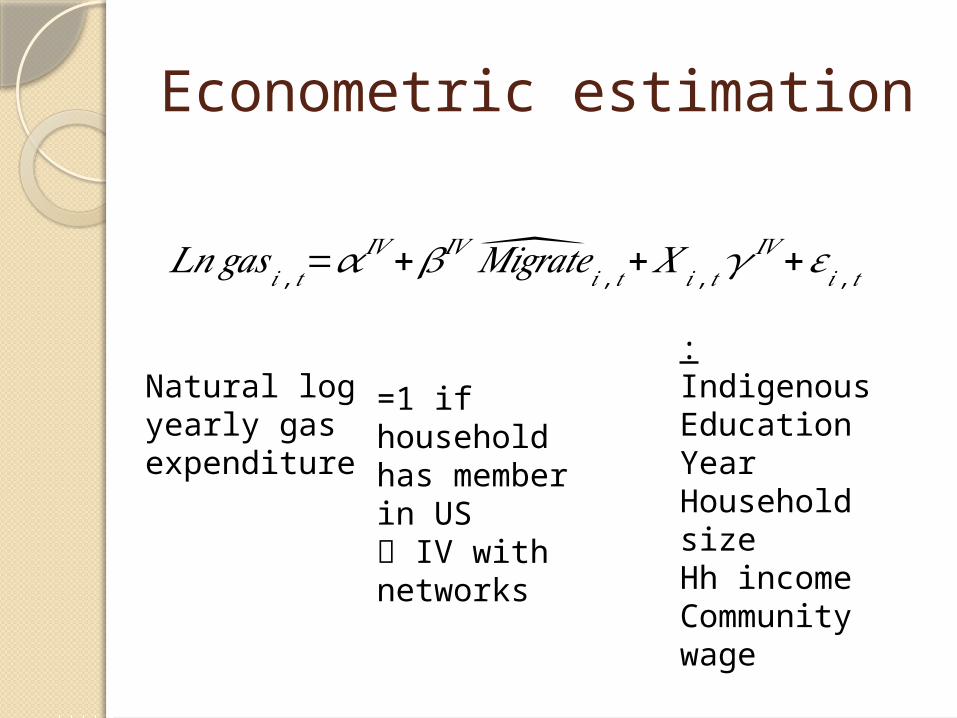
Econometric estimation
𝐿𝑛𝑔𝑎𝑠𝑖 , 𝑡=𝛼𝐼𝑉+𝛽𝐼𝑉 �̂�𝑖𝑔𝑟𝑎𝑡𝑒𝑖 ,𝑡+𝑋 𝑖 ,𝑡𝛾
𝐼𝑉+𝜀𝑖 ,𝑡
Natural log yearly gas expenditure
=1 if household has member in US IV with networks
:IndigenousEducationYearHousehold sizeHh incomeCommunity wage
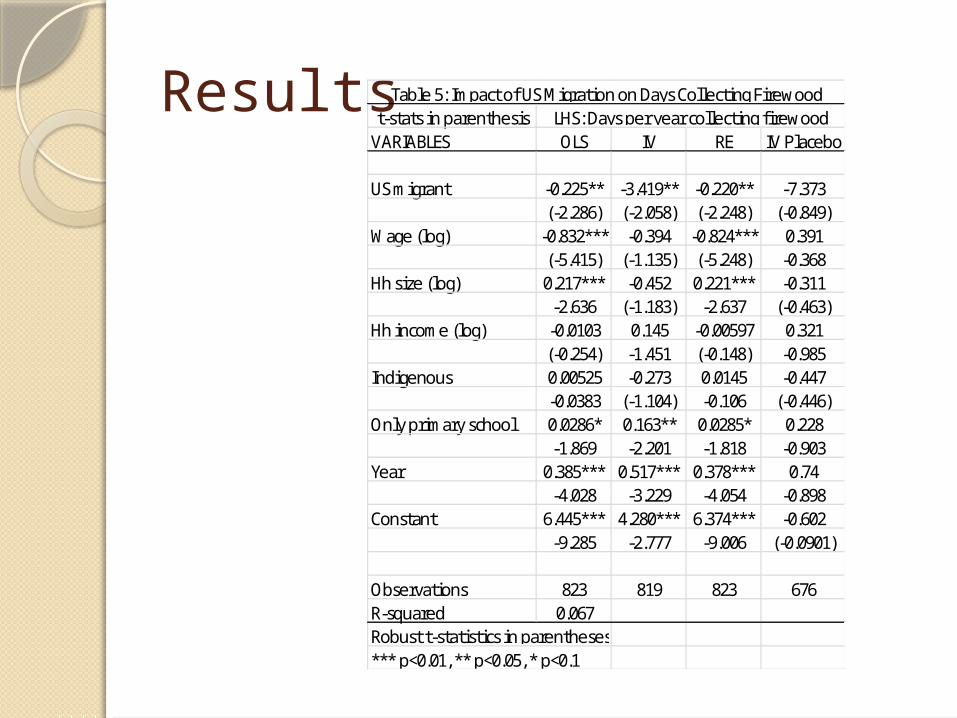
Results t-stats in parenthesisVARIABLES OLS IV RE IV Placebo
US migrant -0.225** -3.419** -0.220** -7.373(-2.286) (-2.058) (-2.248) (-0.849)
Wage (log) -0.832*** -0.394 -0.824*** 0.391(-5.415) (-1.135) (-5.248) -0.368
Hh size (log) 0.217*** -0.452 0.221*** -0.311-2.636 (-1.183) -2.637 (-0.463)
Hh income (log) -0.0103 0.145 -0.00597 0.321(-0.254) -1.451 (-0.148) -0.985
Indigenous 0.00525 -0.273 0.0145 -0.447-0.0383 (-1.104) -0.106 (-0.446)
Only primary school 0.0286* 0.163** 0.0285* 0.228-1.869 -2.201 -1.818 -0.903
Year 0.385*** 0.517*** 0.378*** 0.74-4.028 -3.229 -4.054 -0.898
Constant 6.445*** 4.280*** 6.374*** -0.602-9.285 -2.777 -9.006 (-0.0901)
Observations 823 819 823 676R-squared 0.067Robust t-statistics in parentheses*** p<0.01, ** p<0.05, * p<0.1
Table 5: Impact of US Migration on Days Collecting FirewoodLHS: Days per year collecting firewood
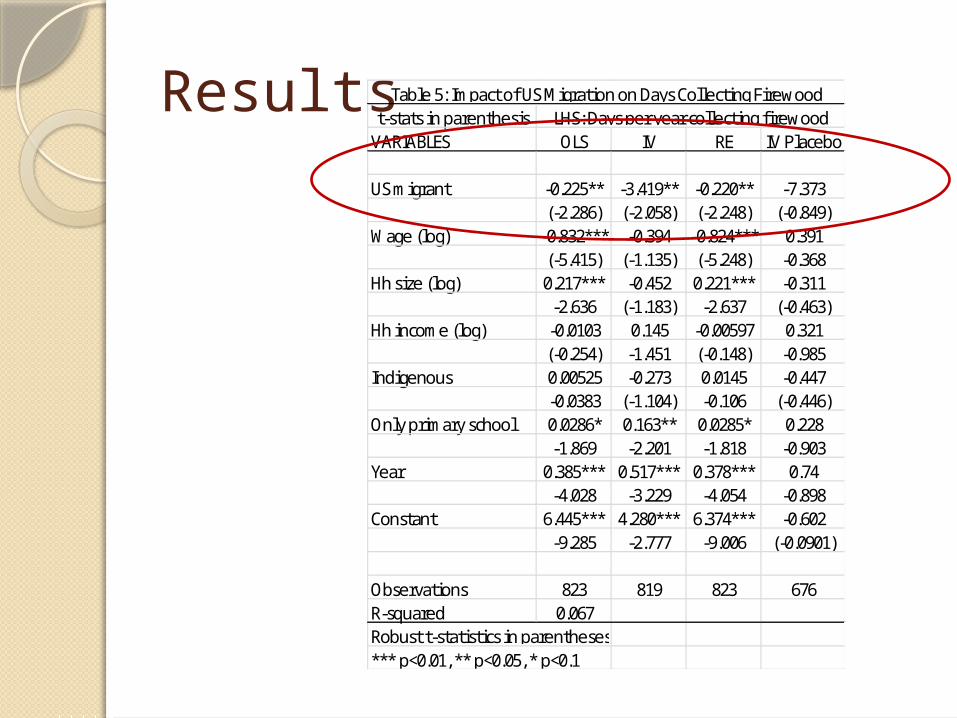

Results
VARIABLES OLS IV RE IV Placebo
US migrant -0.225** -3.419** -0.220** -7.373(-2.286) (-2.058) (-2.248) (-0.849)
Without a migrant, spend about 3 times as many person-days per year collecting firewood!
Average is ~121 days
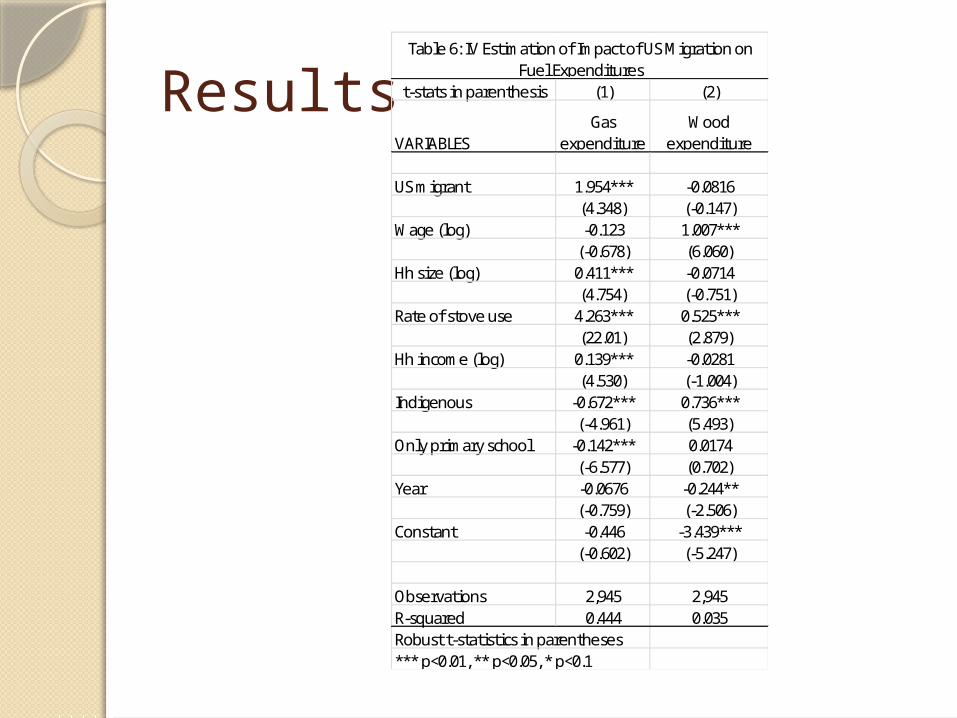
Results t-stats in parenthesis (1) (2)
VARIABLESGas
expenditureWood
expenditure
US migrant 1.954*** -0.0816(4.348) (-0.147)
Wage (log) -0.123 1.007***(-0.678) (6.060)
Hh size (log) 0.411*** -0.0714(4.754) (-0.751)
Rate of stove use 4.263*** 0.525***(22.01) (2.879)
Hh income (log) 0.139*** -0.0281(4.530) (-1.004)
Indigenous -0.672*** 0.736***(-4.961) (5.493)
Only primary school -0.142*** 0.0174(-6.577) (0.702)
Year -0.0676 -0.244**(-0.759) (-2.506)
Constant -0.446 -3.439***(-0.602) (-5.247)
Observations 2,945 2,945R-squared 0.444 0.035Robust t-statistics in parentheses*** p<0.01, ** p<0.05, * p<0.1
Table 6: IV Estimation of Impact of US Migration on Fuel Expenditures
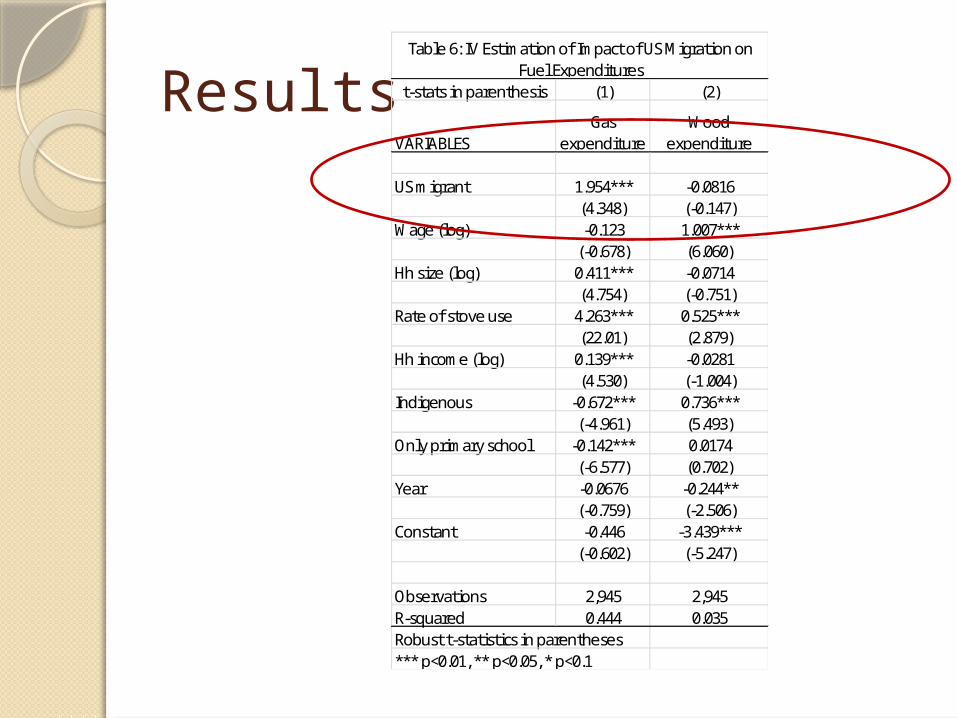
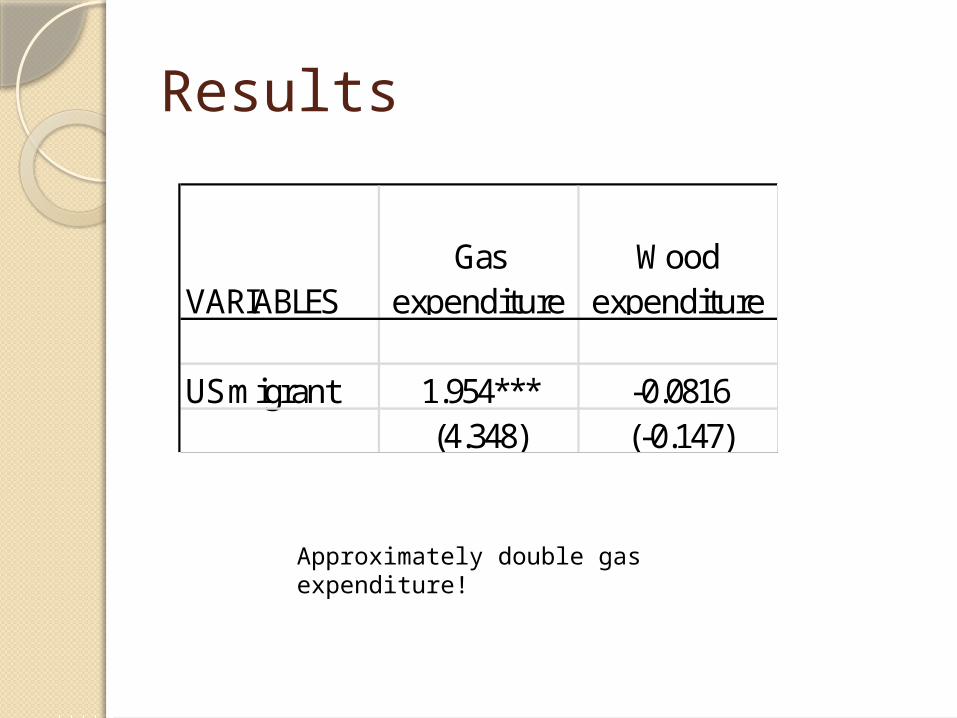
Results
VARIABLESGas
expenditureWood
expenditure
US migrant 1.954*** -0.0816(4.348) (-0.147)
Approximately double gas expenditure!
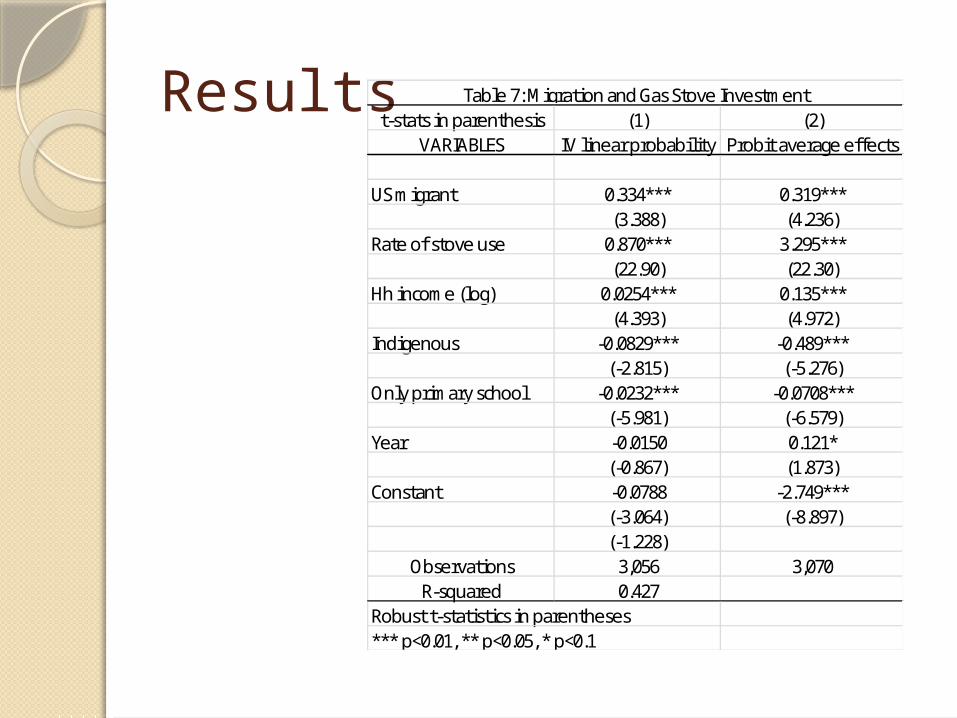
Results t-stats in parenthesis (1) (2)VARIABLES IV linear probability Probit average effects
US migrant 0.334*** 0.319***(3.388) (4.236)
Rate of stove use 0.870*** 3.295***(22.90) (22.30)
Hh income (log) 0.0254*** 0.135***(4.393) (4.972)
Indigenous -0.0829*** -0.489***(-2.815) (-5.276)
Only primary school -0.0232*** -0.0708***(-5.981) (-6.579)
Year -0.0150 0.121*(-0.867) (1.873)
Constant -0.0788 -2.749***(-3.064) (-8.897)(-1.228)
Observations 3,056 3,070R-squared 0.427
Robust t-statistics in parentheses*** p<0.01, ** p<0.05, * p<0.1
Table 7: Migration and Gas Stove Investment
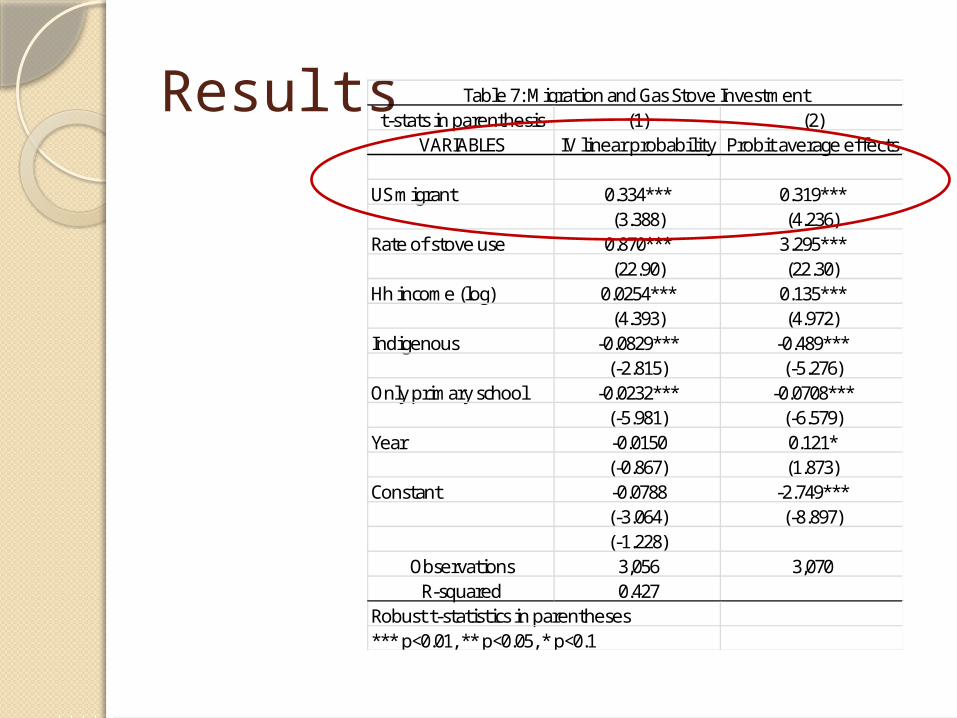
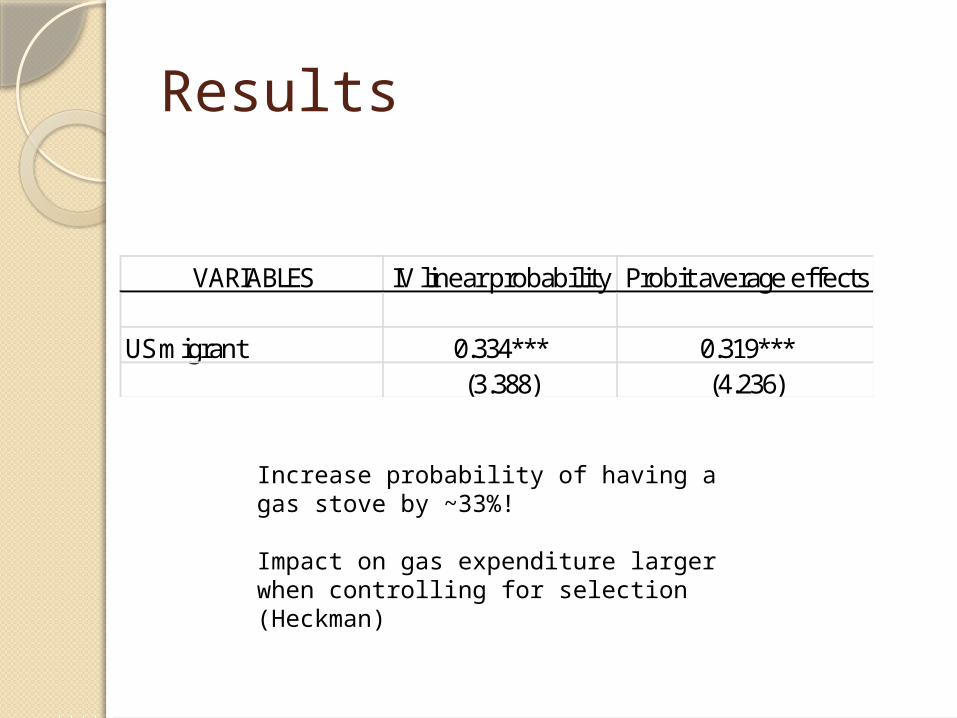
Results
VARIABLES IV linear probability Probit average effects
US migrant 0.334*** 0.319***(3.388) (4.236)
Increase probability of having a gas stove by ~33%!
Impact on gas expenditure larger when controlling for selection (Heckman)
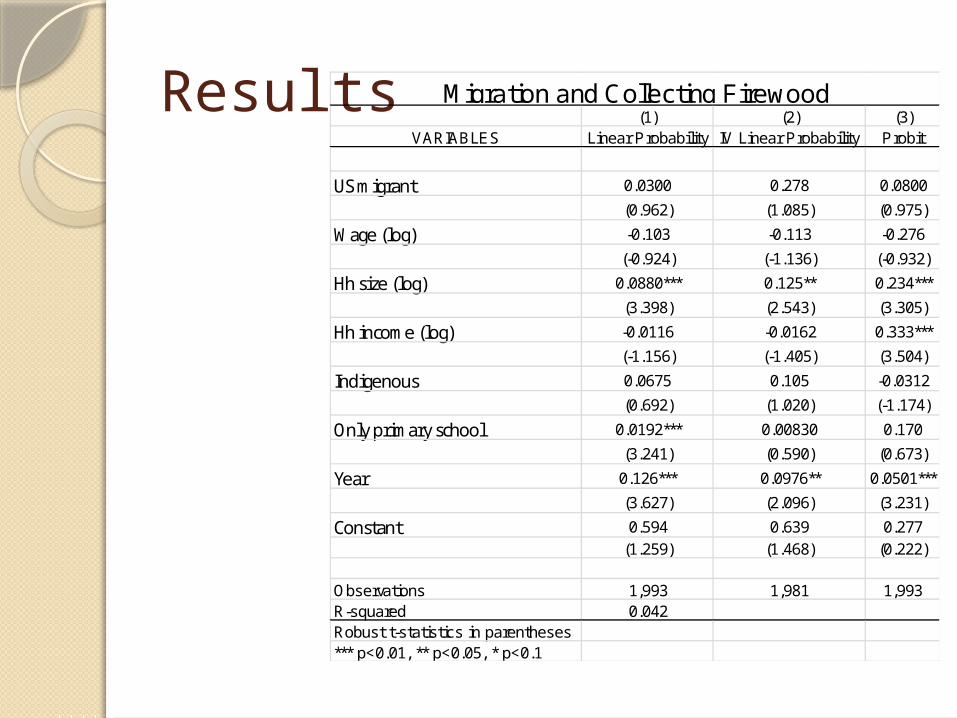
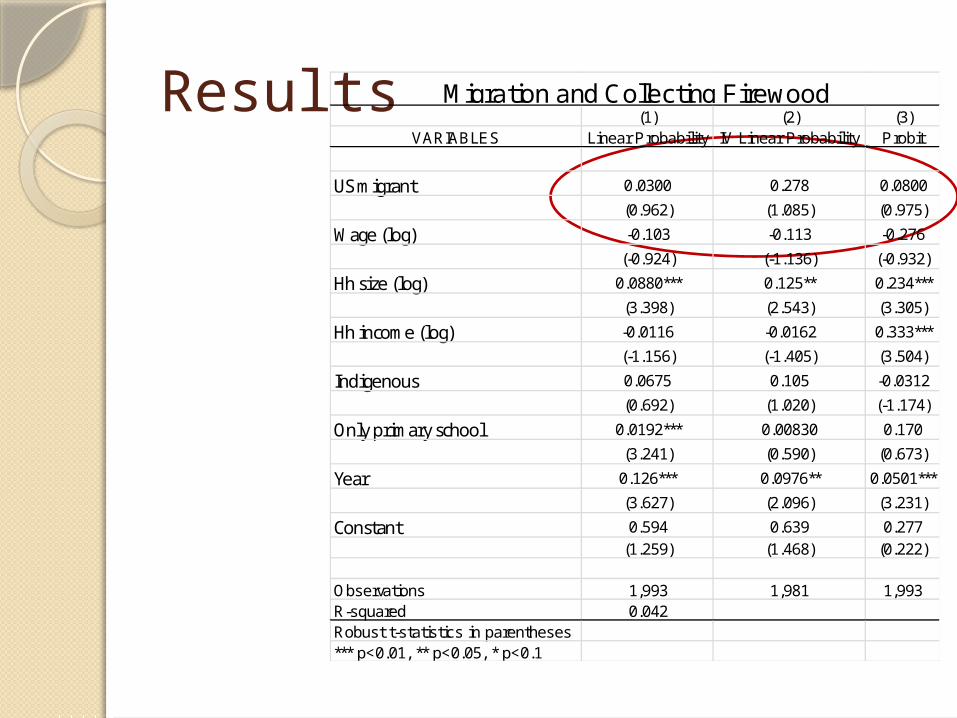
Results(1) (2) (3)
VARIABLES Linear Probability IV Linear Probability Probit
US migrant 0.0300 0.278 0.0800
(0.962) (1.085) (0.975)
Wage (log) -0.103 -0.113 -0.276
(-0.924) (-1.136) (-0.932)
Hh size (log) 0.0880*** 0.125** 0.234***
(3.398) (2.543) (3.305)
Hh income (log) -0.0116 -0.0162 0.333***
(-1.156) (-1.405) (3.504)
Indigenous 0.0675 0.105 -0.0312
(0.692) (1.020) (-1.174)
Only primary school 0.0192*** 0.00830 0.170
(3.241) (0.590) (0.673)
Year 0.126*** 0.0976** 0.0501***
(3.627) (2.096) (3.231)
Constant 0.594 0.639 0.277(1.259) (1.468) (0.222)
Observations 1,993 1,981 1,993R-squared 0.042Robust t-statistics in parentheses*** p<0.01, ** p<0.05, * p<0.1
Migration and Collecting Firewood
(1) (2) (3)VARIABLES Linear Probability IV Linear Probability Probit
US migrant 0.0300 0.278 0.0800
(0.962) (1.085) (0.975)
Wage (log) -0.103 -0.113 -0.276
(-0.924) (-1.136) (-0.932)
Hh size (log) 0.0880*** 0.125** 0.234***
(3.398) (2.543) (3.305)
Hh income (log) -0.0116 -0.0162 0.333***
(-1.156) (-1.405) (3.504)
Indigenous 0.0675 0.105 -0.0312
(0.692) (1.020) (-1.174)
Only primary school 0.0192*** 0.00830 0.170
(3.241) (0.590) (0.673)
Year 0.126*** 0.0976** 0.0501***
(3.627) (2.096) (3.231)
Constant 0.594 0.639 0.277(1.259) (1.468) (0.222)
Observations 1,993 1,981 1,993R-squared 0.042Robust t-statistics in parentheses*** p<0.01, ** p<0.05, * p<0.1
Migration and Collecting FirewoodResults
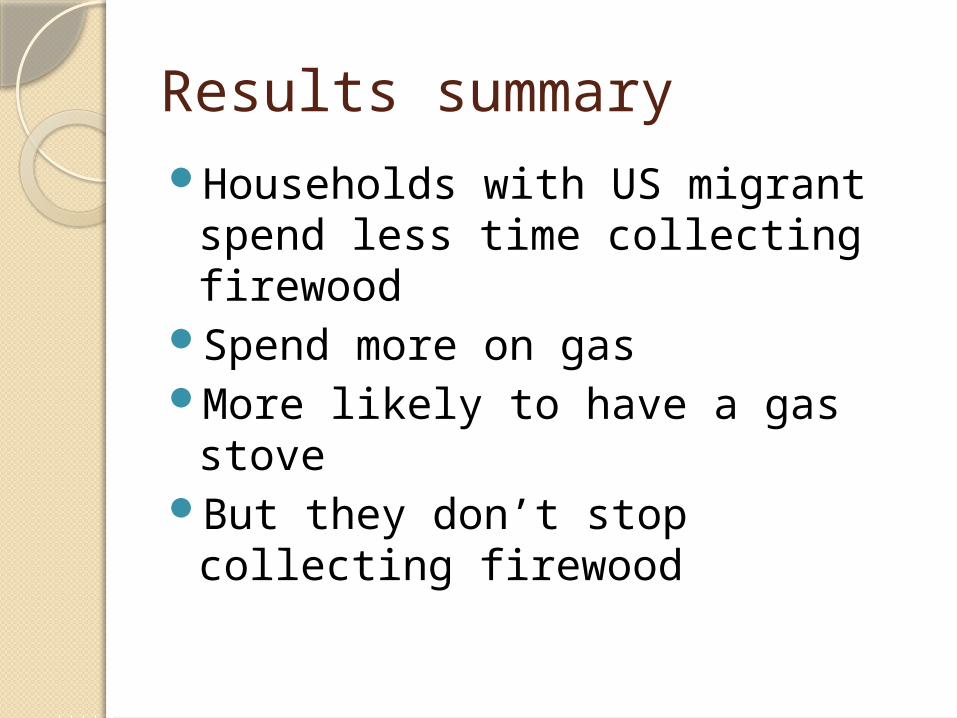
Results summaryHouseholds with US migrant
spend less time collecting firewood
Spend more on gasMore likely to have a gas stoveBut they don’t stop collecting
firewood
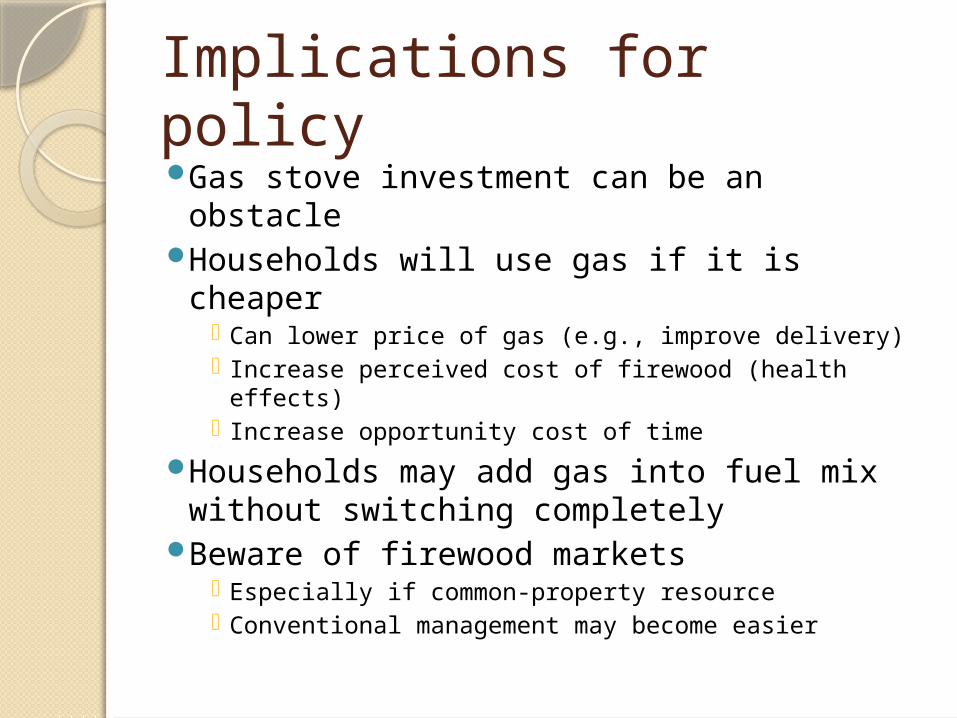
Implications for policyGas stove investment can be an
obstacleHouseholds will use gas if it is cheaper
Can lower price of gas (e.g., improve delivery) Increase perceived cost of firewood (health
effects) Increase opportunity cost of time
Households may add gas into fuel mix without switching completely
Beware of firewood markets Especially if common-property resource Conventional management may become easier

Thanks!
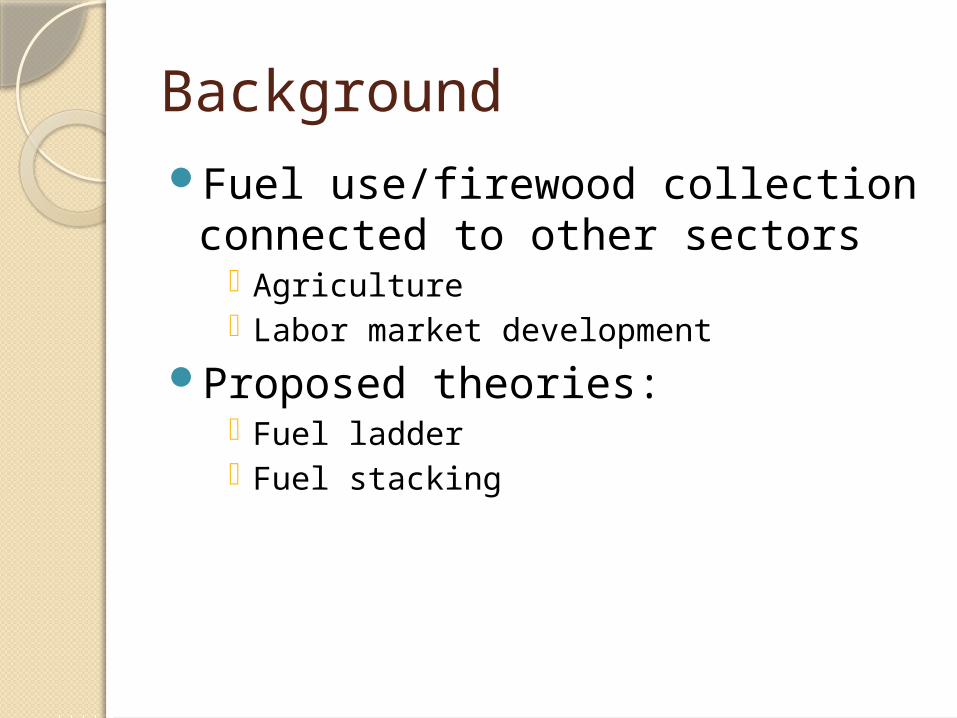
BackgroundFuel use/firewood collection
connected to other sectors Agriculture Labor market development
Proposed theories: Fuel ladder Fuel stacking
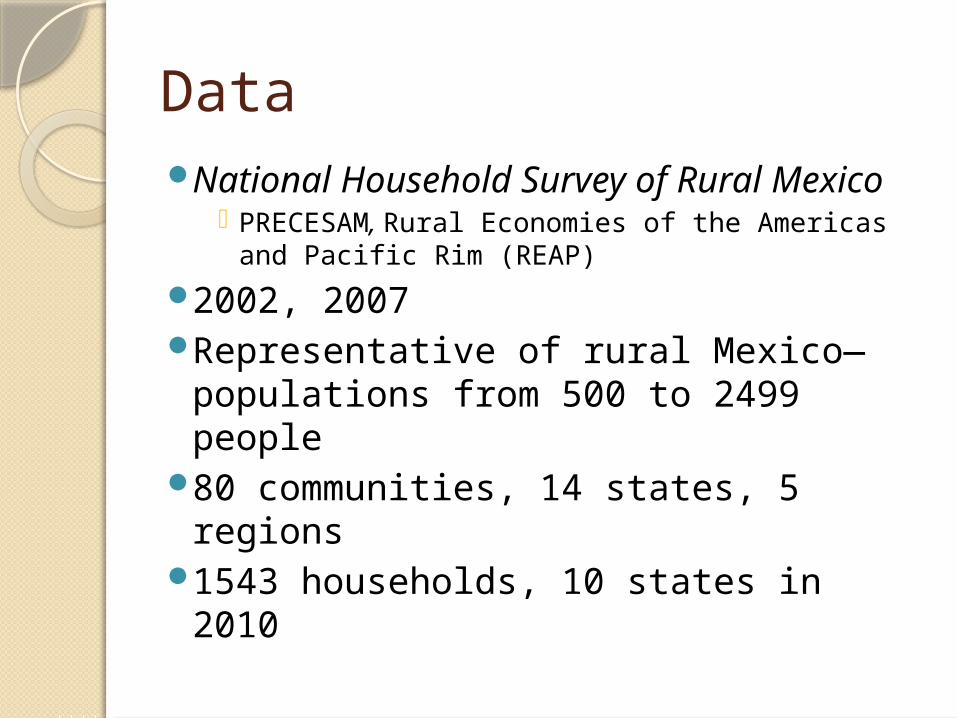
DataNational Household Survey of Rural
Mexico PRECESAM, Rural Economies of the Americas
and Pacific Rim (REAP)
2002, 2007Representative of rural Mexico—
populations from 500 to 2499 people80 communities, 14 states, 5 regions1543 households, 10 states in 2010
Household economy

𝑓 2𝜇𝜆
=𝑃𝐺
𝛿𝑈 3
𝑈 2
= 𝑓 3= 𝑓 1𝐹′ (𝐿𝐹 )
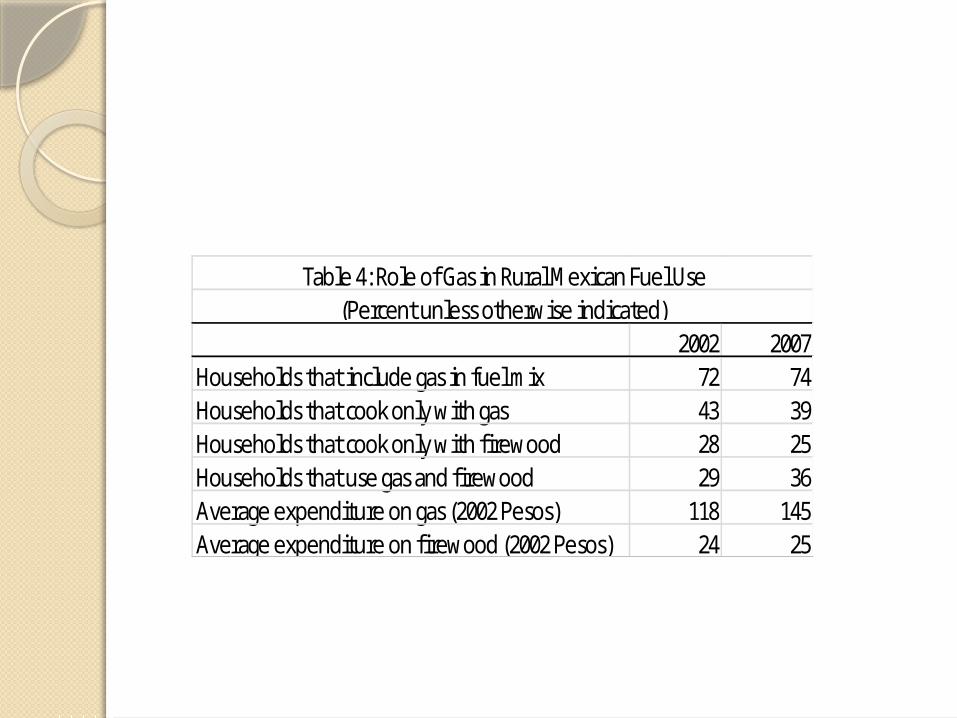
2002 2007Households that include gas in fuel mix 72 74Households that cook only with gas 43 39Households that cook only with firewood 28 25Households that use gas and firewood 29 36Average expenditure on gas (2002 Pesos) 118 145Average expenditure on firewood (2002 Pesos) 24 25
Table 4: Role of Gas in Rural Mexican Fuel Use(Percent unless otherwise indicated)