Migrated Tribal Women’s (A Geographical Study ofijirssc.in/pdf/1483190477.pdf2 Assistant Professor...
10
International Journal of Interdisciplinary Research in Science Society and Culture(IJIRSSC) Vol: 2, Issue:2, (December Issue), 2016 ISSN: (P) 2395-4335, (O) 2455-2909 © IJIRSSC www.ijirssc.in Page 1 Changing Economic Status and Life Style of Migrated Tribal Women’s (A Geographical Study of Dindori District) Dr. Lokesh Shrivastava D. Litt. 1 , Dr. Ritu Rani 2 , Shashikant Nag 3 Dept.of Post Graduate Studies and Research in Geography, Rani Durgavati University, Jabalpur 2 Assistant Professor Geography, Govt. Mahakoshal Arts and Commerce College, Jabalpur 3 Corresponding Author, e-mail : [email protected] ____________________________________________________________________________________________ ABSTRACT : Today throughout the world migration is contributing to economic and social development by enabling man to overcome the primary policy objective of regional science. The role played by migration in socio-economic development requires one to view it historically, since its form and role have changed somewhat over time. Madhya Pradesh has the largest population of STs of all state. Migration has long been a livelihood strategy for tribes from the southern districts. Dindori district is situated between 80 0 35’ to 80 0 58’ E longitude and 22 0 17’ to 23 0 22’ N latitude. Schedule tribe population of the Dindori district is 374,447 people and sex ratio is 1004 females on per thousand males. This research paper based on primary and secondary data, Occupation work, monthly income and monthly saving are determined by their economic status. Mostly tribal women’s occupation wage labour (65.43%) and domestic work (24.57). minimum 0.86 percent migrated women are in Govt. jobs. Maximum migrated women earned Rs. 3000-3500 per month and they saved average Rs. 1500-2000 money per month. Maximum 42.86 percent migrant family talking style has changed. 11.14 percent people’s dressing style changed. Keywords: Migrate Tribal Women, Economic Status of Migrated Tribal Women, Life Style of Migrated Tribal women. ____ ____________________________________________________________________________ I. Introduction: Migration is the geographic movement of people across a specified boundary for the purpose of establishing a new permanent or semi-permanent residence. Along with fertility and mortality, migration is a component of the population change. A migrant is classified both on the basis of place of birth as well as by place of last residence. Usually place of last residence is more widely used to distinguish migrants from non-migrants as it is a better indicator than place of birth. A person is considered as migrant by place of last residence, if the place in which he/she is enumerated during the census is other than his/her place of immediate last
Transcript of Migrated Tribal Women’s (A Geographical Study ofijirssc.in/pdf/1483190477.pdf2 Assistant Professor...

International Journal of Interdisciplinary Research in Science Society and Culture(IJIRSSC) Vol: 2, Issue:2, (December Issue), 2016 ISSN: (P) 2395-4335, (O) 2455-2909 © IJIRSSC
www.ijirssc.in Page 1
Changing Economic Status and Life Style of
Migrated Tribal Women’s (A Geographical Study of
Dindori District)
Dr. Lokesh Shrivastava D. Litt.1, Dr. Ritu Rani
2, Shashikant Nag
3
Dept.of Post Graduate Studies and Research in Geography, Rani Durgavati University, Jabalpur 2 Assistant Professor Geography, Govt. Mahakoshal Arts and Commerce College, Jabalpur
3 Corresponding Author, e-mail : [email protected]
____________________________________________________________________________________________
ABSTRACT : Today throughout the world migration is contributing to economic and social
development by enabling man to overcome the primary policy objective of regional science. The role
played by migration in socio-economic development requires one to view it historically, since its form
and role have changed somewhat over time. Madhya Pradesh has the largest population of STs of all
state. Migration has long been a livelihood strategy for tribes from the southern districts. Dindori
district is situated between 80035’ to 80
058’ E longitude and 22
017’ to 23
022’ N latitude. Schedule tribe
population of the Dindori district is 374,447 people and sex ratio is 1004 females on per thousand
males. This research paper based on primary and secondary data, Occupation work, monthly income
and monthly saving are determined by their economic status. Mostly tribal women’s occupation wage
labour (65.43%) and domestic work (24.57). minimum 0.86 percent migrated women are in Govt. jobs.
Maximum migrated women earned Rs. 3000-3500 per month and they saved average Rs. 1500-2000
money per month. Maximum 42.86 percent migrant family talking style has changed. 11.14 percent
people’s dressing style changed.
Keywords: Migrate Tribal Women, Economic Status of Migrated Tribal Women, Life Style of Migrated
Tribal women.
____ ____________________________________________________________________________
I. Introduction:
Migration is the geographic movement of people across a specified boundary for the
purpose of establishing a new permanent or semi-permanent residence. Along with fertility and
mortality, migration is a component of the population change. A migrant is classified both on
the basis of place of birth as well as by place of last residence. Usually place of last residence
is more widely used to distinguish migrants from non-migrants as it is a better indicator than
place of birth. A person is considered as migrant by place of last residence, if the place in
which he/she is enumerated during the census is other than his/her place of immediate last

International Journal of Interdisciplinary Research in Science Society and Culture(IJIRSSC) Vol: 2, Issue:2, (December Issue), 2016 ISSN: (P) 2395-4335, (O) 2455-2909 © IJIRSSC
www.ijirssc.in Page 2
residence. By capturing the latest of the migrations in cases where persons have migrated more
than once, this concept would give a better picture of current migration scenario [1].
Migration is one of the three components of population change. The other two are
fertility and mortality. The nature of migration as a component of population change is,
however, different from fertility and mortality. Though, a set of social, economic, political and
cultural factors determine the fertility and mortality levels in a population, these components
largely operate within the biological framework .Migration is an equilibrating process serving
to improve relations between man’s numbers and his physical environment or to reduce
disparity between communities or regions in different stages of development or to give rise to
an increase in the overall productivity of the factorial equipment of a region or country .
There is a vast body of literature on migration, with interpretations from different
disciplinary perspectives. Earlier analyses of migration were rooted in economic theory [2]
focusing on the rational behavior of individuals. More recently, economic theories have been
broadened to accommodate transaction costs, imperfect information as well as imperfections in
rural capital markets .The new thinking on migration also departs from Marxist analyses and
gives more recognition to agency and how complex interactions between structure and agency
shape migration outcomes [3]. The analysis has now been extended to understanding
vulnerability among migrant households. For example, Mosse et al (2002)[4] in their study of
tribal migrants from the States of Madhya Pradesh, Gujarat and Rajasthan state that ‘the
problem is not so much one of declining production, as of systems of usurious money lending,
labour contracting and exploitation’. Much of the migration has been undertaken by
historically poor and asset-less communities who are typically lower caste and tribals. Some of
them have now entered high-return migration streams where they get regular work at wage
rates much higher than they would have earned at home.
Tribal Migration
Tribal society is largely egalitarian and tribal women have been equal partners with tribal
men in the contribution to household economy. Quite often their women do more physical
labour in their agricultural fields and forest than that of the tribal men. Tribal women have
usually enjoyed a higher social status in their own communities than Indian women in general.
Some of the tribes in sub-Himalayan regions like Khasis of Meghalaya are matriarchal. As
indicated earlier the socio-economic profile of tribals especially the tribal women is quite low
compared to tribal men and general population and this is also associated with poor nutritional
and health status among the tribals.
Tribal’s are engaged in various occupations like hunting, fishing, gathering of forest
products, shifting cultivation to settled agriculture, rural crafts and artisans. A very few tribal

International Journal of Interdisciplinary Research in Science Society and Culture(IJIRSSC) Vol: 2, Issue:2, (December Issue), 2016 ISSN: (P) 2395-4335, (O) 2455-2909 © IJIRSSC
www.ijirssc.in Page 3
groups are engaged in non-agricultural activities as mendicants, bards, pastoralists leading a
semi-nomadic to nomadic life. Besides routine household work, the tribal women work in the
agricultural fields, forests for long hours. The overall output if seen in terms of number of
hours of work is low. Migration to towns and cities often negatively influences the tribal
culture and identity. In addition to dam construction and mining there are problems with access
to forest resources where tribals neither have control nor any kind of participation in forests,
which once were their abode and were one of the major sources of their livelihood.
In the 18th and 19th Centuries, the migration was forced as the British employed tribal
labour to work in the Assam tea gardens. However, since the latter half of the 20th Century,
tribal people from these areas have started migrating voluntarily to earn their livelihood. In the
last century, a noticeable change was visible in the nature and pattern of tribal migration.
Between 1950 and 1980, tribal people migrated to the rural areas of Bihar, West Bengal mainly
to work as agricultural labour [4].
Madhya Pradesh has ranked among the least developed states in India. It has the largest
population of STs of all state. Migration has long been a livelihood strategy for tribals from the
southern districts. Many migrate to the neighbouring states of Maharashtra and Gujarat. Until
about 2005 the recruitment of migrant construction workers from this area was largely done by
local agents.
Tribal migrants have found jobs in factories, agro-processing plants or working as porters,
domestic servants, bus cleaners, rickshaw pullers, street hawkers, petty traders, construction
workers and domestic workers. Migrants are often willing to take on jobs that others cannot or
do not want to do (those that are dirty, degrading and dangerous). The work is commonly
poorly paid and insecure but it is very attractive to those from marginal areas where wages are
too low to make a living. Income is one driver, with people migrating in search of paid
employment. Early studies also reported that internal migration can lead to positive change in
both sending and receiving areas [5].
II. Objectives of the Study:
The main objective of this research are given as under -
1. To studies the occupational structure of migrated tribal women.
2. To studies the income of migrated tribal women.
3. Study of changing social status of migrated tribal women.
III.Methodology:
This study is based on primary and secondary data. Primary data has collected to
questionnaire and interview methods. Secondary data is collected to published and unpublished

International Journal of Interdisciplinary Research in Science Society and Culture(IJIRSSC) Vol: 2, Issue:2, (December Issue), 2016 ISSN: (P) 2395-4335, (O) 2455-2909 © IJIRSSC
www.ijirssc.in Page 4
relative literatures. This paper is based on the sample survey. Data has been collected from
Stratified random sampling method. Dindori district is chosen purposively due to their large
tribal population and tribal migration. All seven blocks have been selected from districts. Five
villages have been randomly selected from each block and 10 families from each of the
selected village. Thus a total of 350 families has been planned and included in the survey.
IV.Study Area:
Dindori district is situated south-east of Madhya Pradesh. The border line of this district
touches the Shahdol and Umaria districts (Rewa region, Madhya Pradesh), in east Bilaspur and
Rajnandgaon districts
(Chhastisgarh) and in west
Jabalpur distric (Madhya
Pradesh). Dindori district is
situated between 80035’ to
80058’ E longitude and 22
017’
to 23022’ N latitude.
Geographically,it is situated on
the bank of river Narmada
between Satpura ranges. The
average height of the place is
992 meters from the mean sea
level, in which the highest point
is 1100 meters and the lowest
point is 340 meters. The area of
Dindori district is 6128 square
kilometers. Dindori district is
surrounded by Satpura and
Maikal Ranges, which is made
from the Gondwana rocks.
Maikal Ranges which is an
important future of Satpura,
acting as a geological division
of eastern and western part of
India, passes through the eastern
part of Dindori. The relief
feature of northern Narmada valley is rather irregular, which some fertile black soil is visible.
The Narmada River makes the north boundary line of the district and flows from east to west.
The maximum temperature of the district is 400 Celsius (May - June) and minimum
temperature is 100 Celsius (January). Average annual rainfall of dindori district is 677 mm
International Journal of Interdisciplinary Research in Science Society and Culture(IJIRSSC) Vol: 2, Issue:2, (December Issue), 2016 ISSN: (P) 2395-4335, (O) 2455-2909 © IJIRSSC
www.ijirssc.in Page 5
(Shrivastava L., 2012 and Ritu Rani, 2009). As per the administrative Dindori district is
divided into two Tehsils and seven block development. The total population of Dindori district
is 70,4218 (2011). Schedule tribe population of the Dindori district is 37,4447 people and
schedule caste population is 33,848 people. Sex ratio is 1004 females on per thousand males.
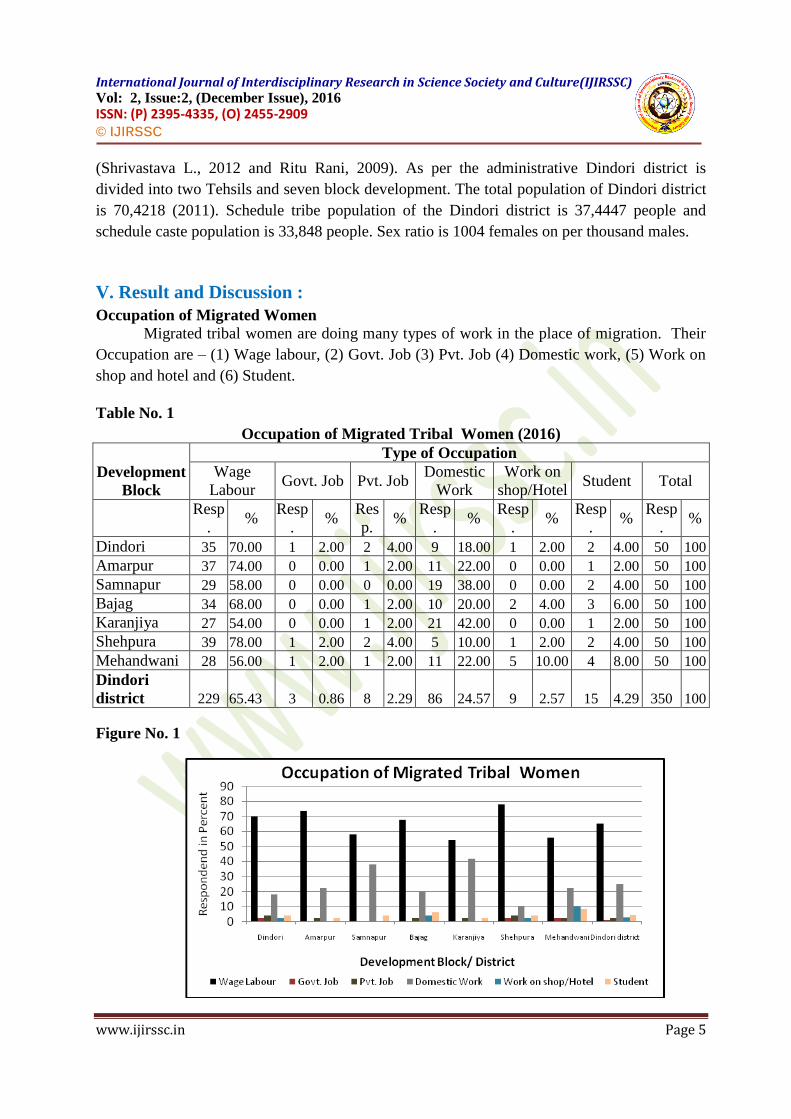
V. Result and Discussion :
Occupation of Migrated Women
Migrated tribal women are doing many types of work in the place of migration. Their
Occupation are – (1) Wage labour, (2) Govt. Job (3) Pvt. Job (4) Domestic work, (5) Work on
shop and hotel and (6) Student.
Table No. 1
Occupation of Migrated Tribal Women (2016)
Development
Block
Type of Occupation
Wage
Labour Govt. Job Pvt. Job
Domestic
Work
Work on
shop/Hotel Student Total
Resp
. %
Resp
. %
Res
p. %
Resp
. %
Resp
. %
Resp
. %
Resp
. %
Dindori 35 70.00 1 2.00 2 4.00 9 18.00 1 2.00 2 4.00 50 100
Amarpur 37 74.00 0 0.00 1 2.00 11 22.00 0 0.00 1 2.00 50 100
Samnapur 29 58.00 0 0.00 0 0.00 19 38.00 0 0.00 2 4.00 50 100
Bajag 34 68.00 0 0.00 1 2.00 10 20.00 2 4.00 3 6.00 50 100
Karanjiya 27 54.00 0 0.00 1 2.00 21 42.00 0 0.00 1 2.00 50 100
Shehpura 39 78.00 1 2.00 2 4.00 5 10.00 1 2.00 2 4.00 50 100
Mehandwani 28 56.00 1 2.00 1 2.00 11 22.00 5 10.00 4 8.00 50 100
Dindori
district 229 65.43 3 0.86 8 2.29 86 24.57 9 2.57 15 4.29 350 100
Figure No. 1

International Journal of Interdisciplinary Research in Science Society and Culture(IJIRSSC) Vol: 2, Issue:2, (December Issue), 2016 ISSN: (P) 2395-4335, (O) 2455-2909 © IJIRSSC
www.ijirssc.in Page 6
Above table No. 4 and Figure No. 4 are showing the occupation of migrated women.
Total average 65.43% migrated women’s occupation are wage labour. 24.57 % women are
doing domestic work, 4.29% migrated women are students, 2.57% migrated women work on
shop and hotel, 2.29% women are doing pvt. Job and only 0.86% women are doing govt. job.
Maximum 78.00% migrated women of shehpura block are wage labour. Maximum 42% are
done domestic work by migrate women of Karanjiya block.
Income of Migrated Tribal Woman
The income of the migrated tribal women has been divided in to the six categories
which are shown in the given table no. 2.
Table No 2
Average Monthly Income of Migrated Woman (in Rs) (2016)
Development
Block
Monthly income
Up to Rs.
2000 2000-2500 2500-3000 3000-3500 3500-4000
Above
4000 Total
Resp
. %
Resp
. %
Resp
. %
Resp
. %
Resp
. %
Resp
. %
Resp
. %
Dindori 14 28.00 3 6.00 4 8.00 23 46.00 4 8.00 2 4.00 50 100
Amarpur 10 20.00 8 16.00 1 2.00 27 54.00 1 2.00 3 6.00 50 100
Samnapur 11 22.00 9 18.00 2 4.00 19 38.00 5 10.00 4 8.00 50 100
Bajag 13 26.00 7 14.00 5 10.00 21 42.00 3 6.00 1 2.00 50 100
Karanjiya 9 18.00 16 32.00 6 12.00 13 26.00 4 8.00 2 4.00 50 100
Shehpura 11 22.00 6 12.00 5 10.00 25 50.00 2 4.00 1 2.00 50 100
Mehandwani 4 8.00 8 16.00 2 4.00 32 64.00 2 4.00 2 4.00 50 100
Dindori
district 72 20.57 57 16.29 25 7.14 160 45.71 21 6.00 15 4.29 350 100
Figure No. 2

International Journal of Interdisciplinary Research in Science Society and Culture(IJIRSSC) Vol: 2, Issue:2, (December Issue), 2016 ISSN: (P) 2395-4335, (O) 2455-2909 © IJIRSSC
www.ijirssc.in Page 7
This Table No. 2 and Figure No. 2 are shown average monthly income of migrated
woman (in Rs.) of Dindori district. 20.57 percent women earn up to Rs. 2000, maximum 45.71
percent women earn 3000-3500 Rs. Per month. Only 4.29 percent women earn above 4000 Rs.
Per month. Maximum 64.00 percent migrated woman of Mahandwani development block
earned 3000-3500 Rs. per month.
Savings of Migrated Women
Saving is an important parts every people. Migrated tribal women are also saving
money for future need. There is categorized in six part of their average monthly saving which
is showing the following table.
Table No. 3
Average Monthly Savings of the Migrant Women (in Rs) (2016)
Development
Block
Monthly Savings
Upto Rs.
1500
1500-
2000
2000-
2500
2500-
3000
3000-
3500
Above
3500 Total
Resp. % Resp. % Resp. % Resp. % Resp. % Resp. % Resp. %
Dindori 17 34.00 26 52.00 6 12.00 1 2.00 0 0.00 0 0.00 50 100
Amarpur 10 20.00 27 54.00 8 16.00 5 10.00 0 0.00 0 0.00 50 100
Samnapur 15 30.00 28 56.00 4 8.00 0 0.00 2 4.00 1 2.00 50 100
Bajag 12 24.00 26 52.00 3 6.00 3 6.00 1 2.00 5 10.00 50 100
Karanjiya 11 22.00 29 58.00 7 14.00 2 4.00 1 2.00 0 0.00 50 100
Shehpura 13 26.00 24 48.00 4 8.00 6 12.00 2 4.00 1 2.00 50 100
Mehandwani 17 34.00 31 62.00 1 2.00 1 2.00 0 0.00 0 0.00 50 100
Dindori district 95 27.14 191 54.57 33 9.43 18 5.14 6 1.71 7 2.00 350 100
Figure No. 3

International Journal of Interdisciplinary Research in Science Society and Culture(IJIRSSC) Vol: 2, Issue:2, (December Issue), 2016 ISSN: (P) 2395-4335, (O) 2455-2909 © IJIRSSC
www.ijirssc.in Page 8
Above table No. 3 and Figure No. 3 are showing average monthly saving of the
migrated women (in Rs.). Maximum 54.57 percent migrated women of this district save Rs.
1500-2000 per month and minimum 1.71 percent migrated tribal woman save Rs. 3000-3500
per month. Maximum 62.00 percent migrated women of Mehandwani development block save
1500-2000 Rs. per month.
Social Change
Tribal women’s lifestyles are traditionally in their birth place. They eat traditionally
food, wear traditionally dress, talking style are traditionally, they speak traditionally language,
they take traditionally health treatment and they do not care their health. But when tribal
women and their family migrated then their food habit, dressing style, taking style language
health care behavior are changed in migrant place. Following table is showing their social
change.
Table No. 4
Social Change on Migrated Women's Family (2016)
Development
Block
Social Change
Food
Habit
Dressing
Style
Talking
Style Language
Health
Care
Behavior
Cleanliness
and
Hygiene
Related
Total
Resp. % Resp. % Resp. % Resp. % Resp. % Resp. % Resp. %
Dindori 5 10.00 7 14.00 23 46.00 8 16.00 5 10.00 2 4.00 50 100
Amarpur 7 14.00 8 16.00 21 42.00 9 18.00 2 4.00 3 6.00 50 100
Samnapur 6 12.00 5 10.00 26 52.00 5 10.00 3 6.00 5 10.00 50 100
Bajag 8 16.00 4 8.00 19 38.00 3 6.00 4 8.00 12 24.00 50 100
Karanjiya 4 8.00 8 16.00 18 36.00 7 14.00 5 10.00 8 16.00 50 100
Shehpura 2 4.00 5 10.00 24 48.00 13 26.00 2 4.00 4 8.00 50 100
Mehandwani 2 4.00 2 4.00 19 38.00 15 30.00 1 2.00 11 22.00 50 100
Dindori district 34 9.71 39 11.14 150 42.86 60 17.14 22 6.29 45 12.86 350 100

International Journal of Interdisciplinary Research in Science Society and Culture(IJIRSSC) Vol: 2, Issue:2, (December Issue), 2016 ISSN: (P) 2395-4335, (O) 2455-2909 © IJIRSSC
www.ijirssc.in Page 9
Figure No. 4
Above table No. 4 and Figure No. 4 are showing the social change on migrated
women’s family. Maximum 42.86 percent migrated family talking style has changed. 11.14
percent people’s dressing style changed. 9.71 percent people’s food habit, 17.14 percent
people’s language, 6.29 percent people’s health care behavior and 12.86 percent people’s
Cleanliness and Hygiene Related changed.
VI.Conclusion:
The occupational structures of migrated tribal women are Wage labour, domestic work, work
on shop/hotel government and private job and student. Mostly migrated tribal women’s
occupation is wage labour (65.43), 24.57 percent Migrated tribal women are domestic work,
4.29 percent are student, approximate 3 percent migrated women are in government (0.86) and
private job (2.29). Income and saving is played important role in economic status. 45.71
percent migrated tribal women are earned Rs. 3000-3500 per month, 16.29 percent women are
earned Rs. 2000-2500 per month, 54.57 percent women’s saving are Rs. 1500-2000 and 5.14
percent women saved Rs. 2500-3000 per month.
In this study the food habit, dress up sense, the way of talking, local or regional
language, health care awareness, cleanliness and hygiene of tribal migrated women has been
examined. The food habit of these women’s are a slightly change maximum of 16 percent in
Bajag Development block and minimum change was found in Shahpura and Mahandwani
development block in Dindori district. Therefore it is concluded that a very small change has
been seen amongst the migrated tribal women’s food habit. Dressing style of tribal migrant
women has a little bit change in these women. Maximum 16 percent change was found in
Karanjiya and Amarpur Development block and minimum change seen in Mahandwani
International Journal of Interdisciplinary Research in Science Society and Culture(IJIRSSC) Vol: 2, Issue:2, (December Issue), 2016 ISSN: (P) 2395-4335, (O) 2455-2909 © IJIRSSC
www.ijirssc.in Page 10
development block. Talking style of migrated tribal women’s maximum 52 percent in
Samnapur development block. It is concluded that big change has been seen in their talking
style. Cleanliness and hygiene related change has been seen in Bajag (24 percent) and
Mehandwani (22 percent) development blocks.
References:
[1] Census of India 2011.
[2] Todaro, M.P. (1976) Internal Migration in Developing Countries, Geneva: ILO.
[3] Kothari U. (2002) ‘Migration and Chronic Poverty’, Working Paper 16, Manchester:
Chronic Poverty Research Centre, Institute for Development Policy and Management,
University of Manchester.
[4] Mosse, D., Gupta, S., Mehta, M., Shah, V., Rees, J. and the KRIBP Project Team (2002)
‘Brokered Livelihoods: Debt, Labour Migration and Development in Tribal Western
India’, Journal of Development Studies 38(5): June, pp. 59–87.
[5] Deshingkar, P., S. Kumar, H. Kumar Chobey and D. Kumar. (2006) The Role of
Migration and Remittances in Promoting Livelihoods in Bihar. Bihar Rural Livelihoods
Project (BRLP) India.