
MID RANGE PLAN October 4, 2011. Executive Summary SPE Divisional Details – Motion Pictures –...
61
MID RANGE PLAN October 4, 2011
-
Upload
rodney-gaines -
Category
Documents
-
view
213 -
download
0
Transcript of MID RANGE PLAN October 4, 2011. Executive Summary SPE Divisional Details – Motion Pictures –...

MID RANGE PLAN
October 4, 2011

• Executive Summary
• SPE Divisional Details
– Motion Pictures– Digital Productions– Home Entertainment– Television
• Financial Summary
• Closing
• Q&A
2
Agenda

EXECUTIVE SUMMARY

Executive Summary
• The market trends SPE identified in prior MRPs will continue to unfold over the next three years
– Transitions in home entertainment to lower-margin rental models will continue to put pressure on film economics and may only be partially offset by growth in digital
– Films remain a key component of the studio business and maintaining their current profit contribution requires carefully adjusting slate mix
– TV production and networks, both high-growth / high-margin businesses, are an increasing percentage of studios' profits
• SPE has positioned itself to succeed in this market environment with a balanced approach to both film and television
– Focusing on films that benefit from market trends (franchises, international appeal, family)
– Continuing to generate television series with global appeal and investing for growth in networks
– Emphasizing higher-margin distribution models in home entertainment– Leveraging corporate overhead between the film and television businesses– Carefully managing costs and cash flow
• This balanced portfolio gives SPE the opportunity to respond to changes in the market and promptly shift resources to new areas of growth
• The result of this strategy is strong profit and cash flow growth over the MRP period– EBIT growing from $365MM in FYE12 to $700MM in FYE15– Net cash flow growing from $25MM in FYE12 to $400MM in FYE15– No monetizations or challenges in FYE13 through FYE15 4

$365
$500
$600
$700
$0
$100
$200
$300
$400
$500
$600
$700
$800
FYE12 FYE13 FYE14 FYE15
$8,515$9,487
$9,980$10,943
$0
$2,000
$4,000
$6,000
$8,000
$10,000
$12,000
FYE12 FYE13 FYE14 FYE15
Strong Growth for the Top and Bottom Lines
5
Revenue ($MM) EBIT ($MM)
9% CAGR
24% CAGR

6
Market Trends:Increased Consumption
• Increased access to content through new devices drives incremental viewership, creates new revenue streams, and represents continued growth opportunities
– The average consumer now views content on 3.5 devices– Total TV viewership per average consumer per week has grown from
31.2 hours in 2006 to 33.2 hours in 2010 and is projected to reach 34.3 hours by 2014(1)
– Netflix is a new buyer for television content and streaming rights
• The flood of new access models in the market has strengthened the link between devices and content
– Content providers marketing their device-specific applications– Hardware providers marketing their content relationships
1. Source: Veronis Suhler Stevenson.
7
Market Trends: Shift in Economics
• Home entertainment revenues are under pressure as physical sell-through gives way to physical rental options (Netflix, Redbox) perceived to have greater value and convenience
– The growth of digital transactions has only partially offset the decline in physical sell-through; digital is anticipated to remain approximately 30% of HE contribution through FYE15
– Video on demand is growing and offers higher margins than subscription or kiosk rentals, however electronic sell-through has been slower to gain momentum
• As a result of these market shifts, film economics have changed– International appeal is increasingly important to ensure a profitable slate– Franchise films and family content are less susceptible to the decline in home
entertainment and offer greater international revenue potential– Third party financing sources are demanding more favorable terms to offset risk– Talent is willing to delay compensation until a film breaks even, but total talent
compensation still remains high
• The television market, including networks and production, continues strong growth
– International networks are capitalizing on the increase in emerging market pay-TV households
– The global ad market has generally rebounded despite a sluggish economy– New technologies have increased the number of buyers of TV content (e.g., Netflix)– Formats are travelling more internationally– Local television production is increasingly in demand

8
Market Trends: Comparison to Music
• The market forces putting pressure on home entertainment revenues are distinct from those challenging music revenues
• Home entertainment has been primarily impacted by a shift from physical sell-through to new models for physical rental (Netflix, Redbox), rather than a shift from physical to digital
• Filmed entertainment is partially insulated from the challenges the music industry faces with digital distribution
– Unbundling: Music went from album sales ($10+) to digital singles ($0.99); films cannot be unbundled
– Piracy: Music's unencrypted CDs made file sharing easier and fostered the view that ripped and shared music is acceptable; film faces piracy, however encryption on DVDs/BDs makes consumers more aware film piracy is illegal and larger file sizes make downloading harder
• Going forward, film's windowing model offers more flexibility to capitalize on the growth in digital
– Windowed distribution provides multiple opportunities for a transaction, each with a distinct value proposition and price point
– Digital offers increased pricing flexibility– Digital offerings are generally at a higher margin than their direct physical
counterparts
• Studio economics also benefit from TV Production and Networks revenue streams which are not dependent on Home Entertainment

9
Implications for SPE
• SPE will benefit from the careful structuring of its film slate which focuses on more profitable genres while simultaneously managing costs
• The new distribution models SPE is currently exploring will be critical to success in the changing home entertainment market
• SPE’s cost reduction initiatives better shape the business for the current market environment
• SPE’s mix of film and television assets takes advantage of synergies between the two and enables SPE to continually iterate on the balance between them
• SPE expects to maintain Film at its current scale and level of profitability, while benefiting from growth in Television Production and Networks

10
SPE’s Unique Positioning
Success Factors SPE’s Positioning
• Ability to capitalize on relationships between hardware and content
• Union of film and television businesses within the studio
• SPE is the only studio owned by a leading consumer electronics company, allowing for:
– Sony branding on Indian television networks that reach approximately 350MM viewers
– Product bundling and joint promotions across product lines
– Featuring Sony products in SPE films and television shows
– Continued production of 3D films to facilitate the sale of 3D electronics
• SPE has a balanced portfolio of assets across film and television
– Partially offsetting effects of fluctuations in the ad market (advertising is revenue for networks, a cost for films)
– Television dramas help drive international film sales while film franchises help drive television sales
– Television networks consume content and are output platforms for film product

DIVISIONAL DETAILS
Motion Pictures

12
Motion PicturesExecutive Summary
• Giving film slate more international appeal and greater sell-through potential
Growing family business (The Smurfs, Arthur Christmas, The Pirates! Band of Misfits, Hotel Transylvania)
Increasing focus on franchises including Spider-Man, Bond, Men in Black, Stieg Larsson films /The Girl With the Dragon Tattoo, Total Recall, Ghostbusters, The Smurfs
Pursuing low cost faith-based acquisitions (Jumping the Broom, Courageous)
• Improving economics of existing businesses Reducing production and marketing costs Pursuing film co-financing and tax-based incentives Adding fee based titles from outside producers (e.g., Film District deals) Focusing on genre and production cost mix
Columbia - Tentpoles with global appeal and low budget films with upside Screen Gems - Genres films (e.g., thriller, comedy, action) at low cost
Fostering key relationships to ensure product flow (talent, Aardman, distribution deals)
Benefiting from at-cost production support from Imageworks
SPE will benefit from the careful structuring of its film slate which focuses on more profitable genres while simultaneously managing
costs

• Numerous titles are in negotiation, active development or production with an eye toward release in the next few years
Stieg Larsson novels Spider-Man
Total Recall Men in Black
Ghostbusters Bad Boys
Salt Peter Pan (origin story)
Houdini Uncharted
• Amazing Spider-Man sequel is planned for FYE15, two years after the reboot• Bond 23 and Bond 24 have been added• Resources are being focused on licensing/developing video game titles such
as PlayStation brands (Metal Gear Solid, Gran Turismo)13
Motion PicturesFranchise Films
Increasing our focus on franchise films to succeed in a changing
environment

APRIL MAY JUNE JULY
DECEMBER JANUARY FEBRUARY MARCH
AUGUST SEPTEMBER OCTOBER NOVEMBER
Kathryn Bigelow Project $45
Amazing Spider-Man [3D] $250
Total Recall $150
Planet B-Boy [3D] $40
Sparkle $35
Great Hope Springs $70
Django Unchained (Int’l only - $125)
Captain Phillips $85By Dom Box Office
$90MM + = 8 Films$70MM - $85MM = 4 Films$45MM - $65MM = 2 Films$0MM - $40MM = 5 Films
TBD #1 Comedy $80Here Comes the Boom $80
TBD #1 Rom Com $35
Bond 23 $180Hotel Transylvania [3D] $120Resident Evil 5 [3D] $55Looper $40
Think Like a Man $40
Elysium $125
14
Columbia (12 films)
SPA (1 film)
Screen Gems (4 films)
Motion PicturesFYE13 Release Slate
I Hate You Dad $90
Acquisitions (5 films)
Men in Black [3D] $230
3 TBD Acquisition titles not shown above

• FYE11 and FYE12 production spending is lower due to smaller slates and delays of franchise films (e.g., Ghostbusters) to later years
• Slate financing less available due to uncertainty in financial markets
• Production savings achieved with tax-based incentives, utilizing technology to gain time and reduce costs, maintaining script integrity (cost overruns under 2% in last four years)
15
Motion PicturesProduction Spending
Production Spending ($MM) *
* Excludes Film Financing Benefit
$300
$499 $608
$731 $794
$943
$1,031
$399 $178
$467 $319
$306
$0
$200
$400
$600
$800
$1,000
$1,200
$1,400
2010 2011 2012 2013 2014 2015
Franchise/Tentpole films All other films
$1,331
$898$786
$1,198$1,113
$1,249MRP Assumptions
Motion Picture production spending in FYE13 through FYE15 is heavily focused on franchise films

$28 $25 $25 $25
$44 $47 $43 $43
$0
$20
$40
$60
$80
2012 2013 2014 2015
Project Spending Term Deals
• Limiting new projects• Signing one-step deals or
reducing rates where possible
• Eliminating non-productive term deals
Development Spending ($MM)
$72 $72$68
16
Motion PicturesDevelopment Spending
$68
Controlling both commitments and
spending based on slate needs
Investing in major franchise films without increasing overall development spend

• Negotiating post break back-end deals, reducing upfront fees for talent, and/or causing talent to accept a “hiatus”
- The six internally developed FYE13 titles have post cash-break deals or have talent “hiatus”
- Have successfully reduced upfront compensation and renegotiated back-end deals prior to starting principal photography
• Monitoring global incentives to capitalize on the opportunities to lower production cost
PShoot in countries where costs are low
PShoot in California where travel and other costs are minimized
• Exploiting tax-based incentives on a worldwide basis will save approximately $55MM on FYE12 releases and $106MM on FYE13 releases
• Recently closed $100MM co-financing deal with Hemisphere17
Motion PicturesReduce Production Costs

• Over the last six years, SPE has kept theatrical marketing and distribution costs down or flat relative to prior years
– This was accomplished through a variety of initiatives including less TV and Newspaper and increased utilization of digital
• FYE12 has seen a significant rebound in the US ad market– TV upfront marketplace was over $20 billion – highest ever– Dollar volume up 6.5% over prior year– Rate of change (inflation) in high single to mid double digits across
the board
• This strong US ad market will make it increasingly difficult to keep marketing costs flat, however if the market dips again, SPE will take advantage of lower ad rates
• SPE will continue to pursue cost savings opportunities including the use of in-show promotional time
Motion PicturesManaging Marketing and Distribution Spend
18

19
• Growth in digital cinema drives a more robust market for 3D and emerging theatrical technologies; this ultimately keeps the cinema a unique and compelling experience− Recent SPE 3D releases: The Green Hornet, Priest and The Smurfs− Upcoming SPE 3D releases: Arthur Christmas and The Adventures of Tintin (Int’l only), The Amazing
Spider-Man and MIB3; additional 3D titles slated for FYE12
• Distribution savings relative to historic print costs will be modest until VPFs expire (2019 through 2022 in North America)
• However, digital enables near-term savings opportunities by streamlining distribution processes, specifically, production of fewer trailers for the same screen coverage and delivery of content via satellite or fiber
Source: Sony Pictures Releasing. All YTD data as of September 2011.
2011 YTD 2011 E 2012 E 2013 E0
10,000
20,000
30,000
40,000
50,000
11,698 14,000 19,000 22,000
10,072 11,000
14,000 15,000
20,222 16,992 8,992
4,992
North America Digital Rollout
3D Digital 2D Digital 35mm
2011 YTD 2011 E 2012 E 2013E0
20,000
40,000
60,000
80,000
100,000
120,000
140,000
34,135 39,500 55,000 64,000
18,404 22,000
31,500 37,000 68,038 59,077
34,077 19,577
Worldwide Digital Rollout
3D Digital 2D Digital 35mm
Motion PicturesDigital Cinema
85% of all screens will be digital by the end of 2013

• Direct-to-Video (DTV) productions will be focused on sequels of recently released theatrical or successful DTV product
• Increase volume of theatrically released product from distribution fee only deals
• Continue to focus on Faith based product and pursue high-profile International all-rights acquisitions
• FYE15 EBIT reflects lower fees on output deals due to increased competition and a greater number of theatrical releases (i.e., more P&A in the year)
$91 $94 $94
$84
$0
$10
$20
$30
$40
$50
$60
$70
$80
$90
$100
Acquisitions EBIT ($MM)
FYE12 FYE13 FYE15FYE14
Margin 14% 18% 17%17%20
AcquisitionsMaximize Financial Contributions
Year
MRP Assumptions
Maintaining strong margins despite greater competition and difficult conditions in the Home Entertainment market

DIVISIONAL DETAILS
Digital Productions
22
Digital ProductionsKey Strategies
• Develop high-margin, family-friendly franchises−Create diverse slate featuring high-end CG-animated films and live-action
hybrids with strong franchise potential that lend themselves to either theatrical or DTV sequels
−Maximize ancillary revenue streams to enhance film’s core profitability
• Maintain Imageworks’ quality while continuing to reduce overall costs−Continue to focus on quality for Columbia and SPA films and to secure large
third-party projects, which also lowers costs:
Disney’s decision to award their 2013 tentpole Oz: The Great and Powerful to Imageworks was a direct outcome of the financial and creative success of Alice in Wonderland ($1B in WWBO; Oscar nomination for VFX)
−Expand facility in Vancouver to take advantage of 58.4% tax credit for labor
• Serve as a resource for Sony Corporation−SPA continues to create characters used in Sony Electronics’
marketing/promotions
−Provide 3D and VFX production expertise to SPE and Sony Corporation
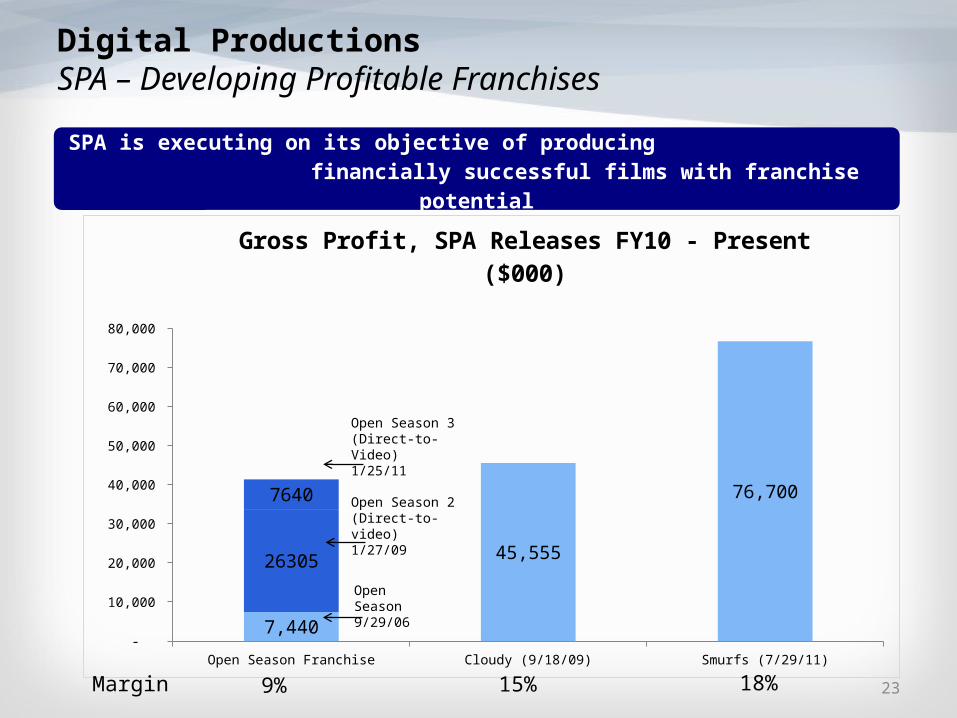
Open Season Franchise Cloudy (9/18/09) Smurfs (7/29/11) -
10,000
20,000
30,000
40,000
50,000
60,000
70,000
80,000
7,440
45,555
76,700
26305
7640
Gross Profit, SPA Releases FY10 - Present ($000)
23
Digital ProductionsSPA – Developing Profitable Franchises
Open Season 2 (Direct-to-video) 1/27/09
Open Season 3 (Direct-to-Video) 1/25/11
Open Season 9/29/06
Margin 9% 15% 18%
SPA is executing on its objective of producing financially successful films with franchise potential
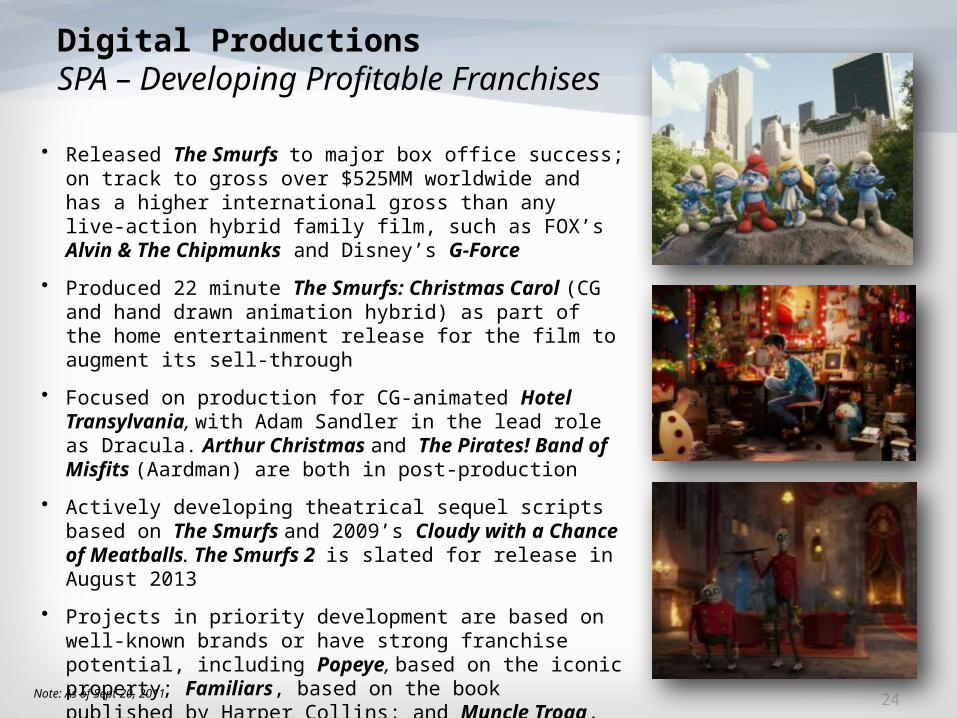
• Released The Smurfs to major box office success; on track to gross over $525MM worldwide and has a higher international gross than any live-action hybrid family film, such as FOX’s Alvin & The Chipmunks and Disney’s G-Force
• Produced 22 minute The Smurfs: Christmas Carol (CG and hand drawn animation hybrid) as part of the home entertainment release for the film to augment its sell-through
• Focused on production for CG-animated Hotel Transylvania, with Adam Sandler in the lead role as Dracula. Arthur Christmas and The Pirates! Band of Misfits (Aardman) are both in post-production
• Actively developing theatrical sequel scripts based on The Smurfs and 2009’s Cloudy with a Chance of Meatballs. The Smurfs 2 is slated for release in August 2013
• Projects in priority development are based on well-known brands or have strong franchise potential, including Popeye, based on the iconic property; Familiars, based on the book published by Harper Collins; and Muncle Trogg, also based on an award-winning book
24
Digital ProductionsSPA – Developing Profitable Franchises
Note: As of Sept 20, 2011

25
Digital ProductionsImageworks – Maintain Leadership in Quality while Lowering Costs
$(31)$(35)
$9 $6
$8
($40)
($30)
($20)
($10)
$0
$10
$20
$30
$40
FYE08 FYE09 FYE10 FYE11 FYE12
Imageworks EBIT ($MM)• Serve SPA and Columbia as
dependable source of high-quality digital animation and VFX expertise at lower cost:- Currently in production on Columbia
2012 tentpoles The Amazing Spider-Man and Men in Black 3
- Awarded Disney’s 2013 tentpole Oz: The Great and Powerful
• Secure larger budget third-party work (Warner Bros’ Green Lantern and now Disney’s Oz) as a means to reduce SPA and Columbia production cost (shared overhead, shared R&D, stronger talent pool)
• Continue to shift artists to the Vancouver facility, leveraging 58.4% tax credit on labor to continue to lower costs
Imageworks has dramatically improved its performance by re-sizing the business, increasing efficiency, growing its lower cost satellites
in Vancouver and India, and focusing on fewer, larger projects

DIVISIONAL DETAILS
Home Entertainment

27
Home Entertainment Executive Summary
• Driving consumer uptake of higher-margin models (Blu-ray, VOD, EST) Targeting convenience and value proposition in new models Developing new product features, marketing strategies and releasing tactics
• Creating compelling consumer offerings through Sony United initiatives Product bundling with SEL (e.g., 3D Blu-ray/Bravia) Joint promotions across product lines (e.g., PS3/BD ads, 3D TV/3D BD ads,
etc.)
• Closely managing profitability across each phase of the product lifecycle while reducing risk
• Achieving economies of scale through the creation of joint ventures in key territories
• Right-sizing the US sales team
The new distribution models SPE is currently exploring will be critical to success in the changing home entertainment market

1,129
2,061
2006 2014
28
North America and Western Europe: Total TV Sets and Connectable Devices Installed (in MMs)
• TV Sets• PCs• Smartphones• Connectable Games Consoles
• TV Sets (Excl. Connectable TV Sets)
• PCs• Smartphones• Connectable Game Consoles• Hybrid Set-Tops• Connectable TV Sets• Tablets• Connectable Blu-Rays
Source: Screen Digest.Note: Excludes IP streamers.
8% CAGR
The number and variety of entertainment devices is increasing rapidly
Home Entertainment Market Trends
0.0
0.5
1.0
1.5
2.0
2.5
3.0
3.5
4.0
4.5
06 07 08 09 10 11F 12F 13F 14F
0
5
10
15
20
25
06 07 08 09 10 11F 12F 13F 14F
29
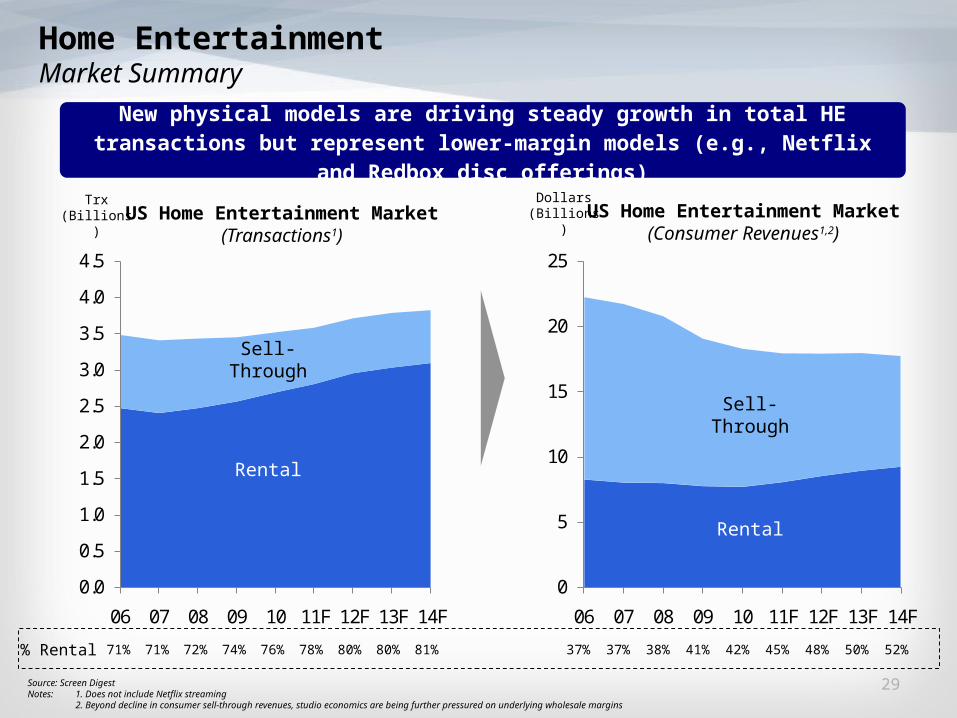
US Home Entertainment Market(Transactions1)
US Home Entertainment Market(Consumer Revenues1,2)
Trx(Billions)
Dollars(Billions)
Rental
Sell-Through
Rental
Sell-Through
Source: Screen DigestNotes: 1. Does not include Netflix streaming
2. Beyond decline in consumer sell-through revenues, studio economics are being further pressured on underlying wholesale margins
% Rental 71% 71% 72% 74% 76% 78% 80% 80% 81% 37% 37% 38% 41% 42% 45% 48% 50% 52%
New physical models are driving steady growth in total HE transactions but represent lower-margin models (e.g., Netflix and
Redbox disc offerings)
Home Entertainment Market Summary

30
4%
11%
1%
-10%
-17%-13%
-28%
-23%
-33%-35%
-31%
-26%
-39%-36%
-43%
-30%
-48%-46%
Sources: Nielsen Home Scan, title-level analysis, major studios include Fox, Lionsgate, Paramount, SPHE, Universal, Warner, and Disney (includes distributed lines); box office adjusted for inflation and 3-D admissions
Note: For titles that have fewer than 8 weeks of POS data as of July 3, 2011, 8-week POS has been projected.
Home Entertainment – Market Update
2006-2011 Sell-Through Performance Against Box Office Across All Major StudiosQuarter-on-Quarter % Change from CY2006
Q1 Q2 Q3 Q4
2006 to 2007 2006 to 2008 2006 to 2009 2006 to 2010 2006 to 2011
Q1 Q2 Q3 Q4 Q1 Q2 Q3 Q4 Q1 Q2 Q3 Q4 Q1 Q2
US New Release Sell-Through performance continues to decline – now approximately 47% below 2006 levels
31
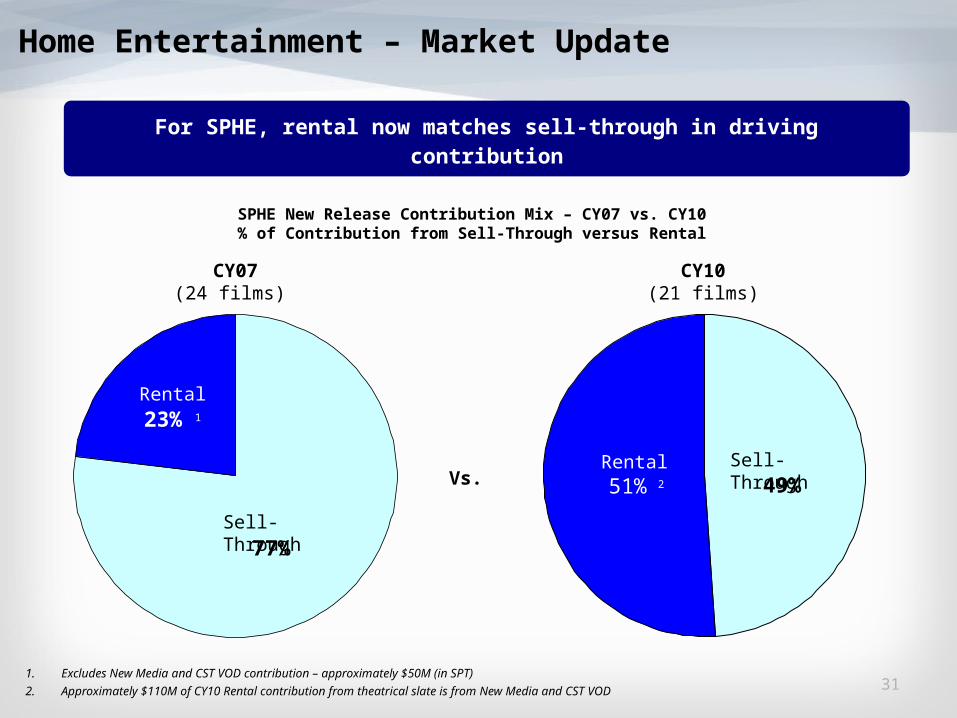
SPHE New Release Contribution Mix – CY07 vs. CY10% of Contribution from Sell-Through versus Rental
Vs.
CY07(24 films)
CY10(21 films)
23% 1
51% 2
77%
49%
1. Excludes New Media and CST VOD contribution – approximately $50M (in SPT)
2. Approximately $110M of CY10 Rental contribution from theatrical slate is from New Media and CST VOD
Home Entertainment – Market Update
Sell-Through
Sell-Through
Rental
Rental
For SPHE, rental now matches sell-through in driving contribution

32
Home Entertainment – Market UpdateOpportunity for some recovery via rise of emerging models
SPHE New Release $ Margin per Transaction
• Transition to digital is creating new opportunities for higher-margin transactions−New models−New windows
• SPE is driving toward higher-margin opportunities−EST through support of UltraViolet and
trialing early EST releases (Bad Teacher first early EST on October 4th)
−Making VOD a more compelling rental option than subscription and kiosk with longer rental periods, day & date offers and HD
• SPE is also managing lower-margin transactions by optimizing our terms with Netflix and Redbox
$15.50
$12.75
$3.29
$1.30 $1.05 $0.88
$0.00
$5.00
$10.00
$15.00
$20.00
EST PhysicalST
VOD B&MRental
KioskRental
Sub.Rental
RENTALSELL-THROUGH

33
Home Entertainment – Market UpdateMotion Picture Film Slate: Sell-Through vs. Rental Skewing Titles
Sources: Nielsen Home Scan; title-level analysis; SPHE Commercial Planning & InnovationNote: Above-average Sell-Through genres are defined as: Action, Adventure, Animated and Family
27.0% 34.4%
66.9% 56.5%
76.0%
73.0% 65.6%
33.1% 43.5%
24.0%
0%
20%
40%
60%
80%
100%
FYE '07-'11 FYE12 FYE13 FYE14 FYE15
Rental Skewing Genre Sell-Through Skewing Genre
Over the MRP period, SPHE is slated to release titles that skew more heavily toward sell-through (i.e., more Action and Family titles are in
the release slates)

$234
$198$228
$189 $201
$102$118 $111 $113 $121
$0
$50
$100
$150
$200
$250
FYE06 FYE07 FYE08 FYE09 FYE10 FYE11 FYE12 FYE13 FYE14 FYE15
($MM)
• Physical contribution is expected to decline at a (4%) CAGR from $86MM in FY12 to $76MM in FY15
• Digital contribution is expected to grow at a 12% CAGR from $32MM in FY12 to $45MM in FY15
34
Home EntertainmentContribution from Flow/Library Product
53% 45% 45% 45% 48% 37% 42% 42% 43% 43%Margin:
The total contribution from Flow/Library Product is declining; it’s anticipated
that over the MRP period, contribution will be approximately 48% less than
realized in FYE06
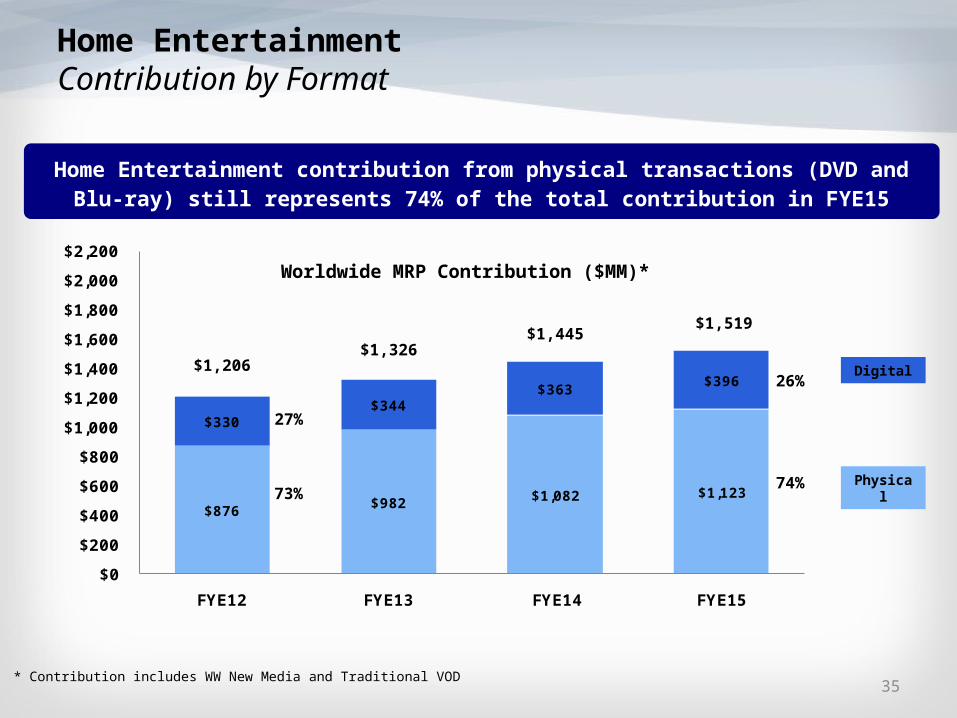
$876 $982 $1,082 $1,123
$330 $344
$363 $396
$0
$200
$400
$600
$800
$1,000
$1,200
$1,400
$1,600
$1,800
$2,000
$2,200
FYE12 FYE13 FYE14 FYE15
Digital
Physical74%
26%
$1,326
$1,519
$1,206
$1,445
35
27%
73%
Worldwide MRP Contribution ($MM)*
* Contribution includes WW New Media and Traditional VOD
Home EntertainmentContribution by Format
Home Entertainment contribution from physical transactions (DVD and Blu-ray) still represents 74% of the total contribution in FYE15
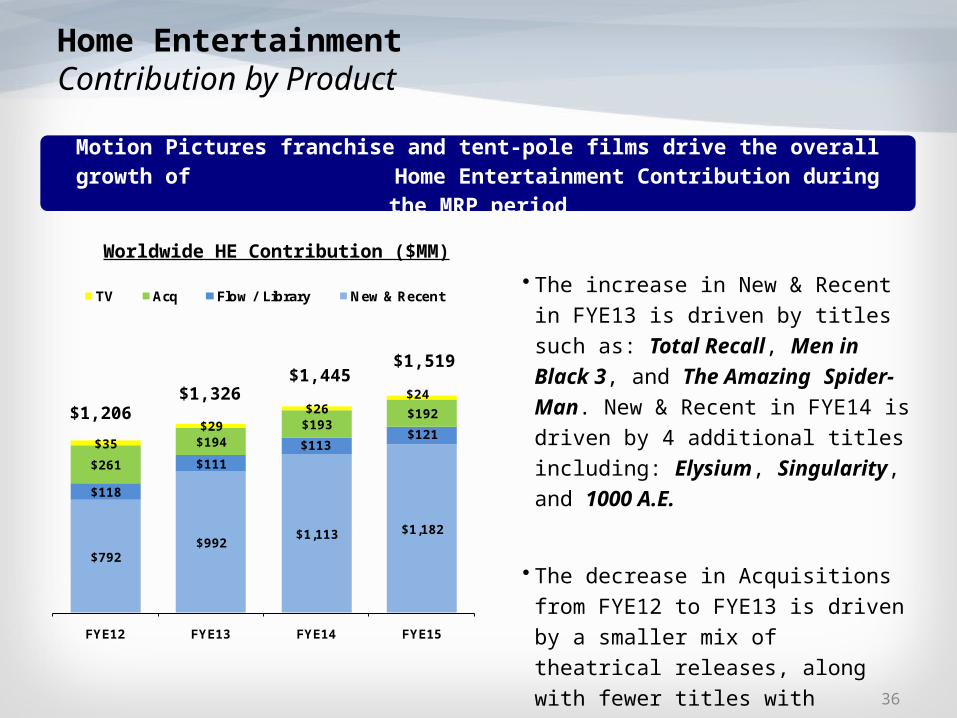
$792$992
$1,113 $1,182
$118
$111
$113$121
$261
$194 $193
$192
$35 $29
$26 $24
FYE12 FYE13 FYE14 FYE15
TV Acq Flow / Library New & Recent
$1,519$1,445
Worldwide HE Contribution ($MM)
$1,326$1,206
• The increase in New & Recent in FYE13 is driven by titles such as: Total Recall, Men in Black 3, and The Amazing Spider-Man. New & Recent in FYE14 is driven by 4 additional titles including: Elysium, Singularity, and 1000 A.E.
• The decrease in Acquisitions from FYE12 to FYE13 is driven by a smaller mix of theatrical releases, along with fewer titles with International rights 36
Home EntertainmentContribution by Product
Motion Pictures franchise and tent-pole films drive the overall growth of Home Entertainment Contribution during the MRP period

DIVISIONAL DETAILS
Television
38
• Strengthening economics of existing businesses Keeping SPT’s slate of original TV series on the air and generating substantial syndication profits Continuing to invest in ad and affiliate sales infrastructure within the channel business Exploring ways to leverage studio relationship with GSN
• Pursuing growth opportunities Building on syndication success (The Dr. Oz Show, The Nate Berkus Show) to expand into the
daytime market with A-list talent Capitalizing on opportunities with emerging SVOD players (e.g., Netflix, Amazon) to drive incremental
value for new/library film and television product Expanding in key markets with our branded networks, local and international TV series development
and production ventures, and distribution sales operations Resolving issues with partners and pursuing regional opportunities in India
• Pursuing Sony United collaboration Working to become the primary ad sales organization across Sony brand and platforms Utilizing development, production and programming expertise to create content for Sony’s Networked
devices Building the Sony entertainment brand through Sony-branded international networks
TelevisionExecutive Summary
SPE’s investments in television production and networks leave it well positioned to benefit from the global growth in those
businesses
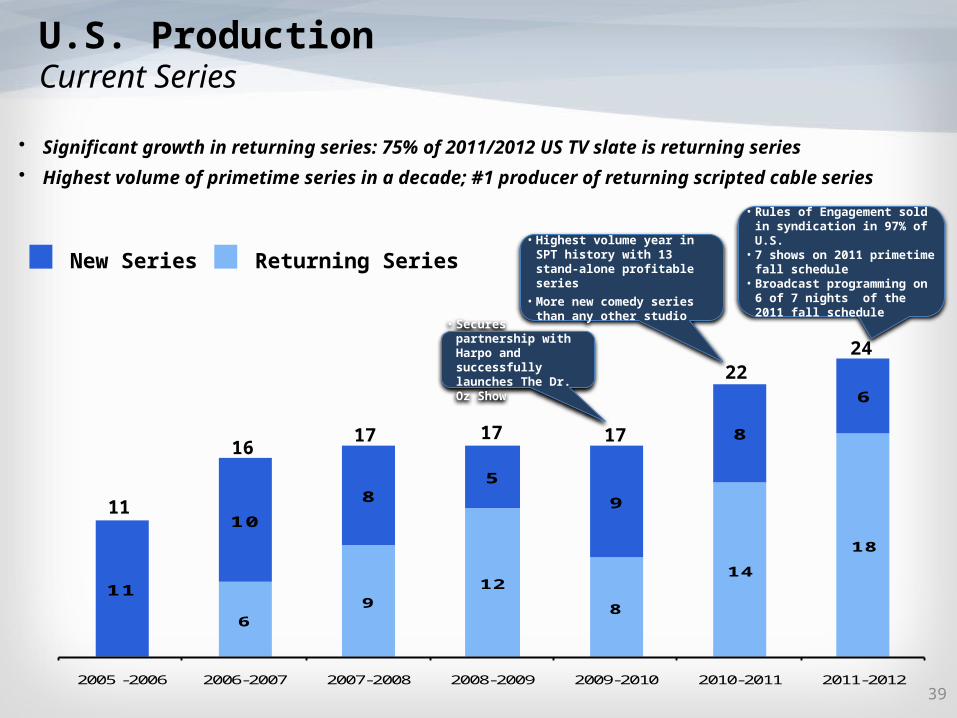
• Significant growth in returning series: 75% of 2011/2012 US TV slate is returning series
• Highest volume of primetime series in a decade; #1 producer of returning scripted cable series
39
U.S. ProductionCurrent Series
69
12
8
14
18
11
10
8 5
9
8
6
2005 -2006 2006-2007 2007-2008 2008-2009 2009-2010 2010-2011 2011-2012
New Series Returning Series
11
17171716
2224
• Highest volume year in SPT history with 13 stand-alone profitable series
• More new comedy series than any other studio
• Secures partnership with Harpo and successfully launches The Dr. Oz Show
• Rules of Engagement sold in syndication in 97% of U.S.
• 7 shows on 2011 primetime fall schedule
• Broadcast programming on 6 of 7 nights of the 2011 fall schedule

($86) ($76) ($74) ($74)
$64
$102
$134 $139
FYE12 FYE13 FYE14 FYE15
New Series Investment and Development All Other Current Series
($22)
$65$60
$26
($MMs)
• Increased broadcast network
production volume to match FYE12
and build on success
• Rules of Engagement is sold in
97% of the US for off-network
syndication and will premiere in
fall of ’12. Community soon to be
sold
• Continuing success in syndication
with The Dr. Oz Show plus 2 new
series
• New Series Investment &
Development decreases by 14%
over the MRP period
40
EBIT from Current Series, Pilots & Development:
U.S. ProductionCurrent Series, Pilots & Development
MRP Assumptions
Significant Contribution from current series as series enter off-network
syndication

$93 $92 $87 $86
$101 $106 $109 $121
$34 $31 $29 $28
FYE12 FYE13 FYE14 FYE15
Library Wheel of Fortune and Jeopardy! Daytime Serials
$228 $235$225$229
• Wheel of Fortune and Jeopardy! are renewed through 13/14 season
• Days of Our Lives and The Young and the Restless renewed through 12/13 season
• Production cost control and reduction efforts continue on all programs
• Library decline primarily due to ratings decline for aging product and shift in HE physical sell-through market away from library titles
41
U.S. ProductionLibrary, Game Shows and Daytime Series
MRP Assumptions
Maximizing the contribution to EBIT from our Core Programs
($MMs)

EBITRevenues
FYE13 FYE14 FYE15FYE12
• Strong projected organic growth driven by strong light entertainment and scripted remakes pipeline- Includes assumption of a
“hit” light entertainment format assumed to gain traction beginning FYE13
• Strengthen production presence in major European markets and expand to emerging territories (UK top priority)
6.3% 6.9% 9.9% 11.9%EBIT Margin
42
International ProductionFinancial Summary
$658$587
$493
$313
$20 $34$58 $78
MRP Assumptions
EBIT grows at 57% CAGR over the MRP period
($MMs)

$641 $700$802 $800
$216 $227
$202 $205
$1,279$1,366
$1,350 $1,414
FYE12 FYE13 FYE14 FYE15
TV Acquisitions MPG
$2,354 $2,419
$2,136$2,293
Distribution Gross Revenue
• Securing long-term deals in key markets over the plan
• Capitalize on opportunities with emerging SVOD players
• Does not assume incremental payments from Starz raising Netflix cap; Starz currently weighing options
43
TV DistributionContinue to Grow Distribution Sales
MRP Assumptions
Generate approximately $2.4B in gross revenue by FYE15 of which 58% is from Motion Picture product
($MMs)
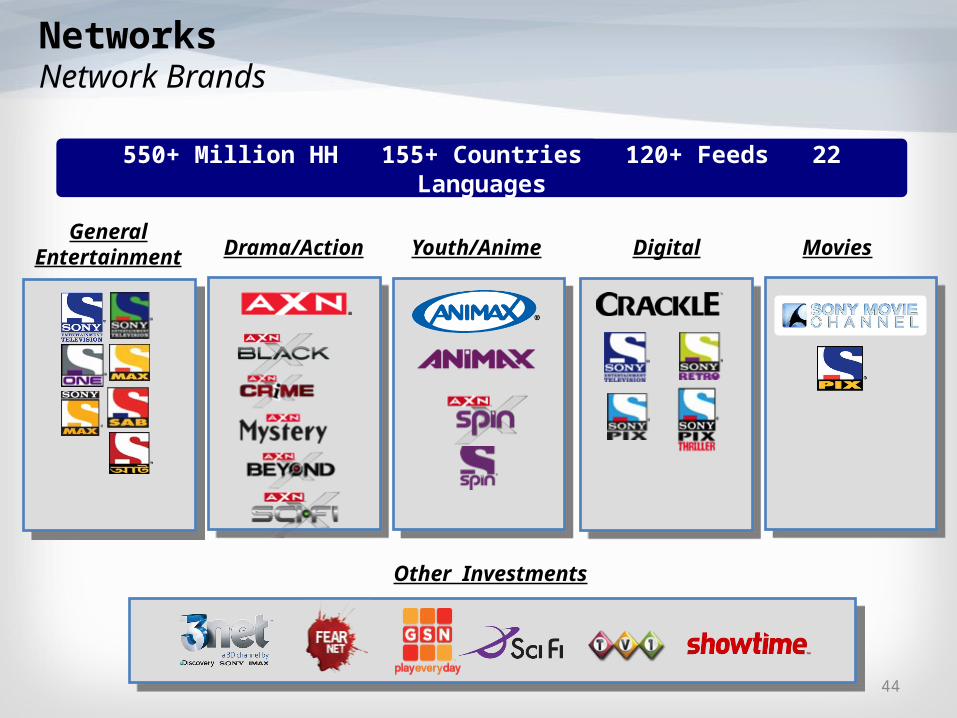
DigitalDrama/ActionGeneral
Entertainment
Other Investments
Youth/Anime
Movies
44
NetworksNetwork Brands
550+ Million HH 155+ Countries 120+ Feeds 22 Languages

$215
$297
$382
$472
0
100
200
300
400
500
FYE12 FYE13 FYE14 FYE15
• Networks EBIT grows by approximately $250MM over the MRP period
• Based on market multiples, networks could contribute approximately $3B of value to Sony Corp. today and grow to over $5B by FYE15
Networks EBIT
45
Networks Revenue Networks EBIT
30% CAGR
$1,536$1,762
$2,007$2,244
0
500
1,000
1,500
2,000
2,500
FYE12 FYE13 FYE14 FYE15
14.0% 16.9% 19.0% 21.0%EBIT Margin*
NetworksContinued Earnings Growth
*Margin excludes GSN PPA to normalize year-on-year progression
14% CAGR
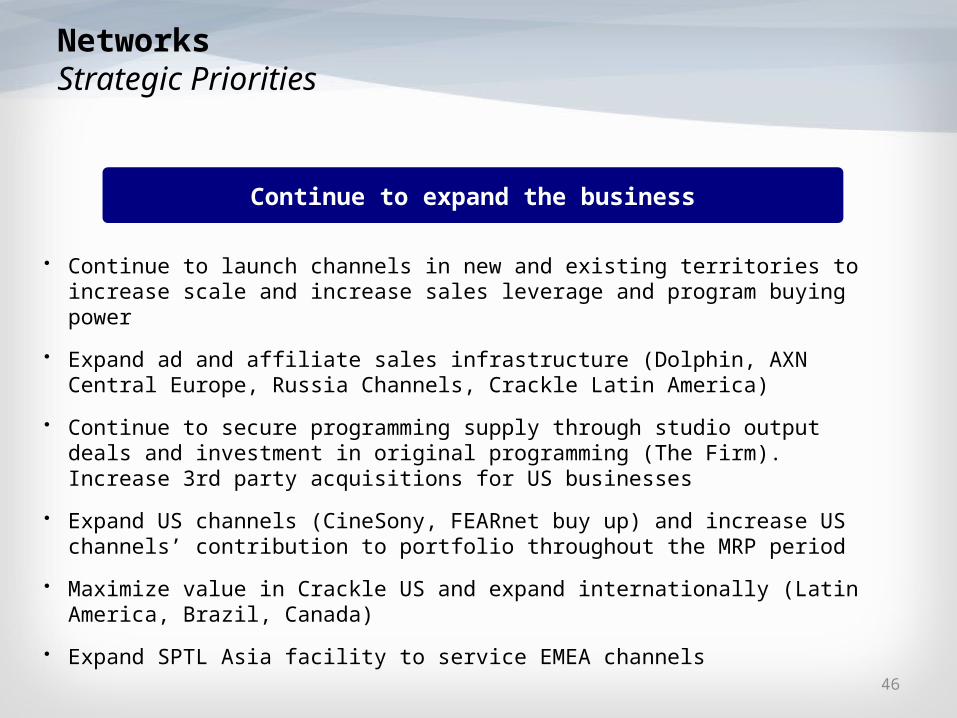
• Continue to launch channels in new and existing territories to increase scale and increase sales leverage and program buying power
• Expand ad and affiliate sales infrastructure (Dolphin, AXN Central Europe, Russia Channels, Crackle Latin America)
• Continue to secure programming supply through studio output deals and investment in original programming (The Firm). Increase 3rd party acquisitions for US businesses
• Expand US channels (CineSony, FEARnet buy up) and increase US channels’ contribution to portfolio throughout the MRP period
• Maximize value in Crackle US and expand internationally (Latin America, Brazil, Canada)
• Expand SPTL Asia facility to service EMEA channels
46
NetworksStrategic Priorities
Continue to expand the business

• Opportunities to Strengthen Existing Assets− Resolve partnership issue with MSM to drive growth and allow efficient participation
in Sony United initiatives
• Opportunities to Expand in Key Strategic Markets− Establish a local production presence in the UK through acquisition
− Acquisition of an Indian Regional broadcaster to complement the Hindi language MSM suite of channels
• Drive Growth in Emerging Markets Through Acquisition or Start Up− Further expand in emerging and growth markets in both the networks and production
businesses
− Increase the scale of existing operations in emerging markets (e.g., India, Korea, Russia)
− Acquire or start up operations in new markets (e.g., Turkey, Greece, Adria)
47
TelevisionGrowth through Additional Investment
SPT is exploring investments beyond those included in the MRP and will seek continued support to pursue these
growth initiatives

FINANCIAL SUMMARY

49
$8,515
$9,487 $9,980
$10,943
0
1,000
2,000
3,000
4,000
5,000
6,000
7,000
8,000
9,000
10,000
11,000
FYE12 FYE13 FYE14 FYE15
$365
$500
$600
$700
0
100
200
300
400
500
600
700
800
FYE12 FYE13 FYE14 FYE15
SPE Revenues ($MMs) SPE EBIT ($MMs)
9% CAGR
Financial SummaryConsolidated Revenues & EBIT
EBIT Margin: 4.3% 5.3% 6.0% 6.4%
24% CAGR

• Revenues increase from $8.5B in FYE12 to $10.9B in FYE15− Growth is a 9% CAGR over the MRP period
• EBIT increases from $365MM in FYE12 to $700MM in FYE15− Growth is a 24% CAGR over the MRP period− No monetizations or overall SPE EBIT challenges assumed in
FYE13 - FYE15− However, no film reserve in any year of the MRP
• EBIT margin improves to 6.4% by FYE15• Positive Net Cash Flow in all years of the MRP reaching $400MM in
FYE15• Excluding two areas of strategic growth, TV Networks and Int’l TV
Production, total G&A expenses grow by only 2.6% from FYE12 to FYE15 as a result of the Cost Reduction efforts undertaken over the last two years
50
Financial SummaryOverview

• Overhead cost savings continue to be a major focus of SPE with ongoing initiatives throughout the Company:
− Established the European shared service center in Poland and in the process of establishing the Asia Pacific shared service center
▪ In discussion with other Sony companies to participate in our shared service centers
− Expanding the use of joint ventures for home entertainment and theatrical distribution
− “Right-sized” US sales team in Home Entertainment− Reorganized Information Technology which included a significant
outsourcing of resources to India− Imageworks expanded its Vancouver facility to fully leverage the
58% tax rebate on labor− Reduced the overall Culver City real estate office space by
increasing the density of SPE owned facilities and eliminating leased facilities 51
Financial SummaryOverview
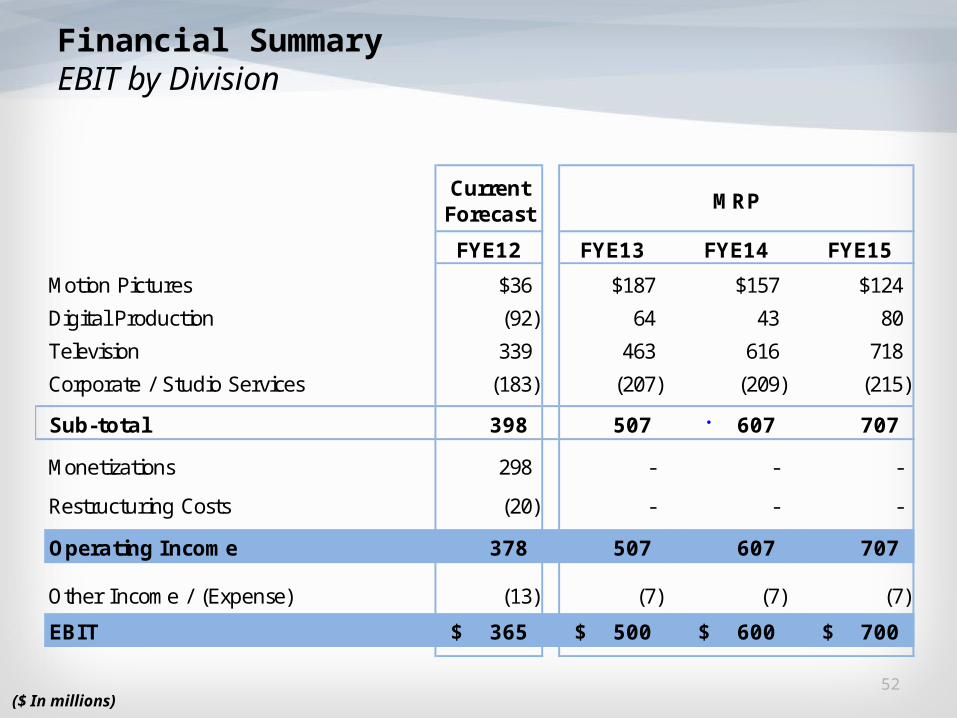
Current Forecast
MRP
FYE12 FYE13 FYE14 FYE15
Motion Pictures $36 $187 $157 $124
Digital Production (92) 64 43 80
Television 339 463 616 718
Corporate / Studio Services (183) (207) (209) (215)
Sub-total 398 507 607 707
Monetizations 298 - - -
Restructuring Costs (20) - - -
Operating Income 378 507 607 707
Other Income / (Expense) (13) (7) (7) (7)
EBIT 365$ 500$ 600$ 700$
52
Financial SummaryEBIT by Division
($ In millions)

EBIT - FYE12 $365
Current Year Titles - Stronger film slate in FYE13 including Spider-Man and Bond 23 53
Prior Year Releases - FYE13 benefits from 2 additional Columbia titles in FYE12 32
2nd Prior Year, Flow & Catalog - Higher TV sales of the strong FYE11 summer slate 74
Digital Production - Three SPA theatrical releases in FYE12; only one release in FYE13 156
U.S. TV Production & Ad Sales - Primarily higher off-net availabilities for Network series 33
Int'l TV Production - Growth in European and Latin America operations 14
Networks - Higher profits from various channels - particularly MSM India and GSN 82
Monetizations - FYE12 monetizations do not recur in FYE13 (298)
All other, net (11)
EBIT - FYE13 $500
53
Financial SummaryMajor Changes to EBIT from FYE12 to FYE13
($ In millions)

($ In millions)
Current Forecast
MRP
FYE12 FYE13 FYE14 FYE15
Current Year Releases ($355) ($302) ($298) ($280)
Prior Year Releases 340 372 387 337
2nd Prior Year / Flow / Catalog Releases 399 473 436 461
Acquisitions 91 94 94 84
HE Manufacturing Rebates 60 60 60 60
Development Expense (72) (70) (70) (70)
Overhead / Other (293) (306) (318) (330)
Sub-Total Before Corporate Allocations 170 321 291 262
Corporate Allocations (134) (134) (134) (138)
EBIT $36 $187 $157 $124
54
Financial SummaryMotion Pictures – EBIT Summary
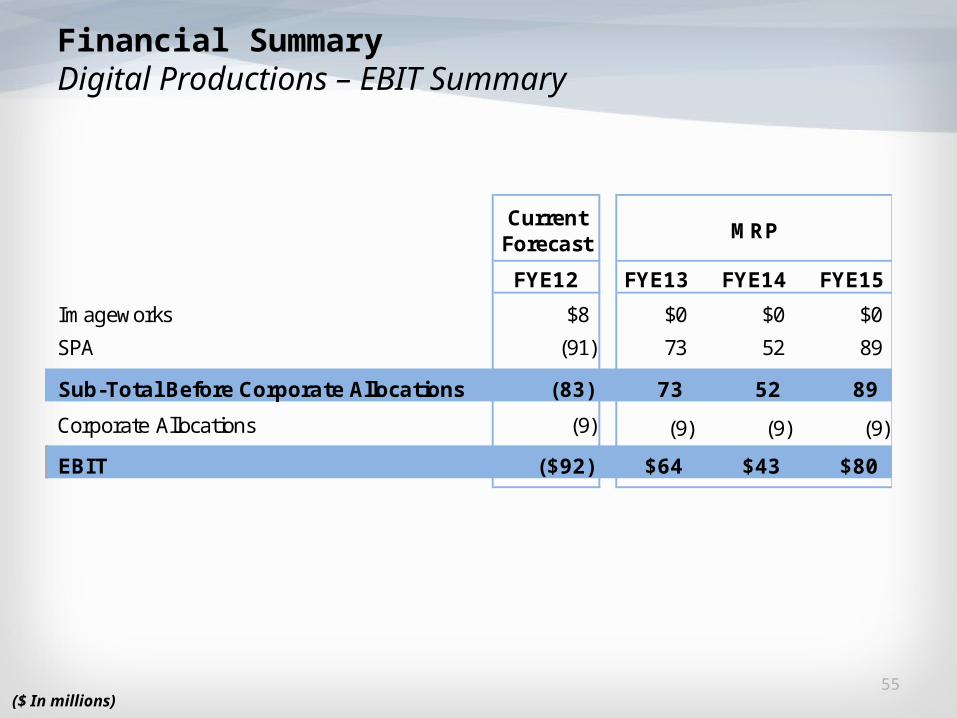
Current Forecast
MRP
FYE12 FYE13 FYE14 FYE15
Imageworks $8 $0 $0 $0
SPA (91) 73 52 89
Sub-Total Before Corporate Allocations (83) 73 52 89
Corporate Allocations (9) (9) (9) (9)
EBIT ($92) $64 $43 $80
55
Financial SummaryDigital Productions – EBIT Summary
($ In millions)
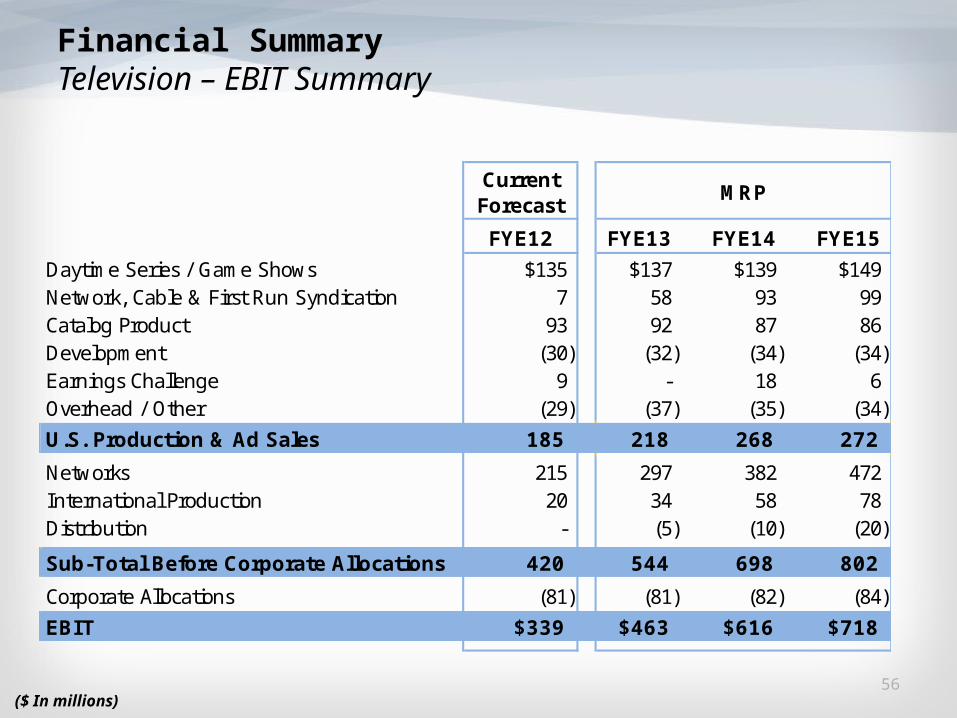
Current Forecast
MRP
FYE12 FYE13 FYE14 FYE15
Daytime Series / Game Shows $135 $137 $139 $149Network, Cable & First Run Syndication 7 58 93 99 Catalog Product 93 92 87 86Development (30) (32) (34) (34) Earnings Challenge 9 - 18 6 Overhead / Other (29) (37) (35) (34)
U.S. Production & Ad Sales 185 218 268 272
Networks 215 297 382 472 International Production 20 34 58 78 Distribution - (5) (10) (20)
Sub-Total Before Corporate Allocations 420 544 698 802
Corporate Allocations (81) (81) (82) (84)
EBIT $339 $463 $616 $718
56($ In millions)
Financial SummaryTelevision – EBIT Summary

Current Forecast
FYE12 FYE13 FYE14 FYE15
Operating Cash Flow $423 $620 $760 $873
Capital Expenditures (119) (139) (134) (133)
Strategic Investments / Dividends
Networks (28) (46) (45) (47)
Int'l TV Production (15) (40) (30) (30)
Imageworks (6) - - -
Proceeds from Asset Sales 83 1 1 1
Payments to Minority Shareholders (33) (35) (41) (44)
Interest and Taxes (280) (211) (211) (220)
Net Cash Flow $25 $150 $300 $400
MRP
57
Financial SummaryConsolidated Net Cash Flow
($ In millions)
Note – Net Cash Flow for the MRP does not include any amounts for (1) the potential exercise of the GSN put option, (2) the buyout of the India partners, or (3) the ETV transaction
58
Financial SummaryConsolidated Net Cash Flow
• Pursue film slate financing opportunities and tax credits
• Continue to reduce production and marketing costs
• Aggressive collection of receivables
• Employ strong cash management efforts
• Factor receivables as necessary
SPE continues to aggressively pursue all opportunities to improve cash flow

CLOSING
60
ClosingSummary
• The market trends SPE identified in prior MRPs will continue to unfold over the course of the next 3 years
• SPE is poised to succeed in this market, and is uniquely positioned among its peers with a balanced portfolio and relationship to entertainment hardware
• The result of SPE’s strategy and investments is very strong profit and cash flow growth over the MRP period

Q&A