Mid-Con Energy Partners, LP - EnerCom Dallas · Mid-Con Energy Partners, LP EnerCom Dallas March 2,...
24
Mid-Con Energy Partners, LP EnerCom Dallas March 2, 2017 Financial information as of February 28, 2017
Transcript of Mid-Con Energy Partners, LP - EnerCom Dallas · Mid-Con Energy Partners, LP EnerCom Dallas March 2,...

Mid-Con Energy Partners, LP
EnerCom Dallas
March 2, 2017
Financial information as of February 28, 2017

NASDAQ: MCEP ● www.midconenergypartners.com 2
Forward-Looking Statements
This presentation includes "forward-looking statements" — that is, statements related to future, not past, events within the
meaning of the federal securities laws. Forward-looking statements are based on current expectations and include any statement
that does not directly relate to a current or historical fact. In this context, forward-looking statements often address expected future
business and financial performance, and often contain words such as "anticipate," "believe," "estimate," "intend," "expect," "plan,"
"project," "should," "goal," "forecast," "guidance," “could," “may," "continue," "might," "potential," "scheduled," or "will" or other
similar words. These forward-looking statements involve certain risks and uncertainties and ultimately may not prove to be
accurate. Actual results and future events could differ materially from those anticipated in such statements. For further discussion
of risks and uncertainties, you should refer to Mid-Con Energy's filings with the Securities and Exchange Commission (“SEC”)
available at www.midconenergypartners.com or www.sec.gov. Mid-Con Energy undertakes no obligation and does not intend to
update these forward-looking statements to reflect events or circumstances occurring after this presentation. You are cautioned
not to place undue reliance on these forward-looking statements, which speak only as of the date of this presentation. All forward-
looking statements are qualified in their entirety by this cautionary statement and other SEC filings.
These forward–looking statements are subject to a number of risks and uncertainties, many of which are beyond our control,
which may include statements about our:
• business strategies;
• volatility or continued low or further declining commodity
prices;
• future financial and operating results, and our ability to
pay distributions;
• ability to replace the reserves we produce through
acquisitions and the development of our properties;
• revisions to oil and natural gas reserves estimates as a
result of changes in commodity prices;
• future capital requirements and availability of financing;
• technology;
• realized oil and natural gas prices;
• production volumes;
• lease operating expenses;
• general and administrative expenses;
• cash flow and liquidity;
• availability of production equipment;
• availability of oil field labor;
• capital expenditures;
• availability and terms of capital;
• marketing of oil and natural gas;
• general economic conditions;
• competition in the oil and natural gas industry;
• effectiveness of risk management activities;
• environmental liabilities;
• counterparty credit risk;
• governmental regulation and taxation;
• developments in oil producing and natural gas producing
countries; and
• plans, objectives, expectations and intentions.

NASDAQ: MCEP ● www.midconenergypartners.com 3
Mid-Con Energy Partners, LP
Investment Highlights
The
Right
Assets
The
Right
Team
The
Right
Strategy
The
Right
Structure

NASDAQ: MCEP ● www.midconenergypartners.com 4
Mid-Con Energy Partners, LP
Partnership Profile
"The Waterflood Guys"
• Core strength in enhanced oil recovery, focusing on
waterflooding
• Employees have prior experience in over 200
waterflood projects in 12 states
• Expertise focused on maximizing economically
recoverable oil
Straightforward Strategy & Structure
• Waterflood strategy is oil focused and includes both
organic development and acquisitions
• Private equity sponsor, Yorktown Energy Partners
(“Yorktown”), funded new private affiliates as
project incubators and drop-down vehicles
Organic / Acquisition Growth Potential
• Existing properties contain upside potential with
below average capital investment
• Since December 2011, Mid-Con Energy has closed
eleven acquisitions totaling approximately 16.0
MMBoe of estimated total proved reserves
• 19% CAGR in production since IPO
Market Highlights
Symbol / Exchange:
GP / LP Units Outstanding:
Preferred Units Outstanding:
Equity Value:
Debt Outstanding:
Enterprise Value:
MCEP / NASDAQ
30.3MM
11.6MM
$108.1MM
$121.5MM
$229.6MM
1) Based on 30,000,127 limited partner units and 360,000 general
partner units outstanding as of February 28, 2017.
2) Based on 11,627,906 Class A Convertible Preferred Units (“Preferred
Units”) as of February 28, 2017.
3) Based on February 28, 2017 market close price of $2.77 per common
unit and previously announced Unit Purchase Price of $2.15 per
Preferred Unit.
4) $121.5 million debt outstanding as of February 28, 2017.
(1)
(2)
(3)
(4)

NASDAQ: MCEP ● www.midconenergypartners.com 5
Primary Production – 10 to 25%
• Initial production from the reservoir typically recovered as a
result of expansion of reservoir fluids which are naturally
pressured within the producing formation
Secondary Production – 10 to 20%
• Waterflooding is the most commonly used method
• Additional oil is recovered by injecting water into the
reservoir, which displaces oil to producing wellbores
Tertiary Potential
• This type of recovery seeks to alter the properties of oil in
ways that facilitate additional production
• Examples include chemical flooding, thermal recovery
(steamfloods) and CO2 injection
• At this time, no estimated reserves or production associated
with potential tertiary recovery projects are assigned to Mid-
Con Energy’s properties
Original Oil In Place "OOIP"
The Right Strategy
Oil Recovery Overview

NASDAQ: MCEP ● www.midconenergypartners.com 6
The Right Strategy
Waterflooding Overview
• Waterflooding increases production and recovery of oil in place by displacing oil
from injection wells to producing wells
• Historically, the success of waterfloods has been attributable to the quality of the
reservoir rock, favorable reservoir fluid characteristics, availability of water for
injection and ease with which it can be injected
Surface
Waterflood
Target
Water Injected To Displace OilTypical Waterflood "5-Spot" Pattern
Injector
Producer

NASDAQ: MCEP ● www.midconenergypartners.com 7
The Right Assets
Core Area Summary
(1) Production volumes in Boe equivalents calculated at a rate of six Mcf per Bbl.
(2) Proved reserves based on SEC pricing for the twelve months ended December 31, 2016 of $42.75 per Bbl for oil and $2.49 per MMBtu for natural gas.
12/31/16 Proved Reserves (MBoe) 19,231
% Proved Developed 65%
December 2016 Net Production Boe/d 3,760
12/31/16 Proved Reserves (MBoe) 8,366
% Proved Developed 66%
December 2016 Net Production Boe/d 1,274
12/31/16 Proved Reserves (MBoe) 7,766
% Proved Developed 59%
December 2016 Net Production Boe/d 1,789
12/31/16 Proved Reserves (MBoe) 2,720
% Proved Developed 74%
December 2016 Net Production Boe/d 652
12/31/16 Proved Reserves (MBoe) 379
% Proved Developed 76%
December 2016 Net Production Boe/d 45
Total Mid-Con Energy Partners, LP(1)(2)
Northeastern Oklahoma
Permian
Southern Oklahoma
Other

NASDAQ: MCEP ● www.midconenergypartners.com 8
• Seek to acquire properties with low decline rates and upside potential
• Seek to acquire mature "drop-down" properties from Mid-Con Energy’s private
affiliates
• Capitalize on relationship with Yorktown
Exploit Potential
Of Existing
Property Base
Maintain Operational
Control and Cost
Effectiveness
Acquire High Quality
Properties For
EOR Development
Improve Liquidity
and Financial Flexibility
• Targeting a low Debt to EBITDA ratio
• Live within operating cash flow and focus on enhancing liquidity under revolver
• Hedged to help stabilize revenues against fluctuations in commodity prices
while maintaining some ability to participate in upside to current strip pricing
• Increase production and recovery from existing reserve portfolio (~95% Oil)
• Properties consist of interests in mature fields in Oklahoma and Texas with
well-understood geologic features, relatively predictable production profiles
and modest capital requirements
• Our affiliate, Mid-Con Energy Operating, operates ~100% of our properties
• Continue to maintain this level of control and favor acquisitions of operated
properties
• Realize certain service operating efficiencies from our third-party affiliate
The Right Strategy
Operating Strategy

NASDAQ: MCEP ● www.midconenergypartners.com 9
2016 Strategic Objectives
Transformational Year In Review
• Reduced 2016 total cash expenses of $25.36 per Boe (LOE, production
taxes, cash G&A, cash interest expense) 11.7% YoY
• 2016 LOE of $15.35 per Boe declined 21.5% YoY due to field-level cost
savings initiatives, Hugoton divestiture, and Permian Bolt-On acquisition
• 2016 total cash G&A of $5.7 million declined 8.1% YoY due to lower payroll
expense, professional fees, and discretionary G&A categories
• Reduced debt by $58.0 million, or 32.2%, during 2016 after investing over
$7.0 million in capital expenditures
• Debt outstanding of $122.0 million and Compliance Total Leverage of
2.59x, as calculated by our credit agreement, as of December 31, 2016
• Completed $25.0 million private offering of Class A Convertible Preferred
Units (“Preferred Units”) in August 2016 to fund Permian Bolt-On acquisition
Improve Efficiencies
& Cut Costs
Lower cash break-even levels, widen
margins
Live Within Cash Flow
Cash from operations to fund CAPEX
and debt reduction in 2016, fund
acquisitions with incremental equity-
weighted capital
Maintain Flexibility
In Uncertain TimesBalance short-term needs with long-term
objectives, protect balance sheet
• Increased conforming borrowing base to $140.0 million from $105.0 million
per August 2016 non-scheduled redetermination
• Subsequently reaffirmed conforming borrowing base of $140.0 million by
lender group in October 2016 during the fall redetermination
• Total liquidity of $20.4 million as of December 31, 2016, included $2.4 million
in cash and $18.0 million in accessible revolver borrowings

NASDAQ: MCEP ● www.midconenergypartners.com 10
Annual Cash Expenses Per Boe(1)
Reducing Costs In Response To Lower Prices
2014 2015 2016
LOE $22.93 $19.55 $15.35
Production taxes $5.56 $2.03 $1.96
Cash G&A $6.08 $3.61 $3.86
Cash interest expense $4.04 $3.53 $4.19
Total cash expenses $38.61 $28.72 $25.36
$22.93 $19.55
$15.35
$5.56
$2.03
$1.96
$6.08
$3.61
$3.86
$4.04
$3.53
$4.19
$38.61
$28.72
$25.36
$0
$5
$10
$15
$20
$25
$30
$35
$40
$45
2014 2015 2016
$/B
oe
LOE
Production taxes
Cash G&A
Cash interest expense
Total cash expenses
Total Cash Expense per Boe decreased 34.3% since 2014
Total LOE per Boe decreased 33.1% since 2014
Total Cash Expense per Boe decreased 11.7% since 2015
Total LOE per Boe decreased 21.5% since 2015
(1) Production volumes in Boe equivalents calculated at a rate of six Mcf per Bbl.
NASDAQ: MCEP ● www.midconenergypartners.com 11
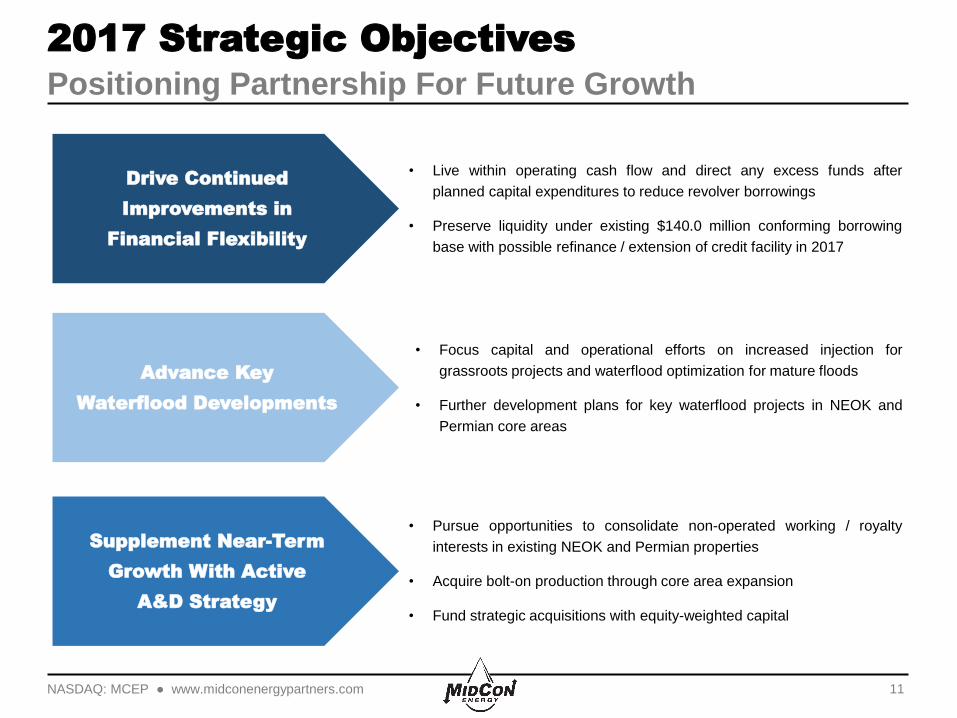
2017 Strategic Objectives
Positioning Partnership For Future Growth
• Live within operating cash flow and direct any excess funds after
planned capital expenditures to reduce revolver borrowings
• Preserve liquidity under existing $140.0 million conforming borrowing
base with possible refinance / extension of credit facility in 2017
• Focus capital and operational efforts on increased injection for
grassroots projects and waterflood optimization for mature floods
• Further development plans for key waterflood projects in NEOK and
Permian core areas
Drive Continued
Improvements in
Financial Flexibility
Advance Key
Waterflood Developments
Supplement Near-Term
Growth With Active
A&D Strategy
• Pursue opportunities to consolidate non-operated working / royalty
interests in existing NEOK and Permian properties
• Acquire bolt-on production through core area expansion
• Fund strategic acquisitions with equity-weighted capital

NASDAQ: MCEP ● www.midconenergypartners.com 12
Cash Margins Before Hedges
Cash Surplus, Inclusive of Total CAPEX, Above ~$34/Boe
$44.31 $30.00 $40.00 $50.00 $60.00 $70.00 $80.00
($/Boe) 4Q16
Oil & natural gas sales revenues $44.31 $30.00 $40.00 $50.00 $60.00 $70.00 $80.00
LOE(1)$14.56 $15.50 $15.50 $15.50 $15.50 $15.50 $15.50
Production taxes(2)$2.31 $1.59 $2.12 $2.65 $3.18 $3.71 $4.24
Cash G&A(3)$3.93 $4.23 $4.23 $4.23 $4.23 $4.23 $4.23
Cash interest expense(4)$3.21 $3.16 $3.16 $3.16 $3.16 $3.16 $3.16
Cash expenses $24.01 $24.48 $25.01 $25.54 $26.07 $26.60 $27.13
Cash margin excluding hedges $20.30 $5.52 $14.99 $24.46 $33.93 $43.40 $52.87
Less Total CAPEX(5)$6.70 $9.63 $9.63 $9.63 $9.63 $9.63 $9.63
Cash surplus/(shortfall) $13.60 ($4.11) $5.36 $14.83 $24.30 $33.77 $43.24
Oil price scenarios, realized $/Boe excluding hedges
$24.01 $24.48 $25.01 $25.54 $26.07 $26.60 $27.13
$6.70 $9.63 $9.63 $9.63 $9.63 $9.63 $9.63
$13.60
$(4.11)
$5.36 $14.83
$24.30
$33.77
$43.24
-$10
$0
$10
$20
$30
$40
$50
$60
$70
$80
$44.31 $30.00 $40.00 $50.00 $60.00 $70.00 $80.00
$/B
oe
Oil price scenarios, realized $/Boe
Cash surplus/(shortfall)
Total CAPEX
Cash expenses
Breakeven Operating
Cash Flows
4Q16Results
(1) Projections for LOE based on the mid-point of FY2017 guidance.
(2) Projections for production taxes calculated at 5.3% of total oil and gas revenues based on the mid-point of FY2017 guidance.
(3) Projections for G&A based on FY2016 cash G&A expenses divided by the mid-point of FY2017 Boe production guidance.
(4) Projections for cash interest based on $122MM in borrowings outstanding at December 31, 2016 at a rate of 3.5% divided by the mid-point of FY2017 Boe production guidance.
(5) Projections based on FY2017 capital budget of $13MM divided by the mid-point of FY2017 Boe production guidance.

NASDAQ: MCEP ● www.midconenergypartners.com 13
Debt & Liquidity Update
2.59x Total Leverage(1) and $140MM Borrowing Base
$203 $200 $194 $180 $169 $162 $128 $122
$37 $20$26
$8
$11
$12$18
$240
$220 $220
$188 $180
$163
$140 $140
2.77x
3.15x
3.47x3.27x
2.77x 2.71x
2.21x
2.59x
0.00x
1.00x
2.00x
3.00x
4.00x
5.00x
6.00x
$0
$40
$80
$120
$160
$200
$240
1Q15 2Q15 3Q15 4Q15 1Q16 2Q16 3Q16 4Q16
Debt
/ E
BIT
DA
$M
M
Borrowings Available Debt Outstanding Borrowing Base Debt / EBITDA (Compliance TTM PF)
$140 Borrowing Base
Reaffirmed During
Fall-16 Redetermination
(1) Debt to EBITDA calculated on a trailing twelve month basis, as defined per the credit agreement, and includes pro forma adjustments for acquisitions and divestitures.
NASDAQ: MCEP ● www.midconenergypartners.com 14
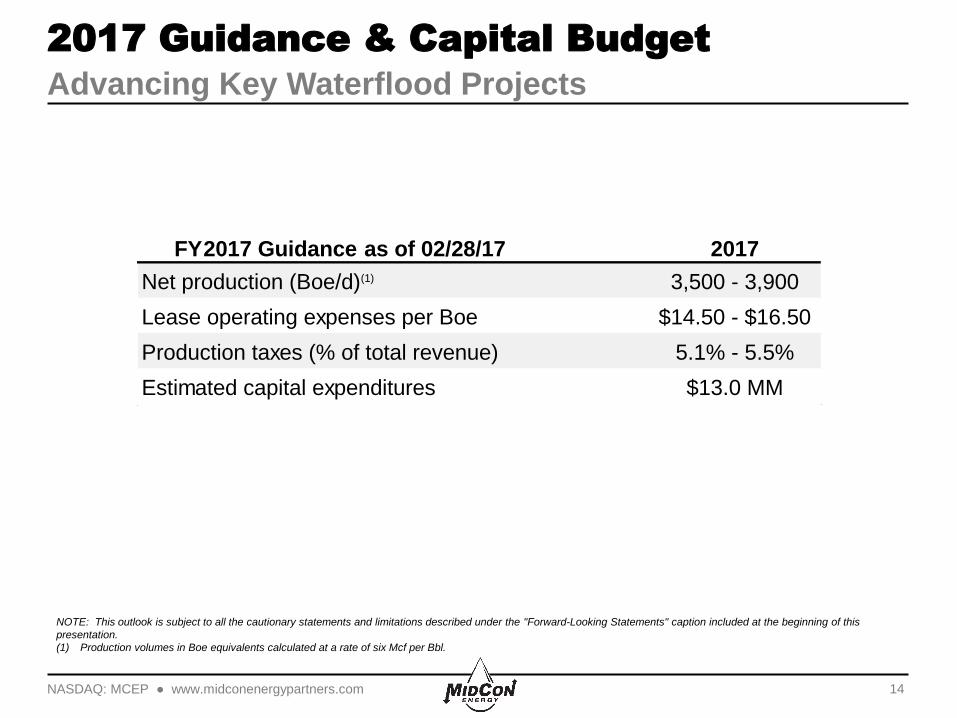
2017 Guidance & Capital Budget
Advancing Key Waterflood Projects
NOTE: This outlook is subject to all the cautionary statements and limitations described under the "Forward-Looking Statements" caption included at the beginning of this
presentation.
(1) Production volumes in Boe equivalents calculated at a rate of six Mcf per Bbl.
FY2017 Guidance as of 02/28/17 2017
Net production (Boe/d)(1) 3,500 - 3,900
Lease operating expenses per Boe $14.50 - $16.50
Production taxes (% of total revenue) 5.1% - 5.5%
Estimated capital expenditures $13.0 MM

NASDAQ: MCEP ● www.midconenergypartners.com 15
Mid-Con Energy Partners, LP
Investment Highlights
The
Right
Assets
The
Right
Team
The
Right
Strategy
The
Right
Structure
Appendix

NASDAQ: MCEP ● www.midconenergypartners.com 17
Commodity Derivatives
Summary Positions as of February 28, 2017
(1) Deferred premium puts include premiums that are to be paid monthly as the contracts settle (refer to our SEC filing for additional details). Total deferred put premiums by
calendar year: 2017 ($5.0MM) and 2018 ($0.4MM).
(2) Calculated estimated percent hedged based on the mid-point of FY2017 Boe production guidance multiplied by a 93% oil weighting based on fourth quarter 2016 reported
production volumes.
Oil Hedges 1Q17 2Q17 3Q17 4Q17 1Q18 2Q18 3Q18 4Q18 1Q19 2Q19 3Q19 4Q19
Collar Volume (Bbl/d) 667 659 652 652 1,500 1,484 1,141 1,141 433 429 424 424
Call Strike Price ($/Bbl) 49.00$ 50.15$ 51.22$ 52.35$ 57.39$ 57.91$ 52.42$ 53.13$ 60.52$ 60.52$ 60.52$ 60.52$
Put Strike Price ($/Bbl) 40.00$ 45.00$ 45.00$ 45.00$ 45.00$ 45.00$ 43.57$ 43.57$ 50.00$ 50.00$ 50.00$ 50.00$
Put Volume (Bbl/d)(1)
2,000 1,978 1,957 1,793 - - 326 326 - - - -
Put Strike Price ($/Bbl)(1)
50.00$ 50.00$ 50.00$ 50.00$ -$ -$ 45.00$ 45.00$ -$ -$ -$ -$
Total Hedged Volume (Bbl/d) 2,667 2,637 2,609 2,446 1,500 1,484 1,467 1,467 433 429 424 424
Floor Strike Price ($/Bbl) 47.50$ 48.75$ 48.75$ 48.67$ 45.00$ 45.00$ 43.89$ 43.89$ 50.00$ 50.00$ 50.00$ 50.00$
% Hedged(2) 77% 77% 76% 71% 44% 43% 43% 43% 13% 12% 12% 12%
2,667 2,637 2,609
2,446
1,500 1,484 1,467 1,467
433 429 424 424
$30
$40
$50
$60
$70
$80
$90
0
500
1,000
1,500
2,000
2,500
3,000
1Q17 2Q17 3Q17 4Q17 1Q18 2Q18 3Q18 4Q18 1Q19 2Q19 3Q19 4Q19
Avera
ge F
loo
r P
rice (
$/B
bl)
Bb
l/d
Hed
ged
Put Volume (Bbl/d)(1)
Collar (% Hedged, LHS)
Total Hedge Volume
Floor Price ($/Bbl, RHS)
WTI Futures ($/Bbl, RHS)

NASDAQ: MCEP ● www.midconenergypartners.com 18
Operating and Financial Results
Sequential and YoY Variance Analysis
(1) Production volumes in Boe equivalents calculated at a rate of six Mcf per Bbl.
(2) Three months ended September 30, 2016 cash settlements from matured derivatives exclude $5.8 million received and the $1.5 million of deferred premiums paid upon early termination of previous oil
derivative contracts in July 2016.
(3) General and administrative include non-cash equity-based compensation expense of approximately $0.2 million in 4Q16, $0.3 million in 3Q16, and $0.2 million in 4Q15.
(4) This presentation includes "EBITDA", "Adjusted EBITDA" , and "Distributable Cash Flow", each of which are non-generally accepted accounting principles ("Non-GAAP") measures, and should not be
considered an alternative to net income (loss), net cash provided by operating activities or any other measure of financial performance or liquidity presented in accordance with GAAP.
Three Months Ended Variance Analysis
December 31, September 30, December 31, Quarter-over-quarter Year-over-year
(unaudited, in thousands, except per Boe data) 2016 2016 2015 # % # %
Select Operating Results
Oil (MBbl) 329 339 413 (10) -2.8% (84) -20.2%
Natural gas (MMcf) 144 149 154 (5) -3.2% (10) -6.4%
Total production (MBoe) (1)
353 364 439 (11) -3.0% (86) -19.6%
Average daily production (Boe/d) 3,837 3,957 4,772 (120) -3.0% (935) -19.6%
Select Financial Results
Oil sales 15,208$ 14,012$ 15,845$ 1,196$ 8.5% (637)$ -4.0%
Natural gas sales 434$ 398$ 394$ 36$ 9.0% 40$ 10.2%
Cash settlements from matured derivatives, inclusive of net premiums (2)
770$ 1,182$ 5,834$ (412)$ -34.9% (5,064)$ -86.8%
Oil & natural gas sales plus cash settlements from matured derivatives,
inclusive of premiums, net 16,412$ 15,592$ 22,073$ 820$ 5.3% (5,661)$ -25.6%
Lease operating expenses 5,141$ 5,709$ 8,298$ (568)$ -9.9% (3,157)$ -38.0%
Oil and gas production taxes 816$ 753$ 853$ 63$ 8.4% (37)$ -4.3%
General and administrative (3)
1,609$ 1,715$ 1,880$ (106)$ -6.2% (271)$ -14.4%
Select Non-GAAP Measures (4)
0 0.0%
Adjusted EBITDA 9,002$ 11,873$ 18,993$ (2,871)$ -24.2% (9,991)$ -52.6%
Distributable Cash Flow 6,242$ 9,104$ 15,462$ (2,862)$ -31.4% (9,220)$ -59.6%
Select Financial Results per Boe
Oil sales 43.08$ 38.49$ 36.09$ 4.59$ 11.9% 6.99$ 19.4%
Natural gas sales price 1.23$ 1.09$ 0.90$ 0.14$ 12.4% 0.33$ 37.0%
Cash settlements from matured derivatives, inclusive of net premiums (2)
2.18$ 3.25$ 13.29$ (1.07)$ -32.8% (11.11)$ -83.6%
Oil & natural gas sales plus cash settlements from matured derivatives,
inclusive of premiums, net 46.49$ 42.84$ 50.28$ 3.66$ 8.5% (3.79)$ -7.5%
Lease operating expenses 14.56$ 15.68$ 18.90$ (1.12)$ -7.1% (4.34)$ -23.0%
Oil and gas production taxes 2.31$ 2.07$ 1.94$ 0.24$ 11.7% 0.37$ 19.0%
General and administrative (3)
4.56$ 4.71$ 4.28$ (0.15)$ -3.3% 0.28$ 6.4%
Select Non-GAAP Measures (4)
Adjusted EBITDA 25.50$ 32.62$ 43.26$ (7.12)$ -21.8% (18)$ -41.1%
Distributable Cash Flow 17.68$ 25.01$ 35.22$ (7.33)$ -29.3% (18)$ -49.8%

NASDAQ: MCEP ● www.midconenergypartners.com 19
Appendix
Non-GAAP Summary(1)
(1) This presentation includes "EBITDA", "Adjusted EBITDA" , and "Distributable Cash Flow", each of which are non-generally accepted accounting principles ("Non-GAAP")
measures, and should not be considered an alternative to net income (loss), net cash provided by operating activities or any other measure of financial performance or
liquidity presented in accordance with GAAP.
(2) Full year 2016 reflects cash distributions to holders of Preferred units payable on November 14, 2016 and February 14, 2017, according to terms of the Partnership
Agreement, and attributable to the periods from August 11, 2016 to September 30, 2016 and October 1, 2016 to December 31, 2016, respectively.
December 31, December 31, December 31, December 31,
($ in thousands) 2016 2015 2016 2015
Reconciliation of Net Loss to Adjusted EBITDA and Distributable Cash Flow
Net loss (3,311) (57,961) (24,814) (95,495)
Interest expense, net 1,502 1,895 7,475 7,248
Depreciation, depletion and amortization 5,524 8,482 23,074 34,174
Accretion of discount on asset retirement obligations 134 156 577 432
Loss (gain) on derivatives, net 4,238 (9,822) 12,202 (22,366)
Cash settlements received for matured derivatives, net 2,044 12,977 20,511 28,543
Cash settlements received for early termination and modifications of
derivatives, net - - 5,820 11,069
Cash premiums received (paid) upon settlement for derivatives, net (1,274) 1 (5,040) (1,701)
Cash premiums paid at inception of derivatives, net (121) - (121) (14,064)
Impairment of proved oil and natural gas properties - 63,018 895 103,938
Impairment of proved oil and natural gas properties sold - - 3,578 -
Non-cash equity-based compensation 223 247 1,184 3,204
Loss on sales of oil and natural gas properties, net 43 - 560 -
Adjusted EBITDA 9,002 18,993 45,901 54,982
Less:
Cash interest expense 1,135 1,464 6,198 6,070
Estimated maintenance capital expenditures 1,123 1,520 4,473 8,473
Other non-operating cash income - 547 34 547
Distributions to preferred unitholders (2)
502 - 779 -
Distributable Cash Flow 6,242 15,462 34,417 39,892
Three Months Ended Year Ended
NASDAQ: MCEP ● www.midconenergypartners.com 20
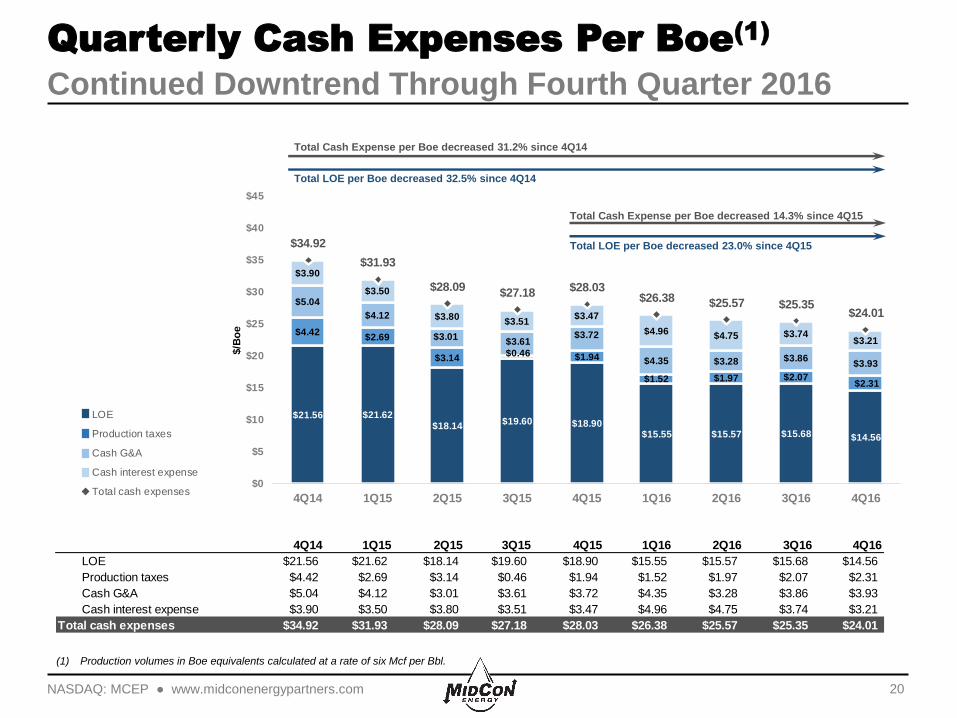
Quarterly Cash Expenses Per Boe(1)
Continued Downtrend Through Fourth Quarter 2016
4Q14 1Q15 2Q15 3Q15 4Q15 1Q16 2Q16 3Q16 4Q16
LOE $21.56 $21.62 $18.14 $19.60 $18.90 $15.55 $15.57 $15.68 $14.56
Production taxes $4.42 $2.69 $3.14 $0.46 $1.94 $1.52 $1.97 $2.07 $2.31
Cash G&A $5.04 $4.12 $3.01 $3.61 $3.72 $4.35 $3.28 $3.86 $3.93
Cash interest expense $3.90 $3.50 $3.80 $3.51 $3.47 $4.96 $4.75 $3.74 $3.21
Total cash expenses $34.92 $31.93 $28.09 $27.18 $28.03 $26.38 $25.57 $25.35 $24.01
$21.56 $21.62 $18.14
$19.60 $18.90 $15.55 $15.57 $15.68 $14.56
$4.42 $2.69
$3.14 $0.46 $1.94
$1.52 $1.97 $2.07 $2.31
$5.04
$4.12
$3.01 $3.61
$3.72
$4.35 $3.28 $3.86 $3.93
$3.90
$3.50
$3.80 $3.51
$3.47
$4.96 $4.75 $3.74 $3.21
$34.92
$31.93
$28.09 $27.18 $28.03
$26.38 $25.57 $25.35 $24.01
$0
$5
$10
$15
$20
$25
$30
$35
$40
$45
4Q14 1Q15 2Q15 3Q15 4Q15 1Q16 2Q16 3Q16 4Q16
$/B
oe
LOE
Production taxes
Cash G&A
Cash interest expense
Total cash expenses
Total Cash Expense per Boe decreased 31.2% since 4Q14
Total LOE per Boe decreased 32.5% since 4Q14
Total Cash Expense per Boe decreased 14.3% since 4Q15
Total LOE per Boe decreased 23.0% since 4Q15
(1) Production volumes in Boe equivalents calculated at a rate of six Mcf per Bbl.

NASDAQ: MCEP ● www.midconenergypartners.com 21
Capital Expenditures
Fourth Quarter 2016 Activity
53%
47%
Growth Maintenance
$2.4MM
4Q16 CAPEX
$2.4 Million in 4Q16 Total CAPEX
• Maintenance: $1.1 million
• Growth $1.3: million
Initiated 6 conversions to injection(1)
• Permian: 5 conversions
• SOK: 1 conversion
Spud 3 producing wells
• Permian: 1 producing wells
• NEOK: 2 producing wells
Initiated 15 recompletions
• Permian: 4 recompletions
• NEOK: 8 recompletions
• SOK: 3 recompletions
MCEP Comments on Maintenance CAPEX: Maintenance CAPEX reflects the total amount of spending required to
maintain proper injection pressure and flood fronts across each individual unit.
(1) Does not include modification of target injection formation of two wells during the quarter.

NASDAQ: MCEP ● www.midconenergypartners.com 22
44%
40%
14%
2%
Permian NEOK SOK Other
2016 Proved Reserves(1)
Year End 2016 Audited SEC(2) Reserves
19.2
MMBoe
65%
35%
Proved Developed Proved Undeveloped
(1) Production volumes in Boe equivalents calculated at a rate of six Mcf per Bbl.
(2) SEC pricing for the twelve months ended December 31, 2016 of $42.75 per Bbl for oil and $2.49 per MMBtu for natural gas.
(3) Reserve-to-production ratio calculated based on dividing estimated net proved reserves as of December 31, 2016 by average net production for the month ended December
31, 2016 of 3,760 Boe/d.
Core Area Summary Reserve Category Summary
~14 Year
R/P Ratio(3)

NASDAQ: MCEP ● www.midconenergypartners.com 23
2017 Capital Budget
Core Area Summary
55%
29%
15%
1%
Permian NEOK SOK Other
$13.0MM
2017 CAPEX

Mid-Con Energy Partners, LP Investor Relations
2431 E. 61st Street, Suite 850
Tulsa, Oklahoma 74136
918.743.7575