
MICROSTRUCTURAL EVOLUTION OF METAL MATRIX...
10
THE 19 TH INTERNATIONAL CONFERENCE ON COMPOSITE MATERIALS 1 Introduction Composite materials developed since 1970's [1] present interesting mechanical properties. Their development in the last decade is the results of the introduction of micro/nano particles in a metallic matrix. The metal provides the toughness and the particles are adding elastic stiffness, strength, hardness and wear resistance. High specific stiffness and high specific strength are interesting characteristics of Metal Matrix Composites (MMC). These features make it possible to substantially lower the weight and retain high properties. The particles must be carefully chosen for each kind of matrix and are conditioned by a thermodynamic equilibrium between the matrix and the reinforcement [2]. In order to optimize the properties of MMC by thermal treatments, it is necessary to analyze the interactions between the particles and the matrix and their role on the final microstructure [3]. The evolutions of the matrix and of the reinforcement were thus analyzed during thermal treatment using in situ high energy X-ray diffraction (HEXRD). In the present contribution, we analyze and compare the structural evolution of two metal matrix composites with two kinds of matrix: steel and titanium alloys both reinforced with TiC particles. 2 Experimental set-up 2.1 High energy X-ray diffraction The X-ray diffraction (XRD) experiments were performed at the European Synchrotron Radiation Facility (ESRF, Grenoble, France), on the ID15B beam line. The in situ measurements were conducted using high energy X-ray synchrotron radiation diffraction with a monochromatic beam of 87 keV. The high energy beam allowed to analyze a large volume of the sample, to be representative of the bulk behavior and to lessen the surface effect [4 , 5]. High energy X-ray diffraction is largely used to determine the mechanical behavior of heavy samples [6]. The combination between the high flux from synchrotron source, a large area detector and the high energy allows to make in situ analysis of phenomena with a time scale of one second or less. The large flux of the source permits to record in a small time a high-quality diffraction signal. The large area detector allows to record the whole Debye-Scherer diffraction rings. The use of the whole rings permits to lessen the effect of texture in the materials in the case of quantitative phase analysis [7, 5] or to analyze the texture effect [8] and extract the strain and stress evolutions in a single image [9, 10 , 11]. For our experiments, the samples had a thickness of 3 mm in the beam direction. The beam size was fixed to 0.4x0.4mm 2 . Each sample was heated using a radiant furnace allowing to heat up to 1000ºC. A thermocouple was spot-welded on the sample surface leading to the measurement of temperature and allowing the control of the heating conditions. XRD patterns were recorded by a flat CCD detector (pixium 4700), with one image every 3.5s (1s exposure + 2.5s readout time). Data have been corrected and reduced to (2q, intensity) patterns using fit2d software [12] suitable for Rietveld analysis [13, 14]. Using the phase selectivity of the X-ray diffraction we are able to extract parameters for each phase present in the composite and due to the beam quality of the synchrotron source, phase with low fraction can be detected. The fraction limit for this technique is around 0.5%. MICROSTRUCTURAL EVOLUTION OF METAL MATRIX COMPOSITES BY IN SITU HIGH ENERGY X-RAY DIFFRACTION G. Geandier 1,2 *, M. Salib 1,2 , M. Mourot 1 , L. Vautrot 1,2 , M. Dehmas 1,2 , B. Denand 1,2 , E. Aeby-Gautier 1,2 , S. Denis 1,2 1 Institut Jean Lamour - UMR CNRS 7198 – Université de Lorraine, Nancy, France 2 LabEx DAMAS – Université de Lorraine, Nancy, France Corresponding author (guillaume.geandier@ univ-lorraine .fr ) Keywords: metal matrix composite, X-ray diffraction, synchrotron, phase transformation
Transcript of MICROSTRUCTURAL EVOLUTION OF METAL MATRIX...
THE 19TH INTERNATIONAL CONFERENCE ON COMPOSITE MATERIALS
1 Introduction Composite materials developed since 1970's [1]present interesting mechanical properties. Theirdevelopment in the last decade is the results of theintroduction of micro/nano particles in a metallicmatrix. The metal provides the toughness and theparticles are adding elastic stiffness, strength,hardness and wear resistance. High specific stiffnessand high specific strength are interestingcharacteristics of Metal Matrix Composites (MMC).These features make it possible to substantiallylower the weight and retain high properties. Theparticles must be carefully chosen for each kind ofmatrix and are conditioned by a thermodynamicequilibrium between the matrix and thereinforcement [2]. In order to optimize the propertiesof MMC by thermal treatments, it is necessary toanalyze the interactions between the particles andthe matrix and their role on the final microstructure[3]. The evolutions of the matrix and of thereinforcement were thus analyzed during thermaltreatment using in situ high energy X-ray diffraction(HEXRD). In the present contribution, we analyze and comparethe structural evolution of two metal matrixcomposites with two kinds of matrix: steel andtitanium alloys both reinforced with TiC particles.
2 Experimental set-up
2.1 High energy X-ray diffraction
The X-ray diffraction (XRD) experiments wereperformed at the European Synchrotron RadiationFacility (ESRF, Grenoble, France), on the ID15Bbeam line. The in situ measurements were conductedusing high energy X-ray synchrotron radiationdiffraction with a monochromatic beam of 87 keV.
The high energy beam allowed to analyze a largevolume of the sample, to be representative of thebulk behavior and to lessen the surface effect [4 , 5].High energy X-ray diffraction is largely used todetermine the mechanical behavior of heavy samples[6]. The combination between the high flux fromsynchrotron source, a large area detector and thehigh energy allows to make in situ analysis ofphenomena with a time scale of one second or less.The large flux of the source permits to record in asmall time a high-quality diffraction signal. Thelarge area detector allows to record the wholeDebye-Scherer diffraction rings. The use of thewhole rings permits to lessen the effect of texture inthe materials in the case of quantitative phaseanalysis [7, 5] or to analyze the texture effect [8] andextract the strain and stress evolutions in a singleimage [9, 10 , 11]. For our experiments, the samples had a thickness of3 mm in the beam direction. The beam size wasfixed to 0.4x0.4mm2. Each sample was heated usinga radiant furnace allowing to heat up to 1000ºC. Athermocouple was spot-welded on the samplesurface leading to the measurement of temperatureand allowing the control of the heating conditions.XRD patterns were recorded by a flat CCD detector(pixium 4700), with one image every 3.5s (1sexposure + 2.5s readout time). Data have beencorrected and reduced to (2q, intensity) patternsusing fit2d software [12] suitable for Rietveldanalysis [13, 14]. Using the phase selectivity of theX-ray diffraction we are able to extract parametersfor each phase present in the composite and due tothe beam quality of the synchrotron source, phasewith low fraction can be detected. The fraction limitfor this technique is around 0.5%.
MICROSTRUCTURAL EVOLUTION OF METAL MATRIXCOMPOSITES BY IN SITU HIGH ENERGY X-RAY
DIFFRACTION
G. Geandier1,2*, M. Salib1,2, M. Mourot1, L. Vautrot1,2, M. Dehmas1,2, B. Denand1,2, E. Aeby-Gautier1,2, S. Denis1,2
1 Institut Jean Lamour - UMR CNRS 7198 – Université de Lorraine, Nancy, France2LabEx DAMAS – Université de Lorraine, Nancy, France Corresponding author (guillaume.geandier@ univ-lorraine .fr )
Keywords: metal matrix composite, X-ray diffraction, synchrotron, phase transformation

2.2 Samples
Mecachrome has elaborated the composites.Ti64-TiC composite contains 10vol% of TiC andsteel-TiC contains 15mass% ot TiC.
Matrix compositions of the composites arereported in table 1 for Ti64-TiC composite and table2 for steel-Tic composite.
Ti Al V C Fe O N H
Bal. 6.09 4 0.02 0.17 0.16 0.01 0.003
Tab.1: Composition of the matrix of Ti64-TiCcomposite (in mass%).
Fe C Cr Mo Mn Si Ni V Nppm
Bal. 0.31 3.83 0.72 0.43 0.59 0.07 0.12 152
Tab.2: Composition of the matrix of the steel-TiCcomposite (in mass%).
At first, a mechanical milling of TiC particles andmatrix powders was performed at relatively lowenergy in order to reduce the size of bothcomponents. The consolidation of the compositepowders was further realized by hot isostaticpressing (HIP) under a stress of 100 MPa at 920°Cfor Ti64 matrix and 1120°C for steel matrix during 4hours.
The micrographs obtained at room temperatureafter HIP, are given Fig. 1 and Fig. 2.
The micrographs obtained for Ti64-TiCcomposite (Fig 1) are given at two magnifications.At the micrometer scale, the distribution of thephases/components presents some heterogeneitywith dark/grey and light areas. The dark/grey areasare related to the presence of TiC particles, while thelight areas correspond to a lower concentration orthe absence of reinforcement. From SEM imageobtained at higher magnification (bottom) wedistinguish the reinforcement in black and the twophases present in the matrix (alpha in grey and betain white).
The steel/TiC composite presents also a non-homogeneous distribution of all components withthe black components being the TiC particles, thegrey area being a mixture of TiC particles and steeland the lighter area some steel powders withoutreinforcement [3].
Fig.1. Micrographs of the titanium matrix compositeobtained by OM (top), and by SEM (BSE) (bottom).
Fig. 2. microstructure of the steel matrix composite.
3 Results
3.1 Titanium matrix composite
3.1.1 Kinetics of phase transformation
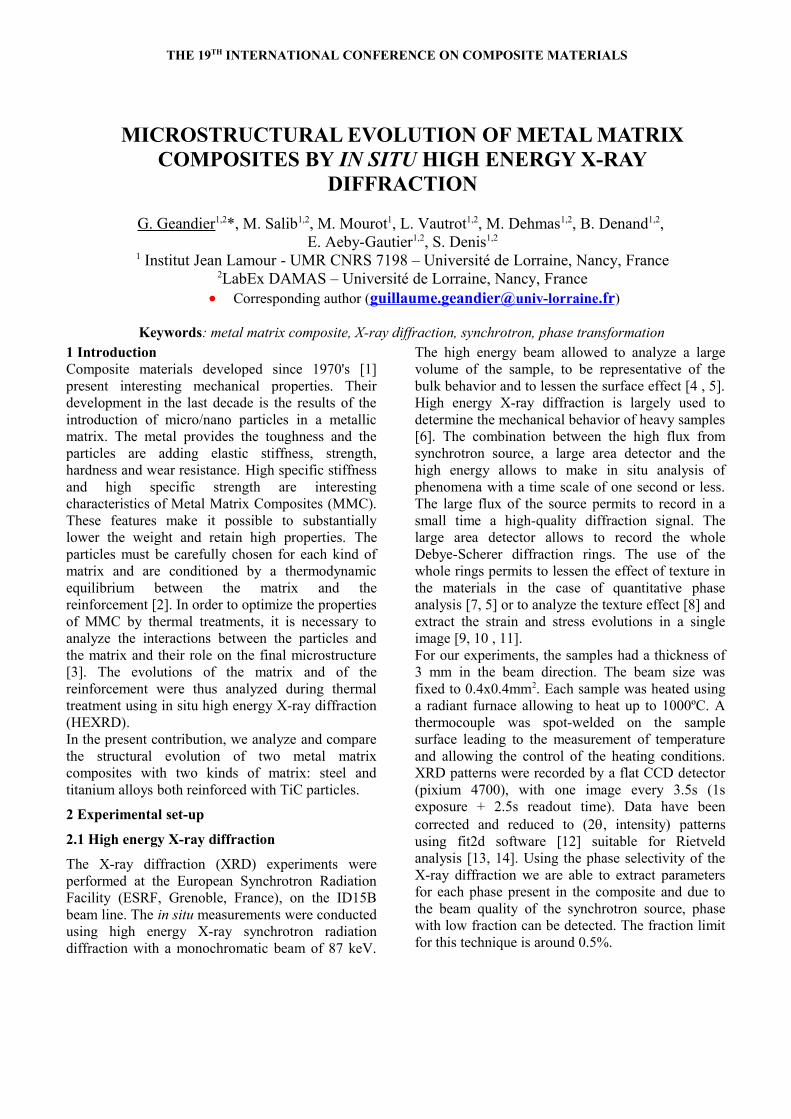
An example of the evolution of phase fraction isgiven for Ti-64 matrix composite (Fig. 3). In theinitial state (after HIP), a mixture of three phases ischaracterized, consisting of 83% of α phase, 5.5% of
b and 11.5% of TiC. Phase transformations start at600°C. Between 600°C and 720°C, the kinetics ofphase transformation α to β is very slow. In this gapof temperature, the amount of TiC increases,reaching a maximum of 12.5% at 720°C. Thisincrease of 1% is significant for the experimentaltechnique used. Between 720°C and 920°C (dwell temperature), theα β transformations kinetics is accelerated. At theend of the heating, the three phases are still presentwith 56 % α phase, 32 % β phase and 12 % TiC.During the well, we can observe some oscillationsthat are due to the non-perfect temperature control.The amount of α phase is slightly decreasing toreach a value 51% at the end of dwell. Theseamounts are different from the ones expected in aTi64 alloy. Indeed, in a Ti64 alloy, the amount ofphases present at 920°C would be 46vol% of a and54vol% of b [15]. These values are significantlydifferent from the ones measured. Therefore the α β transformation domain in the Ti64/TiC compositeis clearly shifted toward higher temperatures.
Fig.3. mass fraction evolution during heat thermalfor Ti-64/TiC composite.
During the cooling stage, the amount of a increasesvery quickly until 680°C and more slowly between680°C and 550°C. At temperatures lower than 550 °C, the volume fraction of each phase remain nearlyconstant whereas TiC amount slightly decreasesthroughout the cooling. At the end of the heattreatment, the phase ratio are nearly similar to thosepresent in the initial state. However, the rate of TiCphase increased by about 1% vol. From Ti-C phasediagram and for a given composition, small changesin TiC amount can be expected when temperature
varies [16]. Indeed, TiC as well as a and b are nonstoechiometric. Moreover, TiC can be enriched inoxygen [17]
3.1.2 Cell parameters evolution
Rietveld method allowed to determine the cellparameters for each phase and their evolution duringthe thermal treatment. The relative cell parametervariations (see equation 1).((a i
−a0i)/a0
i) (1)
where ai is the cell parameter of phase i for the givenimage number and ai
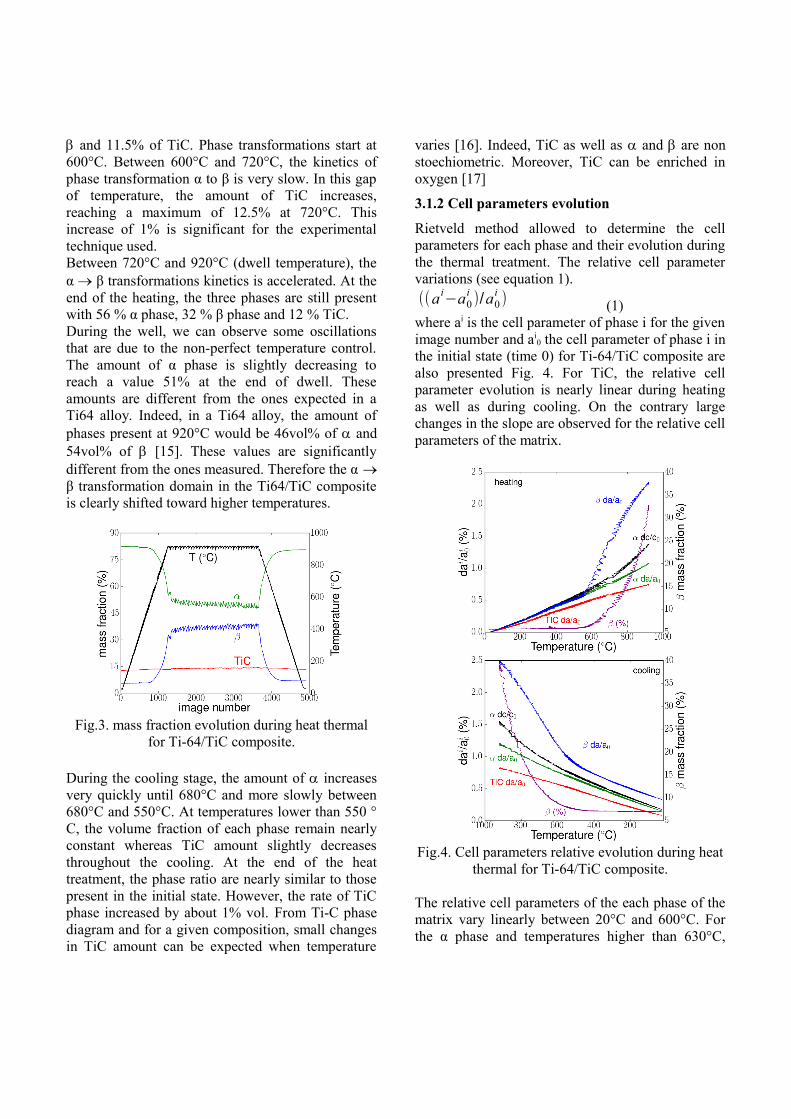
0 the cell parameter of phase i inthe initial state (time 0) for Ti-64/TiC composite arealso presented Fig. 4. For TiC, the relative cellparameter evolution is nearly linear during heatingas well as during cooling. On the contrary largechanges in the slope are observed for the relative cellparameters of the matrix.
Fig.4. Cell parameters relative evolution during heatthermal for Ti-64/TiC composite.
The relative cell parameters of the each phase of thematrix vary linearly between 20°C and 600°C. Forthe α phase and temperatures higher than 630°C,
both relative cell parameters (a and c) increase, butnon-linearly. For daa/aa0 the slope increases slightlyuntil 920°C, while dca/ca0 present higher slopevariations at temperatures > 505°C. During cooling,daa/aa0 and dca/ca0 are similar to those observedduring heating. For the β phase, dab/ab0 increaseslinearly up to 550 °C. Between 550°C and 920°Cdab/ab0 increases abruptly reaching a value more thantwice the value obtained between 20°C-500°C. Thisstrong variation is mainly associated with the partialab phase transformation and the associatedchange in chemical composition of b [18]. Oncooling the behavior is symmetrical (strong decreaseof dab/ab0 namely during the increase of a amounts.These behaviors for a and b phases are similar to theones obtained for titanium alloys [18, 19]. The thermal expansion coefficient of each phase wasestimated in the linear part of the evolution. Resultsare reported in table 3.
Phase (10-6K-1) Temperaturerange (°C)
heating
Ti64- / a 10.8 30-630
Ti64- / c 11.3 30-505
Ti64- 10.9 30-550
TiC 8.9 30-680
cooling
Ti64- / a 10.7 40-660
Ti64- / c 10.5 40-500
Ti64- 11.3 40-450
TiC 8.2 40-895Tab.3. experimental coefficient of thermal expansionfor Ti-64/TiC composite during heating and cooling.
3.2 Steel matrix composite
For the steel-TiC composite we mainly focus on thephase transformations occurring during cooling. At the end of the heating and dwell at 1000°C, thesteel-TiC composite is composed of two phases:
austenite (81.6%) and TiC (18.4%). The behavior ofthe phases is analyzed for two cooling conditionsfrom 1000°C to room temperature; Condition A,slow cooling at 0.5°C/s leading to the formation offerrite and pearlite in the metallic matrix, ConditionB, cooling at 5°C/s, leading mainly to the formationof martensite in the metallic matrix.
3.2.1 Kinetics of phase transformation
The mass fraction evolutions of each phase versustemperature are given figures 5 and 6 for cooling at0.5°C/s (condition A) and 5°C/s (condition B)respectively.
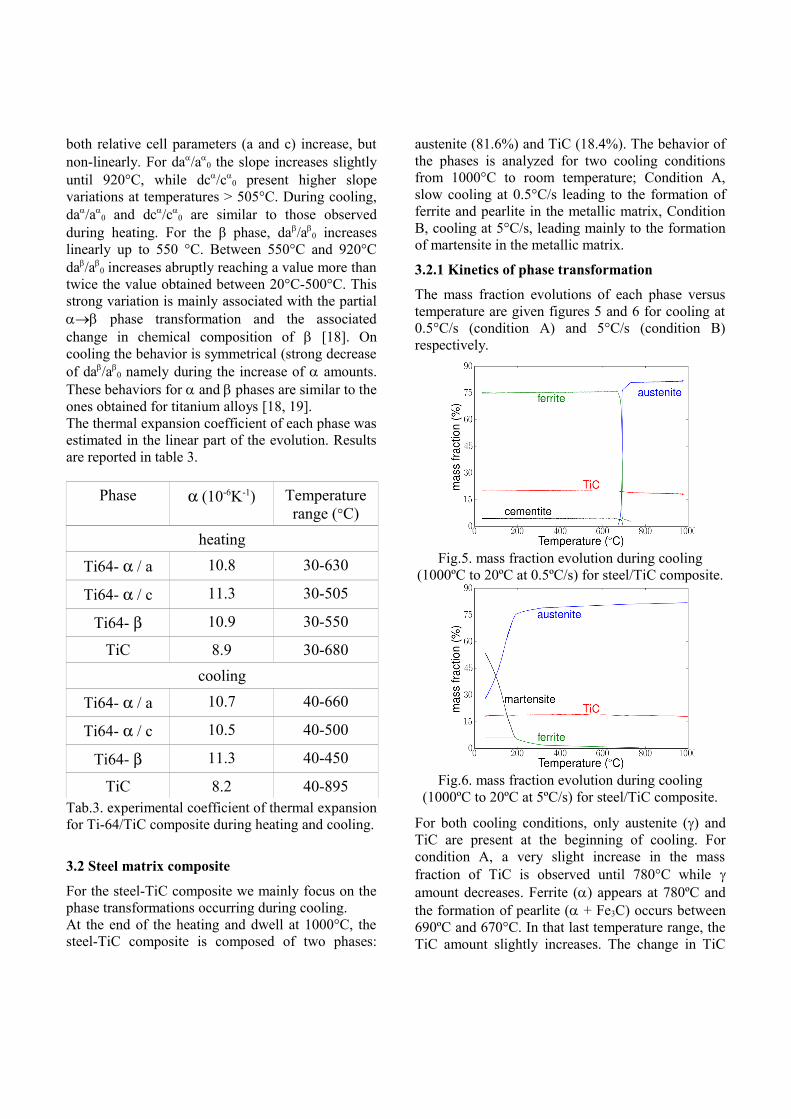
Fig.5. mass fraction evolution during cooling(1000ºC to 20ºC at 0.5ºC/s) for steel/TiC composite.
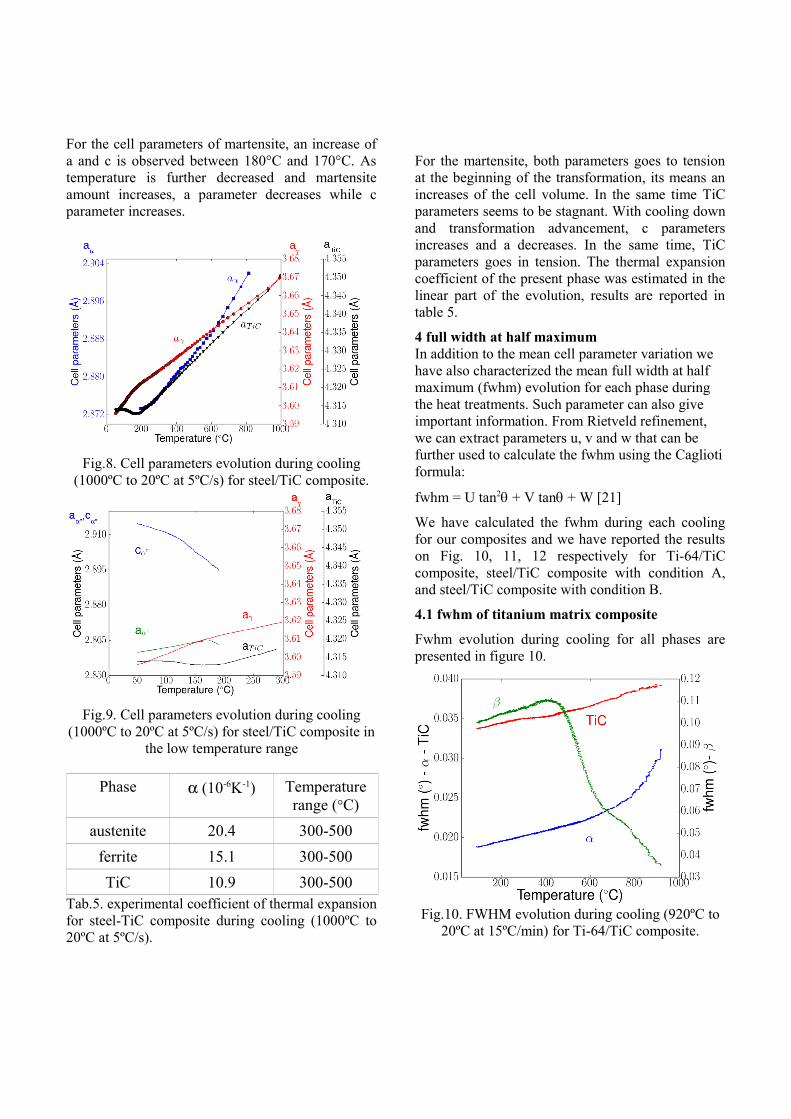
Fig.6. mass fraction evolution during cooling(1000ºC to 20ºC at 5ºC/s) for steel/TiC composite.
For both cooling conditions, only austenite (g) andTiC are present at the beginning of cooling. Forcondition A, a very slight increase in the massfraction of TiC is observed until 780°C while gamount decreases. Ferrite (a) appears at 780ºC andthe formation of pearlite (a + Fe3C) occurs between690ºC and 670°C. In that last temperature range, theTiC amount slightly increases. The change in TiC

amounts is due to differences in carbon solubility inaustenite and ferrite and non-stoichiometry of theTiC phase. For that cooling rate, the transformationof the matrix leads to a mixture of ferrite andpearlite. At temperatures lower than 670°C, theamount of all phases remains constant until roomtemperature.
For condition B, ferrite (a) appears also at 780ºC.The amount of this BCC structure increases slightlyuntil 200°C (5 mass % at 200°C). At temperatureslower than 200°C, the martensite (tetragonalstructure) is formed. The TiC amount reminds stableduring cooling. As martensite and ferrite have nearlythe same crystallographic structure, it is not possibleto distinguish the ferrite from martensite at lowtemperature. We have assumed that ferrite remainsconstant when the martensite transformation begins.For condition B, the transformation of the matrixleads to a mixture of austenite, ferrite andmartensite.
3.2.2 Cell parameters evolution
The cell parameters evolutions during cooling forthe steel/TiC composite are given Fig. 7, Fig. 8 andFig. 9.
Fig.7. Cell parameters evolution during cooling(1000ºC to 20ºC at 0.5ºC/s) for steel/TiC composite.
For condition A, (Fig. 7), the cell parametersevolution is linear between 1000°C and 700°C,when no phase transformation occurs or at the veryearly stages of the matrix transformation. During thepearlite formation (690°C-670°C), the austenite
parameter decreases while the ferrite parameterincreases. The TiC cell parameter presents also anincrease during this step of the matrix phasetransformation. During the further cooling, weclearly evidence a non-linearity of the cellsparameters of ferrite and TiC at temperatures lowerthan 300°C.
The CTE of the present phase was estimated indifferent temperature ranges. Results are reported intable 4.
Phase (10-6K-1) Temperaturerange (°C)
austenite 22.1 750-900
ferrite 14.7 300-600
ferrite 12.2 100-300
TiC 10.7 720-900
TiC 10.4 300-600
TiC 9.1 100-300Tab. 4: experimental coefficient of thermalexpansion for steel-TiC composite during cooling(1000ºC to 20ºC at 0.5ºC/s).
These values clearly highlight the changes in theapparent CTE. Indeed, the CTE value of TiC islarger than the one measured in the Ti64-TiCcomposite (8.6.10-6K-1), and generally reported in theliterature [20]. It decreases significantly astemperature decreases. For condition B, from thebeginning of cooling and until the martensiteformation, the cell parameters of each phasedecrease continuously with slight changes in theslope.
During the martensite formation, as austenite contentreaches 28%, its cell parameter decreases anddeviates significantly from linearity; meanwhile theTiC cell parameter increases also deviates fromlinearity and even increases. This is also highlightedin Fig. 9 giving in addition the cell parameters ofmartensite, for the temperature range 20°C- 300°C.The TiC cell parameter seems to be stagnantbetween 200°C and 150°C, and further increasesuntil 50°C.
For the cell parameters of martensite, an increase ofa and c is observed between 180°C and 170°C. Astemperature is further decreased and martensiteamount increases, a parameter decreases while cparameter increases.
Fig.8. Cell parameters evolution during cooling(1000ºC to 20ºC at 5ºC/s) for steel/TiC composite.
Fig.9. Cell parameters evolution during cooling(1000ºC to 20ºC at 5ºC/s) for steel/TiC composite in
the low temperature range
Phase (10-6K-1) Temperaturerange (°C)
austenite 20.4 300-500
ferrite 15.1 300-500
TiC 10.9 300-500Tab.5. experimental coefficient of thermal expansionfor steel-TiC composite during cooling (1000ºC to20ºC at 5ºC/s).
For the martensite, both parameters goes to tensionat the beginning of the transformation, its means anincreases of the cell volume. In the same time TiCparameters seems to be stagnant. With cooling downand transformation advancement, c parametersincreases and a decreases. In the same time, TiCparameters goes in tension. The thermal expansioncoefficient of the present phase was estimated in thelinear part of the evolution, results are reported intable 5.
4 full width at half maximumIn addition to the mean cell parameter variation we have also characterized the mean full width at half maximum (fwhm) evolution for each phase during the heat treatments. Such parameter can also give important information. From Rietveld refinement, we can extract parameters u, v and w that can be further used to calculate the fwhm using the Cagliotiformula:
fwhm = U tan2q + V tanq + W [21]
We have calculated the fwhm during each coolingfor our composites and we have reported the resultson Fig. 10, 11, 12 respectively for Ti-64/TiCcomposite, steel/TiC composite with condition A,and steel/TiC composite with condition B.
4.1 fwhm of titanium matrix composite
Fwhm evolution during cooling for all phases arepresented in figure 10.
Fig.10. FWHM evolution during cooling (920ºC to20ºC at 15ºC/min) for Ti-64/TiC composite.

For TiC and a phase, the fwhm values are low at thebeginning of cooling (0.030° for a and 0.038° forTiC). These values are decreasing during the wholecooling, more quickly between 920°C and 600°Cwhile a amount increases. For b phase, the fwhm isof the same order of magnitude as the other phasesat the beginning of cooling (0.035°). However, thevalue increases very significantly during cooling; afirst increase (up to 0.06°) is observed between920°C and 600°C, while a amount increases, and asecond strong increase (up to 0.11°) is observedbetween 600°C and 420°C. For temperatures lowerthan 400°C, the fwhm for b is slightly decreasing.
4.2 fwhm of steel matrix composite
The fwhm evolution during cooling are plottedversus temperature in Fig. 11 and Fig. 12, forcondition A and condition B respectively.
Fig.11. FWHM evolution during cooling (1000ºC to20ºC at 0.5ºC/s) for steel/TiC composite.
At the beginning of cooling, the fwhm values arelow both for austenite (0.020°) and TiC (0.030°).For condition A, a slight decrease of fwhm isobserved between 1000°C and 850°C followed byan increase of fwhm until the beginning of ferriteformation. During the ferrite/pearlite formationfwhm of TiC and g is decreasing, even quite abruptlyfor g. As a phase is formed, the associated fwhmvalues are quite high at the early stages of thetransformation (0.09° to 0.10°) and they decreasereaching a value lower than 0.02° at 650°C. Thisvalue remains constant until room temperature.Meanwhile, fwhm of Fe3C remains constant and the
one of TiC continuously increases. , for TiC we cannote an increase of the fwhm meaning some stressgrandient in TiC particles. Fwhm data between 690and 670ºC are difficult to interpret due thedifficulties to fit the XRD diagrams during Rietveldanalysis due to the small amount of phase present,the complexity of the cementite phase that conductto low intensity peaks.
Fig.12. FWHM evolution during cooling (1000ºC to20ºC at 5ºC/s) for steel/TiC composite.
Fig.13. FWHM evolution during cooling (1000ºC to20ºC at 5ºC/s) for steel/TiC composite as a function
of martensite mass fraction (200 to 20ºC).
For condition B, TiC and austenite fwhm have asimilar behavior as for condition A between 1000°Cand 780ºC. At this temperature, where ferriteappears, we can notice a very small decrease of thefwhm of TiC and austenite and then the both phases’

fwhm increases until the formation of martensite. Inthe same time, we notice high values of the fwhm offerrite that are decreasing (from 0.14° to 0.10°). Attemperatures lower than 200ºC, when martensite isforming, fwhm of TiC is still increasing up to valuesof 0.044°. The fwhm value of austenite is increasingup to 0.06° while for martensite, fwhm is firstlydecreasing and further increases when temperature isbelow 130ºC. The final value of fwhm of martensiteremains high (0.09).
5 Discussion
Thanks to the high energy X-ray diffraction we wereable to characterize the evolution of the phases in thedifferent CMM as well as their mean cell parameterand fwhm. As heat treatments were performed intemperature ranges where phase transformations (atleast in the matrix) occur, we were able tocharacterize the effect of the reinforcement on thephase transformation kinetics in the matrix.
Indeed, for Ti-64/TiC composite, we obtain afterdwell at 920°C a mixture of TiC, a and b phases. aand b amounts in the matrix are far from the onesexpected in a Ti-64 alloy at the same temperature.This means that the ab transformation domain isshifted to higher temperatures. This shift can beassociated with changes in the matrix composition.If some modification in carbon and titaniumamounts can be expected, the effect of carbon on theequilibrium a phase amount and equilibriumtemperature is low. For Ti-C phase diagram, thetemperature at which no more a is present isincreased by 40°C [16]. We performed additionalexperiments and determined the limit temperature ofthe two phases domain (b+TiC). The value obtainedis near 1200°C. Different authors also reported suchresult. They attributed the increase in the limittemperature to an increase in the oxygen amountintroduced during the milling process. This higheroxygen amount will strongly increase the betatransus temperature of the titanium matrix, and inconsequence increase the a amount at a giventemperature.
In the case of the steel/TiC composite, we haveshown that the presence of reinforcement favors thetransformation at the higher temperatures ascompared to a steel specimen without TiC [3]. We
mainly focus on the cell parameter evolution.
The cell parameter evolution that were characterizedduring the heat treatments may be due to 3 factors:variation of temperature, variation of chemicalcomposition of the phase, variation in the meanelastic strain in the phase. Analyzing simultaneouslythe fwhm variations, those ones are associated withheterogeneities in temperature, in chemicalcomposition and in elastic strains.
For Ti64-TiC composite, the applied heat treatmentleads to a diffusive phase transformation of thematrix. In addition, some chemical reaction mayoccur between the matrix and the reinforcement.
For steel/TiC composite, some changes in thecomposition of the phases (austenite for example)may occur at the lower cooling rate (condition A), aswell as some chemical reaction between the matrixand the reinforcement. However for the highercooling rate, for which a martensitic transformationis mainly occurring, the chemical reaction betweenTiC particles and the matrix should be low and themartensite formation is considered as atransformation without diffusion.
We have reported in Table 3 the CTE of the differ-ent phases. For the Ti64-TiC, the CTE values ob-tained for a and b phases are near the ones reportedin the literature [22]. For TiC the values obtained arelarger than the ones given in the literature 8.6.10-6
K-1 [20]The CTE of a and b present a non-linear behavior attemperatures higher than 550°C. Moreover, the ap-parent CTE of b phase is largely increased duringthe ab transformation. The large increase in ap-parent bCTE was observed in different Ti alloys.Isothermal characterization of phase transformationallowed to associate this behavior with the change incomposition of the beta phase during the phasetransformation [18]. In addition, changes in thefwhm were mentioned too associated with hetero-geneities in the b phase composition during thetransformation. For the higher transformation tem-peratures, fwhm increased and further decreased astransformation was completed. At the lower trans-formation temperatures, fwhm increases nearly con-tinuously, and did not decrease. This behavior wasassociated with a dispersed stress state due to the
transformation strain [19]. For our experiments,fwhm increases during the transformation: a first in-crease is observed between 920°C and 600°C and asecond one, larger in amplitude between 600°C and400°C. For the first increase, the change in transfor-mation amounts is large. The fwhm can mainly beassociated with heterogeneities in composition inbeta. At the lower temperatures, the amount of aformed is low (0.6% between 400°C and 20°C). Theincrease in fwhm can be due to stresses, either tothermal stresses or to transformation stresses. Asfwhm decreases at temperatures lower than 400°C,these stresses are mainly transformation stresses.
Analyzing the cell parameters evolution versustemperature for the steel/TiC composite, two majorfeatures can be pointed out: i) significant variationsof cell parameters during the transformations ii)deviations from a linear behavior during the cooling.
The apparent CTE obtained in table 4 and 5 led todifferent values. We first point out the apparent CTEof TiC. The values characterized are near 10.7-10.9.10-6K-1 in the high temperature range. Thesevalues are larger than the value obtained for theTi64-TiC composite, and about 30% larger thanthose reported in the literature. Such differencecannot be associated with a change in the chemicalcomposition of the TiC during cooling. It is due tothermal stresses in the composite. As austenite CTEis nearly 3 times larger than that of TiC, stresses aregenerated in both phases. The apparent CTE of TiCincreases while that of austenite decreases. TiCreinforcements have a mean compression state,while the austenite grains have a mean tensile strain.After transformation, when the matrix is mainlycomposed of pearlite (CTE near 12.10-6K-1) theapparent CTE of TiC is lower (9.10-6K-1).
In addition to the thermal stresses, these resultshighlight the role of the transformation strain onchanges in the local stress states. For bothconditions, the transformation occurs with anincrease in the atomic volume. This change leads toan increase of the TiC cell parameter during thepearlite formation as well as during the martensiteformation. If we consider that the CTE of TiCparticles is near 8.10-6K-1, the TiC particles are in amean compression state before the transformation.The volume increase associated with the
transformation will lower the mean compression. Onthe other hand, the austenite was in a mean tensilestate, and the transformation will lead to decreasethis mean tensile state. The increase in fwhm isagain associated with a spread of the local elasticstrains due to the spatial distribution of the phasesand some possible local plasticity (dislocationdensity) [23].
Additional analysis of these results needs amicromechanical model leading to the local straindistribution during the treatment.
6 Concluding remarks
High energy diffraction is a powerful tool tohighlight the microstructure evolution duringthermal treatments. Evolution of the phase fractionand cell parameters during thermal treatments ofmetal matrix composites (titanium and steel matrix)shown that their exist chemical exchange betweenthe matrix and the reinforcement. These exchangesmodify the phase transformation kinetics. Moreoverwe highlight the formation of stresses in each phaseduring the transformation and during thermaltreatment (without phase transformation). Thosestresses have to be considered regarding the finalproperties of the composite.
Acknowledgement
The authors gratefully acknowledge Mecachromefor supplying the materials, the direction Généraledes Entreprises (DGE) for financial support in theAMETIS program and the European SynchrotronRadiation Facility (ESRF) for provision of beamtimeat beamline ID15B. This work was supported by theFrench State through the program "Investment in thefuture" operated by the National Research Agency(ANR) and referenced by ANR-11-LABX-0008-01(LabEx DAMAS).
References
[1] L. Guozhen, Z. Quanpu and D. Ju, “The Research andDevelopment of TMCs”, Titanium ’95, Vol. 3, pp2704-2713, 1995
[2] T. Saito, T. Furuta and H. Takamiya, “Sinteringbehaviour and thermal stability of a TiB particlereinforced PM Beta-titanium matrix composite”,Titanium’95, Vol. 3, pp 2763-2770, 1995
[3] M. Mourot, A. Courleux, M. Dehmas, E. Gautier, G.

Geandier, O. Dezellus, J.C. Viala, O. Martin, O., N.Karnatak And F. Danoix “Transformation Kineticsand Resulting Microstructure in MMC Reinforcedwith TiC Particles”, Solid State Phenomena, Vol.172-174, pp 747-752, 2011
[4] T. Tschentscher and P. Suortti “Experiments withVery High Energy Synchrotron Radiation”, Journalof Synchrotron Radiation, vol. 5, 286-292, 1998
[5] G. Geandier, E. Aeby-Gautier, a. Settefrati, M.Dehmas and B. Appolaire, B, “Study of diffusivetransformations by high energy X-ray diffraction”,Comptes Rendus Physique, Vol. 13, pp 257-267,2012
[6] K.D. Liss, A. Bartels, A. Schreyer and H. Clemens“High-energy x-rays: a tool for advanced bulkinvestigations in materials science and physics”,Textures and Microstructures, vol. 35, 219–252,2003
[7] L.A. Yeoh, K.D. Liss, A. Bartels, H. Chladil, M.A.HClemens, R. Gerling and T. Buslaps “In situ high-energy X-ray diffraction study and quantitative phaseanalysis in the alpha + gamma phase field of titaniumaluminides”, Scripta Materialia, vol. 57, 1145–1148,2007
[8] H. Bunge, L. Wcislak, H. Klein, U. Garbe, and J.Schneider “Texture and Microstructure analysis withhigh energy synchrotron radiation”, MaterialsScience Forum, vol.408-412, 137-142, 2002
[9] N. Jia, Z. Cong, X. Sun, S. Cheng, Z. Nie, Y. Ren, P.Liaw and Y. Wang “An in situ high-energy X-raydiffraction study of micromechanical behavior ofmultiple phases in advanced high-strength steels”,Acta Materialia, vol. 57, 3965–3977, 2009
[10] G. Sun, X. Wang, Y. Wang, W. Woo, H. Wang, X.Liu, B. Chen, Y. Fu, L. Sheng and Y. Ren “In-situhigh-energy synchrotron X-ray diffraction study ofmicromechanical behavior of multiple phases inNi47Ti44Nb9 shape memory alloy”, MaterialsScience & Engineering A, vol. 560, 458–465, 2013
[11] A.M. Korsunsky, X. Song, F. Hofmann, B. Abbey,M. Xie, T. Connolley, C. Reinhard, R.C. Atwood, L.Connor and M. Drakopoulos “Polycrystaldeformation analysis by high energy synchrotron X-ray diffraction on the I12 JEEP beamline at DiamondLight Source”, Materials Letters, vol. 64, 1724–1727,2012
[12] A.P. Hammersley, S.O. Svensson, A. Thompson, H.Graafsma, A. Kvick and J.P. Moy “Calibration andcorrection of distortions in two-dimensional detectorsystems”, Review of Scientific Instrument, vol. 66, pp2729-2733, 1995
[13] H.M.A. Rietveld “Profile Refinement Method for
Nuclear and Magnetic Structures”, Journal ofApplied Crystallography, vol. 2, pp 65-71, 1969
[14] J. Rodriguez-Carvajal, “Recent advances in magneticstructure determination by neutron powderdiffraction”, Physica B, vol. 192, 55-69, 1993
[15] M. Dehmas, R. Katemi, B. Appolaire, E. Aeby-Gautier, B. Denand and S. Audion “Dissolutionkinetics of alpha phase in TA6V titanium alloy”, Ti-2011 12th world conference on Titanium, Beijing,china 2011.
[16] K. Frisk, “A revised thermodynamic description ofthe Ti–C system”, Computer Coupling of PhaseDiagrams and Thermochemistry, vol 27, 367–373,2003
[17] T. M. T. Godfrey, A. Wisbey, P. S. Goodwin, K.Bagnall, and C. M. Ward-Close, “Microstructure andtensile properties of mechanically alloyed Ti–6A1–4V with boron additions,” Materials Science andEngineering: A, vol. 282, no. 1–2, pp. 240–250,2000.
[18] F. Bruneseaux, E. Aeby-Gautier, G. Geandier, JTeixeira, B. Appolaire, P. Weisbecker and A. Mauro“in situ characterizations of phase transformationdkinetics in Ti17 titanium alloy by electrical resistivityand high temperature synchrotron X-ray diffraction”,Materials Science and Engineering A, vol 476, 60-68, 2008
[19] E. Aeby-Gautier, F. Bruneseaux, J Teixeira, B.Appolaire, G. Geandier, S. Denis, “MicrostructuralFormation in Ti Alloys: In-Situ Characterization ofPhase Transformation Kinetics”, Journal ofMaterials, January, 55-58, 2007
[20] Wokulska, K “Thermal expansion of whiskers ofTi(C,N) solid solutions”, Journal of Alloys andCompounds, vol 264, 223–227, 1998
[21] G. Caglioti, A. Paoletti and F.P. Ricci “choice ofcollimators for a crystal spectometer for neutrondiffraction”, Nuclear instrument, vol. 3, 223-228,1958
[22] W.B. Pearson, “Handbook of lattice spacings andstructures of metals”, volume 2. Pergamon Press,1967.
[23] G. Dini, R. Ueji, A. Najafizadeh and S. Vaghefi“Flow stress analysis of TWIP steel via the XRDmeasurement of dislocation density”, MaterialsScience and Engineering A, vol 527, 2759-2763,2010


![Improvement of Interfacial Shear Strength Using ...confsys.encs.concordia.ca/ICCM19/AllPapers/FinalVersion/RUT80577.pdf · modified by introducing nano, ... the IFSS [15] and, based](https://static.fdocuments.us/doc/165x107/5abd66f07f8b9a8e3f8bba70/improvement-of-interfacial-shear-strength-using-by-introducing-nano-the.jpg)


