Microstructural Characterization of Layers Produced by ... · Microstructural Characterization of...
11
George E. Totten, 1 Luiz C. Casteletti, 2 Frederico A. P. Fernandes, 3 and Juno Gallego 4 Microstructural Characterization of Layers Produced by Plasma Nitriding on Austenitic and Superaustenitic Stainless Steel Grades High chromium content is responsible for the formation of a protective passive surface layer on austenitic stainless steels (ASS). Due to their larger amounts of chromium, superaustenitic stainless steels (SASS) can be chosen for applications with higher corrosion resistance requirements. However, both of them present low hardness and wear resistance that has limited their use for mechanical parts fabrication. Plasma nitriding is a very effective surface treatment for producing harder and wear resistant surface layers on these steel grades, without harming their corrosion resistance if low processing temperatures are employed. In this work UNS S31600 and UNS S31254 SASS samples were plasma nitrided in temperatures from 400 C to 500 C for 5h with 80% H 2 –20 % N 2 atmosphere at 600 Pa. Nitrided layers were analyzed by optical (OM) and transmission electron microscopy (TEM), x-ray diffraction (XRD), and Vickers microhardness testing. Observations made by optical microscopy showed that N-rich layers were uniform but their thicknesses increased with higher nitriding temperatures. XRD analyses showed that lower temperature layers are mainly composed by expanded austenite, a metastable nitrogen supersaturated phase with excellent corrosion and tribological properties. Samples nitrided at 400 C produced a 5 lm thick expanded austenite layer. The nitrided layer reached 25 lm in specimens treated at 500 C. There are indications that other phases are formed during higher temperature nitriding but XRD analysis was not able to determine that phases are iron and/or chromium nitrides, which are responsible for increasing hardness from 850 up to 1100 HV. In fact, observations made by TEM have indicated that formation of fine nitrides, virtually not identified by XRD technique, can begin at lower temperatures and their growth is affected by both thermodynamical and kinetics reasons. KEYWORDS: plasma nitriding, expanded austenite, microstructure, XRD, TEM analysis Introduction Austenitic and superaustenitic stainless steels have extensively been applied in the production of corrosion resistant components. Nevertheless, their mechanical, tribological, and fatigue properties can be increased by thermochemical treatments as plasma nitriding [1–3]. At temperatures below 500 C plasma nitriding of austenitic stainless steel can produce a nitrogen supersaturated metastable phase which is usually called ‘‘expanded austenite’’ or “S phase.” The mechanical, tribological, and fatigue properties of expanded aus- tenite are very superior to those found in a white layer composed mainly by hard nitrides. Interstitial nitro- gen atoms occupy disordered octahedral sites in the fcc crystal lattice of austenite, significantly increasing the lattice parameter due to very high (30–40 at %) N content [4–8]. The expansion caused by the interstitial nitrogen in the expanded austenite layer generates compres- sive lattice strains, which result in a increase in the stacking fault density. Another consequence of nitro- gen supersaturation is relating to crystallography of the S phase that yields an anomalous behavior in the x-ray diffraction (XRD) analysis [8–13]. The XRD patterns present peaks with anisotropic shift to lower Manuscript received November 10, 2010; accepted for publication November 14, 2011; published online December 2011. 1 Dept. of Mechanical and Materials Engineering, Portland State Univ., P.O. Box 751, Portland, OR, 97207-0751, e-mail: [email protected] 2 Dept. of Materials, Aeronautical and Automotive Engineering, Sa ˜o Carlos School of Engineering, Univ. of Sa ˜o Paulo, Av. Trabalhador Sa ˜ocarlense, n. 400, 13566-590, Sa ˜o Carlos, SP, Brazil, e-mail: [email protected] 3 Dept. of Materials, Aeronautical and Automotive Engineering, Sa ˜o Carlos School of Engineering, Univ. of Sa ˜o Paulo, Av. Trabalhador Sa ˜ocarlense, n. 400, 13566-590, Sa ˜o Carlos, SP, Brazil, e-mail: [email protected] 4 Dept. of Mechanical Engineering, Sa ˜o Paulo State Univ., UNESP – Campus of Ilha Solteira, Av. Brasil Centro, n. 56, 15385- 000, Ilha Solteira, SP, Brazil (Corresponding author), e-mail: [email protected] Copyright V C 2012 by ASTM International, 100 Barr Harbor Drive, PO Box C700, West Conshohocken, PA 19428-2959. Journal of ASTM International, Vol. 9, No. 2 Paper ID JAI103564 Available online at www.astm.org Copyright by ASTM Int'l (all rights reserved); Fri Jan 27 07:06:43 EST 2012 Downloaded/printed by Univ Estadual De Montes Claros pursuant to License Agreement. No further reproductions authorized.
Transcript of Microstructural Characterization of Layers Produced by ... · Microstructural Characterization of...

George E. Totten,1 Luiz C. Casteletti,2 Frederico A. P. Fernandes,3
and Juno Gallego4
Microstructural Characterization of Layers Producedby Plasma Nitriding on Austenitic and SuperausteniticStainless Steel Grades
High chromium content is responsible for the formation of a protective passive surface layer on austeniticstainless steels (ASS). Due to their larger amounts of chromium, superaustenitic stainless steels (SASS)can be chosen for applications with higher corrosion resistance requirements. However, both of thempresent low hardness and wear resistance that has limited their use for mechanical parts fabrication.Plasma nitriding is a very effective surface treatment for producing harder and wear resistant surface layerson these steel grades, without harming their corrosion resistance if low processing temperatures areemployed. In this work UNS S31600 and UNS S31254 SASS samples were plasma nitrided in temperaturesfrom 400 �C to 500 �C for 5 h with 80 % H2–20 % N2 atmosphere at 600 Pa. Nitrided layers were analyzedby optical (OM) and transmission electron microscopy (TEM), x-ray diffraction (XRD), and Vickersmicrohardness testing. Observations made by optical microscopy showed that N-rich layers were uniformbut their thicknesses increased with higher nitriding temperatures. XRD analyses showed that lowertemperature layers are mainly composed by expanded austenite, a metastable nitrogen supersaturatedphase with excellent corrosion and tribological properties. Samples nitrided at 400 �C produced a 5 lm thickexpanded austenite layer. The nitrided layer reached 25 lm in specimens treated at 500 �C. There areindications that other phases are formed during higher temperature nitriding but XRD analysis was not ableto determine that phases are iron and/or chromium nitrides, which are responsible for increasing hardnessfrom 850 up to 1100 HV. In fact, observations made by TEM have indicated that formation of fine nitrides,virtually not identified by XRD technique, can begin at lower temperatures and their growth is affected byboth thermodynamical and kinetics reasons.
KEYWORDS: plasma nitriding, expanded austenite, microstructure, XRD, TEM analysis
Introduction
Austenitic and superaustenitic stainless steels have extensively been applied in the production of corrosion
resistant components. Nevertheless, their mechanical, tribological, and fatigue properties can be increased
by thermochemical treatments as plasma nitriding [1–3]. At temperatures below 500 �C plasma nitriding
of austenitic stainless steel can produce a nitrogen supersaturated metastable phase which is usually called
‘‘expanded austenite’’ or “S phase.” The mechanical, tribological, and fatigue properties of expanded aus-
tenite are very superior to those found in a white layer composed mainly by hard nitrides. Interstitial nitro-
gen atoms occupy disordered octahedral sites in the fcc crystal lattice of austenite, significantly increasing
the lattice parameter due to very high (30–40 at %) N content [4–8].
The expansion caused by the interstitial nitrogen in the expanded austenite layer generates compres-
sive lattice strains, which result in a increase in the stacking fault density. Another consequence of nitro-
gen supersaturation is relating to crystallography of the S phase that yields an anomalous behavior in the
x-ray diffraction (XRD) analysis [8–13]. The XRD patterns present peaks with anisotropic shift to lower
Manuscript received November 10, 2010; accepted for publication November 14, 2011; published online December 2011.1Dept. of Mechanical and Materials Engineering, Portland State Univ., P.O. Box 751, Portland, OR, 97207-0751, e-mail:
[email protected]. of Materials, Aeronautical and Automotive Engineering, Sao Carlos School of Engineering, Univ. of Sao Paulo, Av.
Trabalhador Saocarlense, n. 400, 13566-590, Sao Carlos, SP, Brazil, e-mail: [email protected]. of Materials, Aeronautical and Automotive Engineering, Sao Carlos School of Engineering, Univ. of Sao Paulo, Av.
Trabalhador Saocarlense, n. 400, 13566-590, Sao Carlos, SP, Brazil, e-mail: [email protected]. of Mechanical Engineering, Sao Paulo State Univ., UNESP – Campus of Ilha Solteira, Av. Brasil Centro, n. 56, 15385-
000, Ilha Solteira, SP, Brazil (Corresponding author), e-mail: [email protected]
Copyright VC 2012 by ASTM International, 100 Barr Harbor Drive, PO Box C700, West Conshohocken, PA 19428-2959.
Journal of ASTM International, Vol. 9, No. 2Paper ID JAI103564
Available online at www.astm.org
Copyright by ASTM Int'l (all rights reserved); Fri Jan 27 07:06:43 EST 2012Downloaded/printed byUniv Estadual De Montes Claros pursuant to License Agreement. No further reproductions authorized.
gallego
Text Box
DOI: 10.1520/JAI103564

Bragg angles than those expected for austenite, which promote different expansion among diffracted
reflections. Thus {200} peak shows expanded austenite lattice larger than {111} reflection. As a conse-
quence, the elastic distortion of austenite lattice combined with massive stacking fault result in broader
and asymmetric XRD peaks, which became hard to identify phases with very small volume fraction, as
chromium or iron nitrides nucleated in expanded austenite layer.
In this work plasma nitriding was carried out at different temperatures on austenitic and superauste-
nitic stainless steels in order to study the microstructural changes after nitriding at 400 �C, 450 �C, and
500 �C. XRD analysis has confirmed that expanded austenite was formed on nitrided layers, but only trans-
mission electron microscopy was able to identify fine precipitation of chromium nitride. The formation of
these particles was attributed to localized decomposition of expanded austenite during nitriding treatment.
Materials and Methods
Samples of austenitic UNS S31600 (AISI 316 ASS) and superaustenitic UNS S31254 (254-SMO SASS)
stainless steels were prepared starting from rolled bars. Table 1 presents the nominal chemical compositions
of the investigated steels. After machining of the disks with 20 mm of diameter and 3 mm of thickness, the
surface of the pieces was wet ground and polished. During nitriding processing the pressure of the gaseous
mixture of 80 % H2 and 20 % N2 (v/v) and the time of treatment were standardized in 500 Pa and 5 h, respec-
tively. The temperatures used for nitriding were 400 �C, 450 �C, and 500 �C. Temperature was monitored
using K-type thermocouple. Other details of the nitriding processing were described in previous work [14].
The nitrided samples were analyzed by optical microscopy in a Zeiss Axiotech microscope, equipped
with high resolution image acquisition device. Acqua Regia etchant was used to reveal the contrast of the
microstructure on the polished surface. Vickers microhardness measurements were made with Buehler
digital equipment, where a load of 25 gf (245 mN) was applied during 10 s. The phase characterization in
the nitrided layer was accomplished by x-ray diffraction (XRD) in a Rigaku Gergerflex diffractometer
equipped with copper tube (Ka1¼ 1.5405 A) and graphite monochromator. The diffracted intensity was
TABLE 1—Nominal chemical composition of stainless steels (wt %).
Steel C Mn P S Si Cr Ni Mo N
S31600 <0.08 <2.0 <0.045 <0.03 <0.75 16.0–18.0 10.0–14.0 2.0–3.0 <0.1
S31254 <0.02 <1.0 <0.030 <0.01 <0.80 19.5–20.5 17.5–18.5 6.0–6.5 0.18–0.22
FIG. 1—Optical micrographs showing layer thickness with increasing nitriding temperature from 400 �Cto 500 �C. Samples of stainless steels UNS S31600 in (a) and (b) and UNS S31254 in (c) and (d). Etching:acqua regia.
2 JOURNAL OF ASTM INTERNATIONAL
Copyright by ASTM Int'l (all rights reserved); Fri Jan 27 07:06:43 EST 2012Downloaded/printed byUniv Estadual De Montes Claros pursuant to License Agreement. No further reproductions authorized.

registered in the range between 30 and 100 deg, swept with speed of 2 deg/min. Disks with 3.0 mm in
diameter were punched from a nitrided layer of UNS S31600 ASS treated at 450 �C for preparing of plan
view thin foil TEM samples, where the electron beam is normal to the nitrided surface. The nitrided layer
of punched disks was protected with transparent lacquer before substrate-side jet electropolishing. The
aim of the lacquer was to protect the treated surface of the sample from the electrolyte during electropo-
lishing that was performed on a Struers Tenupol device using 5 % perchloric acid/95 % acetic acid solution
at room temperature with 40 V/45 mA. The TEM observation was carried out in a Philips CM120 micro-
scope operated at 120 kV (k¼ 0.0335 A). Selected area electron diffraction patterns (SAED) have been an-
alyzed from digital images using a standard calibrated camera length (kL¼ 36.4 A mm) [15].
Results and Discussion
Optical Microscopy and Microhardness
Figure 1 presents the typical aspect of the nitrided layers in the UNS S31600 and UNS S31254 stainless
steels after treatments carried out at 400 �C and 500 �C during 5 h. It is possible to observe that austenitic
FIG. 2—XRD patterns of the substrate and of the samples nitrided at 400 �C �500 �C. (a) UNS S31600and (b) UNS S31254 stainless steel.
TOTTEN ETAL. ON MICROSTRUCTURE OF NITRIDED LAYERS 3
Copyright by ASTM Int'l (all rights reserved); Fri Jan 27 07:06:43 EST 2012Downloaded/printed byUniv Estadual De Montes Claros pursuant to License Agreement. No further reproductions authorized.

substrate is composed of grains with polygonal morphology, size close to 40 lm, and many of them show-
ing characteristic annealing twins. The thickness of the nitrided layers increased with the increment of the
treating temperature. At 400 �C it has just observed the presence of a thin and homogeneous white layer
(�4 lm) of expanded austenite in both steels, while in the samples nitrided at 500 �C heterogeneous layers
have been observed with thickness between 22 and 26 lm. The nitride formation began on the surface of
the samples nitrided at 450 �C, growing in direction to the substrate. The analyses made by optical micros-
copy have shown that the layers possess regular thickness and that there was no significant difference
among them in the investigated steels.
The microhardness measurements have indicated that nitrided layers are much harder than the sub-
strate and the hardness of nitrided layers in the UNS S31600 and UNS S31254 steels have ranged between
850 and 1400 HV0.025. This variation can be associated to the heterogeneity of these layers, because the
dispersion of the expanded austenite and nitrides was not uniform starting from 450 �C. The presence of
microcavities probably resulted from nitriding processing and the increase of the fragility in the nitrided
layers favored the microcracking formation, which can cause variations in the microhardness measure-
ments. The mean hardness of the substrate was 175 HV0.025 for UNS S31600 and 250 HV0.025 for UNS
S31254, respectively. This difference was attributed to the presence of larger amounts of alloying elements
(Cr, Ni, and Mo) in the superaustenitic stainless steel that are responsible by solid solution strengthening
of the metallic matrix.
XRD Analysis
The XRD patterns are presented in Fig. 2. They show that new phases were formed on the surface of the
nitrided steels at higher nitriding temperature. Considering the limited penetration of the x rays in the fer-
rous alloys due to absorption and the thickness of the nitrided layer, it is quite probable that all diffracted
intensity is just coming from these layers. The investigated steels have different amounts of substitutional
alloying elements such as chromium, nickel, and molybdenum (Table 1). The amount of nitrogen in the
S31254 SASS is larger than the existent in the S31600 ASS. In spite of this variation in the chemical com-
position, a significant change was not verified in the 2-theta positioning of the main reflections {111} and
{200} of the fcc crystalline lattice of nontreated austenite, as indicated in Fig. 2. That is due to the Bragg
diffraction angle being sensitive to the lattice parameter (i.e., the atomic position), while the intensity is
TABLE 2—Austenite-based XRD data (Cu Ka) extracted from literature, where are indicated the average (AVG) and standard deviation(SD) of 2h angle from (hkl) reflection, the full width at half maximum (FWHM), the width of the peak base (FW-base), the interplanarspacing d(hkl) of the lattice parameter (ai
o), and its relative lattice expansion (% exp), calculated from Eq 1.
(hkl)a 2h (deg) FWHM (deg) FW-Base (deg) d(hkl) (A) aio (A) % exp
(111)S AVG 41.1777 1.2860 3.0466 2.1913 3.7954 5.69
SD (46) 0.8259 0.5290 1.1415 0.0422 0.0732 2.04
(111) AVG 43.5745 0.9714 2.6713 2.0754 3.5947 0.10
SD (42) 0.3003 1.0275 3.1161 0.0136 0.0235 0.65
(200)S AVG 46.9166 1.4348 3.8821 1.9361 3.8722 7.83
SD (46) 1.1488 0.7608 2.4367 0.0446 0.0893 2.49
(200) AVG 50.6816 0.5641 1.3619 1.7998 3.5995 0.23
SD (33) 0.2774 0.2336 0.6686 0.0093 0.0186 0.52
(220)S AVG 70.2533 1.8348 4.4994 1.3399 3.7899 5.54
SD (13) 2.2531 0.6669 2.0417 0.0378 0.1069 2.98
(220) AVG 74.6885 0.7375 1.6826 1.2698 3.5916 0.01
SD (13) 0.1734 0.3206 0.7685 0.0025 0.0071 0.20
(311)S AVG 83.4144 2.1240 5.2925 1.1585 3.8422 6.99
SD (13) 2.2647 1.0719 2.1096 0.0245 0.0813 2.27
(222)S AVG 86.9261 2.4406 7.0076 1.1198 3.8792 8.02
SD (7) 0.6626 0.5344 1.2675 0.0068 0.0237 0.66
(311) AVG 90.6261 0.6864 1.6731 1.0834 3.5934 0.06
SD (10) 0.0961 0.2017 0.4709 0.0009 0.0030 0.08
(222) AVG 95.9937 0.6022 1.6849 1.0366 3.5908 �0.01
SD (4) 0.0683 0.1089 0.6446 0.0006 0.0019 0.05
aThe numbers between parentheses together with SD represent the number of results used for statistics.
4 JOURNAL OF ASTM INTERNATIONAL
Copyright by ASTM Int'l (all rights reserved); Fri Jan 27 07:06:43 EST 2012Downloaded/printed byUniv Estadual De Montes Claros pursuant to License Agreement. No further reproductions authorized.

affected by the atomic number of the atom in the lattice positions [5,8,11]. The intensity variation can be
explained due to random occupation of the lattice points by different alloying elements (substitutional and
interstitial) and the effect of texture, introduced by the plastic deformation of the rolled bars. The {220}
austenite peak in those steels was attenuated by the last reason.
The 2-theta position of several reflections observed in the XRD results showed in Fig. 2 does not
match with cards classified in the main diffraction databases, like JCPDS-ICDD (International Centre for
Diffraction Data) or ICSD (Inorganic Crystal Structure Database). The expanded austenite phase is ther-
modynamically metastable and has commonly been observed in nitrided layers. In Fig. 2 the letter “S”
identifies its (hkl) reflections. To help the identification of diffracted peaks of this phase Table 2 was
elaborated, based on an extensive bibliographical revision regarding data of expanded austenite obtained
by XRD (not completely cited here). Table 2 presents average values (AVG) of the 2-theta angle of reflec-
tion, the full width at half maximum (FWHM), the width of the peak base (FW-base), the interplanar spac-
ing d(hkl) calculated by Bragg’s law, the lattice parameter aio of the i phase, and the relative lattice
expansion (% exp) calculated for
% exp ¼ aio � ao
ao
� �� 100 (1)
FIG. 3—Lattice parameter from austenite (a) and expanded austenite (b) calculated from XRD pattern ofFig. 2. Here dispersion is being represented by standard deviation of the results collected from the litera-ture (see Table 2).
TOTTEN ETAL. ON MICROSTRUCTURE OF NITRIDED LAYERS 5
Copyright by ASTM Int'l (all rights reserved); Fri Jan 27 07:06:43 EST 2012Downloaded/printed byUniv Estadual De Montes Claros pursuant to License Agreement. No further reproductions authorized.

In Eq 1 ao is the lattice parameter of the austenite (35911 A) in #33-0397 JCPDS card. The term “SD” rep-
resents the standard deviation of data and the number inside parentheses indicates the amount of peaks col-
lected from the literature.
The experimental XRD results of calculated lattice parameter for both steels have showed good fitting
with those listed in Table 2, whose illustration is shown in Fig. 3. The lattice expansion has changed
depending on the (hkl) reflection. The results from “normal” austenite peaks do not overcome 1 % of re-
spective JCPDS card [Fig. 3(a)], but there are significant increasing (higher than 10 %) in the expanded
austenite lattice when the (200)S reflection is considered [Fig. 3(b)]. For (111)S peaks this enlargement
was smaller, varying from 4.7 to 6.5 %. The presence of the expanded austenite is characterized in the
XRD patterns by broadened peaks (higher FWHM) that are shifted for diffraction angles smaller those
observed for the normal austenite. Besides this, the displacement of diffracted peaks is anomalous because
the cubic lattice parameter calculated for the (200)S reflection is significantly larger than those obtained
for other reflections. This behavior is not still completely understood [9] but certainly is related to the
introduction of a massive amount of nitrogen in the austenite. The N concentration in expanded austenite
can reach nearly 40 at %, higher than its limit of solubility in the austenite (10.3 at %) [16]. The occupancy
of the octahedral positions in the fcc lattice increases as the concentration of nitrogen rises. The aniso-
tropic diffusion of the interstitial [4], the presence of chromium and molybdenum [17], and the probable
increase of stacking fault density, promoted by decreasing of its energy formation due to the presence of
nitrogen [13], generate elastic distortion in the crystal lattice of austenitic matrix, which is responsible by
diffracted peaks broadening observed in the XRD analysis of expanded austenite.
Nitriding temperature and chromium take important roles in controlling of nitrogen diffusion and sta-
bilization of expanded austenite. The effect of temperature on the lattice expansion is illustrated in Fig. 4,
which shows that distortion was higher after plasma nitriding of UNS S31600 ASS at 450 �C. The larger
amount of nitrogen in the UNS S31254 SASS has not probably contributed to increasing the lattice size.
In the same graph it is possible to verify the effect of anomalous lattice distortion with different (hkl)reflections. Lower lattice expansion determined at 400 �C and 500 �C can be associated, respectively, to
decrease of nitrogen diffusivity into the austenitic matrix and the formation of chromium (most probably)
or iron (less probably) nitrides, whose effects reduce nitrogen supersaturation. The random dispersion of
chromium atoms in the matrix, allied with the strong chemical affinity with nitrogen and low diffusion
rates, has enhanced the implantation of the interstitial in austenite where it acts as a “nitrogen trapping”
[6]. In lower nitriding temperatures, in spite of the supersaturation and its smaller standard free energy of
formation [18], it should not have intense chromium nitride nucleation. These nitrides are just formed in
higher temperatures and times of nitriding by thermodynamic and kinetics reasons [6], as can be observed
FIG. 4—Effect of temperature on the lattice expansion estimated from different reflections of expandedaustenite in UNS S31600 and UNS S31254 stainless steels.
6 JOURNAL OF ASTM INTERNATIONAL
Copyright by ASTM Int'l (all rights reserved); Fri Jan 27 07:06:43 EST 2012Downloaded/printed byUniv Estadual De Montes Claros pursuant to License Agreement. No further reproductions authorized.

from XRD pattern obtained after nitriding at 500 �C (Fig. 2). However, XRD analysis is not the most indi-
cated technique to investigate phases with very small volume fraction.
TEM Analysis
The observation of thin foils by TEM have verified the typical presence of dislocations and stacking faults
in the UNS S31600 steel substrate, as shown, respectively, by the micrographs from Fig. 5. All crystalline
defects increase the mobility of the nitrogen, favoring the insertion and the diffusion of the interstitial ele-
ment in the austenite [11]. The analysis of different regions by selected area electron diffraction (SAED)
have systematically showed well defined spot-type patterns, characteristic of reflections of fcc austenite
monocrystals with lattice parameters quite close to that determined for the substrate by XRD (�3.60 A).
The bright field TEM micrograph of Fig. 6 exhibits a plan view section on the nitrided surface where
three grains of expanded austenite and its respective SAED patterns are presented. The electron diffraction
analysis shows that each grain maintained the fcc structure with different zone axes. Calculations involv-
ing measurements from these patterns allow estimating an expansion of the lattice parameter up to 14.5 %,
as show Table 3. According to Christiansen and Somers [19], the maximum expansion obtained is 11.2 %,
but this difference can be associated with very small thickness (<100 nm) of the observation area in TEM
samples. Meletis and colleagues [20] reported that compressive nitriding-induced residual stresses are
FIG. 5—Thin foil BF TEM micrograph showing planar distribution of dislocations in (a). A bundle ofstacking faults revealed by selection of (111) reflection of UNS S31600 stainless steel is showed in (b).
TOTTEN ETAL. ON MICROSTRUCTURE OF NITRIDED LAYERS 7
Copyright by ASTM Int'l (all rights reserved); Fri Jan 27 07:06:43 EST 2012Downloaded/printed byUniv Estadual De Montes Claros pursuant to License Agreement. No further reproductions authorized.
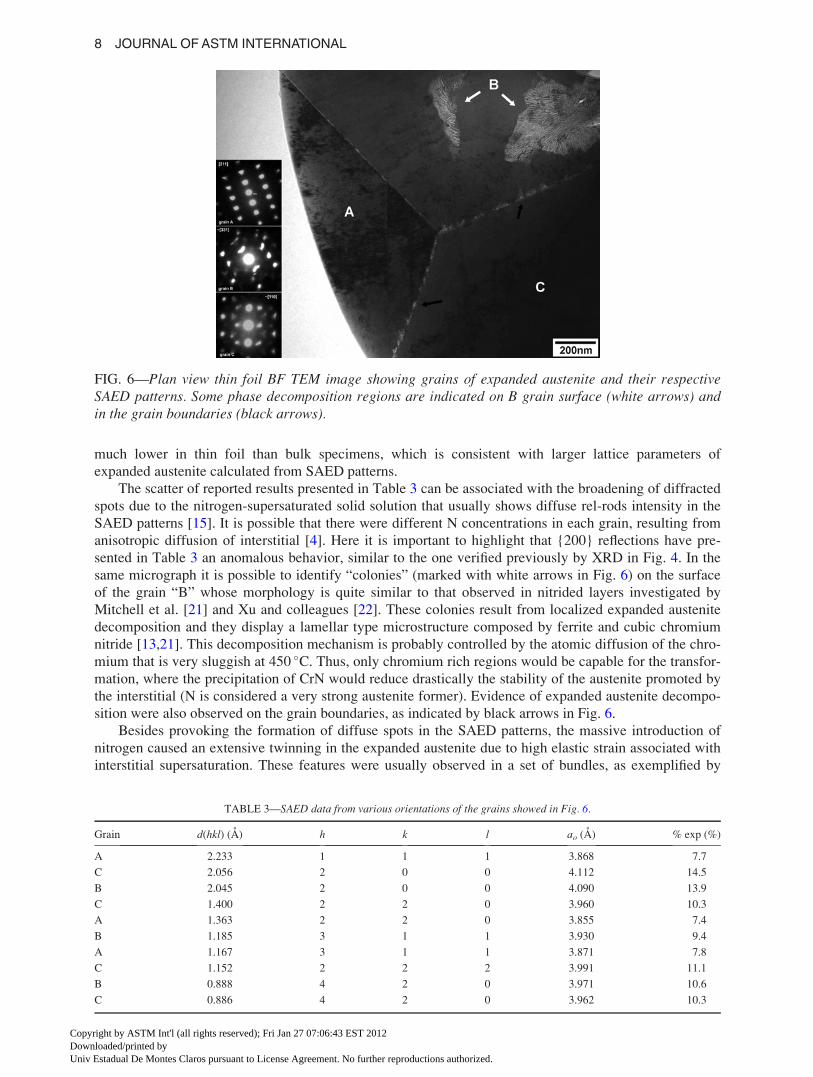
much lower in thin foil than bulk specimens, which is consistent with larger lattice parameters of
expanded austenite calculated from SAED patterns.
The scatter of reported results presented in Table 3 can be associated with the broadening of diffracted
spots due to the nitrogen-supersaturated solid solution that usually shows diffuse rel-rods intensity in the
SAED patterns [15]. It is possible that there were different N concentrations in each grain, resulting from
anisotropic diffusion of interstitial [4]. Here it is important to highlight that {200} reflections have pre-
sented in Table 3 an anomalous behavior, similar to the one verified previously by XRD in Fig. 4. In the
same micrograph it is possible to identify “colonies” (marked with white arrows in Fig. 6) on the surface
of the grain “B” whose morphology is quite similar to that observed in nitrided layers investigated by
Mitchell et al. [21] and Xu and colleagues [22]. These colonies result from localized expanded austenite
decomposition and they display a lamellar type microstructure composed by ferrite and cubic chromium
nitride [13,21]. This decomposition mechanism is probably controlled by the atomic diffusion of the chro-
mium that is very sluggish at 450 �C. Thus, only chromium rich regions would be capable for the transfor-
mation, where the precipitation of CrN would reduce drastically the stability of the austenite promoted by
the interstitial (N is considered a very strong austenite former). Evidence of expanded austenite decompo-
sition were also observed on the grain boundaries, as indicated by black arrows in Fig. 6.
Besides provoking the formation of diffuse spots in the SAED patterns, the massive introduction of
nitrogen caused an extensive twinning in the expanded austenite due to high elastic strain associated with
interstitial supersaturation. These features were usually observed in a set of bundles, as exemplified by
FIG. 6—Plan view thin foil BF TEM image showing grains of expanded austenite and their respectiveSAED patterns. Some phase decomposition regions are indicated on B grain surface (white arrows) andin the grain boundaries (black arrows).
TABLE 3—SAED data from various orientations of the grains showed in Fig. 6.
Grain d(hkl) (A) h k l ao (A) % exp (%)
A 2.233 1 1 1 3.868 7.7
C 2.056 2 0 0 4.112 14.5
B 2.045 2 0 0 4.090 13.9
C 1.400 2 2 0 3.960 10.3
A 1.363 2 2 0 3.855 7.4
B 1.185 3 1 1 3.930 9.4
A 1.167 3 1 1 3.871 7.8
C 1.152 2 2 2 3.991 11.1
B 0.888 4 2 0 3.971 10.6
C 0.886 4 2 0 3.962 10.3
8 JOURNAL OF ASTM INTERNATIONAL
Copyright by ASTM Int'l (all rights reserved); Fri Jan 27 07:06:43 EST 2012Downloaded/printed byUniv Estadual De Montes Claros pursuant to License Agreement. No further reproductions authorized.

dark field TEM micrograph of Fig. 7(a) where low contrast of stacking faults in A-A direction is due to
very closed diffracted beams selected by the objective aperture of TEM (see white arrow). In some regions
of the nitrided layer small rounded particles (10–15 nm) were found, as showed in Fig. 7(b). The ring-type
SAED pattern indicates that there is a larger number of diffracting particles and there is also a preferential
orientation (texture) relating substrate, not investigated here. Indexing diffracted rings have showed that
these particles possess a crystalline structure compatible with cubic chromium nitride (CrN), whose vol-
ume fraction is considerably smaller than the detection limit of the XRD technique.
XRD and TEM were applied in the characterization of expanded austenite in nitrided layers. Both
techniques were able to show that the austenite lattice does not expand uniformly, where expansion along
h100i is larger than that h111i. Explanations for that still needs further investigation.
Conclusions
• The variation of the nitriding temperature has caused changes in the thickness and on the micro-
structure of the nitrided layers on UNS S31600 and UNS S31254 steels.• The formation of expanded austenite in the nitrided layers from 400 �C to 500 �C was confirmed by
XRD analyses that show its “anomalous” lattice expansion up to 10 %, resulting from colossal
FIG. 7—Thin foil dark field micrographs showing two sets of stacking faults in (a) and 10–15 nm sizerounded nitride particles found after plasma nitriding of UNS S31600 stainless steel at 450 �C in (b). Theselected reflections for imaging are indicated in the respective SAED patterns.
TOTTEN ETAL. ON MICROSTRUCTURE OF NITRIDED LAYERS 9
Copyright by ASTM Int'l (all rights reserved); Fri Jan 27 07:06:43 EST 2012Downloaded/printed byUniv Estadual De Montes Claros pursuant to License Agreement. No further reproductions authorized.

nitrogen supersaturation. The maximum lattice expansion in both steels has been observed when
plasma nitriding temperature was 450 �C.• The observation of UNS S31600 nitrided samples by TEM have showed that cubic CrN forms at
450 �C, but it could not be identified by XRD analysis due to its small volume fraction. Chromium
nitride probably resulted from localized expanded austenite decomposition during nitriding
treatment.
Acknowledgments
The writers would like to thank Brazilian research agencies CNPq (L.C.C. and J.G.) and CAPES
(F.A.P.F.) for received grants.
References
[1] Bell, T., Mao, K., and Sun, Y., “Surface Engineering Design: Modelling Surface Engineering Sys-
tems for Improved Tribological Performance,” Surf. Coatings Technol., Vol. 108–109, 1998, pp.
360–368.
[2] Zhu, X., Huang, H., Xu, K., and He, J., “Structure and Properties of Plasma Nitrided Austenitic
Stainless Steel,” 20th ASM Heat Treating Soc. Conf. Proc., Vol. 1–2, 2000, pp. 217–221.
[3] Menthe, E., Rie, K.-T., Schultze, J. W., and Simson, S., “Structure and Properties of Plasma Nitrided
Stainless Steel,” Surf. Coatings Technol., Vol. 74–75, 1995, pp. 412–416.
[4] Riviere, J. P., Templier, C., Declemy, A., Redjdal, O., Chumlyakov, Y., and Abrasonis, G.,
“Microstructure of Expanded Austenite in Ion-Nitrided AISI 316L Single Crystals,” Surf. CoatingsTechnol., Vol. 201, 2007, pp. 8210–8214.
[5] Christiansen, T. and Somers, M. A. J., “On the Crystallographic Structure of S-Phase,” Scr. Mater.,Vol. 50, 2004, pp. 35–37.
[6] Williamson, D. L., Ozturk, O., Wei, R., and Wilbur, P. J., “Metastable Phase Formation and
Enhanced Diffusion in f.c.c. Alloys Under High Dose, High Flux Nitrogen Implantation at High and
Low Ion Energies,” Surf. Coatings Technol.,Vol. 65, 1994, pp. 15–23.
[7] Sozinov, A. L., Balanyuk, A. G., and Gavriljuk, V. G., “N–N Interaction and Nitrogen Activity in the
Iron Base Austenite,” Acta Mater., Vol. 47, 1999, pp. 927–935.
[8] Christiansen, T. L., Hummelshøj, T. S., and Somers, M. A. J., “Expanded Austenite, Crystallography
and Residual Stress,” Surf. Eng., Vol. 26, 2010, pp. 242–247.
[9] Dong, H., “S-Phase Surface Engineering of Fe–Cr, Co–Cr and Ni–Cr Alloys,” Int. Mater. Rev., Vol.
55, 2010, pp. 65–98.
[10] Buhagiar, J., Li, X., and Dong, H., “Formation and Microstructural Characterisation of S-Phase
Layers in Ni-Free Austenitic Stainless Steels by Low-Temperature Plasma Surface Alloying,” Surf.Coatings Technol., Vol. 204, 2009, pp. 330–335.
[11] Manova, D., Eichentopf, I.-M., Hirsch, D., Mandl, S. Neumann, H., and Rauschenbach, B.,
“Influence of Microstructure on Nitriding Properties of Stainless Steel,” IEEE Trans. Plasma Sci.,Vol. 34, No. 4, 2006, pp. 1136–1140.
[12] Li, X.Y., “Low Temperature Plasma Nitriding of 316 Stainless Steel-Nature of “S” Phase and Its
Thermal Stability,” Surf. Eng., Vol. 17, No. 2, 2001, pp. 147–152.
[13] Xu, X. L., Wang, L., Yu, Z.W., and Hei, Z. K., “Microstructural Characterization of Plasma Nitrided
Austenitic Stainless Steel,” Surf. Coatings Technol., Vol. 132, 2000, pp. 270–274.
[14] Fernandes, F. A. P., Heck, S. C., Pereira, R. G., Picon, C. A., Nascente, P. A. P., and Casteletti, L. C.,
“Ion Nitriding of a Superaustenitic Stainless Steel: Wear and Corrosion Characterization,” Surf.Coatings Technol., Vol. 204, 2010, pp. 3087–3090.
[15] Williams, D. B. and Barry Carter, C., Transmission Electron Microscopy: A Textbook for MaterialsScience, Springer Science and Business Media, New York, 2009, 760 pp.
[16] Raghavan, V., “The Cr-Fe-N-Ni System,” J. Phase Equilibria, Vol. 18, No. 2, 1997, pp. 158–172.
[17] Li, X., Samandi, M., Dunne, D., and Hutchings, R., “Evolution of the Microstructure of Austenitic
Stainless Steel Nitrogen Implanted at Elevated Temperatures,” Surf. Coatings Technol., Vol. 71,
1995, pp. 175–181.
10 JOURNAL OF ASTM INTERNATIONAL
Copyright by ASTM Int'l (all rights reserved); Fri Jan 27 07:06:43 EST 2012Downloaded/printed byUniv Estadual De Montes Claros pursuant to License Agreement. No further reproductions authorized.
[18] He, Y., Li, Z., Qi, H., and Gao, W., “Standard Free Energy Change of Formation Per Unit Volume:
A New Parameter for Evaluating Nucleation and Growth of Oxides, Sulphides, Carbides and
Nitrides,” Mater. Res. Innovation, Vol. 1, 1997, pp. 157–160.
[19] Christiansen, T. L. and Somers, M. A. J., “Controlled Dissolution of Colossal Quantities of Nitrogen
in Stainless Steel,” Metallurg. Mater. Trans. A, Vol. 37A, 2006, pp. 675–682.
[20] Meletis, E. I., Singh, V., and Jiang, J. C., “On the Single Phase Formed During Low-Temperature
Plasma Nitriding of Austenitic Stainless Steels,” J. Mater. Sci. Lett., Vol. 21, 2002, pp. 1171–1174.
[21] Mitchell, D. R. G., Attard, D. J., Collins, G. A., and Short, K. T., “Characterisation of PI3 and RF
Plasma Nitrided Austenitic Stainless Steels Using Plan and Cross-Sectional TEM Techniques,” Surf.Coatings Technol., Vol. 165, 2003, pp. 107–118.
[22] Xu, X., Wang, L., Yu, Z., Qiang, J., and Hei, Z., “Study of Microstructure of Low-Temperature
Plasma-Nitrided AISI 304 Stainless Steel,” Metallurg. Mater. Trans. A, Vol. 31A, 2000, pp.
1193–1199.
TOTTEN ETAL. ON MICROSTRUCTURE OF NITRIDED LAYERS 11
Copyright by ASTM Int'l (all rights reserved); Fri Jan 27 07:06:43 EST 2012Downloaded/printed byUniv Estadual De Montes Claros pursuant to License Agreement. No further reproductions authorized.