Microstructural Control of Additively Manufactured ... · microstructure, additive manufacturing,...
31
Microstructural Control of Additively Manufactured Metallic Materials P.C. Collins, 1, 2, ∗ D.A. Brice, 1 P. Samimi, 1 I. Ghamarian, 1 and H.L. Fraser 3 1 Department of Materials Science and Engineering, Iowa State University, Ames, Iowa 50011; email: [email protected] 2 Ames Laboratory, Iowa State University, Ames, Iowa 50011 3 Department of Materials Science and Engineering, The Ohio State University, Columbus, Ohio 43210 Annu. Rev. Mater. Res. 2016. 46:63–91 First published online as a Review in Advance on May 11, 2016 The Annual Review of Materials Research is online at matsci.annualreviews.org This article’s doi: 10.1146/annurev-matsci-070115-031816 Copyright c 2016 by Annual Reviews. All rights reserved ∗ Corresponding author Keywords microstructure, additive manufacturing, microstructural evolution, microstructural control, composition, characterization Abstract In additively manufactured (AM) metallic materials, the fundamental interre- lationships that exist between composition, processing, and microstructure govern these materials’ properties and potential improvements or reduc- tions in performance. For example, by using AM, it is possible to achieve highly desirable microstructural features (e.g., highly refined precipitates) that could not otherwise be achieved by using conventional approaches. Simultaneously, opportunities exist to manage macro-level microstructural characteristics such as residual stress, porosity, and texture, the last of which might be desirable. To predictably realize optimal microstructures, it is nec- essary to establish a framework that integrates processing variables, alloy composition, and the resulting microstructure. Although such a framework is largely lacking for AM metallic materials, the basic scientific components of the framework exist in literature. This review considers these key compo- nents and presents them in a manner that highlights key interdependencies that would form an integrated framework to engineer microstructures using AM. 63 Click here to view this article's online features: • Download figures as PPT slides • Navigate linked references • Download citations • Explore related articles • Search keywords ANNUAL REVIEWS Further Annu. Rev. Mater. Res. 2016.46:63-91. Downloaded from www.annualreviews.org Access provided by Colorado School of Mines on 02/06/17. For personal use only.
Transcript of Microstructural Control of Additively Manufactured ... · microstructure, additive manufacturing,...
MR46CH04-Collins ARI 4 June 2016 12:5
Microstructural Control ofAdditively ManufacturedMetallic MaterialsP.C. Collins,1,2,∗ D.A. Brice,1 P. Samimi,1
I. Ghamarian,1 and H.L. Fraser3
1Department of Materials Science and Engineering, Iowa State University, Ames, Iowa 50011;email: [email protected] Laboratory, Iowa State University, Ames, Iowa 500113Department of Materials Science and Engineering, The Ohio State University, Columbus,Ohio 43210
Annu. Rev. Mater. Res. 2016. 46:63–91
First published online as a Review in Advance onMay 11, 2016
The Annual Review of Materials Research is online atmatsci.annualreviews.org
This article’s doi:10.1146/annurev-matsci-070115-031816
Copyright c© 2016 by Annual Reviews.All rights reserved
∗Corresponding author
Keywords
microstructure, additive manufacturing, microstructural evolution,microstructural control, composition, characterization
Abstract
In additively manufactured (AM) metallic materials, the fundamental interre-lationships that exist between composition, processing, and microstructuregovern these materials’ properties and potential improvements or reduc-tions in performance. For example, by using AM, it is possible to achievehighly desirable microstructural features (e.g., highly refined precipitates)that could not otherwise be achieved by using conventional approaches.Simultaneously, opportunities exist to manage macro-level microstructuralcharacteristics such as residual stress, porosity, and texture, the last of whichmight be desirable. To predictably realize optimal microstructures, it is nec-essary to establish a framework that integrates processing variables, alloycomposition, and the resulting microstructure. Although such a frameworkis largely lacking for AM metallic materials, the basic scientific componentsof the framework exist in literature. This review considers these key compo-nents and presents them in a manner that highlights key interdependenciesthat would form an integrated framework to engineer microstructures usingAM.
63
Click here to view this article'sonline features:
• Download figures as PPT slides• Navigate linked references• Download citations• Explore related articles• Search keywords
ANNUAL REVIEWS Further
Ann
u. R
ev. M
ater
. Res
. 201
6.46
:63-
91. D
ownl
oade
d fr
om w
ww
.ann
ualr
evie
ws.
org
Acc
ess
prov
ided
by
Col
orad
o Sc
hool
of
Min
es o
n 02
/06/
17. F
or p
erso
nal u
se o
nly.
MR46CH04-Collins ARI 4 June 2016 12:5
1. INTRODUCTION
The microstructures that are produced by additive manufacturing (AM) are complex, often varyingspatially within a build. The complex thermal histories that are associated with AM processesstrongly influence the microstructure, as each discrete volume of a component deposited by an AMtechnique may have a thermal history that differs significantly relative to the adjacent volume (e.g.,near edges). Furthermore, the breadth of AM processes results in profoundly different thermalhistories and thus profoundly different microstructures. To understand the significant variationthat can occur, and the differences relative to conventionally processed materials, it is necessaryto understand how microstructure evolves in AM materials.
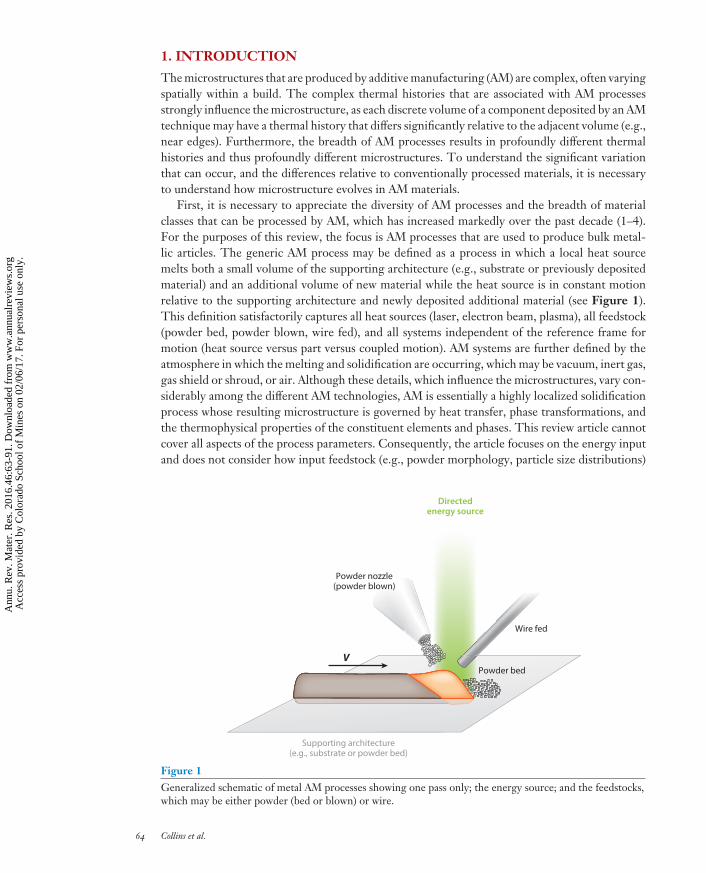
First, it is necessary to appreciate the diversity of AM processes and the breadth of materialclasses that can be processed by AM, which has increased markedly over the past decade (1–4).For the purposes of this review, the focus is AM processes that are used to produce bulk metal-lic articles. The generic AM process may be defined as a process in which a local heat sourcemelts both a small volume of the supporting architecture (e.g., substrate or previously depositedmaterial) and an additional volume of new material while the heat source is in constant motionrelative to the supporting architecture and newly deposited additional material (see Figure 1).This definition satisfactorily captures all heat sources (laser, electron beam, plasma), all feedstock(powder bed, powder blown, wire fed), and all systems independent of the reference frame formotion (heat source versus part versus coupled motion). AM systems are further defined by theatmosphere in which the melting and solidification are occurring, which may be vacuum, inert gas,gas shield or shroud, or air. Although these details, which influence the microstructures, vary con-siderably among the different AM technologies, AM is essentially a highly localized solidificationprocess whose resulting microstructure is governed by heat transfer, phase transformations, andthe thermophysical properties of the constituent elements and phases. This review article cannotcover all aspects of the process parameters. Consequently, the article focuses on the energy inputand does not consider how input feedstock (e.g., powder morphology, particle size distributions)
V
Directedenergy source
Powder nozzle(powder blown)
Powder bed
Wire fed
Supporting architecture(e.g., substrate or powder bed)
Figure 1Generalized schematic of metal AM processes showing one pass only; the energy source; and the feedstocks,which may be either powder (bed or blown) or wire.
64 Collins et al.
Ann
u. R
ev. M
ater
. Res
. 201
6.46
:63-
91. D
ownl
oade
d fr
om w
ww
.ann
ualr
evie
ws.
org
Acc
ess
prov
ided
by
Col
orad
o Sc
hool
of
Min
es o
n 02
/06/
17. F
or p
erso
nal u
se o
nly.
MR46CH04-Collins ARI 4 June 2016 12:5
INFLUENCE OF METAL POWDER CHARACTERISTICS ON MICROSTRUCTURESIN ADDITIVELY MANUFACTURED COMPONENTS
Generally, the simulation of microstructural evolution assumes an input energy sufficient to melt all incomingmaterial. As described in Section 2.1, the required input energy is a function of various thermophysical properties,including the enthalpy of fusion. For powder-based approaches, this required energy represents a minimum energyand does not include any variation in the spatial and temporal addition of the incoming powder or its size distribution,morphology, or surface characteristics. For powder-blown approaches, recent efforts have focused on the attenuationof the incident power as a function of the spatial distribution of the powder (126, 127), but much work remains to bedone to predict the powder interactions in the liquid pool, especially when the local degree of superheat is low (e.g.,near the moving solid/liquid interface) near the splash zone. In powder bed approaches, the powder size distribution,morphology, and surface characteristics influence the power absorption in a spatial manner. Although there existefforts to predict the evolution of material in both powder bed and powder-blown approaches, the influence ofpowder characteristics remains an underexplored aspect of the simulations. Much effort is needed to characterizethe powder and to incorporate precise measurements into simulations.
influences the process or resulting microstructure. For additional details regarding the currentlevel of understanding of the interrelationship between powder attributes, process parameters, andthe resulting microstructure, please see the sidebar entitled “Influence of Metal Powder Charac-teristics on Microstructures in Additively Manufactured Components.”
There are commendable efforts under way to model and predict the heat transfer associatedwith AM, which is a dynamic and coupled problem characterized by a spatially and temporallyvarying heat source and part geometry (5–9). In addition, there are modeling efforts under way tounderstand and capture the physics operating in the molten pool (10–12). Such modeling effortsare referenced where illustrative and informative. However, this review article primarily frames thereferenced research on the basis of understanding gained in the areas of (a) melting, solidification,and the attending phenomena; (b) the thermodynamics of the process and reactions, includingboth L → S and S → S′ phase transformations; and (c) the effect that composition and processinghave on the attending microstructure.
Given the hierarchical nature of microstructure of most structural and functional metallicmaterials, this article is organized according to the characteristic length scales and includesmacro-level features that are morphological [microstructural (in)homogeneities], micromechan-ical (residual stress), and crystallographic (texture); micro-level features such as details of grains(size, morphology) and phases (scale, distribution, volume fraction, morphology); and compo-sitional features such as chemical partitioning, volatilization, and interstitial gettering. Wherepossible, the advances in modeling are presented. In addition, a framework to illustrate the variouscomposition, microstructure, and property linkages is presented. Finally, it is important to directlydescribe the opportunities and limitations for AM materials as they relate to microstructure.
2. MACRO-LEVEL MICROSTRUCTURAL FEATURES
2.1. Material and Microstructural Discontinuities
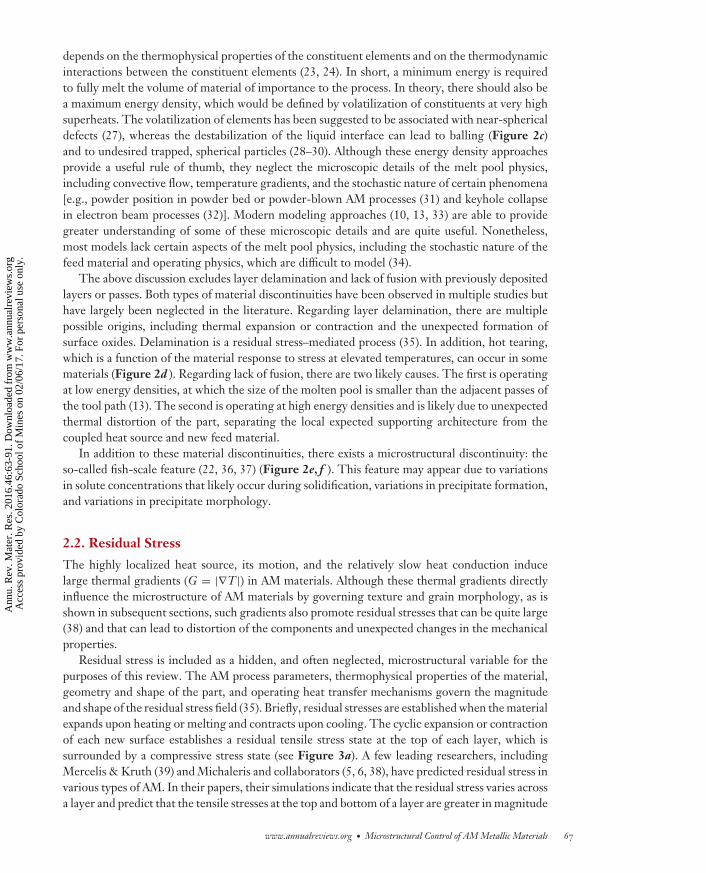
As Figure 2 illustrates, for AM materials, the material discontinuities include porosity, unmeltedor partially melted particles (Figure 2a), delamination between adjacent passes or previous layers,
www.annualreviews.org • Microstructural Control of AM Metallic Materials 65
Ann
u. R
ev. M
ater
. Res
. 201
6.46
:63-
91. D
ownl
oade
d fr
om w
ww
.ann
ualr
evie
ws.
org
Acc
ess
prov
ided
by
Col
orad
o Sc
hool
of
Min
es o
n 02
/06/
17. F
or p
erso
nal u
se o
nly.
MR46CH04-Collins ARI 4 June 2016 12:5
ca
Examples of insufficient energy(porosity and lack of fusion)
b d
Examples of excess energy(balling and hot tears)
Balling effectsBalling effects
Examples of fish scaling
Hot tear
e
f
140 μm
100 μm 200 μm 20 μm
100 μm200 μm
0.94 ρ6 mA100 mm/s
0.94 ρ6 mA100 mm/s
ρ = 4.43 g/cm3
6 mA400 mm/s
ρ = 4.43 g/cm3
6 mA400 mm/s
0.79 ρ6 mA1,000 mm/s
0.79 ρ6 mA1,000 mm/s
0.64 ρ1 mA400 mm/s
0.64 ρ1 mA400 mm/s
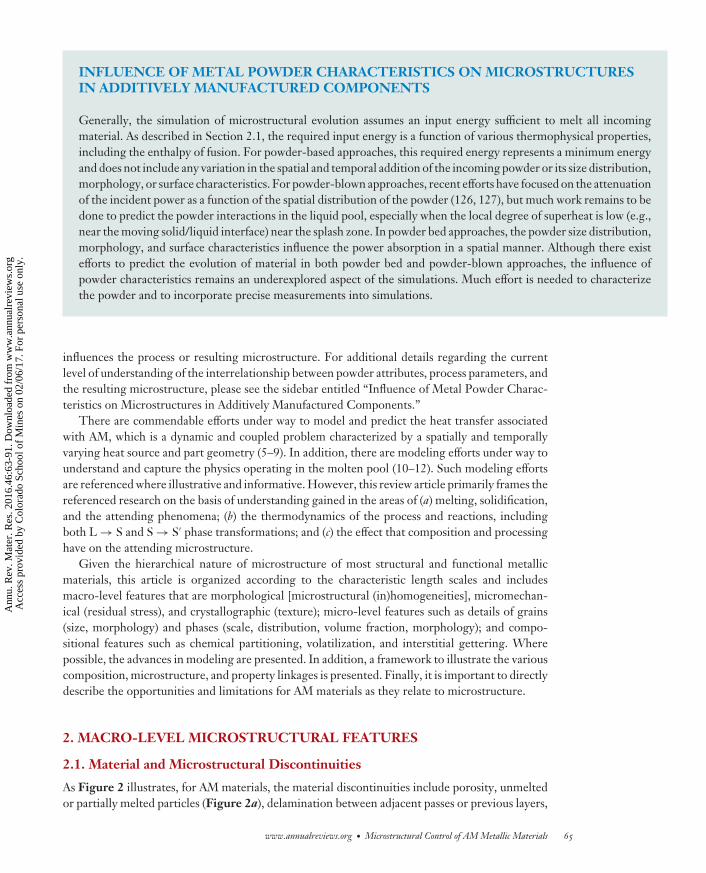
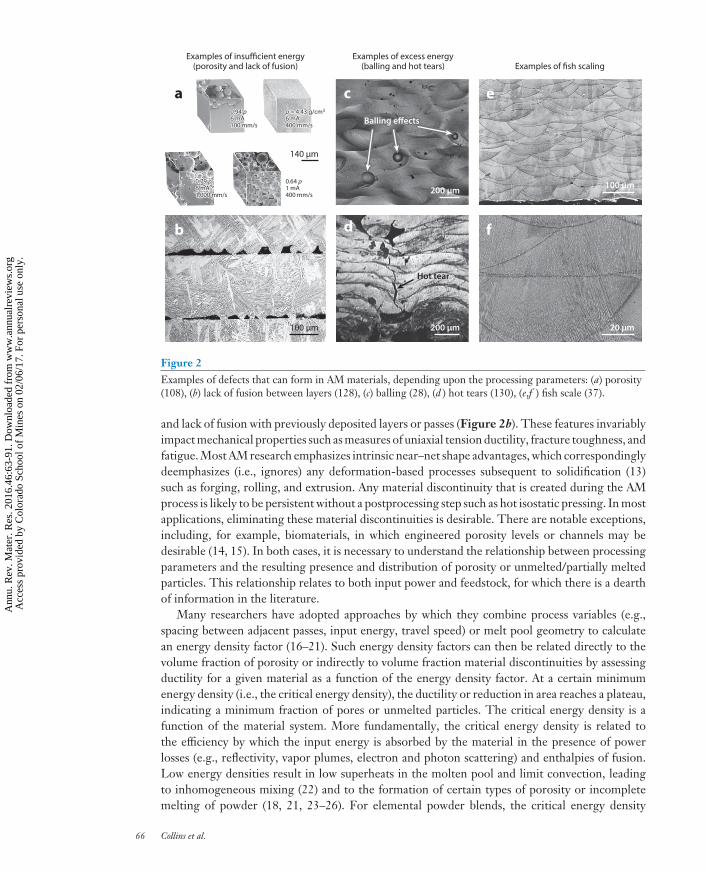
Figure 2Examples of defects that can form in AM materials, depending upon the processing parameters: (a) porosity(108), (b) lack of fusion between layers (128), (c) balling (28), (d ) hot tears (130), (e,f ) fish scale (37).
and lack of fusion with previously deposited layers or passes (Figure 2b). These features invariablyimpact mechanical properties such as measures of uniaxial tension ductility, fracture toughness, andfatigue. Most AM research emphasizes intrinsic near–net shape advantages, which correspondinglydeemphasizes (i.e., ignores) any deformation-based processes subsequent to solidification (13)such as forging, rolling, and extrusion. Any material discontinuity that is created during the AMprocess is likely to be persistent without a postprocessing step such as hot isostatic pressing. In mostapplications, eliminating these material discontinuities is desirable. There are notable exceptions,including, for example, biomaterials, in which engineered porosity levels or channels may bedesirable (14, 15). In both cases, it is necessary to understand the relationship between processingparameters and the resulting presence and distribution of porosity or unmelted/partially meltedparticles. This relationship relates to both input power and feedstock, for which there is a dearthof information in the literature.
Many researchers have adopted approaches by which they combine process variables (e.g.,spacing between adjacent passes, input energy, travel speed) or melt pool geometry to calculatean energy density factor (16–21). Such energy density factors can then be related directly to thevolume fraction of porosity or indirectly to volume fraction material discontinuities by assessingductility for a given material as a function of the energy density factor. At a certain minimumenergy density (i.e., the critical energy density), the ductility or reduction in area reaches a plateau,indicating a minimum fraction of pores or unmelted particles. The critical energy density is afunction of the material system. More fundamentally, the critical energy density is related tothe efficiency by which the input energy is absorbed by the material in the presence of powerlosses (e.g., reflectivity, vapor plumes, electron and photon scattering) and enthalpies of fusion.Low energy densities result in low superheats in the molten pool and limit convection, leadingto inhomogeneous mixing (22) and to the formation of certain types of porosity or incompletemelting of powder (18, 21, 23–26). For elemental powder blends, the critical energy density
66 Collins et al.
Ann
u. R
ev. M
ater
. Res
. 201
6.46
:63-
91. D
ownl
oade
d fr
om w
ww
.ann
ualr
evie
ws.
org
Acc
ess
prov
ided
by
Col
orad
o Sc
hool
of
Min
es o
n 02
/06/
17. F
or p
erso
nal u
se o
nly.
MR46CH04-Collins ARI 4 June 2016 12:5
depends on the thermophysical properties of the constituent elements and on the thermodynamicinteractions between the constituent elements (23, 24). In short, a minimum energy is requiredto fully melt the volume of material of importance to the process. In theory, there should also bea maximum energy density, which would be defined by volatilization of constituents at very highsuperheats. The volatilization of elements has been suggested to be associated with near-sphericaldefects (27), whereas the destabilization of the liquid interface can lead to balling (Figure 2c)and to undesired trapped, spherical particles (28–30). Although these energy density approachesprovide a useful rule of thumb, they neglect the microscopic details of the melt pool physics,including convective flow, temperature gradients, and the stochastic nature of certain phenomena[e.g., powder position in powder bed or powder-blown AM processes (31) and keyhole collapsein electron beam processes (32)]. Modern modeling approaches (10, 13, 33) are able to providegreater understanding of some of these microscopic details and are quite useful. Nonetheless,most models lack certain aspects of the melt pool physics, including the stochastic nature of thefeed material and operating physics, which are difficult to model (34).
The above discussion excludes layer delamination and lack of fusion with previously depositedlayers or passes. Both types of material discontinuities have been observed in multiple studies buthave largely been neglected in the literature. Regarding layer delamination, there are multiplepossible origins, including thermal expansion or contraction and the unexpected formation ofsurface oxides. Delamination is a residual stress–mediated process (35). In addition, hot tearing,which is a function of the material response to stress at elevated temperatures, can occur in somematerials (Figure 2d ). Regarding lack of fusion, there are two likely causes. The first is operatingat low energy densities, at which the size of the molten pool is smaller than the adjacent passes ofthe tool path (13). The second is operating at high energy densities and is likely due to unexpectedthermal distortion of the part, separating the local expected supporting architecture from thecoupled heat source and new feed material.
In addition to these material discontinuities, there exists a microstructural discontinuity: theso-called fish-scale feature (22, 36, 37) (Figure 2e, f ). This feature may appear due to variationsin solute concentrations that likely occur during solidification, variations in precipitate formation,and variations in precipitate morphology.
2.2. Residual Stress
The highly localized heat source, its motion, and the relatively slow heat conduction inducelarge thermal gradients (G = |∇T |) in AM materials. Although these thermal gradients directlyinfluence the microstructure of AM materials by governing texture and grain morphology, as isshown in subsequent sections, such gradients also promote residual stresses that can be quite large(38) and that can lead to distortion of the components and unexpected changes in the mechanicalproperties.
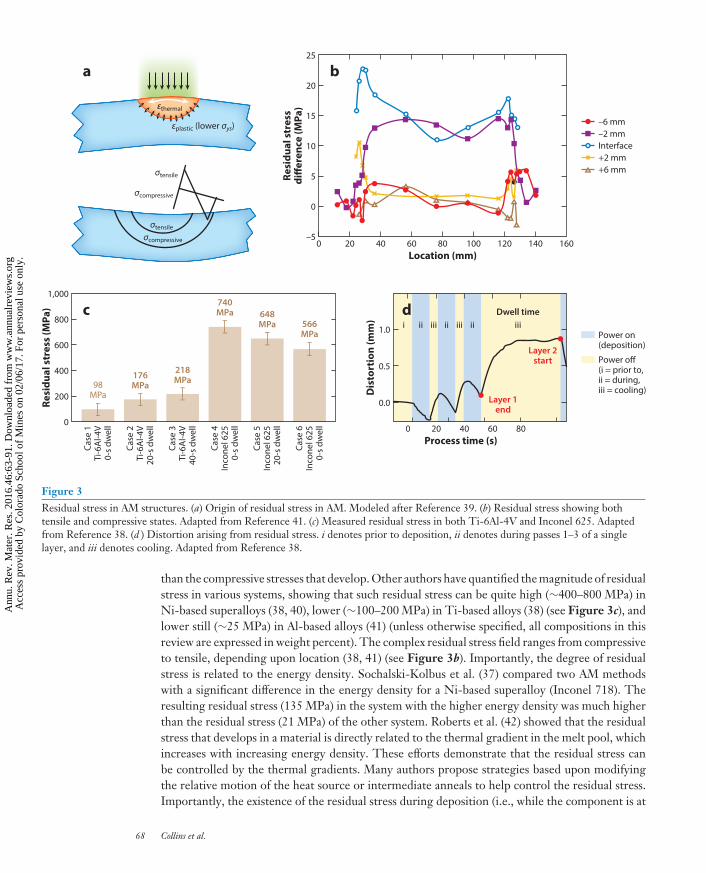
Residual stress is included as a hidden, and often neglected, microstructural variable for thepurposes of this review. The AM process parameters, thermophysical properties of the material,geometry and shape of the part, and operating heat transfer mechanisms govern the magnitudeand shape of the residual stress field (35). Briefly, residual stresses are established when the materialexpands upon heating or melting and contracts upon cooling. The cyclic expansion or contractionof each new surface establishes a residual tensile stress state at the top of each layer, which issurrounded by a compressive stress state (see Figure 3a). A few leading researchers, includingMercelis & Kruth (39) and Michaleris and collaborators (5, 6, 38), have predicted residual stress invarious types of AM. In their papers, their simulations indicate that the residual stress varies acrossa layer and predict that the tensile stresses at the top and bottom of a layer are greater in magnitude
www.annualreviews.org • Microstructural Control of AM Metallic Materials 67
Ann
u. R
ev. M
ater
. Res
. 201
6.46
:63-
91. D
ownl
oade
d fr
om w
ww
.ann
ualr
evie
ws.
org
Acc
ess
prov
ided
by
Col
orad
o Sc
hool
of
Min
es o
n 02
/06/
17. F
or p
erso
nal u
se o
nly.
MR46CH04-Collins ARI 4 June 2016 12:5
εthermal
εplastic (lower σys)
σtensile
σtensile
σcompressive
σcompressive 0–5
0
5
10
15
20
25
20 40 60 80Location (mm)
806040200Process time (s)
Resi
dual
str
ess
diff
eren
ce (M
Pa)
600
800
1,000
400
200
0
Resi
dual
str
ess
(MPa
)
100 120 140 160
–6 mm–2 mmInterface+2 mm+6 mm
Power on(deposition)
Power off(i = prior to,ii = during,iii = cooling)98
MPa
176MPa
218MPa
740MPa 648
MPa 566MPa
Case
1Ti
-6A
l-4V
0-s
dwel
l
Case
2Ti
-6A
l-4V
20-s
dw
ell
Case
3Ti
-6A
l-4V
40-s
dw
ell
Case
4In
cone
l 625
0-s
dwel
l
Case
5In
cone
l 625
20-s
dw
ell
Case
6In
cone
l 625
0-s
dwel
l1.0
0.5D
isto
rtio
n (m
m)
0.0
a b
c diii iii ii iii ii iii
Dwell time
Layer 2start
Layer 1end
Figure 3Residual stress in AM structures. (a) Origin of residual stress in AM. Modeled after Reference 39. (b) Residual stress showing bothtensile and compressive states. Adapted from Reference 41. (c) Measured residual stress in both Ti-6Al-4V and Inconel 625. Adaptedfrom Reference 38. (d ) Distortion arising from residual stress. i denotes prior to deposition, ii denotes during passes 1–3 of a singlelayer, and iii denotes cooling. Adapted from Reference 38.
than the compressive stresses that develop. Other authors have quantified the magnitude of residualstress in various systems, showing that such residual stress can be quite high (∼400–800 MPa) inNi-based superalloys (38, 40), lower (∼100–200 MPa) in Ti-based alloys (38) (see Figure 3c), andlower still (∼25 MPa) in Al-based alloys (41) (unless otherwise specified, all compositions in thisreview are expressed in weight percent). The complex residual stress field ranges from compressiveto tensile, depending upon location (38, 41) (see Figure 3b). Importantly, the degree of residualstress is related to the energy density. Sochalski-Kolbus et al. (37) compared two AM methodswith a significant difference in the energy density for a Ni-based superalloy (Inconel 718). Theresulting residual stress (135 MPa) in the system with the higher energy density was much higherthan the residual stress (21 MPa) of the other system. Roberts et al. (42) showed that the residualstress that develops in a material is directly related to the thermal gradient in the melt pool, whichincreases with increasing energy density. These efforts demonstrate that the residual stress canbe controlled by the thermal gradients. Many authors propose strategies based upon modifyingthe relative motion of the heat source or intermediate anneals to help control the residual stress.Importantly, the existence of the residual stress during deposition (i.e., while the component is at
68 Collins et al.
Ann
u. R
ev. M
ater
. Res
. 201
6.46
:63-
91. D
ownl
oade
d fr
om w
ww
.ann
ualr
evie
ws.
org
Acc
ess
prov
ided
by
Col
orad
o Sc
hool
of
Min
es o
n 02
/06/
17. F
or p
erso
nal u
se o
nly.
MR46CH04-Collins ARI 4 June 2016 12:5
a significant fraction of its melting point) can result in distortion (see Figure 3d ), microcracking,or hot tearing, especially in Ni- and Fe-based alloys (35), leading to another type of material ormicrostructural discontinuity.
Most of the ongoing research efforts to understand and predict residual stresses in AM mater-ials focus primarily on large, macro-level residual stresses [i.e., type I residual stresses (43, 44)].However, the subsequent phase transformations result in additional (type II) residual stresses thatmay need to be considered in the future.
2.3. Texture
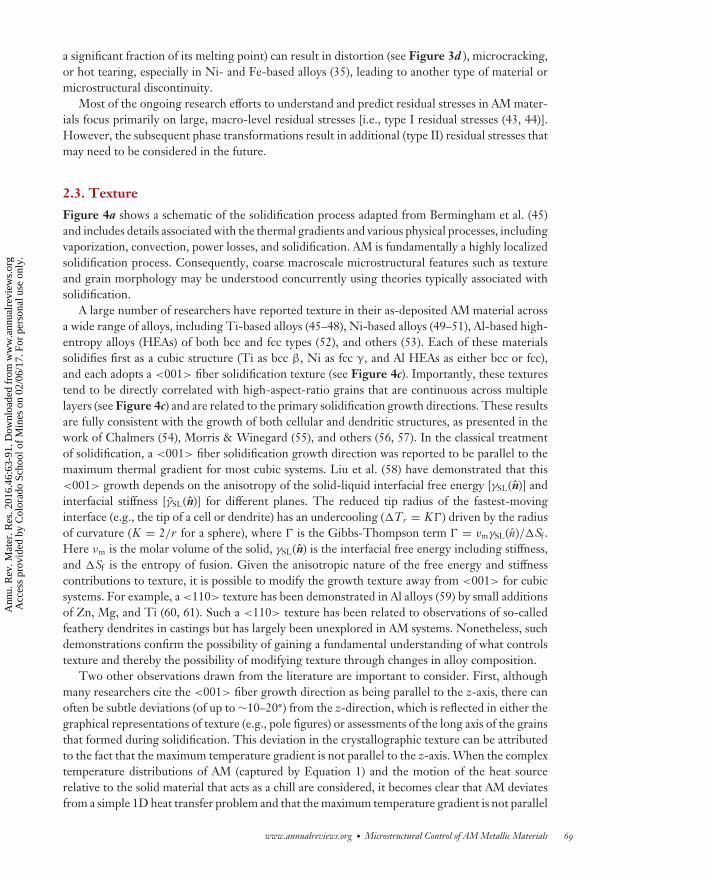
Figure 4a shows a schematic of the solidification process adapted from Bermingham et al. (45)and includes details associated with the thermal gradients and various physical processes, includingvaporization, convection, power losses, and solidification. AM is fundamentally a highly localizedsolidification process. Consequently, coarse macroscale microstructural features such as textureand grain morphology may be understood concurrently using theories typically associated withsolidification.
A large number of researchers have reported texture in their as-deposited AM material acrossa wide range of alloys, including Ti-based alloys (45–48), Ni-based alloys (49–51), Al-based high-entropy alloys (HEAs) of both bcc and fcc types (52), and others (53). Each of these materialssolidifies first as a cubic structure (Ti as bcc β, Ni as fcc γ, and Al HEAs as either bcc or fcc),and each adopts a <001> fiber solidification texture (see Figure 4c). Importantly, these texturestend to be directly correlated with high-aspect-ratio grains that are continuous across multiplelayers (see Figure 4c) and are related to the primary solidification growth directions. These resultsare fully consistent with the growth of both cellular and dendritic structures, as presented in thework of Chalmers (54), Morris & Winegard (55), and others (56, 57). In the classical treatmentof solidification, a <001> fiber solidification growth direction was reported to be parallel to themaximum thermal gradient for most cubic systems. Liu et al. (58) have demonstrated that this<001> growth depends on the anisotropy of the solid-liquid interfacial free energy [γSL(n)] andinterfacial stiffness [γSL(n)] for different planes. The reduced tip radius of the fastest-movinginterface (e.g., the tip of a cell or dendrite) has an undercooling (�Tr = K�) driven by the radiusof curvature (K = 2/r for a sphere), where � is the Gibbs-Thompson term � = vmγSL(n)/�Sf .Here νm is the molar volume of the solid, γSL(n) is the interfacial free energy including stiffness,and �Sf is the entropy of fusion. Given the anisotropic nature of the free energy and stiffnesscontributions to texture, it is possible to modify the growth texture away from <001> for cubicsystems. For example, a <110> texture has been demonstrated in Al alloys (59) by small additionsof Zn, Mg, and Ti (60, 61). Such a <110> texture has been related to observations of so-calledfeathery dendrites in castings but has largely been unexplored in AM systems. Nonetheless, suchdemonstrations confirm the possibility of gaining a fundamental understanding of what controlstexture and thereby the possibility of modifying texture through changes in alloy composition.
Two other observations drawn from the literature are important to consider. First, althoughmany researchers cite the <001> fiber growth direction as being parallel to the z-axis, there canoften be subtle deviations (of up to ∼10–20◦) from the z-direction, which is reflected in either thegraphical representations of texture (e.g., pole figures) or assessments of the long axis of the grainsthat formed during solidification. This deviation in the crystallographic texture can be attributedto the fact that the maximum temperature gradient is not parallel to the z-axis. When the complextemperature distributions of AM (captured by Equation 1) and the motion of the heat sourcerelative to the solid material that acts as a chill are considered, it becomes clear that AM deviatesfrom a simple 1D heat transfer problem and that the maximum temperature gradient is not parallel
www.annualreviews.org • Microstructural Control of AM Metallic Materials 69
Ann
u. R
ev. M
ater
. Res
. 201
6.46
:63-
91. D
ownl
oade
d fr
om w
ww
.ann
ualr
evie
ws.
org
Acc
ess
prov
ided
by
Col
orad
o Sc
hool
of
Min
es o
n 02
/06/
17. F
or p
erso
nal u
se o
nly.
MR46CH04-Collins ARI 4 June 2016 12:5
Incr
easi
ngco
nsti
tuti
onal
supe
rcoo
ling
S L
Actual GTliquidus
Planarequilibrium
S L Cellular
S L Columnardendritic
Tsolidus
S L Equiaxeddendritic
G'
G''
G'''
Tx
Narrow freezing range (TL – TS)Simple (linear) G
Abs
olut
e st
abili
ty(~
0.5
ms–1
)
Interface velocity, R (m/s)
Tem
pera
ture
grad
ient
, G (K
/m)
Plan
ar
Cellu
lar
Columnar dendrit
ic
Equiaxeddendritic
TC11 (titanium alloy)laser-based AM
Base wall
Ti-6Al-4V electronbeam–based AM
Build
dire
ctio
n, N
z
2 mm5 mm
b
c d
q
vq'
S +
L
Liqu
idus
SL
S + L
a
Tx
S
L
G
Equiaxed
ColumnarMixed
400 μm
100 μm
10–3 10–210–2
10–1
100
101
102
103
104
105
10–1 100
R (cm/s)
G (K
/cm
)
101 102 103
Float-zone DSCylindrical castingPrototype-prod.castingCO2 laser glazeNd:YAG laser glaze
EquiaxedMixedColumnar
Figure 4Effect of processing on texture and grains in AM. (a) Schematic of molten pool motion. Modeled after Reference 45. (b) Schematic ofsolidification modes with respect to undercooling and thermal gradients (G). (c) Epitaxial grain growth across layers shown in opticalmicrographs for the titanium alloy TC-11 (79) (left) and in orientation micrographs showing texture for Ti-6Al-4V (129) (right).(d ) Solidification map for Ti-6Al-4V with data from float-zone directional solidification (DS), cylindrical casting, prototype-production(prod.) casting, CO2 laser glaze, and Nd:YAG laser glaze. The micrographs are of Ti-6Al-4V processed using Nd:YAG laser glaze(exhibiting columnar grains) and CO2 laser glaze (exhibiting mixed grains). Adapted from Reference 67.
to a principal Cartesian coordinate axis (x, y, and z). It is understood that the complex thermalfield can be included in the thermal modeling of AM solidification,
∂T∂t
= α∇2T =(
kρc p
) (∂2T∂x2
+ ∂2T∂y2
+ ∂2T∂z2
), 1.
where α is the thermal diffusivity (α = k/ρc p ), k is the thermal conductivity, ρ is the density, cp isspecific heat capacity, T is temperature, and t is time.
Second, under certain combinations of thermal gradients and processing conditions (62, 63)and for certain alloy modifications (47), texture can apparently be controlled or eliminated in
70 Collins et al.
Ann
u. R
ev. M
ater
. Res
. 201
6.46
:63-
91. D
ownl
oade
d fr
om w
ww
.ann
ualr
evie
ws.
org
Acc
ess
prov
ided
by
Col
orad
o Sc
hool
of
Min
es o
n 02
/06/
17. F
or p
erso
nal u
se o
nly.
MR46CH04-Collins ARI 4 June 2016 12:5
the as-deposited state. Regarding the former, the transition between textured (columnar) andnontextured (equiaxed) structures has been related to spatial-temporal variation in the thermalgradient (G = |∇T |) and the solidification rate velocity (R = 1
G∂T∂t , where ∂T
∂t is the solidificationcooling rate) (62–65). These terms, and their contribution to the microstructure (see Figure 4b),relate to constitutional supercooling, which influences not only texture but also grain structures.
One strategy of predicting the dominant morphology, and consequently the presence or ab-sence of texture, is the use of G-versus-R maps, also known as solidification maps (64–67) (seeFigure 4b,d ). These G-versus-R maps are strongly dependent upon composition, as the phe-nomena (e.g., constitutional supercooling, crystal anisotropy) that govern liquid/solid interfacialinstabilities are dependent upon composition (e.g., partition coefficients, diffusivity in the liquid)(45). Thus, another approach that could be adopted is the use of G/V-versus-X maps (59, 68, 69).In addition, cellular automaton modeling is a suitable method of predicting both grain structures(70, 71) and the evolution of texture.
It is also useful to consider the persistence of texture following postdeposition heat treatmentsand as a result of phase transformations. Regarding the former, it is widely reported that the texturegenerally remains following postdeposition, elevated-temperature heat treatments (46), especiallywhen care is taken to consider the columnar-to-equiaxed transitions (CETs) that exist in theas-deposited material. This retention of texture is not unexpected, given the lack of a sufficientdriving force for nucleation of new grains. For materials that undergo a phase transformationupon cooling, the texture propagates from the high-temperature phase to the low-temperaturephase, following the governing orientation relationships (72, 73). The texture that is present inAM materials can either negatively affect properties [e.g., reduced ductility in Ti-6Al-4V (74)] orpositively affect properties [e.g., enhanced ductility in a Co-Cr-Mo alloy (53, 75)], although theprecise impact on properties, including fracture toughness and fatigue, can be understood onlywhen the role of defects and other microstructural details is also considered. This is a coupledproblem and requires an understanding of the correlation between texture and defects.
3. MICRO-LEVEL MICROSTRUCTURAL FEATURES
3.1. Grain Size and Morphology
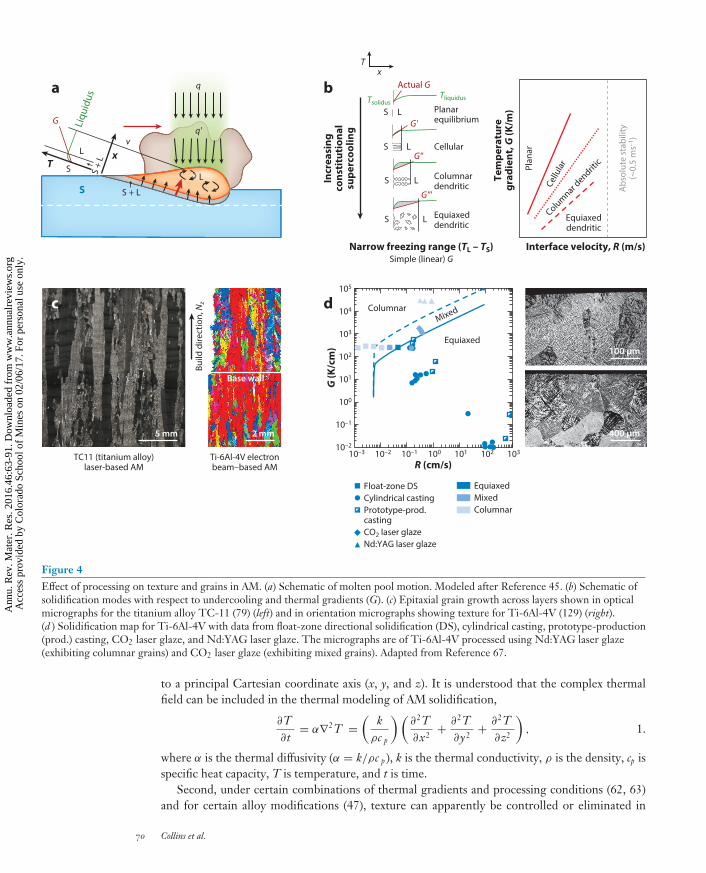
The coarsest microstructural features that are typically important to consider are the grains. Thereare direct linkages between texture and solidification maps, which are introduced in Section 2.3above, and grain size and morphology. Several distinctive characteristics regarding grains havebeen observed in AM metallic materials. These characteristics include (a) a zigzag-like appearanceto columnar grains across alternating layers (18, 72), (b) an ability to control grain size or shapeby varying processing parameters (67), (c) an apparent ability to undergo a CET by modifyingcomposition (45, 76–78), and (d ) periodic CETs (62, 79, 80). These features can be understoodby considering the solidification process. Many of the grain characteristics observed in AM canbe understood by using Figure 5, which extends concepts introduced in Figure 4.
Significantly, although an overarching definition of AM is presented in the introduction, thereare differences in the operation of various mechanisms of heat transfer (i.e., their operation andmagnitude) for different AM techniques. For example, heat conduction dominates electron beam–based AM, whereas convection operates in laser-based AM under Ar. Furthermore, heat transferby conduction is different for a powder-blown thin wall (approximates a 1D problem), whereasit is more complex in a powder bed thin wall, for which heat transfer through percolation theoryis present. As the dimensionality of the part increases to larger 3D volumes, such differencesbetween powder bed and powder blown may be reduced, although differences in the input power
www.annualreviews.org • Microstructural Control of AM Metallic Materials 71
Ann
u. R
ev. M
ater
. Res
. 201
6.46
:63-
91. D
ownl
oade
d fr
om w
ww
.ann
ualr
evie
ws.
org
Acc
ess
prov
ided
by
Col
orad
o Sc
hool
of
Min
es o
n 02
/06/
17. F
or p
erso
nal u
se o
nly.
MR46CH04-Collins ARI 4 June 2016 12:5
a
c d
Δ T-in
duce
dgr
ain
mor
phol
ogie
sU
nder
cool
ing-
indu
ced
grai
n m
orph
olog
ies
CETComplex (nonlinear) G under atmosphere
qconduction
Columnardendritic
Equiaxeddendritic
G'
S
L
Liquid/Arinterface
qconductionG''
Equiaxedgrains
n + 1
n
Equiaxedgrains
Columnargrains
Columnargrains
Rem
elte
d vo
lum
e
q
v
q
vLayer n
Layer n + 1
<001>
<001>
<001>
<001>
Liquidmetal
Liquidmetal
Track width
Scan
dire
ctio
n
Gra
in
200 μm
b
Extended freezing range (TL – TS)Simple (linear) G
TNZT: narrowfreezing range
TNZT + B: widefreezing range
100 μm
5 μm 1 mm 500 μmHAZSubstrate
CGZ
EGZ d
d
S L
G'
Equiaxeddendritic
Fusion line
001
TD
001
101
111
Ti-βRD
1 2 5Time (a.u.)
15
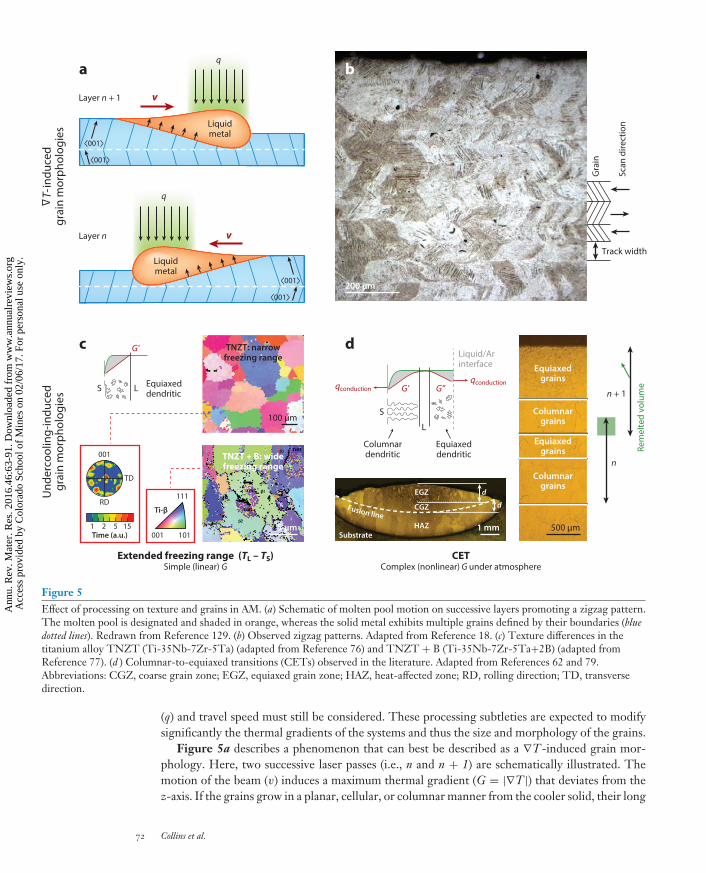
Figure 5Effect of processing on texture and grains in AM. (a) Schematic of molten pool motion on successive layers promoting a zigzag pattern.The molten pool is designated and shaded in orange, whereas the solid metal exhibits multiple grains defined by their boundaries (bluedotted lines). Redrawn from Reference 129. (b) Observed zigzag patterns. Adapted from Reference 18. (c) Texture differences in thetitanium alloy TNZT (Ti-35Nb-7Zr-5Ta) (adapted from Reference 76) and TNZT + B (Ti-35Nb-7Zr-5Ta+2B) (adapted fromReference 77). (d ) Columnar-to-equiaxed transitions (CETs) observed in the literature. Adapted from References 62 and 79.Abbreviations: CGZ, coarse grain zone; EGZ, equiaxed grain zone; HAZ, heat-affected zone; RD, rolling direction; TD, transversedirection.
(q) and travel speed must still be considered. These processing subtleties are expected to modifysignificantly the thermal gradients of the systems and thus the size and morphology of the grains.
Figure 5a describes a phenomenon that can best be described as a ∇T-induced grain mor-phology. Here, two successive laser passes (i.e., n and n + 1) are schematically illustrated. Themotion of the beam (v) induces a maximum thermal gradient (G = |∇T |) that deviates from thez-axis. If the grains grow in a planar, cellular, or columnar manner from the cooler solid, their long
72 Collins et al.
Ann
u. R
ev. M
ater
. Res
. 201
6.46
:63-
91. D
ownl
oade
d fr
om w
ww
.ann
ualr
evie
ws.
org
Acc
ess
prov
ided
by
Col
orad
o Sc
hool
of
Min
es o
n 02
/06/
17. F
or p
erso
nal u
se o
nly.
MR46CH04-Collins ARI 4 June 2016 12:5
axis tends to align with the maximum thermal gradient. Thus, when these two alternating layersare considered, their maximum thermal gradients should alternate by approximately the sameangular deviation about the z-axis, thus potentially inducing a zigzag grain pattern. Such grainshave been observed by multiple researchers, including Thijs et al. (18), whose work is shown inthe optical micrograph in Figure 5b. Grains such as those discussed in the work of Thijs et al. (seeFigure 5b) are likely new nucleation events whose solidification front behaves in a cellular ordendritic fashion, as opposed to grain continuation (e.g., via epitaxial growth), as such a deviationin the primary axis would induce considerable lattice curvature in the grains at the layer-layerboundary. Given that both epitaxial growth and new nucleation zigzag patterns have been ob-served, one must consider that the thermal gradient term might be further probed to understandthe change in modes. This area has not been addressed in the AM literature.
Figure 4c shows that differences in undercooling change the mode of solidification (e.g., pla-nar, cellular, columnar dendritic, equiaxed dendritic), which is the basis for the solidification mapsshown in Figure 4c,d. The compositional regime for which constitutional undercooling is favor-able can be related to two descriptive parameters, namely the supercooling parameter P and thegrowth restriction factor Q, where P = mc 0(k−1)/k and Q = mc 0(k−1), respectively (78, 81–84).Here, m is the slope of the liquidus line, and k is the partition coefficient. P represents the degree ofconstitutional supercooling present, whereas Q represents the rate of development of the consti-tutional supercooling. When constitutional supercooling is increased (i.e., given favorable P andQ) and as the thermal gradient decreases, an increasingly greater constitutional supercooling canoccur, leading to the change in solidification mode. This is illustrated for an arbitrary alloy witha narrow freezing range and a simple linear thermal gradient. For each solidification mode, thevertical axis is the temperature, and the horizontal direction is the distance from the liquid/solidinterface. By using this common schematic representation of the influence of undercooling onsolidification modes, it is possible to understand how the mode might change if the temperaturegradient (G) was changed. Such a change in solidification modes is indeed the basis for the solidi-fication maps presented by Kobryn & Semiatin (67) shown in Figure 4d and similar process maps(85) and is used to understand the evolution of grain structures in Ti-6Al-4V by using markedlydifferent processing routes (e.g., 14-kW CO2 lasers and 750-W Nd:YAG lasers).
There are other means of modifying the solidification mode and the attending grain morphol-ogy. One such way is to increase the freezing range (i.e., by increasing P and decreasing Q). A modelsystem in which this approach has been demonstrated is Ti-based alloys with and without boron(B). Bermingham et al. (45) effectively demonstrated this approach by modifying Ti-6Al-4V withtrace B. They observed the direct influence of Q in promoting thinner β-grains but were unable totransition this alloy to a more equiaxed dendritic structure. However, two separate investigationsof a β-Ti alloy, TNZT (nominally Ti-35Nb-7Zr-5Ta), with and without B, show the ability tosignificantly reduce grain size and texture, indicating a more equiaxed dendritic structure. In thefirst study of laser-deposited, unmodified TNZT by Banerjee et al. (76), an electron backscattereddiffraction pattern (EBSP) map (shown in Figure 5c) indicates a very strong (∼26-times-random)[001]β fiber texture with a grain size of ∼150 μm. The second study by Nag et al. (77) focusedon the characterization of the borides in TNZT + 2-wt% B, rather than on the effect of B on thegrains. Nonetheless, the research, conducted using the same AM system, presented an EBSP map(also shown in Figure 5c) in which the grains not only deviate from the [001]β fiber texture butseem far more random and of a significantly reduced size (∼5–10 μm) than those in the study ofBanerjee et al. (76). Although the precipitation of thermally stable borides as inoculants likely alsoreduced the grain size, the role of constitutional supercooling and Q cannot be ignored in thesetwo separate studies. Another system in which composition has induced considerable grain sizereduction is a Ti alloy with a relatively large carbon (C) content, designated as BurTi (86, 87).
www.annualreviews.org • Microstructural Control of AM Metallic Materials 73
Ann
u. R
ev. M
ater
. Res
. 201
6.46
:63-
91. D
ownl
oade
d fr
om w
ww
.ann
ualr
evie
ws.
org
Acc
ess
prov
ided
by
Col
orad
o Sc
hool
of
Min
es o
n 02
/06/
17. F
or p
erso
nal u
se o
nly.
MR46CH04-Collins ARI 4 June 2016 12:5
When C is added to the alloy, there is a considerable reduction in grain size relative to alloys suchas Ti-6Al-4V. C does not exhibit the same relatively high Q as B, owing to its solubility in bothα- and β-Ti; consequently, it is not expected to restrict grain growth to the same degree. Thus,in the case of this alloy, the grain refinement might be attributed more to the precipitation ofthermally stable precipitates than to constitutional supercooling. Although these studies presentcompelling experimental results indicating that composition can play a role in disrupting texture,they generally [except for the work of Bermingham et al. (45)] have yet to consider the importanceof solidification modes.
Another method by which to control the texture is to modify the thermal fields. By modifyingthe thermal fields, it is possible to transition across solidification modes in the solidification mapsdescribed previously. Dehoff et al. (88) recently demonstrated the ability to control solidificationmodes, and thus texture, by controlling the processing parameters. In their demonstration, theyshowed it was possible to engineer the texture in the x-y plane of a deposition, effectively writingtexture where they wanted it. Beyond this breakthrough effort, little else has been done. Yet thereis an opportunity. As noted above, the temperature gradients are complex and vary among the AMmethods. For those methods that are conducted in either atmosphere or powder bed, there areadditional modes of heat transfer beyond simple conduction through the build, which will producea complex, nonlinear temperature field. For such a field, it is not surprising if d2T
dx2 = 0, reflectinga competition between two different thermal gradients, as illustrated in Figure 5d. Under suchconditions, columnar grains can dominate the bottom part of the melt pool, whereas equiaxedgrains dominate the top part of the melt pool (79). In such reports, for a multilayer AM build, aportion of the equiaxed grains of the previously deposited layer melts, and new nucleation mayproceed by the columnar dendritic mode, whereas the top of the next layer also exhibits equiaxedgrains. In this manner, it is possible to observe a repeating CET whose overall height is slightly lessthan the layer thickness, owing to remelting. CET has also been observed in high-energy-inputwire-fed electron beam work that is dominated by only one heat transfer mode (conduction) (80).In such work, constitutional supercooling is likely responsible for the observation of CET, whichis less pronounced than the CET shown in Figure 5d.
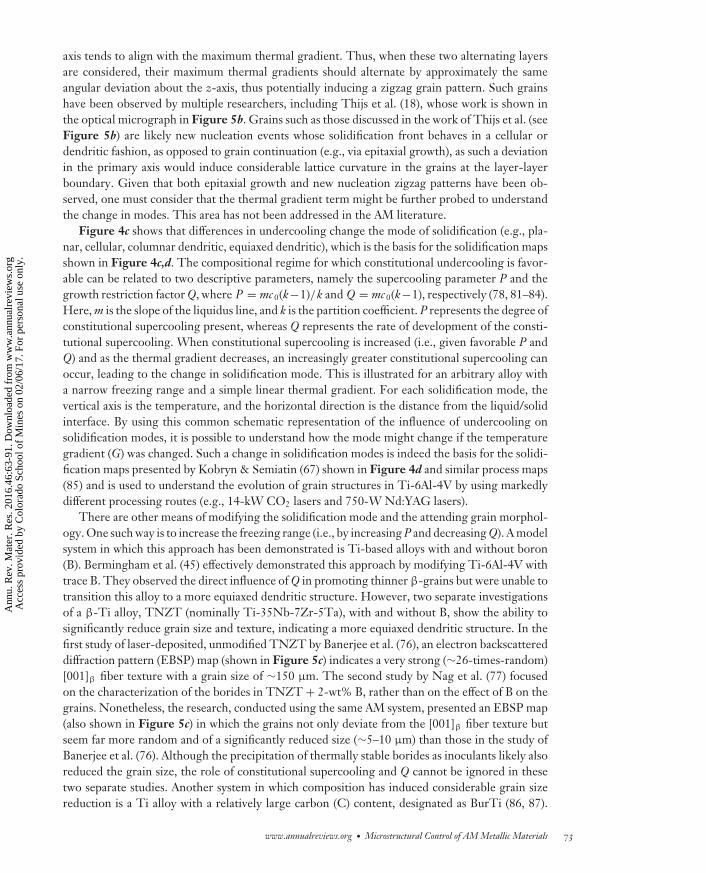
Panels a and b of Figure 6 show two examples of modeling strategies that have been used topredict grain structures in AM materials. As shown in Figure 6a, Yin & Felicelli (71) combineda 2D finite element modeling approach with the cellular automaton technique to predict the
Cellular automaton model
2D experimentalcross section
2D stimulationcross section
Increased cooling rate
a 1,050 K/s, 2 mm/s
4,350 K/s, 10 mm/s
9,000 K/s, 20 mm/s
b
20 μm 100 μm
Face analyzedFace analyzed
0.0 0.2 0.4 0.6 0.8
Figure 6Application of cellular automaton and finite element modeling simulation tools to predict microstructuralevolution in metal AM. Panel a adapted from Reference 71. Panel b adapted from Reference 70.
74 Collins et al.
Ann
u. R
ev. M
ater
. Res
. 201
6.46
:63-
91. D
ownl
oade
d fr
om w
ww
.ann
ualr
evie
ws.
org
Acc
ess
prov
ided
by
Col
orad
o Sc
hool
of
Min
es o
n 02
/06/
17. F
or p
erso
nal u
se o
nly.
MR46CH04-Collins ARI 4 June 2016 12:5
evolution of grains; showed the transition from dendritic to cellular structures; and incorporatedthe influences of travel speed, layer spacing, and base plate thickness into the model. As shown inFigure 6b, Klingbeil et al. (70) used the cellular automaton approach to predict grain growth inAM Ti-6Al-4V and correlated the results of simulations with experiments.
3.2. Phases
Industrially relevant structural metals tend to be multicomponent and multiphase materials (e.g.,Ni-based superalloys, precipitation-hardened Al alloys, and α+β- and β-Ti-based alloys), relyingupon second phases to strengthen the material. In such multiphase materials, both the L → S andS → S′ phase transformations are important. The former determines the distribution of elementswithin the grains, whereas the latter establishes the volume fraction, size, and distribution ofsecond phases present in the microstructure.
The above sections establish that in the AM process there are often temperature gradi-ents that result in far-from-equilibrium structures. The same large undercooling observed inAM materials that promotes texture and governs grains also impacts the resulting phases andtheir sizes, distributions, and chemical compositions. Compounding the evolution of microstruc-tures in the as-deposited condition are the spatial and temporal fluctuations of temperature,which can result in the dissolution and reprecipitation of phases, but at different temperaturegradients (see Equation 1) relative to the adjacent microstructure, leading to spatially varyingmicrostructures.
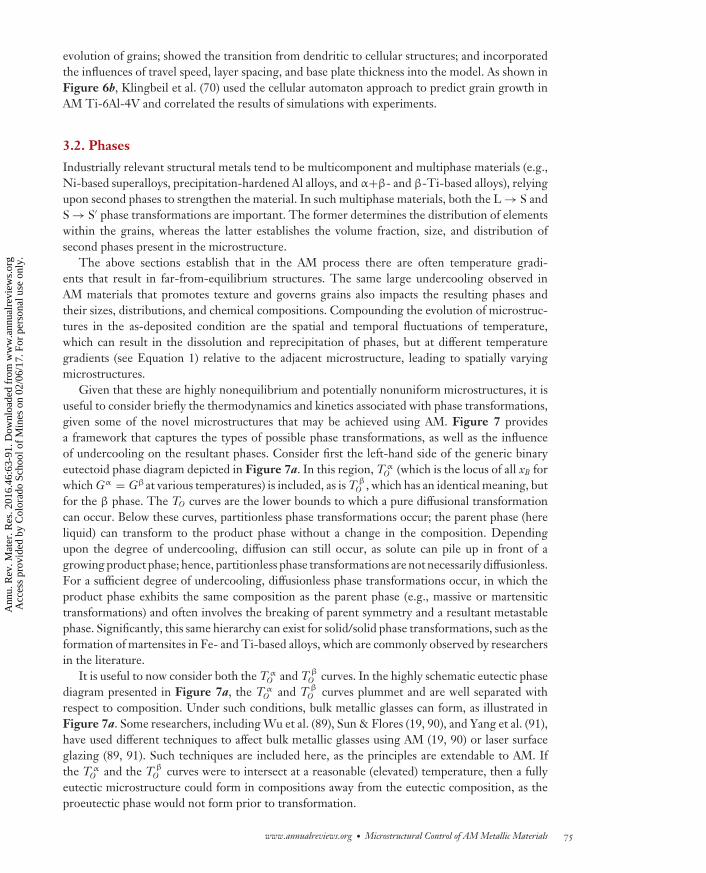
Given that these are highly nonequilibrium and potentially nonuniform microstructures, it isuseful to consider briefly the thermodynamics and kinetics associated with phase transformations,given some of the novel microstructures that may be achieved using AM. Figure 7 providesa framework that captures the types of possible phase transformations, as well as the influenceof undercooling on the resultant phases. Consider first the left-hand side of the generic binaryeutectoid phase diagram depicted in Figure 7a. In this region, T α
O (which is the locus of all xB forwhich Gα = Gβat various temperatures) is included, as is T β
O , which has an identical meaning, butfor the β phase. The TO curves are the lower bounds to which a pure diffusional transformationcan occur. Below these curves, partitionless phase transformations occur; the parent phase (hereliquid) can transform to the product phase without a change in the composition. Dependingupon the degree of undercooling, diffusion can still occur, as solute can pile up in front of agrowing product phase; hence, partitionless phase transformations are not necessarily diffusionless.For a sufficient degree of undercooling, diffusionless phase transformations occur, in which theproduct phase exhibits the same composition as the parent phase (e.g., massive or martensitictransformations) and often involves the breaking of parent symmetry and a resultant metastablephase. Significantly, this same hierarchy can exist for solid/solid phase transformations, such as theformation of martensites in Fe- and Ti-based alloys, which are commonly observed by researchersin the literature.
It is useful to now consider both the T αO and T β
O curves. In the highly schematic eutectic phasediagram presented in Figure 7a, the T α
O and T βO curves plummet and are well separated with
respect to composition. Under such conditions, bulk metallic glasses can form, as illustrated inFigure 7a. Some researchers, including Wu et al. (89), Sun & Flores (19, 90), and Yang et al. (91),have used different techniques to affect bulk metallic glasses using AM (19, 90) or laser surfaceglazing (89, 91). Such techniques are included here, as the principles are extendable to AM. Ifthe T α
O and the T βO curves were to intersect at a reasonable (elevated) temperature, then a fully
eutectic microstructure could form in compositions away from the eutectic composition, as theproeutectic phase would not form prior to transformation.
www.annualreviews.org • Microstructural Control of AM Metallic Materials 75
Ann
u. R
ev. M
ater
. Res
. 201
6.46
:63-
91. D
ownl
oade
d fr
om w
ww
.ann
ualr
evie
ws.
org
Acc
ess
prov
ided
by
Col
orad
o Sc
hool
of
Min
es o
n 02
/06/
17. F
or p
erso
nal u
se o
nly.
MR46CH04-Collins ARI 4 June 2016 12:5
Diliquid
T Oα
T Oα
TOβ
TgBMG
XBA B
T
L
α
α
β
β
Types of phasetransformationsa b
T
ΔT
µB
Effect of undercooling onpartition coefficient
Interfacial velocity (m/s)Pa
rtit
ion
coef
ficie
nt, k k =
k0 + V VD
1 + V VD
VD = a0
DiffusionalPartitionlessDiffusionlessBMG
Equilibrium
Nearly partitionless
c Effect of undercoolingon nucleation
ΔT
ΔGvol
ΔG*
r *ΔGS(misfit ε)
γα/β(n)k
Di
0.410–1 100 101 102
0.6
0.8
1.0
Figure 7Framework to relate transformations, undercooling, partitioning, and nucleation. BMG denotes bulkmetallic glass.
This framework illustrates that, on the basis of composition and cooling, it is possible toform equilibrium phases, including both partitionless and diffusional transformations; metastablephases, including both martensitic and massive transformations; and bulk metallic glasses. Al-though this framework is introduced to understand phase transformations associated with far-from-equilibrium phases, it can be used to understand phase transformations expected underequilibrium conditions. For example, Figure 7b shows that, under conditions commonly foundin AM, the compositions of the expected phases may be far from their equilibrium compositions.With increased undercooling, there is insufficient time for the solute to redistribute itself in frontof the moving liquid/solid (or solid/solid) interface, and the relative compositional difference be-tween the phases decreases as the partition coefficient (k) approaches 1. This is discussed furtherin Section 4. Finally, consider the connections between the variables associated with nucleationand growth, mapped out in Figure 7c. According to well-understood relationships in nucleation,as undercooling is increased, both the critical radius of a stable particle (r∗) and the critical freeenergy to nucleation (ΔG∗) are reduced. It is useful to consider the role that partitioning has on r∗
and ΔG∗, although such discussion is often neglected. The distribution of solute atoms changes thestrain energy [ΔGS(misfit ε)] as well as the surface energy [γα/β(n)T α
O ] of the particle. Significantly,AM results in strong texture, which is likely to introduce a heterogeneous distribution of grainboundaries that deviate from a fully random microstructure. To understand precipitation in AMsystems, these deviations need to be considered.
76 Collins et al.
Ann
u. R
ev. M
ater
. Res
. 201
6.46
:63-
91. D
ownl
oade
d fr
om w
ww
.ann
ualr
evie
ws.
org
Acc
ess
prov
ided
by
Col
orad
o Sc
hool
of
Min
es o
n 02
/06/
17. F
or p
erso
nal u
se o
nly.
MR46CH04-Collins ARI 4 June 2016 12:5
As discussed above, many researchers have observed the proclivity of Ti-based alloys to exhibitmartensitic microstructures (α′). These martensitic microstructures are the result of an S → S′
(β → α′) phase transformation. However, these metastable phases that are formed in one layer ofthe build can be partially or completely decomposed into stable phases due to the thermal cyclingeffect during melting and fusion of the subsequent layer or preheating of the powder (in the caseof powder bed techniques). The degree of decomposition is a strong function of process heat inputand is thus correlated with the factors that influence the solidification rate of the molten pool suchas the energy density, layer thickness, and even geometry of the sample (92).
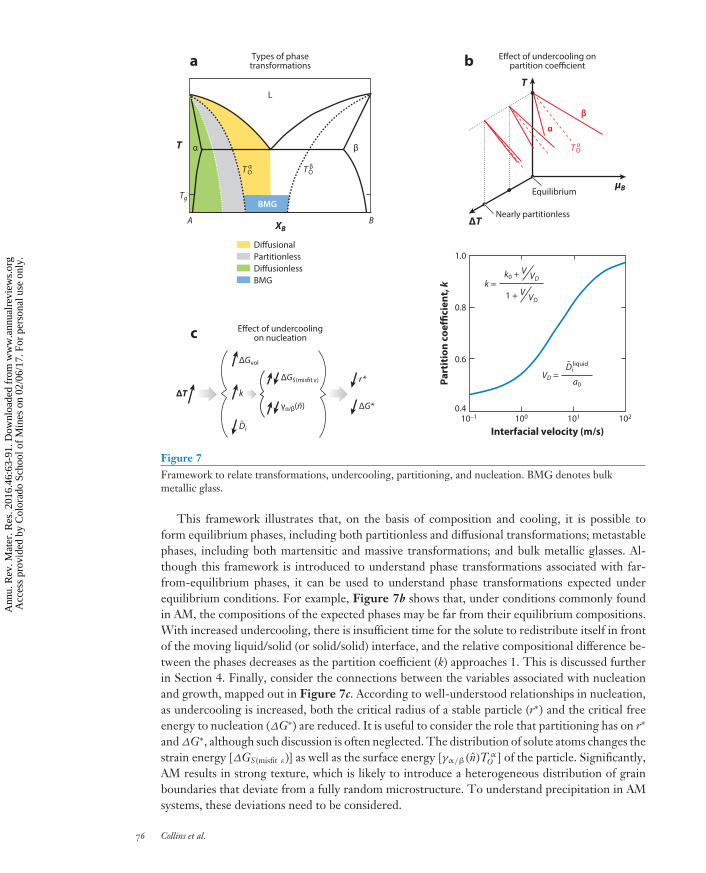
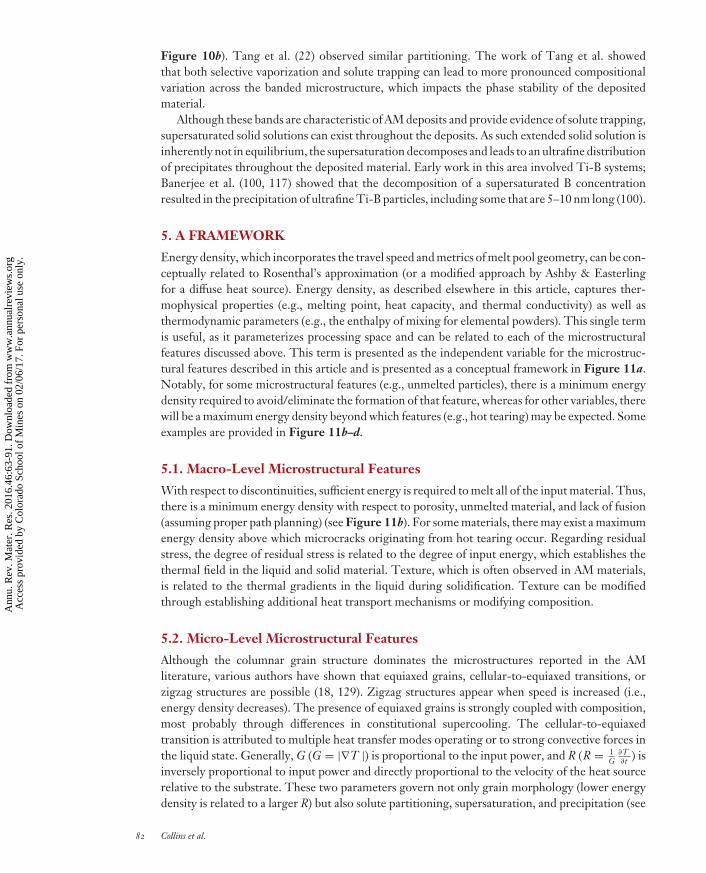
The degree of undercooling for both L → S and S → S′ phase transformations varies spatiallywithin the part, which can lead to variations in both the partitioning coefficient and the subsequentphases. Such a variation in solute distribution and subsequent phase formation is usually observedin systems that undergo a complex phase transformation pathway, including both relatively highand low temperature transformations. Thus, in the regions of the build that experience highercooling rates, a lower fraction for phases that are the product of high-temperature transformationis observed, as their transformation is suppressed due to rapid cooling. The above-mentionedphenomenon has been reported in a γ-Ti-based alloy in which the phase fraction of the α2 phasein the near-substrate region is almost five times larger than the average α2 phase fraction in the restof the build. In this system, the α2 → a2 + γ transformation is expected upon cooling. However,owing to the relatively high cooling rates during the formation of initial layers on the substrate(93), the expected phase transformation is arrested, and the higher-temperature phase remains.Similarly, this difference in undercooling can result in different dominant morphologies, as hasbeen observed in the variation in the size of α precipitates in Ti alloys (73, 94) (see Figure 8a–c),as well as in phase fractions in Ni-based superalloys (95) and Al-based alloys (96).
The starting composition and complex thermal histories help set the resulting microstructure.For Ni-based superalloys, some alloys [e.g., Inconel 718 by selective laser melting (SLM)] do notreadily develop the γ′ phase from processing and require additional heat treatments to achievethe desired distribution of precipitates (97), whereas other alloys [e.g., Rene 142 by electron beammelting (EBM)] develop a γ′ precipitate structure without any postfabrication heat treatment (98).New alloys can be explored to achieve highly innovative precipitation sequences in the as-depositedconditions. One example is Al-Sc, which achieves refined precipitates by taking advantage of thesubstantial supersaturation state (i.e., increased k) of the matrix provided by the AM processing (99).
3 mm
50 μm
50 μm
a b c
Figure 8Example of banding in microstructure that is related to microstructural scale effects, as seen in Ti-6Al-4V.Adapted with permission from References 73, 94, and 131.
www.annualreviews.org • Microstructural Control of AM Metallic Materials 77
Ann
u. R
ev. M
ater
. Res
. 201
6.46
:63-
91. D
ownl
oade
d fr
om w
ww
.ann
ualr
evie
ws.
org
Acc
ess
prov
ided
by
Col
orad
o Sc
hool
of
Min
es o
n 02
/06/
17. F
or p
erso
nal u
se o
nly.
MR46CH04-Collins ARI 4 June 2016 12:5
Similar results have been observed in Ti/TiB composites (100) and Er2O3-reinforced Ti (101), inwhich a highly refined distribution of thermodynamically stable dispersoids was achieved.
Various researchers have recognized the effect of texture and grain size on the precipitationof second-phase particles in the as-deposited microstructure. For example, Sun et al. (53) charac-terized M23C6 precipitates that form in an intragranular fashion and related both the precipitateformation and the overall properties to the columnar primary γ grains. Banerjee et al. (102) cor-related the variant selection of grain boundary allotriomorphic phases with grain orientation intextured AM specimens. Ramirez et al. (103) demonstrated the possibility of producing precipitateor dislocation structures in low-purity Cu powder with a high concentration of Cu2O precipitates.
In the preceding discussion in this subsection, compositional homogeneity of the molten poolprior to the onset of the phase transformation is assumed. Although such an assumption is gen-erally valid when the convection mixing is sufficient to redistribute solute changes as described inSection 4, for elemental powder blends the situation depends upon both the input energy and thethermophysical properties of the material. For example, when refractory elements with relativelyslow diffusivities are present as elemental powder, the microstructure of the as-built material isprone to containing partially melted particles that produce localized enriched zones around theseparticles (23, 24). Such zones may result in a compositionally induced variation of microstructure(e.g., crossing T α
O ), which leads to inhomogeneous distribution of phases (104). Such observationsgenerally indicate that additional input energy (q) is required to sufficiently melt the material.
4. COMPOSITIONAL ASPECTS
To fully predict and control microstructure, it is necessary to understand both the compositionof the starting material and the processing conditions (e.g., cooling rate, interfacial velocity). InAM, the material is a direct product of solidification, necessitating consideration of compositionfrom multiple perspectives. These perspectives include (a) compositional variation due to theprocess (e.g., pickup from the atmosphere or loss of species through volatilization), (b) soluteconcentrations of phases that exceed equilibrium values due to solute trapping during solidification,and (c) the role that composition has on solidification (e.g., freezing range, partitioning, diffusivityin the liquid). These aspects are considered separately.
4.1. Process-Induced Bulk Compositional Variation
Given the fact that AM is a solidification process, the final compositional certification movesdownstream and is intimately coupled with the AM process. Although input feedstock can becertified, the AM process provides the opportunity to significantly modify the composition. Suchmodification can include both increases in interstitial elements that are present in the atmosphere(i.e., gettering) and losses due to differential vaporization of constituent elements.
Regarding the former, when processing is conducted under atmosphere, it is not unusual toobserve concentrations of interstitial elements (e.g., oxygen, nitrogen, hydrogen) that are higherthan in the composition of the feedstock. The problem can be exacerbated when one uses powder,which has a high surface area. These interstitial elements can have a significant impact on the re-sulting mechanical properties and microstructures. For example, in Ti-based alloys that exhibit alarge solid solubility for oxygen, the oxygen pickup during the AM process [i.e., 0.032–0.205-wt%oxygen (74)] can lead to increases in yield strength and to loss of ductility (74). Such interstitial get-tering can push the composition of the deposited component beyond the typical design allowable.Although such pickup is largely viewed as undesirable, there may be some alloys or applications forwhich the atmosphere is used to intentionally increase the oxygen or nitrogen levels. For example,
78 Collins et al.
Ann
u. R
ev. M
ater
. Res
. 201
6.46
:63-
91. D
ownl
oade
d fr
om w
ww
.ann
ualr
evie
ws.
org
Acc
ess
prov
ided
by
Col
orad
o Sc
hool
of
Min
es o
n 02
/06/
17. F
or p
erso
nal u
se o
nly.

MR46CH04-Collins ARI 4 June 2016 12:5
some biomedical Ti-based alloys have increased oxygen levels (105); however, the oxygen in AMstudies of these materials has not resulted in undesirable properties (106).
Regarding losses due to differential vaporization of constituent elements, elements with lowvapor pressures preferentially evaporate. The temperatures of the molten pool are often high, andthus, to varying degrees, most elements evaporate. However, the end composition is governed bythe variable weight loss of multiple elements, of which the low-melting-point elements suffer themost. The evaporation rate is a strong function of temperature and varies in a nonlinear fashion.Therefore, small temperature fluctuations caused by heat source power and frequency, spot size,and heat dissipation conditions can result in volatilization (107). For example, the reduction inAl content in the EBM of Ti-6Al-4V—which is conducted under vacuum, thus exacerbating theproblem—can range between 10% and 15% (73, 108).
Most of the AM literature simply reports compositional differences in builds with respect tothe starting material. This seemingly places the estimation or prediction of composition on apoor foundation. It would be useful to have a means of predicting both adsorption (gettering)of interstitial elements from the surrounding gas and the volatilization of elemental species fromthe molten metal. Given the relative dearth of papers discussing this topic in AM processes, onemight consider reviewing welding or other solidification topics to understand this variation incomposition. For example, a review of oxygen absorption in iron and steel provides equations topredict oxygen concentration as a function of temperature and oxygen partial pressure in a gas(109). Although this approach has a degree of usefulness, the characteristics of the AM process,which often do not reach equilibrium, must be considered. For example, Semiatin et al. (110)established kinetics models for evaporative losses under vacuum points and based their approachon the flux at the free surface of the melt (Js) by assuming the Langmuir equation (111), expressedfor the ith species as
Js = Xi P0i γi
√M i
2πRT, 2.
where, for the ith species, X is the mole fraction, P0 is the vapor pressure at absolute temperatureT, γ is the activity coefficient in the liquid melt, M is the molar mass, and R is the gas constant(83.2 ergs/degree). Importantly, the paper by Semiatin et al. points to the consideration of atomicflux across the liquid/gas interface, which can be fundamentally treated by the Langmuir equation.The Langmuir equation, although derived for the purposes of evaporation and used by Semiatinet al. for evaporation, can describe condensation and adsorption equally well. The original form(111) is given as
m =√
M i
2πRT· pi , 3.
where, in addition to the terms described above, m is the mass flux of a gas toward the surfacein question and pi is the partial pressure of species i. As both Equations 2 and 3 and Figure 9make clear, there is less pickup at higher temperatures. This is due to the more dominant inverseeffect that temperature has on the density of the gas at the surface relative to the less dominanteffect that temperature has on the velocity of the gas. However, neither Equation 2 nor Equation 3captures time available for atomic flux, which (generally) increases with temperature. By reviewingthe level of oxygen pickup for laser-based powder processes (e.g., an especially poor ∼320 ppm(74) due to a water leak) of Ti-based alloys, and considering the probable temperature of themolten pool, melt pool size, and scan speeds (12, 17, 24, 73, 112, 113), one can calculate ann (n = m · A) of ∼2.61 · 10−6 g/s. Furthermore, by considering an order-of-magnitude estimationof the cooling rate at the centerline of moving heat source problems (114), one can couple the massflux to the thermal gradient and predict the oxygen pickup for a given melt pool size, material,
www.annualreviews.org • Microstructural Control of AM Metallic Materials 79
Ann
u. R
ev. M
ater
. Res
. 201
6.46
:63-
91. D
ownl
oade
d fr
om w
ww
.ann
ualr
evie
ws.
org
Acc
ess
prov
ided
by
Col
orad
o Sc
hool
of
Min
es o
n 02
/06/
17. F
or p
erso
nal u
se o
nly.
MR46CH04-Collins ARI 4 June 2016 12:5
m = = wti
A·tMi
2πRT· pi
Langmuir
wti = weight of species i (g)A = area of melt pool (mm2)t = time (s)
∂T∂t
=2πkv(T – T0)2
H
From Rosenthal’sapproach
k = thermal conductivityv = velocityH = transferred energy
a Governing equations
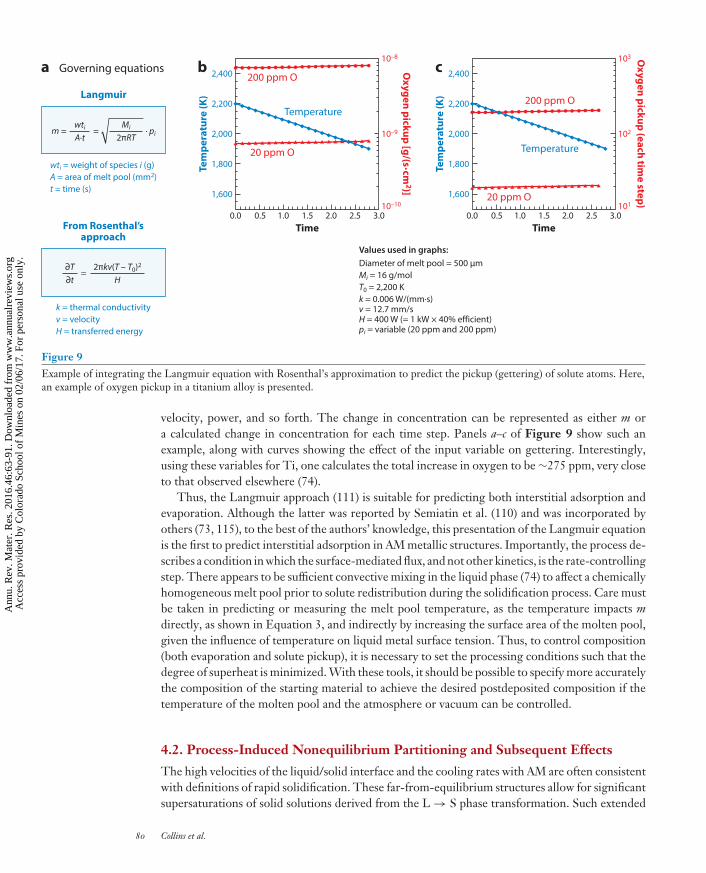
Values used in graphs:Diameter of melt pool = 500 μmMi = 16 g/molT0 = 2,200 Kk = 0.006 W/(mm·s)v = 12.7 mm/sH = 400 W (= 1 kW × 40% efficient)pi = variable (20 ppm and 200 ppm)
b
Temperature
200 ppm O
20 ppm O
Oxygen pickup [g/(s·cm
2)]1,600
0.0 0.5 1.0 1.5 2.0 2.5 3.010–10
10–9
10–8
1,800
2,000
Tem
pera
ture
(K)
Time
2,200
2,400 c
Temperature
20 ppm O
Oxygen pickup (each tim
e step)
1,600
0.0 0.5 1.0 1.5 2.0 2.5 3.0101
102
103
1,800
2,000
Tem
pera
ture
(K)
Time
2,200
2,400
200 ppm O
Figure 9Example of integrating the Langmuir equation with Rosenthal’s approximation to predict the pickup (gettering) of solute atoms. Here,an example of oxygen pickup in a titanium alloy is presented.
velocity, power, and so forth. The change in concentration can be represented as either m ora calculated change in concentration for each time step. Panels a–c of Figure 9 show such anexample, along with curves showing the effect of the input variable on gettering. Interestingly,using these variables for Ti, one calculates the total increase in oxygen to be ∼275 ppm, very closeto that observed elsewhere (74).
Thus, the Langmuir approach (111) is suitable for predicting both interstitial adsorption andevaporation. Although the latter was reported by Semiatin et al. (110) and was incorporated byothers (73, 115), to the best of the authors’ knowledge, this presentation of the Langmuir equationis the first to predict interstitial adsorption in AM metallic structures. Importantly, the process de-scribes a condition in which the surface-mediated flux, and not other kinetics, is the rate-controllingstep. There appears to be sufficient convective mixing in the liquid phase (74) to affect a chemicallyhomogeneous melt pool prior to solute redistribution during the solidification process. Care mustbe taken in predicting or measuring the melt pool temperature, as the temperature impacts mdirectly, as shown in Equation 3, and indirectly by increasing the surface area of the molten pool,given the influence of temperature on liquid metal surface tension. Thus, to control composition(both evaporation and solute pickup), it is necessary to set the processing conditions such that thedegree of superheat is minimized. With these tools, it should be possible to specify more accuratelythe composition of the starting material to achieve the desired postdeposited composition if thetemperature of the molten pool and the atmosphere or vacuum can be controlled.
4.2. Process-Induced Nonequilibrium Partitioning and Subsequent Effects
The high velocities of the liquid/solid interface and the cooling rates with AM are often consistentwith definitions of rapid solidification. These far-from-equilibrium structures allow for significantsupersaturations of solid solutions derived from the L → S phase transformation. Such extended
80 Collins et al.
Ann
u. R
ev. M
ater
. Res
. 201
6.46
:63-
91. D
ownl
oade
d fr
om w
ww
.ann
ualr
evie
ws.
org
Acc
ess
prov
ided
by
Col
orad
o Sc
hool
of
Min
es o
n 02
/06/
17. F
or p
erso
nal u
se o
nly.
MR46CH04-Collins ARI 4 June 2016 12:5
solid solutions offer property benefits. For example, Tomus et al. (99) demonstrated increasedsolid solubility in the Al-2Sc binary system by using an electron beam–based AM approach. Theyshowed a higher level of mechanical properties than could be achieved using a conventionallysolution heat-treated and aged specimen.
Under such far-from-equilibrium conditions, solute trapping can occur. Solute trapping orig-inates at the liquid/solid interface when the velocity of the moving boundary is faster than thediffusivity of the solute atom in the liquid phase (116). According to this solidification modeldeveloped by Aziz (116), the following condition must be satisfied for solute trapping to occur:
V � Dliquidi
a0. 4.
Here V is the interface velocity, a0 is the interatomic spacing during growth, and Dliquidi is the
diffusion coefficient of solute in liquid. V is equivalent to the R described in Section 2.3. If thiscondition is satisfied, solute trapping occurs in the liquid phase and results in extended solidsolubility.
The velocity of the interface, V (or R, or u), is fastest along the maximum thermal gradient (G =|∇T|). By using the relationships given in Section 2.3, the model of Aziz (116) can be rewritten as
V = R = 1|∇T |
∂T∂t
� Dliquidi
a0. 5.
Interestingly, the maximum thermal gradient (typically) occurs in the z-direction due to thefact that the highest heat extraction rate is associated with conduction as opposed to radiationor convection. This high heat extraction rate in the z-direction is directly related to the strongtexture observed in AM materials (i.e., <001> fiber texture ‖ z-direction). Thus, the solutetrapping is expected to be greatest at the bottom of the molten pool. In fact, this solute trappinghas been linked to the microstructure observed in cross section; this microstructure is banded (i.e.,fish scale with regard to the variation of beam directions across layers) and inhomogeneous (18).
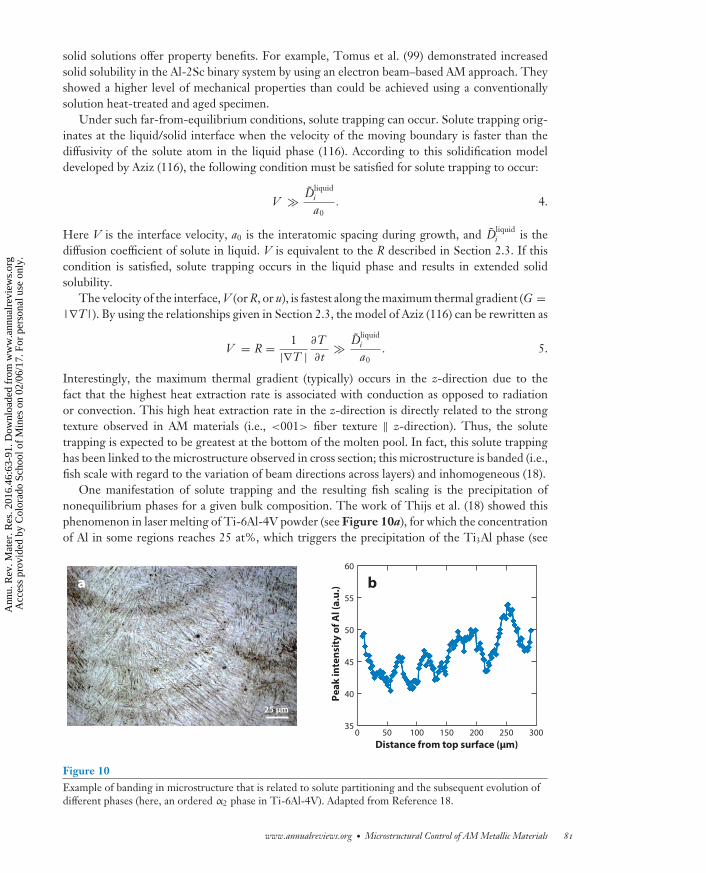
One manifestation of solute trapping and the resulting fish scaling is the precipitation ofnonequilibrium phases for a given bulk composition. The work of Thijs et al. (18) showed thisphenomenon in laser melting of Ti-6Al-4V powder (see Figure 10a), for which the concentrationof Al in some regions reaches 25 at%, which triggers the precipitation of the Ti3Al phase (see
25 μm
a b
Peak
inte
nsit
y of
Al (
a.u.
)
035
40
45
50
55
60
50 100 150Distance from top surface (μm)
200 250 300
Figure 10Example of banding in microstructure that is related to solute partitioning and the subsequent evolution ofdifferent phases (here, an ordered α2 phase in Ti-6Al-4V). Adapted from Reference 18.
www.annualreviews.org • Microstructural Control of AM Metallic Materials 81
Ann
u. R
ev. M
ater
. Res
. 201
6.46
:63-
91. D
ownl
oade
d fr
om w
ww
.ann
ualr
evie
ws.
org
Acc
ess
prov
ided
by
Col
orad
o Sc
hool
of
Min
es o
n 02
/06/
17. F
or p
erso
nal u
se o
nly.
MR46CH04-Collins ARI 4 June 2016 12:5
Figure 10b). Tang et al. (22) observed similar partitioning. The work of Tang et al. showedthat both selective vaporization and solute trapping can lead to more pronounced compositionalvariation across the banded microstructure, which impacts the phase stability of the depositedmaterial.
Although these bands are characteristic of AM deposits and provide evidence of solute trapping,supersaturated solid solutions can exist throughout the deposits. As such extended solid solution isinherently not in equilibrium, the supersaturation decomposes and leads to an ultrafine distributionof precipitates throughout the deposited material. Early work in this area involved Ti-B systems;Banerjee et al. (100, 117) showed that the decomposition of a supersaturated B concentrationresulted in the precipitation of ultrafine Ti-B particles, including some that are 5–10 nm long (100).
5. A FRAMEWORK
Energy density, which incorporates the travel speed and metrics of melt pool geometry, can be con-ceptually related to Rosenthal’s approximation (or a modified approach by Ashby & Easterlingfor a diffuse heat source). Energy density, as described elsewhere in this article, captures ther-mophysical properties (e.g., melting point, heat capacity, and thermal conductivity) as well asthermodynamic parameters (e.g., the enthalpy of mixing for elemental powders). This single termis useful, as it parameterizes processing space and can be related to each of the microstructuralfeatures discussed above. This term is presented as the independent variable for the microstruc-tural features described in this article and is presented as a conceptual framework in Figure 11a.Notably, for some microstructural features (e.g., unmelted particles), there is a minimum energydensity required to avoid/eliminate the formation of that feature, whereas for other variables, therewill be a maximum energy density beyond which features (e.g., hot tearing) may be expected. Someexamples are provided in Figure 11b–d.
5.1. Macro-Level Microstructural Features
With respect to discontinuities, sufficient energy is required to melt all of the input material. Thus,there is a minimum energy density with respect to porosity, unmelted material, and lack of fusion(assuming proper path planning) (see Figure 11b). For some materials, there may exist a maximumenergy density above which microcracks originating from hot tearing occur. Regarding residualstress, the degree of residual stress is related to the degree of input energy, which establishes thethermal field in the liquid and solid material. Texture, which is often observed in AM materials,is related to the thermal gradients in the liquid during solidification. Texture can be modifiedthrough establishing additional heat transport mechanisms or modifying composition.
5.2. Micro-Level Microstructural Features
Although the columnar grain structure dominates the microstructures reported in the AMliterature, various authors have shown that equiaxed grains, cellular-to-equiaxed transitions, orzigzag structures are possible (18, 129). Zigzag structures appear when speed is increased (i.e.,energy density decreases). The presence of equiaxed grains is strongly coupled with composition,most probably through differences in constitutional supercooling. The cellular-to-equiaxedtransition is attributed to multiple heat transfer modes operating or to strong convective forces inthe liquid state. Generally, G (G = |∇T |) is proportional to the input power, and R (R = 1
G∂T∂t ) is
inversely proportional to input power and directly proportional to the velocity of the heat sourcerelative to the substrate. These two parameters govern not only grain morphology (lower energydensity is related to a larger R) but also solute partitioning, supersaturation, and precipitation (see
82 Collins et al.
Ann
u. R
ev. M
ater
. Res
. 201
6.46
:63-
91. D
ownl
oade
d fr
om w
ww
.ann
ualr
evie
ws.
org
Acc
ess
prov
ided
by
Col
orad
o Sc
hool
of
Min
es o
n 02
/06/
17. F
or p
erso
nal u
se o
nly.
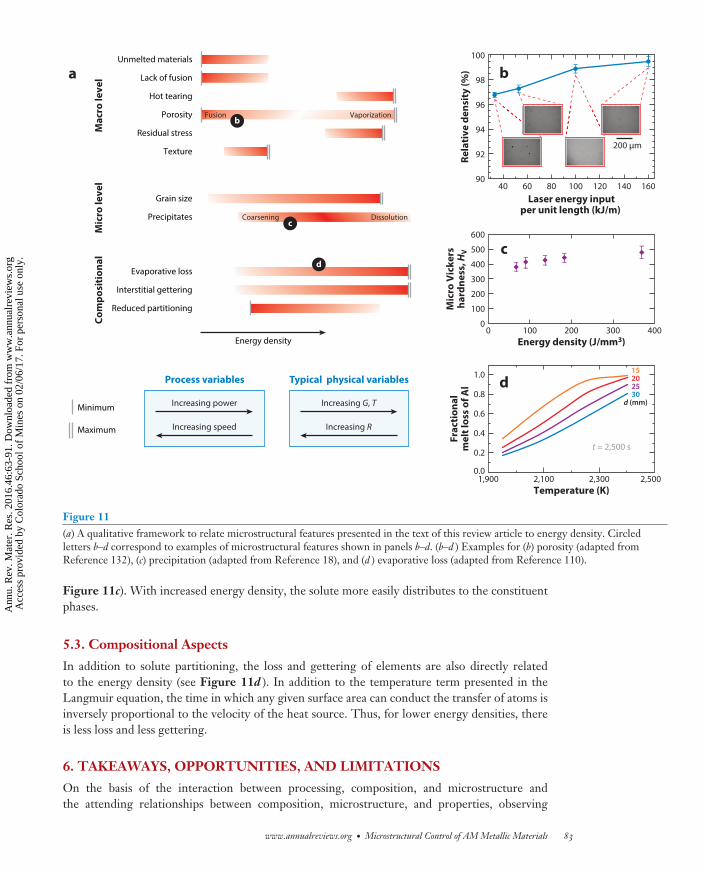
MR46CH04-Collins ARI 4 June 2016 12:5
Energy density
Mac
ro le
vel
Mic
ro le
vel
Com
posi
tion
al
Unmelted materials
Lack of fusion
Hot tearing
Porosity
Residual stress
Texture
Grain size
Precipitates
Evaporative loss
Interstitial gettering
Reduced partitioning
Minimum
Maximum
a b
c
d
Coarsening Dissolution
Fusion Vaporization
4090
92
94
96
98
100
60 80 100Laser energy input
per unit length (kJ/m)
Rela
tive
den
sity
(%)
0
100
200
300
400
500
600
0 100 200 300 400Energy density (J/mm3)
Mic
ro V
icke
rsha
rdne
ss, H
V
120 140 160
200 μm
0.0
0.2
0.4
0.6
0.8
1.0
1,900 2,100
t = 2,500 s
2,300 2,500Temperature (K)
Frac
tion
alm
elt l
oss
of A
l
30d (mm)
252015
Process variables
Increasing power
Increasing speed
Typical physical variables
Increasing G, T
Increasing R
b
c
d
Figure 11(a) A qualitative framework to relate microstructural features presented in the text of this review article to energy density. Circledletters b–d correspond to examples of microstructural features shown in panels b–d. (b–d ) Examples for (b) porosity (adapted fromReference 132), (c) precipitation (adapted from Reference 18), and (d ) evaporative loss (adapted from Reference 110).
Figure 11c). With increased energy density, the solute more easily distributes to the constituentphases.
5.3. Compositional Aspects
In addition to solute partitioning, the loss and gettering of elements are also directly relatedto the energy density (see Figure 11d ). In addition to the temperature term presented in theLangmuir equation, the time in which any given surface area can conduct the transfer of atoms isinversely proportional to the velocity of the heat source. Thus, for lower energy densities, thereis less loss and less gettering.
6. TAKEAWAYS, OPPORTUNITIES, AND LIMITATIONS
On the basis of the interaction between processing, composition, and microstructure andthe attending relationships between composition, microstructure, and properties, observing
www.annualreviews.org • Microstructural Control of AM Metallic Materials 83
Ann
u. R
ev. M
ater
. Res
. 201
6.46
:63-
91. D
ownl
oade
d fr
om w
ww
.ann
ualr
evie
ws.
org
Acc
ess
prov
ided
by
Col
orad
o Sc
hool
of
Min
es o
n 02
/06/
17. F
or p
erso
nal u
se o
nly.
MR46CH04-Collins ARI 4 June 2016 12:5
characteristics common to AM metallic materials is possible. Although the article describes thefundamental underpinnings of these characteristics, it is also possible to suggest strategies bywhich the microstructural features may be controlled and cases in which such control may not bepossible. Such salient connections are made below.
6.1. Microstructural Discontinuities
There is a clear relationship between the process parameters and inhomogeneities. Such discon-tinuities originate within the melt pool or via associated thermal distortions. The opportunity isthat the material-specific thermophysical properties and thermodynamic terms are important andcan be tailored by changing alloys and the nature of the starting material (e.g., prealloyed versuselemental blends). The limitation is the minimum amount of energy required to process a fullydense material. If this minimum energy density exceeds a threshold for another microstructuralfeature (e.g., grain morphology), it will be impossible to produce the desired structure as a fullydense component without altering the process.
6.2. Residual Stress
Methods exist to predict and characterize the residual stress of AM materials. The residual stressgenerally varies from tensile to compressive states within the build. For some materials, the residualstress is sufficient to result in major distortions and microcracking.
6.3. Texture/Grains
A preferential texture is present in many AM metallic structures. This texture is the result ofpreferential growth along the largest temperature gradient. At certain temperature fields andsolidification velocities, it is possible to enter regimes that promote equiaxed structures. Compo-sition does impact the formation and type of texture. The interactions between G, R, and X canbe used to understand and predict microstructures that evolve. The texture is tenacious and im-pacts the mechanical properties. Further research efforts into the influence of composition on theanisotropic liquid/solid interfacial energy and stiffness may lead to strategies to engineer texture(and hence strength) locally. New research into whether substrates can promote epitaxial growthwhen the thermal gradient term is less important. However, to understand G and R, all local meltpool physics must be sufficiently captured.
6.4. Phases
The far-from-equilibrium nature of AM promotes metastable phases in many systems. The sub-sequent thermal cycling due to the deposition of additional layers can result in a spatially varyingmicrostructure, in which the phases present, their size, and their composition may vary. In somesystems, the far-from-equilibrium nature of the process allows highly refined precipitates to beaffected. Such precipitates may be beneficial for certain properties and cannot easily be producedusing conventional approaches. By considering the thermodynamic driving force for a given phasetransformation, as well as the kinetics, it should be possible to engineer phase stability locally bymodifying composition.
84 Collins et al.
Ann
u. R
ev. M
ater
. Res
. 201
6.46
:63-
91. D
ownl
oade
d fr
om w
ww
.ann
ualr
evie
ws.
org
Acc
ess
prov
ided
by
Col
orad
o Sc
hool
of
Min
es o
n 02
/06/
17. F
or p
erso
nal u
se o
nly.

MR46CH04-Collins ARI 4 June 2016 12:5
6.5. Compositional Variation
AM processes induce both bulk and local compositional variations. Bulk variation includes bothpreferential loss of volatile species and gettering of interstitial elements. Such variation necessitatesa rethinking of compositional certification for end-use AM processes, for which the compositionalcertification falls, in part, to the supplier of the component. However, compositional variation canbe predicted on the basis of the Langmuir equation by considering flux of atoms at the surfaceof the molten pool. The local compositional variation is related to the solidification process andcan result in compositionally inhomogeneous materials. In addition, and importantly, the abilityto control the feed rate of the incoming material means that composition can be independentlycontrolled in a spatial manner. Such an engineered bulk compositional variation allows for localtailoring of composition, microstructure, and properties (102, 118–125).
SUMMARY POINTS
1. The hierarchical nature of a microstructure can be understood by considering the evolu-tion of the thermal fields with respect to time and position. The hierarchical microstruc-ture includes discontinuities, residual stress, texture, and grain size or morphology.
2. Texture can be controlled by varying both processing and composition.
3. The bulk compositional variation from the starting material feedstock can be understoodby considering mass transport at the liquid/environment (e.g., air, inert atmosphere,vacuum) interface.
4. The compositional variation in the melt pool, and consequently the resulting phasesthat form in the microstructure, may be understood by considering partitioning. Boththe solute partitioning and the resulting phase variation can be attributed to macroscalediscontinuities, including specifically the fish-scale effect.
5. Where current literature on AM is far from complete, fundamentals of solidification andwelding provide valuable information.
6. Modeling approaches exist to accommodate many, but not all, aspects of AM. The degreeof completeness is related to the details of the specific AM process.
FUTURE ISSUES
1. As discussed above, the AM process is inherently a highly localized solidification process.The preponderance of peer-reviewed literature considers the microstructure in eitherthe postprocessed state or the postprocessed and heat-treated state. This is due to thedearth of sophisticated characterization tools for characterizing the material in real time(i.e., during deposition).
2. Advanced techniques, including synchrotron diffraction, are required to understand theevolution of microstructure during AM. Research conducted using such tools is expectedto provide tremendous insights into AM and to validate models.
3. Multisignal real-time process monitoring is required to capture indications of themacroscale discontinuities. It may be possible to also capture indications of texture de-velopment by using real-time process monitoring.
www.annualreviews.org • Microstructural Control of AM Metallic Materials 85
Ann
u. R
ev. M
ater
. Res
. 201
6.46
:63-
91. D
ownl
oade
d fr
om w
ww
.ann
ualr
evie
ws.
org
Acc
ess
prov
ided
by
Col
orad
o Sc
hool
of
Min
es o
n 02
/06/
17. F
or p
erso
nal u
se o
nly.
MR46CH04-Collins ARI 4 June 2016 12:5
4. The ability to accurately predict thermal fields and thereby control composition or mi-crostructure in a part should enable location-specific properties to be engineered intounitized structures.
5. As noted in Section 1, this article excludes any discussion of the influence of input ma-terial characteristics (e.g., particle size, size distribution, morphology) on the resultingmicrostructure. This lack of discussion is partially due to the numerous approaches usedto characterize the powder and the absence of an accepted set of metrics for powder forAM.
DISCLOSURE STATEMENT
The authors are not aware of any affiliations, memberships, funding, or financial holdings thatmight be perceived as affecting the objectivity of this review.
ACKNOWLEDGMENTS
The authors gratefully acknowledge support given during the preparation of this review fromNational Science Foundation grant 1435872 (“DMREF/Collaborative Research: Collaborationto Accelerate the Discovery of New Alloys for Additive Manufacturing”), National Science Foun-dation grant 1134873 (“I/UCRC for Advanced Non-Ferrous Structural Alloys”), and DARPAcontract HR0011-12-C-0035 (“An Open Manufacturing Environment for Titanium Fabrica-tion”). The authors also gratefully acknowledge technical discussions among individuals at AmesLaboratory. The views, opinions, and/or findings expressed are those of the author(s) and shouldnot be interpreted as representing the official views or policies of the Department of Defense orthe US Government.
LITERATURE CITED
1. Frazier WE. 2014. Metal additive manufacturing: a review. J. Mater. Eng. Perform. 23:1917–282. Melchels FP, Domingos MA, Klein TJ, Malda J, Bartolo PJ, Hutmacher DW. 2012. Additive manufac-
turing of tissues and organs. Prog. Polym. Sci. 37:1079–1043. Vaezi M, Seitz H, Yang S. 2013. A review on 3D micro-additive manufacturing technologies. Int. J. Adv.
Manuf. Technol. 67:1721–544. Bikas H, Stavropoulos P, Chryssolouris G. 2015. Additive manufacturing methods and modelling ap-
proaches: a critical review. Int. J. Adv. Manuf. Technol. 83:389–4055. Denlinger ER, Irwin J, Michaleris P. 2014. Thermomechanical modeling of additive manufacturing
large parts. J. Manuf. Sci. Eng. 136:0610076. Michaleris P. 2014. Modeling metal deposition in heat transfer analyses of additive manufacturing pro-
cesses. Finite Elem. Anal. Des. 86:51–607. Zhang L, Michaleris P. 2004. Investigation of Lagrangian and Eulerian finite element methods for
modeling the laser forming process. Finite Elem. Anal. Des. 40:383–4058. Ding J, Colegrove P, Mehnen J, Williams S, Wang F, Almeida PS. 2014. A computationally efficient
finite element model of wire and arc additive manufacture. Int. J. Adv. Manuf. Technol. 70:227–369. Pinkerton AJ, Li L. 2004. Modelling the geometry of a moving laser melt pool and deposition track via
energy and mass balances. J. Phys. D 37:1885–95
10. Provides details ofmelt pool physics,including theimportance of thevapor, in additivemanufacturing.
10. Zhao J, Zhang B, Li X, Li R. 2015. Effects of metal-vapor jet force on the physical behaviorof melting wire transfer in electron beam additive manufacturing. J. Mater. Process. Technol.220:243–50
86 Collins et al.
Ann
u. R
ev. M
ater
. Res
. 201
6.46
:63-
91. D
ownl
oade
d fr
om w
ww
.ann
ualr
evie
ws.
org
Acc
ess
prov
ided
by
Col
orad
o Sc
hool
of
Min
es o
n 02
/06/
17. F
or p
erso
nal u
se o
nly.
MR46CH04-Collins ARI 4 June 2016 12:5
11. Han L, Liou FW, Musti S. 2005. Thermal behavior and geometry model of melt pool in laser materialprocess. J. Heat Transf. 127:1005–14
12. Pinkerton A, Li L. 2004. An analytical model of energy distribution in laser direct metal deposition. Proc.Inst. Mech. Eng. B 218:363–74
13. Zhou X, Wang D, Liu X, Zhang D, Qu S, et al. 2015. 3D-imaging of selective laser melting defects in aCo–Cr–Mo alloy by synchrotron radiation micro-CT. Acta Mater. 98:1–16
14. Heinl P, Muller L, Korner C, Singer RF, Muller FA. 2008. Cellular Ti–6Al–4V structures with intercon-nected macro porosity for bone implants fabricated by selective electron beam melting. Acta Biomater.4:1536–44
15. Attar H, Lober L, Funk A, Calin M, Zhang L, et al. 2015. Mechanical behavior of porous commerciallypure Ti and Ti–TiB composite materials manufactured by selective laser melting. Mater. Sci. Eng. A625:350–56
16. Sears JW. 2002. The effects of processing parameters on microstructure and properties of laser deposited PM alloy690N2 powder. Rep., Lockheed Martin
17. Collins PC. 2004. A combinatorial approach to the development of composition-microstructure-property rela-tionships in titanium alloys using directed laser deposition. PhD Thesis, Dep. Mater. Sci. Eng., Ohio StateUniv.
18. Discusses unusualmicrostructuralfeatures, including thezigzag pattern.
18. Thijs L, Verhaeghe F, Craeghs T, Van Humbeeck J, Kruth J-P. 2010. A study of the microstruc-tural evolution during selective laser melting of Ti–6Al–4V. Acta Mater. 58:3303–12
19. Sun H, Flores K. 2010. Microstructural analysis of a laser-processed Zr-based bulk metallic glass. Metall.Mater. Trans. A 41:1752–57
20. Vandenbroucke B, Kruth J-P. 2007. Selective laser melting of biocompatible metals for rapid manufac-turing of medical parts. Rapid Prototyp. J. 13:196–203
21. Chlebus E, Kuznicka B, Dziedzic R, Kurzynowski T. 2015. Titanium alloyed with rhenium by selectivelaser melting. Mater. Sci. Eng. A 620:155–63
22. Tang H, Yang G, Jia W, He W, Lu S, Qian M. 2015. Additive manufacturing of a high niobium-containing titanium aluminide alloy by selective electron beam melting. Mater. Sci. Eng. A 636:103–7
23. Schwendner KI, Banerjee R, Collins PC, Brice CA, Fraser HL. 2001. Direct laser deposition of alloysfrom elemental powder blends. Scr. Mater. 45:1123–29
24. Collins P, Banerjee R, Fraser H. 2003. The influence of the enthalpy of mixing during the laser depositionof complex titanium alloys using elemental blends. Scr. Mater. 48:1445–50
25. Qiu C, Adkins NJ, Attallah MM. 2013. Microstructure and tensile properties of selectively laser-meltedand of HIPed laser-melted Ti–6Al–4V. Mater. Sci. Eng. A 578:230–39
26. Panwisawas C, Qiu C, Sovani Y, Brooks J, Attallah M, Basoalto H. 2015. On the role of thermal fluiddynamics into the evolution of porosity during selective laser melting. Scr. Mater. 105:14–17
27. Gong H, Rafi K, Gu H, Starr T, Stucker B. 2014. Analysis of defect generation in Ti–6Al–4V parts madeusing powder bed fusion additive manufacturing processes. Addit. Manuf. 1:87–98
28. Attar H, Calin M, Zhang L, Scudino S, Eckert J. 2014. Manufacture by selective laser melting andmechanical behavior of commercially pure titanium. Mater. Sci. Eng. A 593:170–77
29. Agarwala M, Bourell D, Beaman J, Marcus H, Barlow J. 1995. Direct selective laser sintering of metals.Rapid Prototyp. J. 1:26–36
30. Yadroitsev I, Bertrand P, Smurov I. 2007. Parametric analysis of the selective laser melting process. Appl.Surf. Sci. 253:8064–69
31. Zekovic S, Dwivedi R, Kovacevic R. 2007. Numerical simulation and experimental investigation of gas–powder flow from radially symmetrical nozzles in laser-based direct metal deposition. Int. J. Mach. ToolsManuf. 47:112–23
32. Petrov P, Georgiev C, Petrov G. 1998. Experimental investigation of weld pool formation in electronbeam welding. Vacuum 51:339–43
33. Khairallah SA, Anderson A. 2014. Mesoscopic simulation model of selective laser melting of stainlesssteel powder. J. Mater. Process. Technol. 214:2627–36
34. King WE, Barth HD, Castillo VM, Gallegos GF, Gibbs JW, et al. 2014. Observation of keyhole-modelaser melting in laser powder-bed fusion additive manufacturing. J. Mater. Process. Technol. 214:2915–25
www.annualreviews.org • Microstructural Control of AM Metallic Materials 87
Ann
u. R
ev. M
ater
. Res
. 201
6.46
:63-
91. D
ownl
oade
d fr
om w
ww
.ann
ualr
evie
ws.
org
Acc
ess
prov
ided
by
Col
orad
o Sc
hool
of
Min
es o
n 02
/06/
17. F
or p
erso
nal u
se o
nly.
MR46CH04-Collins ARI 4 June 2016 12:5
35. Gu D, Meiners W, Wissenbach K, Poprawe R. 2012. Laser additive manufacturing of metallic compo-nents: materials, processes and mechanisms. Int. Mater. Rev. 57:133–64
36. Brandl E, Schoberth A, Leyens C. 2012. Morphology, microstructure, and hardness of titanium (Ti-6Al-4V) blocks deposited by wire-feed additive layer manufacturing (ALM). Mater. Sci. Eng. A 532:295–307
37. Sochalski-Kolbus L, Payzant E, Cornwell P, Watkins T, Babu S, et al. 2015. Comparison of residualstresses in Inconel 718 simple parts made by electron beam melting and direct laser metal sintering.Metall. Mater. Trans. A 46:1419–32
38. Observes residualstresses in differentmetallic systems.
38. Denlinger ER, Heigel JC, Michaleris P, Palmer T. 2015. Effect of inter-layer dwell time ondistortion and residual stress in additive manufacturing of titanium and nickel alloys. J. Mater.Process. Technol. 215:123–31
39. Mercelis P, Kruth J-P. 2006. Residual stresses in selective laser sintering and selective laser melting.Rapid Prototyp. J. 12:254–65
40. Vilaro T, Colin C, Bartout J-D, Naze L, Sennour M. 2012. Microstructural and mechanical approachesof the selective laser melting process applied to a nickel-base superalloy. Mater. Sci. Eng. A 534:446–51
41. Brice CA, Hofmeister WH. 2013. Determination of bulk residual stresses in electron beam additive-manufactured aluminum. Metall. Mater. Trans. A 44:5147–53
42. Roberts IA, Wang CJ, Esterlein R, Stanford M, Mynors DJ. 2009. A three-dimensional finite elementanalysis of the temperature field during laser melting of metal powders in additive layer manufacturing.Int. J. Mach. Tools Manuf. 49:916–23
43. Withers P, Bhadeshia H. 2001. Residual stress. Part 1. Measurement techniques. Mater. Sci. Technol.17:355–65
44. Withers P, Bhadeshia H. 2001. Residual stress. Part 2. Nature and origins. Mater. Sci. Technol. 17:366–75
45. Modifies grainsize/morphologythrough compositionalvariation influencingconstitutionalsupercooling.
45. Bermingham MJ, Kent D, Zhan H, StJohn DH, Dargusch MS. 2015. Controlling the microstruc-ture and properties of wire arc additive manufactured Ti–6Al–4V with trace boron additions.Acta Mater. 91:289–303
46. Vilaro T, Colin C, Bartout J-D. 2011. As-fabricated and heat-treated microstructures of the Ti-6Al-4Valloy processed by selective laser melting. Metall. Mater. Trans. A 42:3190–99
47. Wu X, Sharman R, Mei J, Voice W. 2002. Direct laser fabrication and microstructure of a burn-resistantTi alloy. Mater. Des. 23:239–47
48. Qiu C, Ravi G, Attallah MM. 2015. Microstructural control during direct laser deposition of a β-titaniumalloy. Mater. Des. 81:21–30
49. Kunze K, Etter T, Grasslin J, Shklover V. 2015. Texture, anisotropy in microstructure and mechanicalproperties of IN738LC alloy processed by selective laser melting (SLM). Mater. Sci. Eng. A 620:213–22
50. Dinda G, Dasgupta A, Mazumder J. 2012. Texture control during laser deposition of nickel-basedsuperalloy. Scr. Mater. 67:503–6
51. Bi G, Sun C-N, Chen H-c, Ng FL, Ma CCK. 2014. Microstructure and tensile properties of superalloyIN100 fabricated by micro-laser aided additive manufacturing. Mater. Des. 60:401–8
52. Joseph J, Jarvis T, Wu X, Stanford N, Hodgson P, Fabijanic DM. 2015. Comparative study of themicrostructures and mechanical properties of direct laser fabricated and arc-melted AlxCoCrFeNi highentropy alloys. Mater. Sci. Eng. A 633:184–93
53. Sun S-H, Koizumi Y, Kurosu S, Li Y-P, Matsumoto H, Chiba A. 2014. Build direction dependence ofmicrostructure and high-temperature tensile property of Co–Cr–Mo alloy fabricated by electron beammelting. Acta Mater. 64:154–68
54. Chalmers B. 1964. Principles of Solidification. New York: Wiley55. Morris L, Winegard W. 1969. Segregation and morphology of cells during freezing. J. Inst. Met. 97:220–
2256. Flemings MC. 1974. Solidification processing. Metall. Trans. 5:2121–3457. Ferry M. 2006. Direct Strip Casting of Metals and Alloys: Processing, Microstructure and Properties. Cam-
bridge, UK: Woodhead58. Liu J, Davidchack R, Dong H. 2013. Molecular dynamics calculation of solid–liquid interfacial free
energy and its anisotropy during iron solidification. Comput. Mater. Sci. 74:92–100
88 Collins et al.
Ann
u. R
ev. M
ater
. Res
. 201
6.46
:63-
91. D
ownl
oade
d fr
om w
ww
.ann
ualr
evie
ws.
org
Acc
ess
prov
ided
by
Col
orad
o Sc
hool
of
Min
es o
n 02
/06/
17. F
or p
erso
nal u
se o
nly.
MR46CH04-Collins ARI 4 June 2016 12:5
59. Boettinger W, Coriell S, Greer A, Karma A, Kurz W, et al. 2000. Solidification microstructures: recentdevelopments, future directions. Acta Mater. 48:43–70
60. Henry S. 1943. Study of the nucleation and growth of feathery grains in aluminum alloys. PhD Thesis, EPFL61. Henry S, Rappaz M. 2000. Twinned feathery grains and related morphologies in aluminum alloys. Proc.
Mater. Sci. Forum 329:65–7262. Liu C-M, Wang H-M, Tian X-J, Tang H-B, Liu D. 2013. Microstructure and tensile properties of laser
melting deposited Ti–5Al–5Mo–5V–1Cr–1Fe near β titanium alloy. Mater. Sci. Eng. A 586:323–2963. Ren H, Liu D, Tang H, Tian X, Zhu Y, Wang H. 2014. Microstructure and mechanical properties of a
graded structural material. Mater. Sci. Eng. A 611:362–6964. Bontha S, Klingbeil NW, Kobryn PA, Fraser HL. 2009. Effects of process variables and size-scale
on solidification microstructure in beam-based fabrication of bulky 3D structures. Mater. Sci. Eng. A513:311–18
65. Davis JE, Klingbeil NW, Bontha S. 2009. Effect of free-edges on melt pool geometry and solidificationmicrostructure in beam-based fabrication of thin-wall structures. In Proc. Solid Freeform FabricationSymposium, pp. 320–31
66. Davis JE, Klingbeil NW, Bontha S. 2009. Effect of free-edges on melt pool geometry and solidificationmicrostructure in beam-based fabrication of bulky 3-D structures. In Proc. Solid Freeform FabricationSymposium, pp. 230–41
67. Kobryn P, Semiatin S. 2003. Microstructure and texture evolution during solidification processing ofTi–6Al–4V. J. Mater. Process. Technol. 135:330–39
68. Fukumoto S, Kurz W. 1999. Solidification phase and microstructure selection maps for Fe-Cr-Ni alloys.ISIJ Int. 39:1270–79
69. Hunziker O, Vandyoussefi M, Kurz W. 1998. Phase and microstructure selection in peritectic alloysclose to the limit of constitutional undercooling. Acta Mater. 46:6325–36
70. Klingbeil N, Bontha S, Brown C, Gaddam D, Kobryn P, et al. 2004. Effects of process variables and sizescale on solidification microstructure in laser-based solid freeform fabrication of Ti-6Al-4V. Doc., DTIC
71. Yin H, Felicelli S. 2010. Dendrite growth simulation during solidification in the LENS process. ActaMater. 58:1455–65
72. Kobryn P, Semiatin S. 2001. Mechanical properties of laser-deposited Ti-6Al-4V. In Proc. Solid FreeformFabrication Symposium, pp. 6–8
73. Collins P, Haden C, Ghamarian I, Hayes B, Ales T, et al. 2014. Progress toward an integration of process–structure–property–performance models for “three-dimensional (3-D) printing” of titanium alloys. JOM66:1299–309
74. Carroll BE, Palmer TA, Beese AM. 2015. Anisotropic tensile behavior of Ti–6Al–4V components fab-ricated with directed energy deposition additive manufacturing. Acta Mater. 87:309–20
75. Jiang W, Guan H, Hu Z. 1999. Effects of heat treatment on microstructures and mechanical propertiesof a directionally solidified cobalt-base superalloy. Mater. Sci. Eng. A 271:101–8
76. Shows deposition ofa low-modulus metallicalloy for potentialincorporation intobiomedical implants.
76. Banerjee R, Nag S, Samuel S, Fraser H. 2006. Laser-deposited Ti-Nb-Zr-Ta orthopedic alloys.J. Biomed. Mater. Res. A 78:298–305
77. Nag S, Samuel S, Puthucode A, Banerjee R. 2009. Characterization of novel borides in Ti–Nb–Zr–Ta+ 2B metal-matrix composites. Mater. Charact. 60:106–13
78. Bermingham M, McDonald S, Dargusch M, StJohn D. 2008. Grain-refinement mechanisms in titaniumalloys. J. Mater. Res. 23:97–104
79. Wang T, Zhu Y, Zhang S, Tang H, Wang H. 2015. Grain morphology evolution behavior of titaniumalloy components during laser melting deposition additive manufacturing. J. Alloys Compd. 632:505–13
80. Taminger KM, Hafley RA. 2003. Electron beam freeform fabrication: a rapid metal deposition process.In Proc. 3rd Annual Automotive Composites Conference, pp. 9–10
81. Spittle J. 2006. Columnar to equiaxed grain transition in as solidified alloys. Int. Mater. Rev. 51:247–6982. Bermingham M, McDonald S, StJohn D, Dargusch M. 2009. Beryllium as a grain refiner in titanium
alloys. J. Alloys Compd. 481:L20–2383. Easton M, StJohn D. 2001. A model of grain refinement incorporating alloy constitution and potency
of heterogeneous nucleant particles. Acta Mater. 49:1867–78
www.annualreviews.org • Microstructural Control of AM Metallic Materials 89
Ann
u. R
ev. M
ater
. Res
. 201
6.46
:63-
91. D
ownl
oade
d fr
om w
ww
.ann
ualr
evie
ws.
org
Acc
ess
prov
ided
by
Col
orad
o Sc
hool
of
Min
es o
n 02
/06/
17. F
or p
erso
nal u
se o
nly.
MR46CH04-Collins ARI 4 June 2016 12:5
84. StJohn D, Prasad A, Easton M, Qian M. 2015. The contribution of constitutional supercooling tonucleation and grain formation. Metall. Mater. Trans. A 46:4868–85
85. Kurz W, Bezencon C, Gaumann M. 2001. Columnar to equiaxed transition in solidification processing.Sci. Technol. Adv. Mater. 2:185–91
86. Wang F, Mei J, Wu X. 2006. Microstructure study of direct laser fabricated Ti alloys using powder andwire. Appl. Surf. Sci. 253:1424–30
87. Bryan DJ. 2002. Development of a burn-resistant titanium alloy through the laser deposition of elementallyblended powders. Thesis, Dep. Mater. Sci. Eng., Ohio State Univ.
88. Dehoff RR, Kirka MM, Sames WJ, Bilheux H, Tremsin AS, et al. 2015. Site specific control of crystallo-graphic grain orientation through electron beam additive manufacturing. Mater. Sci. Technol. 31:931–38
89. Wu X, Xu B, Hong Y. 2002. Synthesis of thick Ni66Cr5Mo4Zr6P15B4 amorphous alloy coating andlarge glass-forming ability by laser cladding. Mater. Lett. 56:838–41
90. Reports on theefforts to depositbulk-metallic glassesusing additivemanufacturing.
90. Sun H, Flores K. 2008. Laser deposition of a Cu-based metallic glass powder on a Zr-based glasssubstrate. J. Mater. Res. 23:2692–703
91. Yang G, Lin X, Liu F, Hu Q, Ma L, et al. 2012. Laser solid forming Zr-based bulk metallic glass.Intermetallics 22:110–15
92. Xu W, Brandt M, Sun S, Elambasseril J, Liu Q, et al. 2015. Additive manufacturing of strong and ductileTi–6Al–4V by selective laser melting via in situ martensite decomposition. Acta Mater. 85:74–84
93. Ma Y, Cuiuri D, Hoye N, Li H, Pan Z. 2015. The effect of location on the microstructure and mechanicalproperties of titanium aluminides produced by additive layer manufacturing using in-situ alloying andgas tungsten arc welding. Mater. Sci. Eng. A 631:230–40
94. Wang F, Williams S, Colegrove P, Antonysamy AA. 2013. Microstructure and mechanical properties ofwire and arc additive manufactured Ti-6Al-4V. Metall. Mater. Trans. A 44:968–77
95. Dinda G, Dasgupta A, Mazumder J. 2009. Laser aided direct metal deposition of Inconel 625 superalloy:microstructural evolution and thermal stability. Mater. Sci. Eng. A 509:98–104
96. Nahmany M, Rosenthal I, Benishti I, Frage N, Stern A. 2015. Electron beam welding of AlSi10Mgworkpieces produced by selected laser melting additive manufacturing technology. Addit. Manuf. 8:63–70
97. Amato K, Gaytan S, Murr L, Martinez E, Shindo P, et al. 2012. Microstructures and mechanical behaviorof Inconel 718 fabricated by selective laser melting. Acta Mater. 60:2229–39
98. Murr L, Martinez E, Pan X, Gaytan S, Castro J, et al. 2013. Microstructures of Rene 142 nickel-basedsuperalloy fabricated by electron beam melting. Acta Mater. 61:4289–96
99. Extends solid-solution and reducedpartitioning in additivemanufacturing,resulting in highlyrefined precipitates.
99. Tomus D, Qian M, Brice CA, Muddle BC. 2010. Electron beam processing of Al–2Sc alloy forenhanced precipitation hardening. Scr. Mater. 63:151–54
100. Banerjee R, Genc A, Hill D, Collins P, Fraser H. 2005. Nanoscale TiB precipitates in laser depositedTi-matrix composites. Scr. Mater. 53:1433–37
101. Brice C, Fraser H. 2003. Characterization of Ti-Al-Er alloy produced via direct laser deposition.J. Mater. Sci. 38:1517–21
102. Banerjee R, Bhattacharyya D, Collins P, Viswanathan G, Fraser H. 2004. Precipitation of grain boundaryα in a laser deposited compositionally graded Ti–8Al–xV alloy—an orientation microscopy study. ActaMater. 52:377–85
103. Ramirez D, Murr L, Martinez E, Hernandez D, Martinez J, et al. 2011. Novel precipitate–microstructuralarchitecture developed in the fabrication of solid copper components by additive manufacturing usingelectron beam melting. Acta Mater. 59:4088–99
104. Vrancken B, Thijs L, Kruth J-P, Van Humbeeck J. 2014. Microstructure and mechanical properties ofa novel β titanium metallic composite by selective laser melting. Acta Mater. 68:150–58
105. Nag S, Banerjee R, Stechschulte J, Fraser H. 2005. Comparison of microstructural evolution in Ti-Mo-Zr-Fe and Ti-15Mo biocompatible alloys. J. Mater. Sci. Mater. Med. 16:679–85
106. Banerjee R, Nag S, Fraser H. 2005. A novel combinatorial approach to the development of beta titaniumalloys for orthopaedic implants. Mater. Sci. Eng. C 25:282–89
107. Powell A, Pal U, Van Den Avyle J, Damkroger B, Szekely J. 1997. Analysis of multicomponent evapo-ration in electron beam melting and refining of titanium alloys. Metall. Mater. Trans. B 28:1227–39
90 Collins et al.
Ann
u. R
ev. M
ater
. Res
. 201
6.46
:63-
91. D
ownl
oade
d fr
om w
ww
.ann
ualr
evie
ws.
org
Acc
ess
prov
ided
by
Col
orad
o Sc
hool
of
Min
es o
n 02
/06/
17. F
or p
erso
nal u
se o
nly.
MR46CH04-Collins ARI 4 June 2016 12:5
108. Gaytan S, Murr L, Medina F, Martinez E, Lopez M, Wicker R. 2009. Advanced metal powder basedmanufacturing of complex components by electron beam melting. Mater. Sci. Technol. 24:180–90
109. Sato Y, Kuwana T. 1995. Oxygen absorption in iron and steel weld metal. ISIJ Int. 35:1162–69110. Semiatin S, Ivanchenko V, Ivasishin O. 2004. Diffusion models for evaporation losses during electron-
beam melting of alpha/beta-titanium alloys. Metall. Mater. Trans. B 35:235–45110. Derives theLangmuir equation.
111. Langmuir I. 1913. The vapor pressure of metallic tungsten. Phys. Rev. 2:329–42112. Kelly S, Kampe S. 2004. Microstructural evolution in laser-deposited multilayer Ti-6Al-4V builds. Part
II. Thermal modeling. Metall. Mater. Trans. A 35:1869–79113. Hofmeister W, Griffith M. 2001. Solidification in direct metal deposition by LENS processing. JOM
53:30–34114. DuPont J. 1996. Solidification of an alloy 625 weld overlay. Metall. Mater. Trans. A 27:3612–20115. Yu C. 2014. Ti powder sintering: impurity, sintering atmosphere and alloy design. PhD Thesis, Dep. Chem.
Mater. Eng., Univ. Auckland116. Discusses soluteredistribution duringrapid solidification,which has a strong tie toadditive manufacturing.
116. Aziz M. 1982. Model for solute redistribution during rapid solidification. J. Appl. Phys. 53:1158–68
117. Banerjee R, Collins PC, Fraser HL. 2002. Laser deposition of in situ Ti–TiB composites. Adv. Eng.Mater. 4:847–51
118. Banerjee R, Collins P, Bhattacharyya D, Banerjee S, Fraser H. 2003. Microstructural evolution in laserdeposited compositionally graded α/β titanium-vanadium alloys. Acta Mater. 51:3277–92
119. Collins P, Banerjee R, Banerjee S, Fraser H. 2003. Laser deposition of compositionally graded titanium–vanadium and titanium–molybdenum alloys. Mater. Sci. Eng. A 352:118–28
120. Samimi P, Liu Y, Ghamarian I, Collins P. 2014. A novel tool to assess the influence of alloy compositionon the oxidation behavior and concurrent oxygen-induced phase transformations for binary Ti–xMoalloys at 650◦C. Corros. Sci. 89:295–306
121. Samimi P, Liu Y, Ghamarian I, Song J, Collins P. 2014. New observations of a nanoscaled pseudomorphicbcc Co phase in bulk Co–Al–(W, Ta) superalloys. Acta Mater. 69:92–104
122. Samimi P, Liu Y, Ghamarian I, Brice DA, Collins PC. 2015. A new combinatorial approach to assessthe influence of alloy composition on the oxidation behavior and concurrent oxygen-induced phasetransformations for binary Ti–xCr alloys at 650◦C. Corros. Sci. 97:150–60
123. Lin X, Yue T, Yang H, Huang W. 2005. Laser rapid forming of SS316L/Rene88DT graded material.Mater. Sci. Eng. A 391:325–36
124. Lin X, Yue T, Yang H, Huang W. 2006. Microstructure and phase evolution in laser rapid forming of afunctionally graded Ti–Rene88DT alloy. Acta Mater. 54:1901–15
125. Liang Y-J, Liu D, Wang H-M. 2014. Microstructure and mechanical behavior of commercial purityTi/Ti–6Al–2Zr–1Mo–1V structurally graded material fabricated by laser additive manufacturing. Scr.Mater. 74:80–83
126. Liu J, Li L. 2005. Effects of powder concentration distribution on fabrication of thin-wall parts in coaxiallaser cladding. Opt. Laser Technol. 37:287–92
127. Thompson SM, Bian L, Shamsaei N, Yadollahi A. 2015. An overview of direct laser deposition foradditive manufacturing. Part I. Transport phenomena, modeling and diagnostics. Addit. Manuf. 8:36–62
128. Das S. 2003. Physical aspects of process control in selective laser sintering of metals. Adv. Eng. Mater.5:701–11
129. Antonysamy A, Meyer J, Prangnell P. 2013. Effect of build geometry on the β-grain structure and texturein additive manufacture of Ti–6Al–4V by selective electron beam melting. Mater. Charact. 84:153–68
130. Pogson S, Fox P, O’Neill W, Sutcliffe CJ. 2004. The direct metal laser remelting of copper and toolsteel powders. Mater. Sci. Eng. A 386:453–59
131. Wang F, Williams S, Rush M. 2001. Morphology investigation on direct current pulsed gas tungstenarc welded additive layer manufactured Ti6Al4V alloy. Int. J. Adv. Manuf. Technol. 57:597–603
132. Hong C, Gu D, Dai D, Alkhayat M, Urban W, et al. 2015. Laser additive manufacturing of ultra-fine TiC particle reinforced Inconel 625 based composite parts: tailored microstructures and enhancedperformance. Mater. Sci. Eng. A 635:118–28
www.annualreviews.org • Microstructural Control of AM Metallic Materials 91
Ann
u. R
ev. M
ater
. Res
. 201
6.46
:63-
91. D
ownl
oade
d fr
om w
ww
.ann
ualr
evie
ws.
org
Acc
ess
prov
ided
by
Col
orad
o Sc
hool
of
Min
es o
n 02
/06/
17. F
or p
erso
nal u
se o
nly.
MR46-FrontMatter ARI 4 June 2016 9:17
Annual Review ofMaterials Research
Volume 46, 2016Contents
Materials Issues in Additive Manufacturing (Richard LeSar & Don Lipkin,Editors)
Perspectives on Additive ManufacturingDavid L. Bourell � � � � � � � � � � � � � � � � � � � � � � � � � � � � � � � � � � � � � � � � � � � � � � � � � � � � � � � � � � � � � � � � � � � � � � � � � � � � � � � � 1
Ceramic Stereolithography: Additive Manufacturing for Ceramics byPhotopolymerizationJohn W. Halloran � � � � � � � � � � � � � � � � � � � � � � � � � � � � � � � � � � � � � � � � � � � � � � � � � � � � � � � � � � � � � � � � � � � � � � � � � � � � �19
Additive Manufacturing of Hybrid CircuitsPylin Sarobol, Adam Cook, Paul G. Clem, David Keicher, Deidre Hirschfeld,
Aaron C. Hall, and Nelson S. Bell � � � � � � � � � � � � � � � � � � � � � � � � � � � � � � � � � � � � � � � � � � � � � � � � � � � � � � � �41
Microstructural Control of Additively Manufactured Metallic MaterialsP.C. Collins, D.A. Brice, P. Samimi, I. Ghamarian, and H.L. Fraser � � � � � � � � � � � � � � � � � � � �63
Multiscale Modeling of Powder Bed–Based Additive ManufacturingMatthias Markl and Carolin Korner � � � � � � � � � � � � � � � � � � � � � � � � � � � � � � � � � � � � � � � � � � � � � � � � � � � � � � � � �93
Epitaxy and Microstructure Evolution in Metal AdditiveManufacturingAmrita Basak and Suman Das � � � � � � � � � � � � � � � � � � � � � � � � � � � � � � � � � � � � � � � � � � � � � � � � � � � � � � � � � � � � � 125
Metal Additive Manufacturing: A Review of Mechanical PropertiesJohn J. Lewandowski and Mohsen Seifi � � � � � � � � � � � � � � � � � � � � � � � � � � � � � � � � � � � � � � � � � � � � � � � � � � � � 151
Architected Cellular MaterialsTobias A. Schaedler and William B. Carter � � � � � � � � � � � � � � � � � � � � � � � � � � � � � � � � � � � � � � � � � � � � � � � 187
Topology Optimization for Architected Materials DesignMikhail Osanov and James K. Guest � � � � � � � � � � � � � � � � � � � � � � � � � � � � � � � � � � � � � � � � � � � � � � � � � � � � � � 211
Current Interest
The Chemistry and Applications of π-GelsSamrat Ghosh, Vakayil K. Praveen, and Ayyappanpillai Ajayaghosh � � � � � � � � � � � � � � � � � � � � 235
v
Ann
u. R
ev. M
ater
. Res
. 201
6.46
:63-
91. D
ownl
oade
d fr
om w
ww
.ann
ualr
evie
ws.
org
Acc
ess
prov
ided
by
Col
orad
o Sc
hool
of
Min
es o
n 02
/06/
17. F
or p
erso
nal u
se o
nly.
MR46-FrontMatter ARI 4 June 2016 9:17
Dealloying and Dealloyed MaterialsIan McCue, Ellen Benn, Bernard Gaskey, and Jonah Erlebacher � � � � � � � � � � � � � � � � � � � � � � � � 263
Material Evaluation by Infrared ThermographyStephen D. Holland and Ricky S. Reusser � � � � � � � � � � � � � � � � � � � � � � � � � � � � � � � � � � � � � � � � � � � � � � � � � � 287
Physics of Ultrathin Films and Heterostructures of Rare-EarthNickelatesS. Middey, J. Chakhalian, P. Mahadevan, J.W. Freeland, A.J. Millis,
and D.D. Sarma � � � � � � � � � � � � � � � � � � � � � � � � � � � � � � � � � � � � � � � � � � � � � � � � � � � � � � � � � � � � � � � � � � � � � � � � � 305
Polymer-Derived Ceramic FibersHiroshi Ichikawa � � � � � � � � � � � � � � � � � � � � � � � � � � � � � � � � � � � � � � � � � � � � � � � � � � � � � � � � � � � � � � � � � � � � � � � � � � � � 335
Raman Studies of Carbon NanostructuresAdo Jorio and Antonio G. Souza Filho � � � � � � � � � � � � � � � � � � � � � � � � � � � � � � � � � � � � � � � � � � � � � � � � � � � � � 357
Recent Advances in Superhard MaterialsZhisheng Zhao, Bo Xu, and Yongjun Tian � � � � � � � � � � � � � � � � � � � � � � � � � � � � � � � � � � � � � � � � � � � � � � � � 383
Synthetic Micro/Nanomotors and Pumps: Fabrication andApplicationsFlory Wong, Krishna Kanti Dey, and Ayusman Sen � � � � � � � � � � � � � � � � � � � � � � � � � � � � � � � � � � � � � � 407
Thermal Boundary Conductance: A Materials Science PerspectiveChristian Monachon, Ludger Weber, and Chris Dames � � � � � � � � � � � � � � � � � � � � � � � � � � � � � � � � � � 433
Ultraincompressible, Superhard MaterialsMichael T. Yeung, Reza Mohammadi, and Richard B. Kaner � � � � � � � � � � � � � � � � � � � � � � � � � � � 465
Index
Cumulative Index of Contributing Authors, Volumes 42–46 � � � � � � � � � � � � � � � � � � � � � � � � � � � 487
Errata
An online log of corrections to Annual Review of Materials Research articles may befound at http://www.annualreviews.org/errata/matsci
vi Contents
Ann
u. R
ev. M
ater
. Res
. 201
6.46
:63-
91. D
ownl
oade
d fr
om w
ww
.ann
ualr
evie
ws.
org
Acc
ess
prov
ided
by
Col
orad
o Sc
hool
of
Min
es o
n 02
/06/
17. F
or p
erso
nal u
se o
nly.