Microstructural and Dielectrical Characterization of Ho ... · Microstructural and Dielectrical...
12
SERBIAN JOURNAL OF ELECTRICAL ENGINEERING Vol. 11, No. 1, February 2014, 35-46 35 Microstructural and Dielectrical Characterization of Ho Doped BaTiO 3 Ceramics Miloš Marjanović 1 , Dragana Dimitrijević 1 , Vesna Paunović 1 , Zoran Prijić 1 Abstract: The Ho doped BaTiO 3 ceramics, with different Ho 2 O 3 content, ranging from 0.01 to 1.0 wt % Ho, were investigated regarding their microstructural and dielectric characteristics. Doped BaTiO 3 were prepared using conventional solid state reaction and sintered at 1380°C for four hours. SEM analysis of Ho/BaTiO 3 doped ceramics showed that the low doped samples exhibit mainly fairly uniform and homogeneous microstructure with the grain size ranged from 20- 40 μm. In the samples with the higher dopant concentration the abnormal grain growth is inhibited and the grain size ranged between 2-10 μm. Measurements of dielectric properties were carried out as a function of temperature up to 180 °C at different frequencies. The samples doped with 0.01wt % of Ho, exhibit the high value of dielectric permittivity (ε r = 2160) at room temperature. A nearly flat permittivity-response was obtained in specimens with higher additive content. Using a Curie-Weiss law and modified Curie-Weiss law the Curie constant (C), Curie temperature (T c ) and a critical exponent of nonlinearity (γ) were calculated. The Curie temperature of doped samples were ranged from 128 to 130°C. The Curie constant for all series of samples decrease with increase of dopant concentration and the lowest values were observed on samples doped with 0.01 wt % of holmium. Keywords: BaTiO 3 , Microstructures, Sintering, Additive, Dielectric properties. 1 Introduction A modified BaTiO 3 ceramics with different additives/dopants is one of the most important groups of functional ferroelectric material due to its attractive electrical, ferroelectric and piezoelectric properties. It is used widely in electronic devices such as multilayer capacitors, thermistors, piezoelectric sensors, energy converting systems, ultrasonic convertors, radio filters, etc. [1 – 3]. The dielectric properties of polycrystalline BaTiO 3 are strongly dependent on the evolved microstructure which in turn depends on the type, concentration and distribution of dopants. In order to obtain BaTiO 3 ceramics with a high value of 1 Faculty of Electronic Engineering, University of Niš, Aleksandra Medvedeva 14, 18000 Niš, Serbia, E-mails: [email protected]; [email protected]; [email protected]; [email protected] UDC: 666.651:661.844]:666.3-187 DOI: 10.2298/SJEE131129004M
Transcript of Microstructural and Dielectrical Characterization of Ho ... · Microstructural and Dielectrical...
SERBIAN JOURNAL OF ELECTRICAL ENGINEERING Vol. 11, No. 1, February 2014, 35-46
35
Microstructural and Dielectrical Characterization of Ho Doped BaTiO3 Ceramics
Miloš Marjanović1, Dragana Dimitrijević1, Vesna Paunović1, Zoran Prijić1
Abstract: The Ho doped BaTiO3 ceramics, with different Ho2O3 content, ranging from 0.01 to 1.0 wt % Ho, were investigated regarding their microstructural and dielectric characteristics. Doped BaTiO3 were prepared using conventional solid state reaction and sintered at 1380°C for four hours. SEM analysis of Ho/BaTiO3 doped ceramics showed that the low doped samples exhibit mainly fairly uniform and homogeneous microstructure with the grain size ranged from 20-40 µm. In the samples with the higher dopant concentration the abnormal grain growth is inhibited and the grain size ranged between 2-10 µm. Measurements of dielectric properties were carried out as a function of temperature up to 180 °C at different frequencies. The samples doped with 0.01wt % of Ho, exhibit the high value of dielectric permittivity (εr = 2160) at room temperature. A nearly flat permittivity-response was obtained in specimens with higher additive content. Using a Curie-Weiss law and modified Curie-Weiss law the Curie constant (C), Curie temperature (Tc) and a critical exponent of nonlinearity (γ) were calculated. The Curie temperature of doped samples were ranged from 128 to 130°C. The Curie constant for all series of samples decrease with increase of dopant concentration and the lowest values were observed on samples doped with 0.01 wt % of holmium.
Keywords: BaTiO3, Microstructures, Sintering, Additive, Dielectric properties.
1 Introduction A modified BaTiO3 ceramics with different additives/dopants is one of the
most important groups of functional ferroelectric material due to its attractive electrical, ferroelectric and piezoelectric properties. It is used widely in electronic devices such as multilayer capacitors, thermistors, piezoelectric sensors, energy converting systems, ultrasonic convertors, radio filters, etc. [1 – 3]. The dielectric properties of polycrystalline BaTiO3 are strongly dependent on the evolved microstructure which in turn depends on the type, concentration and distribution of dopants. In order to obtain BaTiO3 ceramics with a high value of
1Faculty of Electronic Engineering, University of Niš, Aleksandra Medvedeva 14, 18000 Niš, Serbia, E-mails: [email protected]; [email protected]; [email protected]; [email protected]
UDC: 666.651:661.844]:666.3-187 DOI: 10.2298/SJEE131129004M
M. Marjanović, D. Dimitrijević, V. Paunović, Z. Prijić
36
dielectric constant it is necessary to establish high density, homogeneous and fine-grained microstructure as well as uniform distribution of dopants and additives [4, 5].
Two types of dopants can be introduced into BaTiO3 lattice. Ions with larger ionic radii of valence 3+ and higher replaces predominately Ba2+ sites, and the ions with smaller ionic radii of valence 5+ and higher can be incorporated into the Ti4+ sublattice. Considering perovskite BaTiO3 structure, the incor-poration of trivalent rare-earth cations (Ho3+, Dy3+, Er3+, Yb3+) modifies the microstructural and electrical properties of doped BaTiO3. For lower donor concentration (< 0.5wt %), the bimodal microstructure is formed and anomalous grain growth occurred which leads to semiconductive properties of ceramics at room temperature and PTC effect [6 – 9]. On the other side, higher donor concentration leads to dielectric properties of ceramics with high breakdown voltage. Low concentration of Ho leads to substitution of Ba2+ ions, which is resulted in the formation of Ba(1-x)HoxTiO3 solid solution. If concentration of additives is higher than 1.0 wt %, a substitution of Ba2+ or Ti4+ ions can be realized. However, in this case, electrical resistivity is very high [10 – 12]. The substitution of Ho3+ on Ba2+ sites requires the formation of negatively charged defects. There are three possible compensation mechanisms: barium vacancies (VBa
//), titanium vacancies (VTi/////) and electrons (e/). For samples sintered in air
atmosphere, the principal doping mechanism is the ionic compensation mechanism. The controversy remains concerning whether the dominant ionic mechanism is through the creation of barium or titanium vacancies. The addition of Ho2O3 effectively prevents the grain growth, improves the electromechanical properties and increases the temperature region where the tetragonal phase is stable.
The aim of this paper is to study the microstructure and dielectric properties of Ho doped BaTiO3 as a function of different amount of dopant concentration, temperature and frequency. The microstructure of samples was observed by scanning electron microscope (SEM). The variation of dielectric constant with temperature was measured in a temperature interval from 20°C to 180°C. The Curie-Weiss and modified Currie-Weiss laws were used to clarify the influence of dopant on the dielectric properties of BaTiO3.
2 Experimental Procedure The samples of modified BaTiO3 ceramics doped with 0.01, 0.1, 0.5 and
1.0 wt % Ho2O3 were examined. The samples were prepared by a conventional solid state sintering procedure starting from reagent grade Ho2O3 and BaTiO3 powder. Starting powders were ball milled in ethyl alcohol for 24 hours. After drying at 200°C for several hours, the powders were pressed into disk under 120 MPa. The compacts were sintered at 1380°C in air atmosphere for four
Microstructural and Dielectrical Charcterization of Ho Doped BaTiO3 Ceramics
37
hours. The microstructure of the sintered samples were observed by scanning electron microscope JOEL-JSM 5300 equipped with EDS (QX 2000S) system. X-ray diffraction (XRD) patterns were recorded with CuKα radiation in a Philips X’Pert diffractometer. Electrical contacts were prepared by silver paste. The calculation of dielectric constant was performed by measured values of capacitance, samples thickness and electrode area. The variation of dielectric constant with temperature was measured in temperature interval from 20°C to 180°C by using LCR meter Agilent 4284A at different frequencies (0.1 kHz, 1 kHz, 10 kHz, 100 kHz and 1 MHz). The dielectric parameters such as Curie temperature (TC), Curie-Weiss temperature (T0) and Curie constant (C) were calculated according to Curie-Weiss and modified Curie-Weiss law.
3 Results and Discussion 3.1 Microstructure characteristics
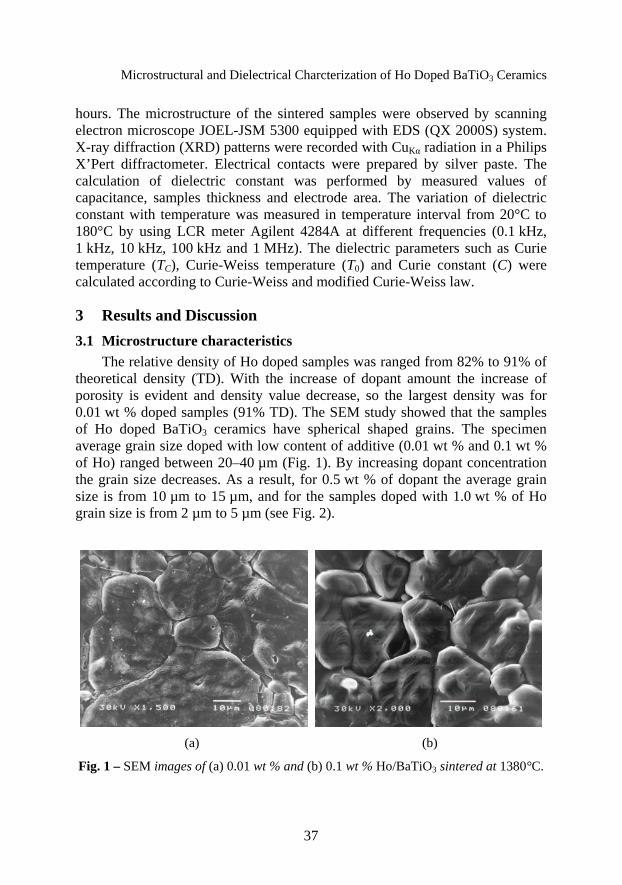
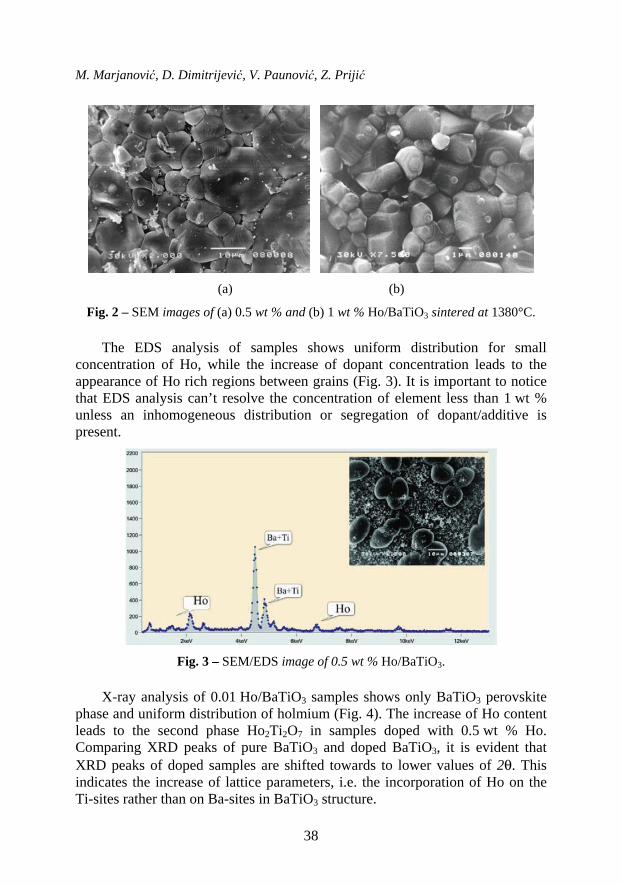
The relative density of Ho doped samples was ranged from 82% to 91% of theoretical density (TD). With the increase of dopant amount the increase of porosity is evident and density value decrease, so the largest density was for 0.01 wt % doped samples (91% TD). The SEM study showed that the samples of Ho doped BaTiO3 ceramics have spherical shaped grains. The specimen average grain size doped with low content of additive (0.01 wt % and 0.1 wt % of Ho) ranged between 20–40 µm (Fig. 1). By increasing dopant concentration the grain size decreases. As a result, for 0.5 wt % of dopant the average grain size is from 10 µm to 15 µm, and for the samples doped with 1.0 wt % of Ho grain size is from 2 µm to 5 µm (see Fig. 2).
(a) (b)
Fig. 1 – SEM images of (a) 0.01 wt % and (b) 0.1 wt % Ho/BaTiO3 sintered at 1380°C.
M. Marjanović, D. Dimitrijević, V. Paunović, Z. Prijić
38
(a) (b)
Fig. 2 – SEM images of (a) 0.5 wt % and (b) 1 wt % Ho/BaTiO3 sintered at 1380°C.
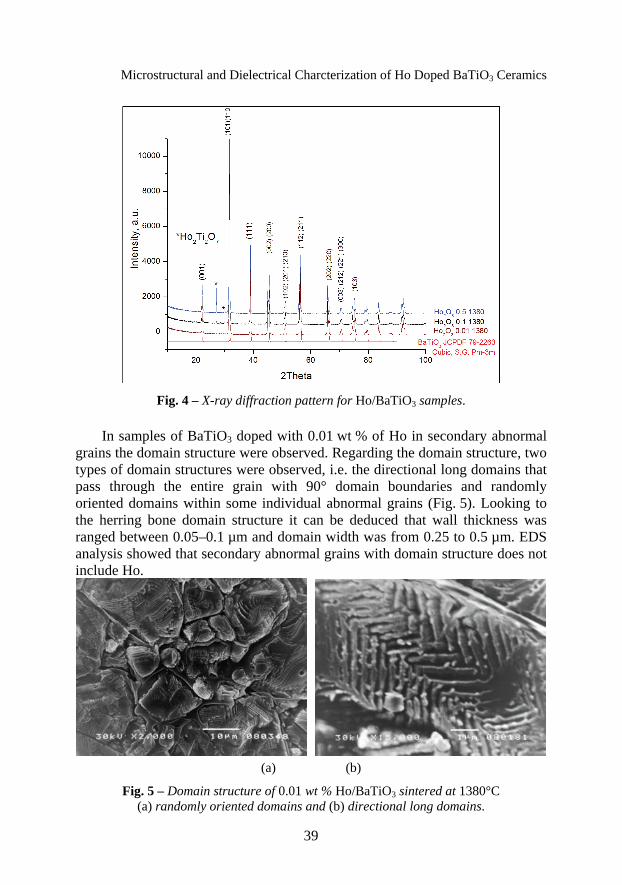
The EDS analysis of samples shows uniform distribution for small concentration of Ho, while the increase of dopant concentration leads to the appearance of Ho rich regions between grains (Fig. 3). It is important to notice that EDS analysis can’t resolve the concentration of element less than 1 wt % unless an inhomogeneous distribution or segregation of dopant/additive is present.
Fig. 3 – SEM/EDS image of 0.5 wt % Ho/BaTiO3.
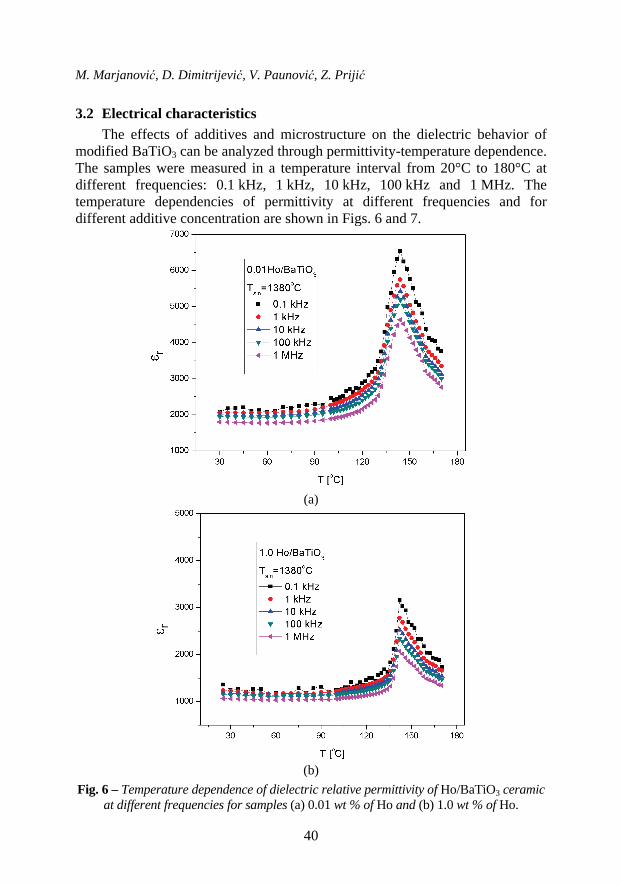
X-ray analysis of 0.01 Ho/BaTiO3 samples shows only BaTiO3 perovskite
phase and uniform distribution of holmium (Fig. 4). The increase of Ho content leads to the second phase Ho2Ti2O7 in samples doped with 0.5 wt % Ho. Comparing XRD peaks of pure BaTiO3 and doped BaTiO3, it is evident that XRD peaks of doped samples are shifted towards to lower values of 2θ. This indicates the increase of lattice parameters, i.e. the incorporation of Ho on the Ti-sites rather than on Ba-sites in BaTiO3 structure.
Microstructural and Dielectrical Charcterization of Ho Doped BaTiO3 Ceramics
39
Fig. 4 – X-ray diffraction pattern for Ho/BaTiO3 samples.
In samples of BaTiO3 doped with 0.01 wt % of Ho in secondary abnormal
grains the domain structure were observed. Regarding the domain structure, two types of domain structures were observed, i.e. the directional long domains that pass through the entire grain with 90° domain boundaries and randomly oriented domains within some individual abnormal grains (Fig. 5). Looking to the herring bone domain structure it can be deduced that wall thickness was ranged between 0.05–0.1 µm and domain width was from 0.25 to 0.5 µm. EDS analysis showed that secondary abnormal grains with domain structure does not include Ho.
(a) (b)
Fig. 5 – Domain structure of 0.01 wt % Ho/BaTiO3 sintered at 1380°C (a) randomly oriented domains and (b) directional long domains.
M. Marjanović, D. Dimitrijević, V. Paunović, Z. Prijić
40
3.2 Electrical characteristics The effects of additives and microstructure on the dielectric behavior of
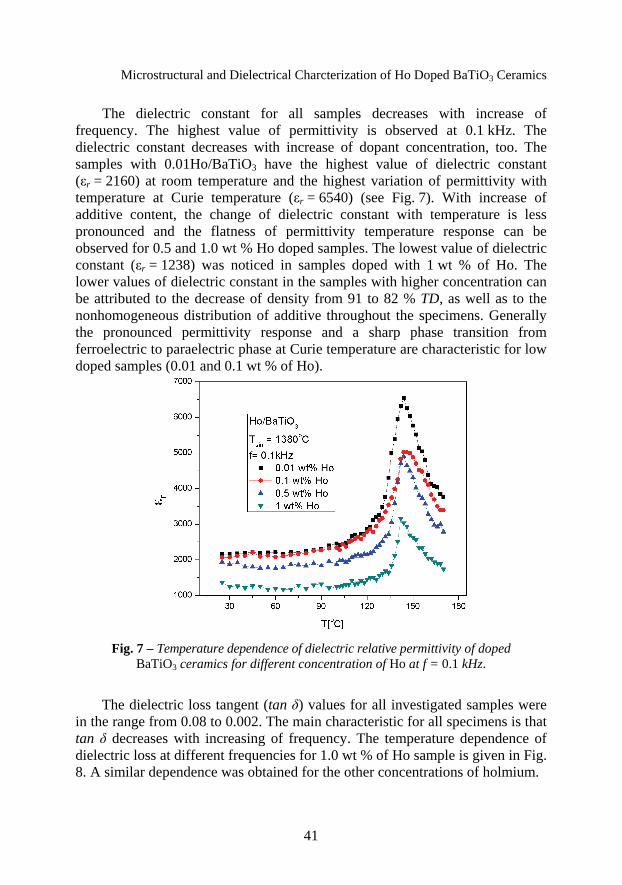
modified BaTiO3 can be analyzed through permittivity-temperature dependence. The samples were measured in a temperature interval from 20°C to 180°C at different frequencies: 0.1 kHz, 1 kHz, 10 kHz, 100 kHz and 1 MHz. The temperature dependencies of permittivity at different frequencies and for different additive concentration are shown in Figs. 6 and 7.
(a)
(b)
Fig. 6 – Temperature dependence of dielectric relative permittivity of Ho/BaTiO3 ceramic at different frequencies for samples (a) 0.01 wt % of Ho and (b) 1.0 wt % of Ho.
Microstructural and Dielectrical Charcterization of Ho Doped BaTiO3 Ceramics
41
The dielectric constant for all samples decreases with increase of frequency. The highest value of permittivity is observed at 0.1 kHz. The dielectric constant decreases with increase of dopant concentration, too. The samples with 0.01Ho/BaTiO3 have the highest value of dielectric constant (εr = 2160) at room temperature and the highest variation of permittivity with temperature at Curie temperature (εr = 6540) (see Fig. 7). With increase of additive content, the change of dielectric constant with temperature is less pronounced and the flatness of permittivity temperature response can be observed for 0.5 and 1.0 wt % Ho doped samples. The lowest value of dielectric constant (εr = 1238) was noticed in samples doped with 1 wt % of Ho. The lower values of dielectric constant in the samples with higher concentration can be attributed to the decrease of density from 91 to 82 % TD, as well as to the nonhomogeneous distribution of additive throughout the specimens. Generally the pronounced permittivity response and a sharp phase transition from ferroelectric to paraelectric phase at Curie temperature are characteristic for low doped samples (0.01 and 0.1 wt % of Ho).
Fig. 7 – Temperature dependence of dielectric relative permittivity of doped
BaTiO3 ceramics for different concentration of Ho at f = 0.1 kHz.
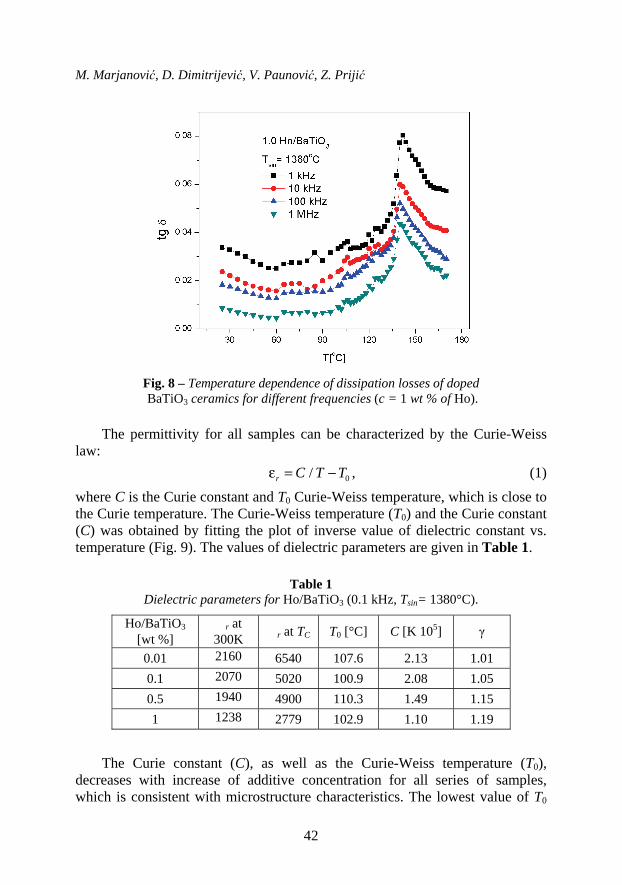
The dielectric loss tangent (tan δ) values for all investigated samples were in the range from 0.08 to 0.002. The main characteristic for all specimens is that tan δ decreases with increasing of frequency. The temperature dependence of dielectric loss at different frequencies for 1.0 wt % of Ho sample is given in Fig. 8. A similar dependence was obtained for the other concentrations of holmium.
M. Marjanović, D. Dimitrijević, V. Paunović, Z. Prijić
42
Fig. 8 – Temperature dependence of dissipation losses of doped BaTiO3 ceramics for different frequencies (c = 1 wt % of Ho).
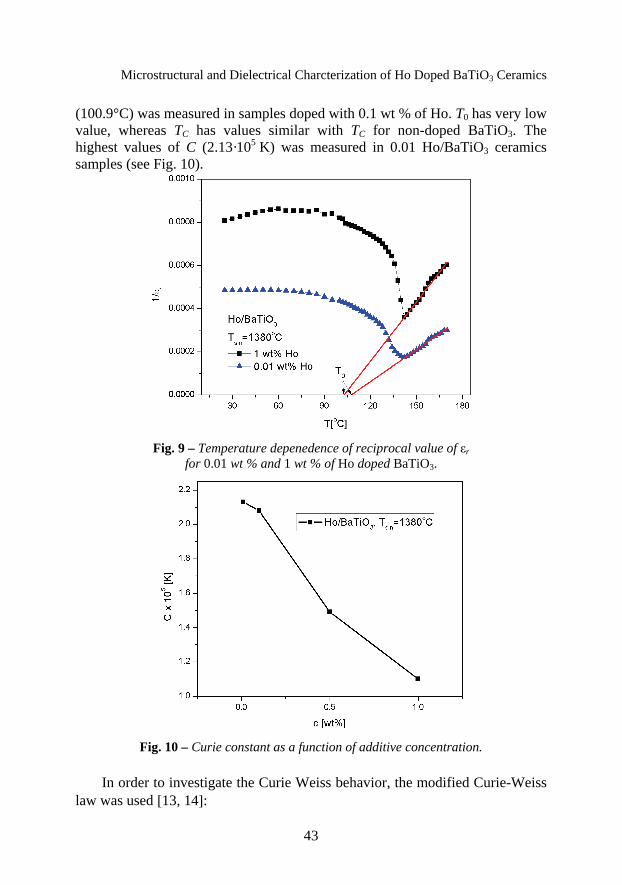
The permittivity for all samples can be characterized by the Curie-Weiss
law: 0/r C T Tε = − , (1)
where C is the Curie constant and T0 Curie-Weiss temperature, which is close to the Curie temperature. The Curie-Weiss temperature (T0) and the Curie constant (C) was obtained by fitting the plot of inverse value of dielectric constant vs. temperature (Fig. 9). The values of dielectric parameters are given in Table 1.
Table 1
Dielectric parameters for Ho/BaTiO3 (0.1 kHz, Tsin= 1380°C).
Ho/BaTiO3 [wt %]
�r at 300K �r at TC T0 [°C] C [K 105] γ
0.01 2160 6540 107.6 2.13 1.01 0.1 2070 5020 100.9 2.08 1.05 0.5 1940 4900 110.3 1.49 1.15 1 1238 2779 102.9 1.10 1.19
The Curie constant (C), as well as the Curie-Weiss temperature (T0),
decreases with increase of additive concentration for all series of samples, which is consistent with microstructure characteristics. The lowest value of T0
Microstructural and Dielectrical Charcterization of Ho Doped BaTiO3 Ceramics
43
(100.9°C) was measured in samples doped with 0.1 wt % of Ho. T0 has very low value, whereas TC has values similar with TC for non-doped BaTiO3. The highest values of C (2.13·105 K) was measured in 0.01 Ho/BaTiO3 ceramics samples (see Fig. 10).
Fig. 9 – Temperature depenedence of reciprocal value of εr
for 0.01 wt % and 1 wt % of Ho doped BaTiO3.
Fig. 10 – Curie constant as a function of additive concentration.
In order to investigate the Curie Weiss behavior, the modified Curie-Weiss
law was used [13, 14]:
M. Marjanović, D. Dimitrijević, V. Paunović, Z. Prijić
44
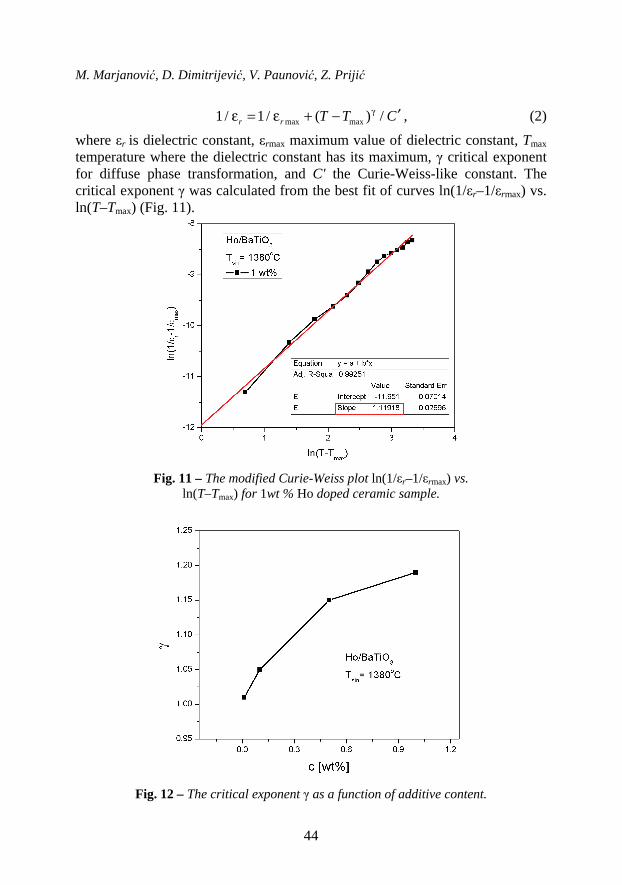
max max1 / 1 / ( ) /r r T T Cγ ′ε = ε + − , (2)
where εr is dielectric constant, εrmax maximum value of dielectric constant, Tmax temperature where the dielectric constant has its maximum, γ critical exponent for diffuse phase transformation, and C' the Curie-Weiss-like constant. The critical exponent γ was calculated from the best fit of curves ln(1/εr–1/εrmax) vs. ln(T–Tmax) (Fig. 11).
Fig. 11 – The modified Curie-Weiss plot ln(1/εr–1/εrmax) vs.
ln(T–Tmax) for 1wt % Ho doped ceramic sample.
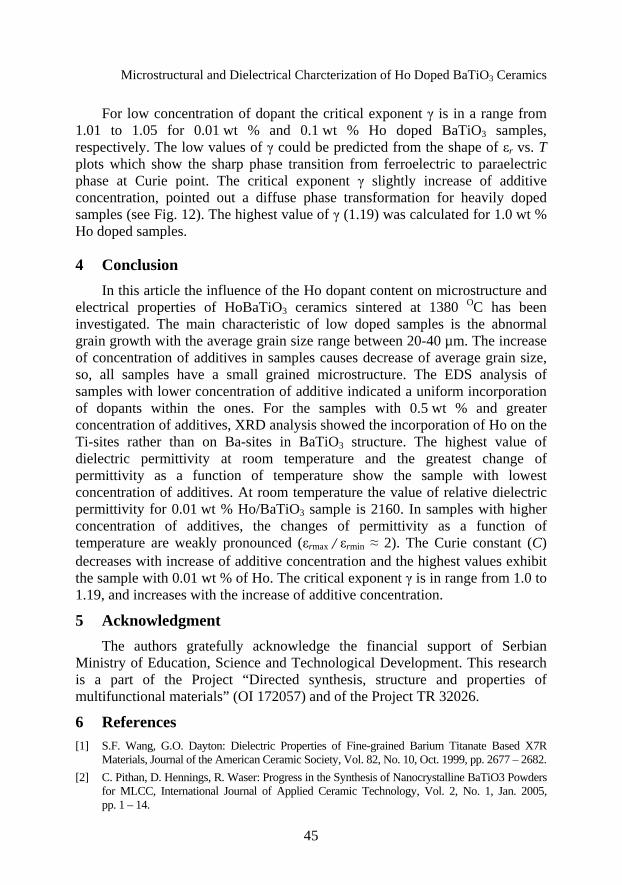
Fig. 12 – The critical exponent γ as a function of additive content.
Microstructural and Dielectrical Charcterization of Ho Doped BaTiO3 Ceramics
45
For low concentration of dopant the critical exponent γ is in a range from 1.01 to 1.05 for 0.01 wt % and 0.1 wt % Ho doped BaTiO3 samples, respectively. The low values of γ could be predicted from the shape of εr vs. T plots which show the sharp phase transition from ferroelectric to paraelectric phase at Curie point. The critical exponent γ slightly increase of additive concentration, pointed out a diffuse phase transformation for heavily doped samples (see Fig. 12). The highest value of γ (1.19) was calculated for 1.0 wt % Ho doped samples.
4 Conclusion In this article the influence of the Ho dopant content on microstructure and
electrical properties of HoBaTiO3 ceramics sintered at 1380 OC has been investigated. The main characteristic of low doped samples is the abnormal grain growth with the average grain size range between 20-40 µm. The increase of concentration of additives in samples causes decrease of average grain size, so, all samples have a small grained microstructure. The EDS analysis of samples with lower concentration of additive indicated a uniform incorporation of dopants within the ones. For the samples with 0.5 wt % and greater concentration of additives, XRD analysis showed the incorporation of Ho on the Ti-sites rather than on Ba-sites in BaTiO3 structure. The highest value of dielectric permittivity at room temperature and the greatest change of permittivity as a function of temperature show the sample with lowest concentration of additives. At room temperature the value of relative dielectric permittivity for 0.01 wt % Ho/BaTiO3 sample is 2160. In samples with higher concentration of additives, the changes of permittivity as a function of temperature are weakly pronounced (εrmax / εrmin ≈ 2). The Curie constant (C) decreases with increase of additive concentration and the highest values exhibit the sample with 0.01 wt % of Ho. The critical exponent γ is in range from 1.0 to 1.19, and increases with the increase of additive concentration.
5 Acknowledgment The authors gratefully acknowledge the financial support of Serbian
Ministry of Education, Science and Technological Development. This research is a part of the Project “Directed synthesis, structure and properties of multifunctional materials” (OI 172057) and of the Project TR 32026.
6 References [1] S.F. Wang, G.O. Dayton: Dielectric Properties of Fine-grained Barium Titanate Based X7R
Materials, Journal of the American Ceramic Society, Vol. 82, No. 10, Oct. 1999, pp. 2677 – 2682. [2] C. Pithan, D. Hennings, R. Waser: Progress in the Synthesis of Nanocrystalline BaTiO3 Powders
for MLCC, International Journal of Applied Ceramic Technology, Vol. 2, No. 1, Jan. 2005, pp. 1 – 14.
M. Marjanović, D. Dimitrijević, V. Paunović, Z. Prijić
46
[3] P. Kumar, S. Singh, J.K. Juneja, C. Prakash, K.K. Raina: Influence of Calcium on Structural and Electrical Properties of Substituted Barium Titanate, Ceramics International, Vol. 37, No. 5, July 2011, pp. 1697 – 1700.
[4] Z.C. Li, B. Bergman: Electrical Properties and Ageing Characteristics of BaTiO Ceramics Doped by Single Dopants, Journal of the European Ceramic Society, Vol. 25, No. 4, April 2005, pp. 441 – 445.
[5] V. Mitić, V. Paunović, D. Mančić, Lj. Kocić, Lj. Živković, V.B. Pavlović: Dielectric Properties of BaTiO3 Doped with Er2O3, Yb2O3 based on Intergranular Contacts Model, Advances in Electroceramic Materials: Ceramic Transactions, Vol. 204, July 2009, pp. 137 – 144.
[6] H. Kishi, N. Kohzu, J. Sugino, H. Ohasato, Y. Iguchi, T. Okuda: The Effect of Rare-earth (La, Sm, Dy, Ho and Er) and Mg on the Microstructure in BaTiO3, Journal of the European Ceramic Society Vol. 19, No. 6-7, June 1999, pp. 1043 – 1046.
[7] V. Paunović, Lj. Živković, V. Mitić: Influence of Rare-earth Additives (La, Sm and Dy) on the Microstructure and Dielectric Properties of Doped BaTiO3 Ceramics, Science of Sintering, Vol. 42, No. 1, Jan/Apr. 2010, pp. 69 – 79.
[8] R. Zhang, J.F. Li, D. Viehland: Effect of Aliovalent Substituents on the Ferroelectric Properties of Modified Barium Titanate Ceramics: Relaxor Ferroelectric Behavior, Journal of the American Ceramic Society, Vol. 87, No. 5, May 2004, pp. 864 – 870.
[9] P.W. Rehrig, S.E. Park, S. Trolier-McKinstry, G.L. Messing, B. Jones, T.R. Shrout: Piezoelectric Properties of Zirconium-doped Barium Titanate Single Crystals Grown by Templated Grain Growth, Journal of Applied Physics, Vol. 86, No. 3, Aqug. 1999, pp. 1657 – 1661.
[10] V.V. Mitić, Z. Nikolić, V.B. Pavlović, V. Paunović, M. Miljković, B. Jordović, Lj. Živković: Influence of Rare-earth Dopants on BaTiO3 Ceramics Microstructure and Corresponding Electrical Properties, Journal of the American Ceramic Society, Vol. 93, No. 1, Jan. 2010, pp. 132 – 137.
[11] D. Makovec, Z. Samardžija, M. Drofenik: Solid Solubility of Holmium, Yttrium and Dysprosium in BaTiO3, Journal of the American Ceramic Society, Vol. 87, No. 7, July 2004, pp.1324 – 1329.
[12] D.A. Lu, X.Y. Sun, M. Toda: Electron Spin Resonance Investigations and Compensation Mechanism of Europium-doped Barium Titanate Ceramics, Japanese Journal of Applied Physics, Vol. 45, Part. 1, No. 11, Nov. 2006, pp. 8782 – 8788.
[13] K. Uchino, S. Nomura: Critical Exponents of the Dielectric Constants in Diffused-phase-transition Crystals, Ferroelectrics, Vol. 44, No. 1, 1982, pp. 55 – 61.
[14] I. Isupov: Some Problems of Diffuse Ferroelectric Phase Transitions, Ferroelectrics, Vol. 90, No. 1, 1989, pp. 113 – 118.