Microsoft Word - 2003 RSCVA Word Report File
26
The Reno-Sparks Convention & Visitors Authority Washoe County, Nevada 2003 Marketing Report Mission Statement To increase overnight visitation Vision Statement To be a premier, four-season recreation, resort and meeting destination with the added value of gaming and entertainment. www.renolaketahoe.com Reno-Sparks Convention & Visitors Authority
-
Upload
reno-tahoe-usa -
Category
Documents
-
view
227 -
download
6
description
Reno-Sparks Convention Center Northgate Golf Club Reno-Sparks Livestock Events Center National Bowling Stadium Month 2003 2002 % Change Jan 347,947 336,325 3% Feb 354,545 370,683 -4% Mar 398,343 407,667 -2% Apr 370,365 415,236 -11% May 408,953 409,735 0% Jun 445,681 428,659 4% Jul 471,764 472,611 0% Aug 492,689 497,946 -1% Sep 457,940 464,211 -1% Oct 435,478 417,051 4% Nov 347,647 353,944 -2% Dec 334,133 340,786 -2% Total 4,865,485 4,914,854 -1%
Transcript of Microsoft Word - 2003 RSCVA Word Report File

The Reno-Sparks Convention & Visitors Authority
Washoe County, Nevada
2003 Marketing Report
Mission Statement To increase overnight visitation
Vision Statement To be a premier, four-season recreation, resort and meeting destination with
the added value of gaming and entertainment.
www.renolaketahoe.com
Reno-Sparks Convention & Visitors Authority

2003 MARKETING REPORT
The Reno-Sparks Convention & Visitors Authority (RSCVA), established in 1959 as the Washoe County Fair and Recreation Board, acts as a marketing organization for the county to promote convention and tourism business. It owns and operates the following facilities. Reno-Sparks Convention Center Northgate Golf Club Reno-Sparks Livestock Events Center National Bowling Stadium **(Owned by City of Reno)
Wildcreek Golf Course Pioneer Center for the Performing Arts *(Managed by the Reno Performing Arts Center Association.)
The RSCVA’s revenues come primarily from: room license taxes, revenue derived from the operation of the facilities it owns and income from investments. Room license taxes provide the predominant portion of these revenues. Board of Directors Representing Phil Salerno City of Sparks Pete Sferrazza Washoe County Commission Bonnie Weber Washoe County Commission Mike Murdock Financial Industry Mary Simmons General Business David Miller Motel Industry Glenn Carano Gaming Industry Jackson (Jack) Fisher Gaming Industry Larry Harvey Air Service Industry Bob Cashell City of Reno Sharon Zadra City of Reno Pete Sears Incline Village/Crystal Bay Tim Maland Gaming Industry

2003 Annual Marketing Report
Table of Contents Washoe County Population & Climate ……...…………………………………… 1
Visitor Count ………………………………………………………………………… 2
Economic Impact …………………………………………………………………… 3
Visitor Research ….. ………………………………………………………………. 4
Airport ………………………………………………………………………………… 5-7
Highway ……………………………………………………………………………… 8
Train ………………………………………………………………………………….. 9
Occupancy …………………………………………………………………………… 10-11
Number of Rooms …………………………………………………………………… 12
Room Tax, Rates, Revenues ……………………………………………………… 13-14
Gaming ………………………………………………………………………………. 15-16
Convention Sales …………………………………………………………………… 17
Reno-Sparks Convention Center ………………………….………………………. 18
Reno-Sparks Livestock Events Center …………………………………………….. 19
National Bowling Stadium ………………………………………………………….. 20
Golf Courses ………………………………………………………………………… 21
Ten Year Trend ……………………………………………………………………… 22
Acknowledgements……………………………………………………………….. 23

1
Washoe County Population & Climate
POPULATION 2003 2002 Projection Census % Change Washoe County (all) 362,458 357,776 1.31% Reno 195,727 187,834 4.20% Sparks 78.435 75,255 4.23% Incline Village/Crystal Bay 10,641 10,356 2.75%
AVERAGE TEMPERATURES
Reno/Sparks Lake Tahoe High Low High Low
Jan 55 31 49 30 Feb 50 25 44 23 Mar 60 33 50 28 Apr 57 34 45 27 May 75 46 62 36 Jun 88 55 73 43 Jul 97 62 80 49 Aug 90 58 77 50 Sep 86 51 75 46 Oct 76 43 68 41 Nov 52 30 45 28 Dec 56 29 50 25
Reno averages 1937 to 2003 (66 years), Lake Tahoe averages 1948 to 2003 (55 years),

2
Visitor Count
ESTIMATED VISITORS
2003 2002 % Change
In Commercial Accommodations 4,670,866 4,718,262 -1.0%
Not in Commercial Accommodations* 194,619 196,592 -1.0% Total Est. Washoe County Visitors 4,865,485 4,914,854 -1.0% *Visiting friends & relatives, daytrippers, campers, etc.
ALL WASHOE COUNTY Month 2003 2002 % Change
Jan 347,947 336,325 3% Feb 354,545 370,683 -4% Mar 398,343 407,667 -2% Apr 370,365 415,236 -11% May 408,953 409,735 0% Jun 445,681 428,659 4% Jul 471,764 472,611 0% Aug 492,689 497,946 -1% Sep 457,940 464,211 -1% Oct 435,478 417,051 4% Nov 347,647 353,944 -2% Dec 334,133 340,786 -2%
Total 4,865,485 4,914,854 -1%
VISITORS' PRIMARY MODES OF TRANSPORTATION 2003 2002 Mode of Percent Projected Percent Projected Transportation Each Mode* Visitors Each Mode Visitors % ChangeAuto/RV/Truck 61% 2,967,946 71% 3,499,376 -15% Air 29% 1,410,991 21% 1,007,545 40% Train 1% 48,655 2% 83,552 16% Motor-coach 8% 389,239 7% 324,381 20%
Total 100% 4,865,485 100% 4,914,854 -1% *These percentages represent what visitors stated as their "primary" modes of transportation to the area in the 2003 Visitor Profile Study. Various inter-modal combinations may have been used, e.g. air/auto, train/bus, etc.

3
ECONOMIC IMPACT 2003 2002 % Chg 2001 2000 1 Number of visitors to Washoe County 4,865,485 4,914,854 -1.00% 5,008,504 5,188,325 2 Non-Gaming Trip Budgets per person* $331 $315 5.08% $296 $296 3 Non-Gaming Impact-Direct (1x2) $1,610,475,535 $1,548,179,010 4.02% $1,482,517,184 $1,535,744,2004 Economic Multiplier 1.77 1.77 1.77 1.77 5 Non-Gaming Impact-Indirect (6-3) $1,240,066,162 $1,192,097,838 4.02% $1,141,538,232 $1,182,523,0346 Non-Gaming Impacts-Total (3x4) $2,850,541,697 $2,740,276,848 4.02% $2,624,055,416 $2,718,267,234 7 Washoe County Total Gaming Win $1,010,452,000 $1,034,789,000 -2.35% $1,080,732,131 $1,140,598,8658 Discount for Local Gaming 15% 15% 15% 15% 9 Visitor-Related Gaming Win (7-8) $858,884,200 $879,570,650 -2.35% $918,622,311 $969,509,035 10 Economic Multiplier 1.98 1.98 1.98 1.98 11 Gaming Impact-Indirect (12-9) $841,706,516 $861,979,237 -2.35% $900,249,865 $950,118,855 12 Gaming Impact-Total (9x10) $1,700,590,716 $1,741,549,887 -2.35% $1,818,872,176 $1,919,627,890 13 Direct Economic Effects (3+9) $2,469,359,735 $2,427,749,660 1.71% $2,401,139,495 $2,505,253,23514 Indirect Economic Effects (5+11) $2,081,772,678 $2,054,077,075 1.35% $2,041,788,097 $2,132,641,889 TOTAL ECONOMIC IMPACTS (6+12) $4,551,132,413 $4,481,826,735 1.55% $4,442,927,592 $4,637,895,124
* Daily non-gaming budgets for 2001 and 2002 were derived from the 1999 Visitor Profile Study while budgets for 2002 and 2003 were obtained from the Visitor Profile Studies conducted for each respective year.

4
VISITOR RESEARCH Summary of the Reno-Sparks Visitor Profile Study
2003 2002 1999 1998 1997 1996 1995 1994 1993 n=2645 n=2558 n=2,523 n=2,512 n=2,535 n=2,540 n=2,570 n=2,551 n=2,507Satisfaction: Intend to return to Reno-Sparks 76% 83% 83% 82% 84% 86% 86% 84% 81%(75-100% chance within 2 yrs) Trip Characteristics: Day visitor 4% 4% 12% 11% 10% 12% 12% 9% 10%Overnight visitors-commercial accom. 96% 96% 84% 85% 86% 84% 83% 86% 82%Overnight visitors-friends/relatives/other 4% 4% 4% 4% 4% 4% 5% 5% 8%Visiting primarily on business 9% 6% 7% 7%n/a 8% n/a 7% 5%Visiting for convention/meeting 15% 13% 9% 7% 10% 5% 8% 7% 6%First time visitors 22% 15% 18% 18% 20% 19% 16% 17% 16%Avg. visits per year (First time visitors) 5 4.8 4.1 3.9 4.3 3.8 4.0 4.0 3.0Avg. members in party 3 3.3 2.7 2.7 2.8 2.6 2.6 2.6 2.7Traveling with persons under 21 13% 19% 9% 8% 9% 8% 8% 10% 11%Average length of stay (nights): Day & overnight visitors 3 2.4 2.4 2.5 2.5 2.4 2.5 2.6 2.9Overnight visitors only 3.1 2.5 2.8 2.8 2.8 2.7 2.9 2.9 3.2Mean Daily Budget (per person)*: Gaming $210 $212 $182 $163 $159 $199 $174 $175 $154 Non-Gaming $105 $131 $104 $95 $87 $86 $92 $94 $95 Total $315 $343 $286 $258 $246 $285 $266 $269 $249 Other Visitor Characteristics: Median age (years) 56 53 54 55 54 54 51 51 50Median family income (000) $63.6 $59.6 $56.5 $52.3 $51.3 $53.4 $47.5 $47.6 $43.9Male 44% 46% 47% 49% 45% 43% 48% 46% 48%Female 56% 54% 53% 51% 55% 57% 52% 54% 52%Residence of Visitors Top U.S. Markets: 1. California 44% 59% 51% 50% 50% 48% 47% 47% 45%2. Washington 7% 9% 10% 10% 10% 11% 12% 13% 12%3. Oregon 7% 7% 7% 7% 7% 9% 7% 8% 9%4. Nevada 2% 2% 4% 4% 4% 5% 5% 4% 6%5. Texas 3% 2% 3% 2% 2% 2% 2% 2% 3%California Breakdown: Greater San Francisco Bay Area 16% 26% 21% 20% 21% 20% 19% 20% 18%Central Valley 13% 17% 15% 14% 14% 14% 2% 12% 10%Southern California 5% 6% 6% 7% 6% 7% 7% 6% 9%Foreign Visitors: Canada 4% 4% 5% 5% 7% 8% 7% 9% 9%All other countries 33% 1% 1% 1% 1% 1% 1% 1% 2% *Includes non participants. NOTE: All calculations are based on the total sample. The complete 2003 Reno-Sparks Visitor Profile Study may be viewed on the rscva.com web-site. Printed copies are available for $30.00 each. See the Acknowledgements page for contact information Note: For consistency, total number of visitors are estimated using 1999 factors.
5
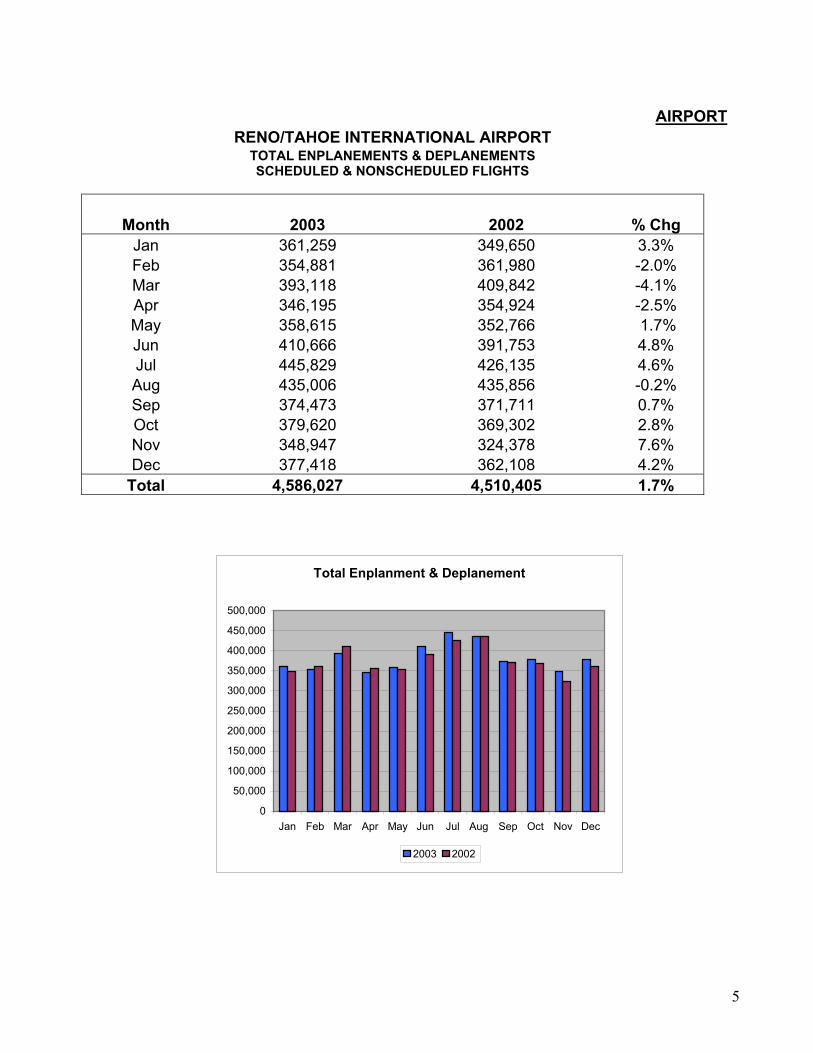
AIRPORT
RENO/TAHOE INTERNATIONAL AIRPORT TOTAL ENPLANEMENTS & DEPLANEMENTS SCHEDULED & NONSCHEDULED FLIGHTS
Month 2003 2002 % Chg Jan 361,259 349,650 3.3% Feb 354,881 361,980 -2.0% Mar 393,118 409,842 -4.1% Apr 346,195 354,924 -2.5% May 358,615 352,766 1.7% Jun 410,666 391,753 4.8% Jul 445,829 426,135 4.6% Aug 435,006 435,856 -0.2% Sep 374,473 371,711 0.7% Oct 379,620 369,302 2.8% Nov 348,947 324,378 7.6% Dec 377,418 362,108 4.2%
Total 4,586,027 4,510,405 1.7%
Total Enplanment & Deplanement
0
50,000
100,000
150,000
200,000
250,000
300,000
350,000
400,000
450,000
500,000
Jan Feb Mar Apr May Jun Jul Aug Sep Oct Nov Dec
2003 2002

6
AIRPORT DEPLANEMENTS
DEPLANEMENTS CHARTER/NONSCHEDULED SCHEDULED FLIGHTS FLIGHTS
Month 2003 2002 % Change Month 2003 2002 % Change
Jan 179,276 170,413 5.2% Jan 468 1,076 -56.5% Feb 174,349 182,176 -4.3% Feb 986 487 102.5% Mar 191,561 199,419 -3.9% Mar 903 805 12.2% Apr 170,441 176,209 -3.3% Apr 1,825 1,030 77.2% May 177,531 177,714 -0.1% May 1,707 974 75.3% Jun 202,177 195,284 3.5% Jun 1,642 850 93.2% Jul 223,179 214,662 4.0% Jul 2,099 925 126.9% Aug 214,851 218,529 -1.7% Aug 2,422 989 144.9% Sep 182,198 183,870 -0.9% Sep 1,197 834 43.5% Oct 184,522 181,749 1.5% Oct 2,242 1,035 116.6% Nov 172,431 161,644 6.7% Nov 2,322 924 151.3% Dec 195,143 187,050 4.3% Dec 1,885 717 162.9%
Total 2,267,659 2,248,719 0.8% Total 19,698 10,646 85.0%
TOTAL DEPLANEMENTS SCHEDULED & CHARTER FLIGHTS
Month 2003 2002 % Change Jan 179,744 171,489 4.8% Feb 175,335 182,663 -4.0% Mar 192,464 200,224 -3.9% Apr 172,266 177,239 -2.8% May 179,238 178,688 0.3% Jun 203,819 196,134 3.9% Jul 225,278 215,587 4.5% Aug 217,273 219,518 -1.0% Sep 183,395 184,704 -0.7% Oct 186,764 182,784 2.2% Nov 174,753 162,568 7.5% Dec 197,028 187,767 4.9% Total 2,287,357 2,259,365 1.2%

7
AIRPORT DEPLANEMENTS-BY AIRLINES
CARRIER 2003 2002 % CHANGE ALASKA 148,615 112,115 32.6% ALLEGIANT 18,831 663 2740.3% AMERICA WEST 201,931 175,814 14.9% ALOHA 15,219 N/A N/A AMERICAN 197,810 293,072 1.0% CONTINENTAL 71,616 48,681 47.1% FRONTIER 44,084 45,508 -3.1% MESA Closed 2,619 N/A NATIONAL Closed 6,138 N/A NORTHWEST 86,901 82,084 59% SKYWEST 91,945 103,160 -10.9% SOUTHWEST 1,148,185 1,110,897 3.4% UNITED 261,353 256,992 1.7% TOTAL SCHEDULED DEPLANEMENTS 2,286,490 2,237,743 2.2% AIR PASSENGER DISTRIBUTION 2003 2002 % Total % Total YTY % Passengers Passengers Passengers Passengers Change Change RESIDENTS 20.7% 468,362 25.1% 564,428 -96,067 -17.0% VISITORS 79.3% 1,799297 74.9% 1,684,291 115,007 6.8% VISITOR DISTRIBUTION: RENO/SPARKS 74.3% 1,337,539 66.0% 1,111,217 226,322 20.4% CARSON CITY 1.4% 25,328 2.6% 43,663 -18,334 -42.0% NO. LAKE TAHOE 7.3% 131,513 6.9% 115,706 15,807 13.7% SOUTH LAKE TAHOE 13.3% 238,672 15.6% 261,976 -23,304 -8.9% GARDNERVILLE/MINDEN 1.0% 18,509 0.6% 10,916 7,594 69.6% LOYALTON/PORTOLA/SUSANVILLE 0.9% 15,587 1.8% 30,564 -14,977 -49.0% FERNLEY/FALLON 0.8% 13,638 0.9% 15,282 -1,644 -10.8% OUT OF AREA 1.0% 18,509 5.6% 94,966 -76,457 -80.5% TOTAL 100.0% 1,799,297 100.0% 1,684,291 115,007 6.8% This information is derived from Marketec Reports

8
HIGHWAY AVERAGE DAILY TRAFFIC (Two-Way)
I-80 W (Verdi) US 395 S (No. of Carson City) US 395 N (Bordertown)
Month 2003 2002 % Chg 2003 2002 % Chg 2003 2002 % Chg Jan 25,291 24,035 5.2% 31,099 29,681 4.8% 7,304 6,714 8.8% Feb 26,142 27,586 -5.2% 32,946 32,107 2.6% 7.641 7,946 -3.8% Mar 26,038 25,923 0.4% 33,335 32,471 2.7% 8,133 8,071 0.8% Apr 72,428 27,753 161.0% 33,579 33,264 0.9% 8,214 8,878 -7.5% May 29,510 30,195 -2.3% 34,821 33,969 2.5% 9,663 9,631 0.3% Jun 33,018 32,441 1.8% 37,702 36,086 4.5% 10,821 10,730 0.8% Jul 34,930 34,907 0.1% 37,739 36,428 3.6% 11,382 11,409 -0.2% Aug 37,015 36,908 0.3% 39,218 38,024 3.1% 11,480 11,268 1.9% Sep 32,057 32,063 0.0% 37,640 36,043 4.4% 10,249 9,984 2.7% Oct 29,169 29,139 0.1% 35,829 34,563 3.7% 9,693 9,544 1.6% Nov 25,274 26,171 -3.4% 32,610 31,822 2.5% 8,169 8,497 -3.9% Dec 24,660 23,403 5.4% N/A 30,014 -100.0% 7,647 7,433 2.9% Average 34,560 30,095 14.8% 35,391 34,264 3.3% 9,458 9,418 0.4% Total 395,532 350,524 12.8% 386,518 404,472 -4.4% 110,396 110,105 0.3% December 03 US 395 (No. of Carson City)=site has been removed due to the “US-395 Carson-Bypass” construction project. Average is calculated for the 1st 10 months. INBOUND HIGHWAY TRAFFIC
I-80 W (Verdi) US 395 S (No. of Carson City) US 395 N (Bordertown)
Month 2003 2002 % Chg 2003 2002 % Chg 2003 2002 % Chg Jan 782,607 538,725 45.3% 971,710 925,237 5.0% 212,579 220,880 -3.8% Feb 731,988 636,901 14.9% 712,797 898,985 -20.7% 213,946 222,480 -3.8% Mar 812,022 744,695 9.0% 1,023,130 1,000,372 2.3% 252,351 251,986 0.1% Apr 756,173 825,434 -8.4% 1,010,206 999,571 1.1% 242,684 265,023 -8.4% May 917,789 931,914 -1.5% 1,046,977 1,063,173 -1.5% 300,830 298,760 0.7% Jun 992,427 982,685 1.0% 1,123,163 1,071,600 4.8% 324,985 323,269 0.5% Jul 1,074,015 1,068,968 0.5% 1,035,504 1,100,709 -5.9% 350,499 350,863 -0.1% Aug 1,164,693 1,152,992 1.0% 1,210,739 1,184,243 2.2% 348,771 351,678 -0.8% Sep 955,535 968,224 -1.3% 1,127,082 1,071,911 5.1% 306,006 299,943 2.0% Oct 900,641 892,300 0.9% 1,003,218 1,077,626 -6.9% 300,454 294,156 2.1% Nov 727,706 792,020 -8.1% N/A 956,040 N/A 245,187 256,546 -4.4% Dec 760,789 724,974 4.9% N/A 924,476 N/A 236,588 229,912 2.9% Average 908,789 874,284 3.9% 1,026,453* 1,039,343* -1.2% 285,311 287,904 -0.9% Total 10,576,385 10,259,832 3.1% 10,264,526* 10,393,427* -1.2% 3,334,880 3,365,496 -0.9%
December 03 US 395 (No. of Carson City)=site has been removed due to the “US-395 Carson-Bypass” construction project. * Calculated for first 10 months (Jan-Oct).

9
TRAIN
AMTRAK CALIFORNIA ZEPHYR Arrivals at Reno & Sparks
Month 2003 2002 %Chg Jan 4,256 4,701 -9.5% Feb 4,428 4,653 -4.8% Mar 3,931 3,874 1.5% Apr 2,504 2,188 14.4% May 2,142 1,439 48.9% Jun 1,893 1,482 27.7% Jul 1,815 1,775 2.3% Aug 1,948 1,839 5.9% Sep 1,678 1,547 8.5% Oct 1,987 1,683 18.1% Nov 2,582 1,840 40.3% Dec 3,064 2,807 9.2%
Total 32,228 29,828 8.0%
AMTRAK CALIFORNIA ZEPHYR On/Off passengers eastbound & westbound at Reno & Sparks
Month 2003 2002 % Chg Jan 7,684 8,076 -4.9% Feb 7,483 8,204 -8.8% Mar 6,661 6,506 2.4% Apr 4,675 3,893 20.1% May 4,177 2,820 48.1% Jun 3,532 2,725 29.6% Jul 3,421 3,286 4.1% Aug 3,594 3,213 11.9% Sep 3,286 2,529 29.9% Oct 4,163 2,798 48.8% Nov 4,707 3,542 32.9% Dec 5,864 5,314 10.4%
Total 59,247 52,906 12.0%
10
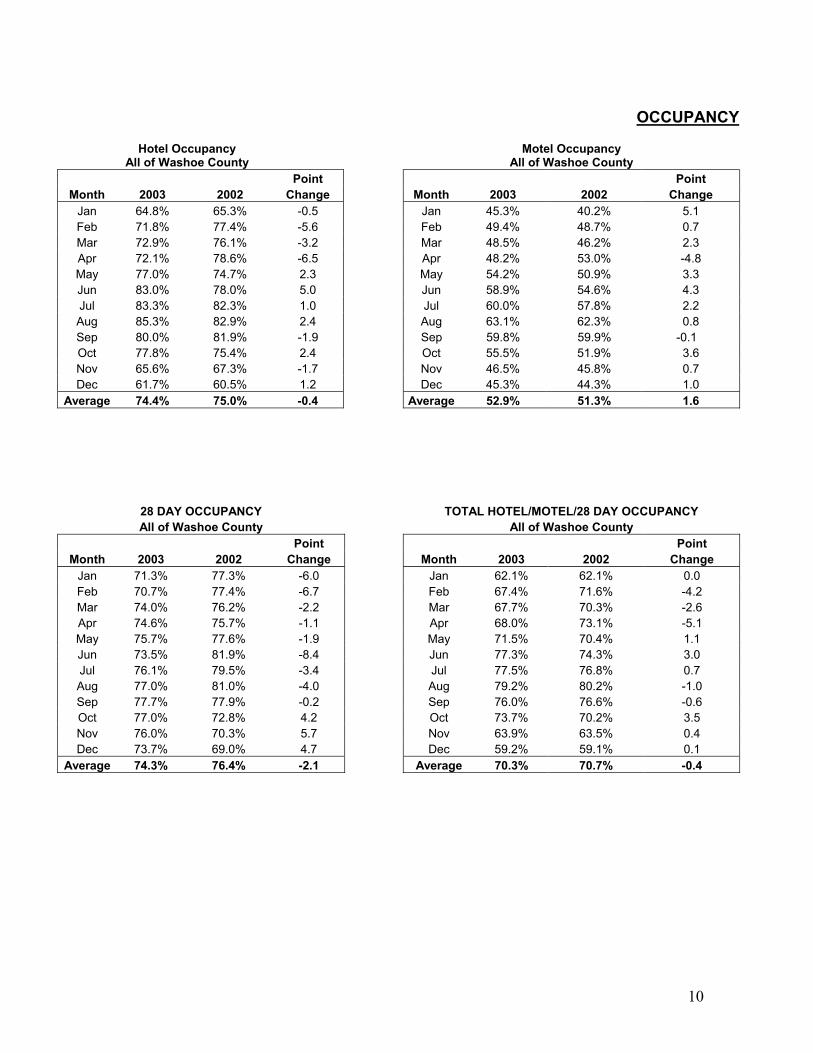
OCCUPANCY
Hotel Occupancy
All of Washoe County Motel Occupancy
All of Washoe County Point Point
Month 2003 2002 Change Month 2003 2002 Change Jan 64.8% 65.3% -0.5 Jan 45.3% 40.2% 5.1 Feb 71.8% 77.4% -5.6 Feb 49.4% 48.7% 0.7 Mar 72.9% 76.1% -3.2 Mar 48.5% 46.2% 2.3 Apr 72.1% 78.6% -6.5 Apr 48.2% 53.0% -4.8 May 77.0% 74.7% 2.3 May 54.2% 50.9% 3.3 Jun 83.0% 78.0% 5.0 Jun 58.9% 54.6% 4.3 Jul 83.3% 82.3% 1.0 Jul 60.0% 57.8% 2.2 Aug 85.3% 82.9% 2.4 Aug 63.1% 62.3% 0.8 Sep 80.0% 81.9% -1.9 Sep 59.8% 59.9% -0.1 Oct 77.8% 75.4% 2.4 Oct 55.5% 51.9% 3.6 Nov 65.6% 67.3% -1.7 Nov 46.5% 45.8% 0.7 Dec 61.7% 60.5% 1.2 Dec 45.3% 44.3% 1.0
Average 74.4% 75.0% -0.4 Average 52.9% 51.3% 1.6
28 DAY OCCUPANCY TOTAL HOTEL/MOTEL/28 DAY OCCUPANCY All of Washoe County All of Washoe County
Point Point Month 2003 2002 Change Month 2003 2002 Change
Jan 71.3% 77.3% -6.0 Jan 62.1% 62.1% 0.0 Feb 70.7% 77.4% -6.7 Feb 67.4% 71.6% -4.2 Mar 74.0% 76.2% -2.2 Mar 67.7% 70.3% -2.6 Apr 74.6% 75.7% -1.1 Apr 68.0% 73.1% -5.1 May 75.7% 77.6% -1.9 May 71.5% 70.4% 1.1 Jun 73.5% 81.9% -8.4 Jun 77.3% 74.3% 3.0 Jul 76.1% 79.5% -3.4 Jul 77.5% 76.8% 0.7 Aug 77.0% 81.0% -4.0 Aug 79.2% 80.2% -1.0 Sep 77.7% 77.9% -0.2 Sep 76.0% 76.6% -0.6 Oct 77.0% 72.8% 4.2 Oct 73.7% 70.2% 3.5 Nov 76.0% 70.3% 5.7 Nov 63.9% 63.5% 0.4 Dec 73.7% 69.0% 4.7 Dec 59.2% 59.1% 0.1
Average 74.3% 76.4% -2.1 Average 70.3% 70.7% -0.4
11
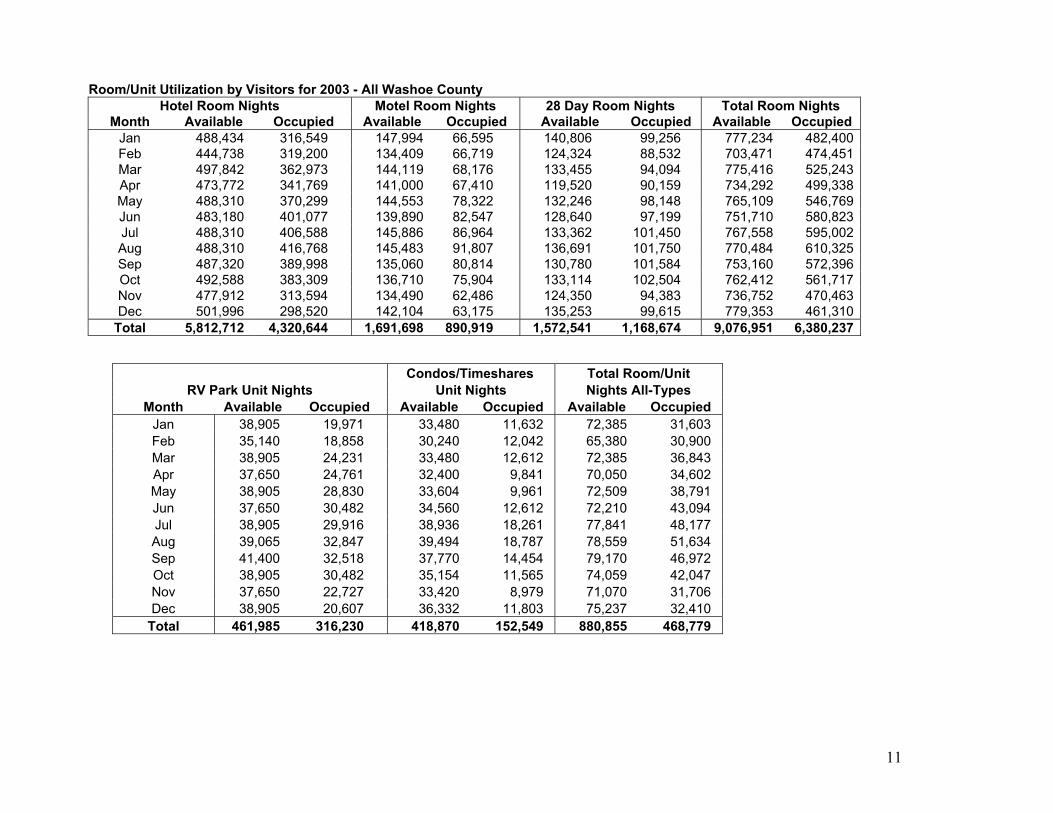
Room/Unit Utilization by Visitors for 2003 - All Washoe County Hotel Room Nights Motel Room Nights 28 Day Room Nights Total Room Nights
Month Available Occupied Available Occupied Available Occupied Available Occupied Jan 488,434 316,549 147,994 66,595 140,806 99,256 777,234 482,400Feb 444,738 319,200 134,409 66,719 124,324 88,532 703,471 474,451Mar 497,842 362,973 144,119 68,176 133,455 94,094 775,416 525,243Apr 473,772 341,769 141,000 67,410 119,520 90,159 734,292 499,338May 488,310 370,299 144,553 78,322 132,246 98,148 765,109 546,769Jun 483,180 401,077 139,890 82,547 128,640 97,199 751,710 580,823Jul 488,310 406,588 145,886 86,964 133,362 101,450 767,558 595,002Aug 488,310 416,768 145,483 91,807 136,691 101,750 770,484 610,325Sep 487,320 389,998 135,060 80,814 130,780 101,584 753,160 572,396Oct 492,588 383,309 136,710 75,904 133,114 102,504 762,412 561,717Nov 477,912 313,594 134,490 62,486 124,350 94,383 736,752 470,463Dec 501,996 298,520 142,104 63,175 135,253 99,615 779,353 461,310
Total 5,812,712 4,320,644 1,691,698 890,919 1,572,541 1,168,674 9,076,951 6,380,237
Condos/Timeshares Total Room/Unit RV Park Unit Nights Unit Nights Nights All-Types
Month Available Occupied Available Occupied Available Occupied Jan 38,905 19,971 33,480 11,632 72,385 31,603 Feb 35,140 18,858 30,240 12,042 65,380 30,900 Mar 38,905 24,231 33,480 12,612 72,385 36,843 Apr 37,650 24,761 32,400 9,841 70,050 34,602 May 38,905 28,830 33,604 9,961 72,509 38,791 Jun 37,650 30,482 34,560 12,612 72,210 43,094 Jul 38,905 29,916 38,936 18,261 77,841 48,177 Aug 39,065 32,847 39,494 18,787 78,559 51,634 Sep 41,400 32,518 37,770 14,454 79,170 46,972 Oct 38,905 30,482 35,154 11,565 74,059 42,047 Nov 37,650 22,727 33,420 8,979 71,070 31,706 Dec 38,905 20,607 36,332 11,803 75,237 32,410
Total 461,985 316,230 418,870 152,549 880,855 468,779

12
NUMBER OF ROOMS
NUMBER OF LICENSED ROOMS/UNITS BY TYPE & LOCATION As of Dec 31, 2003
Balance of County (Unincorporated) City of City of Total No. of Type of Property Reno Sparks N. Tahoe Other* Rooms Licensees Hotels 12,396 2,200 716 0 15,312 24 Motels/Limited Service 3,604 794 61 161 4,620 77 RV Parks 844 256 0 155 1,255 13 Condos/Timeshares 260 161 783 8 1,212 17 28-Day Rentals (all types) 3,948 349 0 120 4,417 205 Total 21,052 3,760 1,560 444 26,816 236 * All properties in the "Other" unincorporated area lie outside the Reno city limits.

13
ROOM TAX, RATES, REVENUES GROSS ROOM TAX DISTRIBUTION BY GEOGRAPHIC AREA ($000) Total Total % 2003 2002 Change 1% Nevada Lodging Tax 5/8% RSCVA Portion 1,595 1,617 -1.4% 3/8% State Portion 957 970 -1.3% 1% National Bowling Stadium Tax 2,561 2,594 1.3% Railroad Project 965 971 -0.6% 6% RSCVA Dedicated Tax 15,319 15,518 -1.3% Convention Center Expansion 5,106 5.173 -1.3% 1% Local Government Tax 2,252 2,279 -1.2% City Center Development 3,085 3,136 -1.6% 2.5% Sparks Redevelopment 406 0 N/A Total Collections CY 2003 32,246 32.258 0.0% Prior Year Collections 32,258 33,162 % Change From Prior Year 0.0% -2.7% NET RSCVA ROOM TAX
GROSS ROOM TAX COLLECTIONS REVENUES (6-5/8%) Month 2003 2002 %Chg Month 2003 2002 %Chg
Jan 2,054,059 1,978,659 3.7% Jan 1,092,831 1,058,209 3.2% Feb 2,244,380 2,495,625 -11.2% Feb 1,196,286 1,334,011 -11.5% Mar 2,434,632 2,568,614 -5.5% Mar 1,292,858 1,364,704 -5.6% Apr 2,326,258 2,632,691 -13.2% Apr 1,233,542 1,397,505 -13.3% May 2,754,461 2,458,049 10.8% May 1,454,760 1,302,343 10.5% Jun 2,927,661 2,906,568 0.7% Jun 1,550,331 1,535,827 0.9% Jul 3,288,834 3,262,508 0.8% Jul 1,713,199 1,738,219 -1.5% Aug 3,879,017 3,810,491 1.8% Aug 2,012,288 2,022,683 -0.5% Sep 3,425,168 3,486,498 -1.8% Sep 1,779,717 1,848,171 -3.8% Oct 2,720,565 2,626,751 3.4% Oct 1,410,509 1,390,163 1.4% Nov 2,112,892 2,057,841 2.6% Nov 1,097,826 1,090,311 0.7% Dec 2,078,881 1,973,942 5.0% Dec 1,080,349 1,053,134 2.5%
Total 32,246,808 32,258,237 0.0% Total 16,914,496 17,135,280 -1.3%

14
CASH OCCUPIED ROOM NIGHTS TAXABLE ROOM REVENUES All Washoe County ($000)
The following represents occupied room nights for which room tax was Month 2003 2002 % Change collected. It does not include the following which are not taxable: Jan 16,486 15,979 3.1% complimentary rooms, rooms occupied for more than 28 consecutive Feb 18,106 20,094 -11.0% nights, timeshares owners/traders or occupancy in non-licensed properties. Mar 19,239 20,235 -5.2% Type 2003 2002 % Change Apr 18,305 21,020 -14.8% Hotels 3,493,412 3,542,358 -1.4% May 21,999 19,775 10.1% Motels/Limited Service 629,473 648,599 -3.0% Jun 23,384 21,869 6.5% RV Parks 99,601 112,513 -13.0% Jul 25,529 26,319 -3.1% Condos/Timeshares 114,966 128,134 -11.5% Aug 30,210 30,624 -1.4% 28 Day Properties 165,793 162,829 1.8% Sep 26,917 27,921 -3.7% Total 4,503,245 4,594,433 -2.0% Oct 21,254 20,756 2.3% Nov 16,693 16,467 1.4% Dec 15,967 15,904 0.4% Total 254,089 256,963 -1.1%
Reported gross revenues adjusted for comps and other non taxable rentals.
AVERAGE DAILY ROOM RATE (ADR)
2003 2002 % Change Washoe County* $58.93 $58.52 0.7% National Average** $83.13 $83.70 -0.7% *This is the cash room rate. Complimentary rooms are excluded from the calculation. ** Received source from Smith’s Travel Research Data

15
GAMING
GAMING WIN GAMING WIN Washoe County (All) ($000) Reno ($000)
Month 2003 2002 % Change Month 2003 2002 % Change Jan 81,122 70,193 15.6% Jan 58,758 50,429 16.5% Feb 74,749 77,535 -3.6% Feb 54,053 56,209 -3.8% Mar 85,316 85,504 -0.2% Mar 62,788 62,816 0.0% Apr 77,712 87,129 -10.8% Apr 58,071 64,250 -9.6% May 93,576 92,903 0.7% May 70,474 68,178 3.4% Jun 85,717 86,772 -1.2% Jun 63,588 63,667 -0.1% Jul 90,579 96,001 -5.6% Jul 65,815 69,807 -5.7% Aug 99,660 101,427 -1.7% Aug 72,202 74,378 -2.9% Sep 86,098 93,431 -7.8% Sep 62,942 67,676 -7.0% Oct 89,658 88,849 0.9% Oct 65,737 65,176 0.9% Nov 76,525 82,581 -7.3% Nov 55,464 60,446 -8.2% Dec 69,584 72,464 -4.0% Dec 49,651 52,368 -5.2%
Total 1,010,296 1,034,789 -2.4% Total 739,543 755,400 -2.1%
GAMING WIN GAMING WIN Sparks ($000) North Lake Tahoe ($000)
Month 2003 2002 % Change Month 2003 2002 % Change Jan 12,747 10,836 17.6% Jan 3,438 3,791 -9.3% Feb 12,399 12,470 -0.6% Feb 2,342 2,776 -15.6% Mar 13,308 13,674 -2.7% Mar 2,507 2,780 -9.8% Apr 12,004 13,799 -13.0% Apr 1,591 2,562 -37.9% May 13,371 14,583 -8.3% May 2,408 2,773 -13.2% Jun 12,193 13,356 -8.7% Jun 3,211 3,185 0.8% Jul 13,488 13,595 -0.8% Jul 4,427 5,205 -14.9% Aug 15,340 15,025 2.1% Aug 4,524 4,323 4.6% Sep 12,691 14,427 -12.0% Sep 3,746 3,841 -2.5% Oct 13,690 13,953 -1.9% Oct 2,961 2,522 17.4% Nov 12,619 13,359 -5.5% Nov 2,627 2,269 15.8% Dec 12,441 12,484 -0.3% Dec 2,583 2,404 7.4%
Total 156,291 161,561 -3.3% Total 36,365 38,431 -5.4%
16
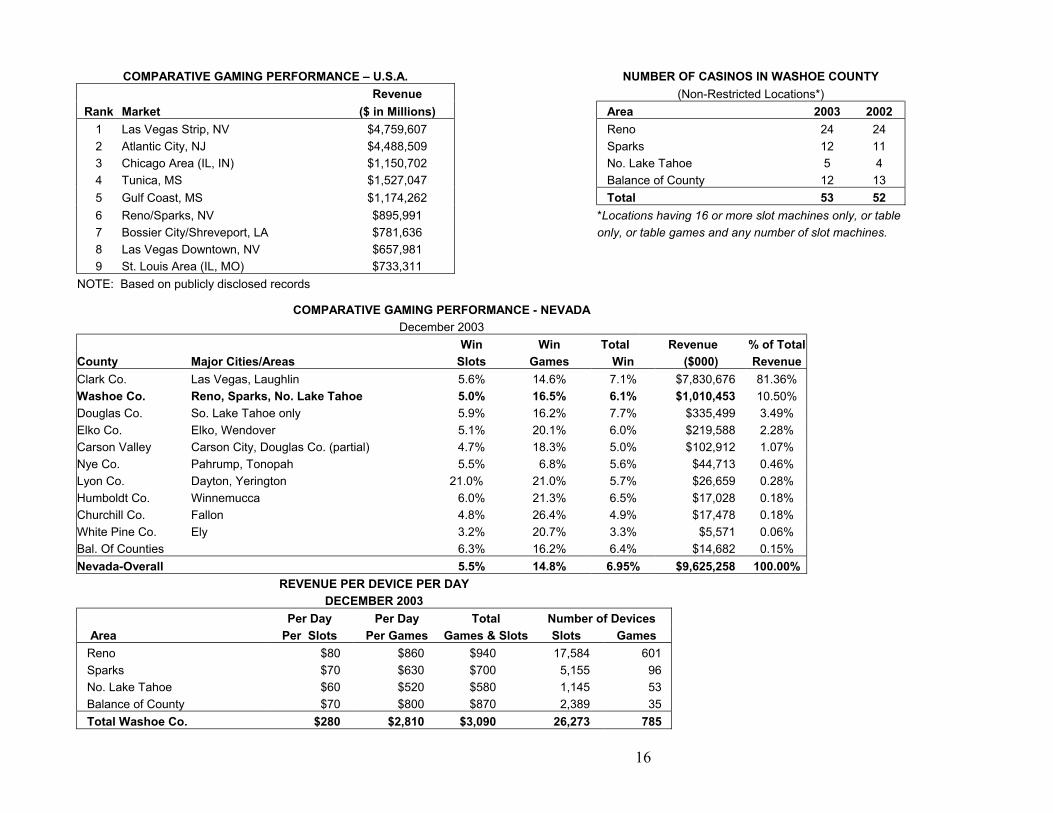
COMPARATIVE GAMING PERFORMANCE – U.S.A. NUMBER OF CASINOS IN WASHOE COUNTY Revenue (Non-Restricted Locations*)
Rank Market ($ in Millions) Area 2003 2002 1 Las Vegas Strip, NV $4,759,607 Reno 24 24 2 Atlantic City, NJ $4,488,509 Sparks 12 11 3 Chicago Area (IL, IN) $1,150,702 No. Lake Tahoe 5 4 4 Tunica, MS $1,527,047 Balance of County 12 13 5 Gulf Coast, MS $1,174,262 Total 53 52 6 Reno/Sparks, NV $895,991 *Locations having 16 or more slot machines only, or table7 Bossier City/Shreveport, LA $781,636 only, or table games and any number of slot machines. 8 Las Vegas Downtown, NV $657,981 9 St. Louis Area (IL, MO) $733,311
NOTE: Based on publicly disclosed records
COMPARATIVE GAMING PERFORMANCE - NEVADA December 2003
Win Win Total Revenue % of TotalCounty Major Cities/Areas Slots Games Win ($000) RevenueClark Co. Las Vegas, Laughlin 5.6% 14.6% 7.1% $7,830,676 81.36% Washoe Co. Reno, Sparks, No. Lake Tahoe 5.0% 16.5% 6.1% $1,010,453 10.50% Douglas Co. So. Lake Tahoe only 5.9% 16.2% 7.7% $335,499 3.49% Elko Co. Elko, Wendover 5.1% 20.1% 6.0% $219,588 2.28% Carson Valley Carson City, Douglas Co. (partial) 4.7% 18.3% 5.0% $102,912 1.07% Nye Co. Pahrump, Tonopah 5.5% 6.8% 5.6% $44,713 0.46% Lyon Co. Dayton, Yerington 21.0% 21.0% 5.7% $26,659 0.28% Humboldt Co. Winnemucca 6.0% 21.3% 6.5% $17,028 0.18% Churchill Co. Fallon 4.8% 26.4% 4.9% $17,478 0.18% White Pine Co. Ely 3.2% 20.7% 3.3% $5,571 0.06% Bal. Of Counties 6.3% 16.2% 6.4% $14,682 0.15% Nevada-Overall 5.5% 14.8% 6.95% $9,625,258 100.00%
REVENUE PER DEVICE PER DAY DECEMBER 2003
Per Day Per Day Total Number of Devices Area Per Slots Per Games Games & Slots Slots Games Reno $80 $860 $940 17,584 601 Sparks $70 $630 $700 5,155 96 No. Lake Tahoe $60 $520 $580 1,145 53 Balance of County $70 $800 $870 2,389 35 Total Washoe Co. $280 $2,810 $3,090 26,273 785

17
CONVENTION SALES
RENO AREA CONVENTIONS HELD Number Held Actual Attendance Actual Room Nights
Month 2003 2002 % Change 2003 2002 % Change 2003 2002 % Change Jan 13 14 -7.14% 21,077 20,080 4.97% 33,857 37,410 -9.50% Feb 22 34 -35.29% 126,324 18,455 584.50% 223,565 31,903 600.76% Mar 31 19 63.16% 21,656 10,910 98.50% 22,276 14,311 55.66% Apr 25 44 -43.18% 14,355 15,988 -10.21% 30,306 33,670 -9.99% May 35 42 -16.67% 17,943 13,319 34.72% 37,801 21,693 74.25% Jun 27 27 0.00% 76,846 16,992 352.25% 20,110 41,310 -51.32% Jul 31 23 34.78% 20,655 16,205 27.46% 42,355 26,963 57.09% Aug 15 24 -37.50% 7,961 9,362 -14.96% 13,865 13,990 -0.89% Sep 24 38 -36.84% 11,191 15,664 -28.56% 19,442 26,530 -26.72% Oct 40 49 -18.37% 28,399 29,544 -3.88% 34,160 22,253 53.51% Nov 19 23 -17.39% 13,960 11,040 26.45% 26,356 25,222 4.50% Dec 6 8 -25.00% 2,346 2,440 -3.85% 5,586 6,553 -14.76%
Total 288 345 -16.52% 362,713 179,999 101.51% 509,679 301,808 68.88%
CONVENTIONS BOOKED IN 2003
by RSCVA Sales Staff Expected Number Expected Room Booked Attendance Nights
2003 18 34,234 65,300 2004 3 10,871 20,735 2005 1 2,011 3,835 2006 15 136,885 36,617 2007 8 179,350 360,907 2008 13 52,150 101,074 Total 58 415,501 588,468
Prior Year 390 543,350 789,202 % Change -85.13% -23.53% -25.44%

18
RENO-SPARKS CONVENTION CENTER
EVENT USE DAYS By Area
North South Mt. North South East Meeting Meeting Rose Other
Month Hall Hall Hall Rooms Rooms Ballroom Areas Total Jan 4 1 7 2 4 1 1 20 Feb 11 12 16 16 6 7 3 71 Mar 30 4 11 18 1 6 1 71 Apr 21 13 13 15 13 8 7 90 May 7 11 7 17 12 16 7 77 Jun 6 6 6 5 0 4 17 44 Jul 13 9 9 14 10 10 13 78 Aug 14 11 11 21 11 13 11 92 Sep 0 0 0 3 10 5 2 20 Oct 13 8 1 15 22 5 5 69 Nov 16 2 7 11 3 2 0 41 Dec 18 0 7 4 4 0 0 33
Total 153 77 95 141 96 77 67 706 Total Prior Yr. 37 18 10 89 30 10 9 203 % Change 24.18% 23.38% 10.53% 63.12% 31.25% 12.99% 13.43% 28.75%
EVENT USE DAYS By Type of Event
Spectator Conventions/ Public Misc. Events/
Month Trade Shows Shows Meetings Ice Hockey Total JAN 4 7 4 0 15 FEB 12 8 16 0 36 MAR 20 4 17 0 41 APR 6 3 15 6 30 MAY 3 1 20 0 24 JUN 0 14 10 3 27 JUL 3 6 6 0 15 AUG 10 4 7 6 27 SEP 4 10 9 0 23 OCT 6 29 13 0 48 NOV 14 1 4 0 19 DEC 8 1 6 0 15
TOTAL 90 88 127 15 320 TOTAL 2002 * 4 103 190 8 305 DIFFERENCE 86 -15 -63 7 15 % CHANGE 2150.00% -14.56% -33.16% 87.50% 4.92%

19
RENO-SPARKS LIVESTOCK EVENTS CENTER
RENO-SPARKS LIVESTOCK EVENTS CENTER EVENT USE DAYS - BY AREA
Main Livestock Cutting Stalls/ Rodeo ExhibitMonth Arena Pavilion Arena Barns Arena Hall
Jan 7 5 0 0 0 10 Feb 7 7 0 0 0 3 Mar 12 11 4 0 4 9 Apr 12 11 0 0 7 7 May 17 21 14 21 1 8 Jun 23 23 23 23 24 23 Jul 19 15 7 14 11 6 Aug 12 9 12 13 14 8 Sep 14 13 9 16 16 14 Oct 17 16 16 11 14 2 Nov 10 10 7 0 0 8 Dec 7 2 0 0 0 6 Total 157 143 92 98 91 104 Prior Year 175 160 131 147 137 149 % Change -10% -11% -30% -33% -34% -30%
RENO-SPARKS LIVESTOCK EVENTS CENTER EVENT USE DAYS - BY TYPE OF EVENT
Equine & Livestock Public Sporting Misc.
Month Events Shows Events Other Total Jan 1 3 7 7 18 Feb 3 5 4 0 12 Mar 12 7 3 3 25 Apr 16 9 3 0 28 May 25 6 0 2 33 Jun 24 0 0 0 24 Jul 21 4 4 2 31 Aug 3 10 3 1 17 Sep 16 4 0 2 22 Oct 16 2 0 3 21 Nov 7 6 3 2 18 Dec 2 5 7 1 15 Total 146 61 34 23 264 Prior Year 162 95 20 26 303 % Change -9.88% -35.79% 70.00% -11.54% -12.87%
20
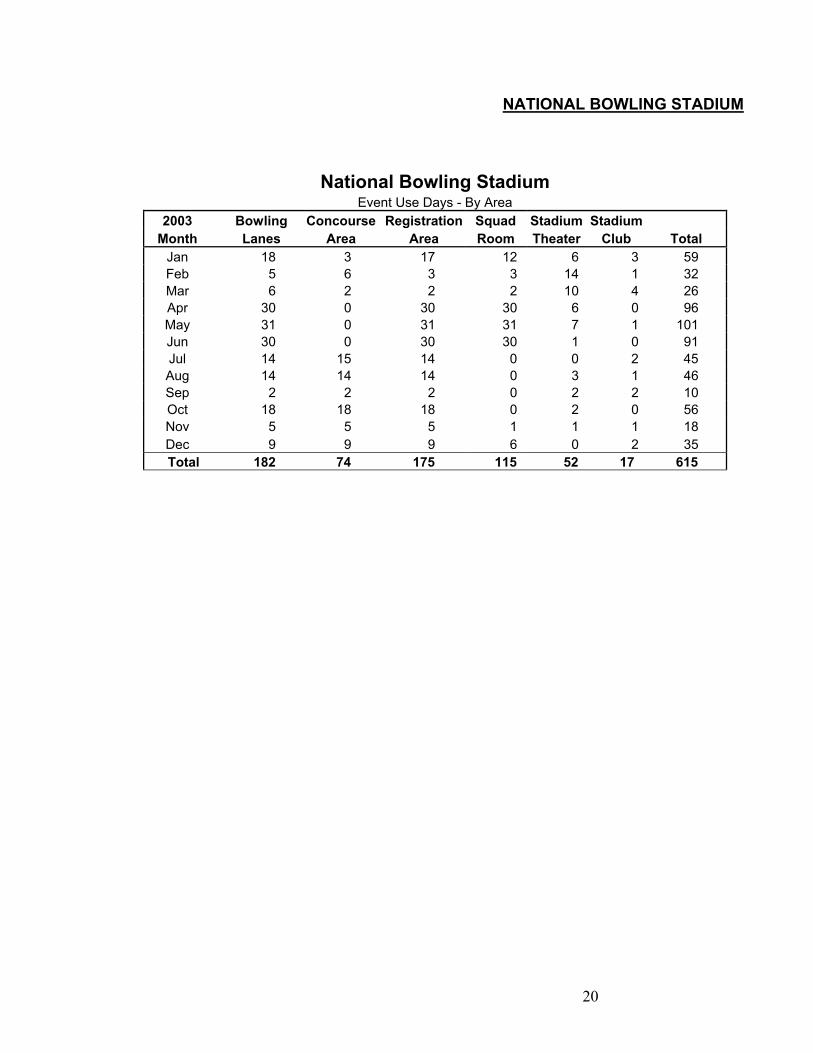
NATIONAL BOWLING STADIUM
National Bowling Stadium Event Use Days - By Area
2003 Bowling Concourse Registration Squad Stadium Stadium Month Lanes Area Area Room Theater Club Total
Jan 18 3 17 12 6 3 59 Feb 5 6 3 3 14 1 32 Mar 6 2 2 2 10 4 26 Apr 30 0 30 30 6 0 96 May 31 0 31 31 7 1 101 Jun 30 0 30 30 1 0 91 Jul 14 15 14 0 0 2 45 Aug 14 14 14 0 3 1 46 Sep 2 2 2 0 2 2 10 Oct 18 18 18 0 2 0 56 Nov 5 5 5 1 1 1 18 Dec 9 9 9 6 0 2 35 Total 182 74 175 115 52 17 615
21
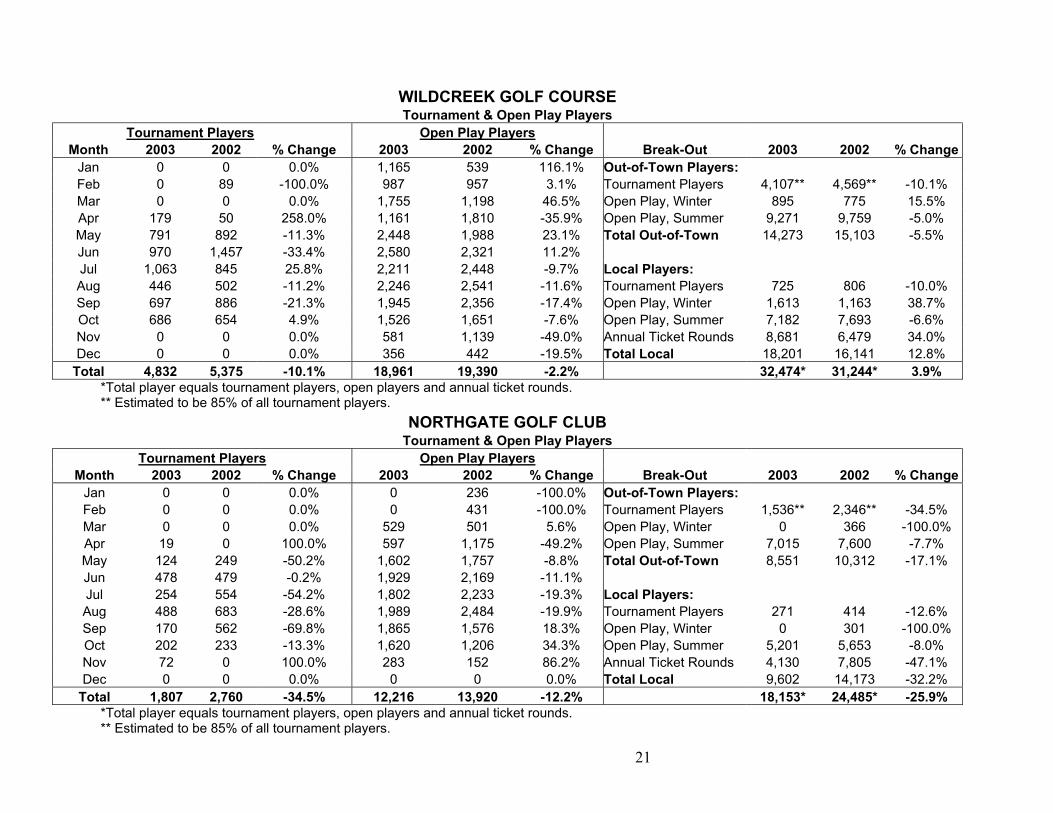
WILDCREEK GOLF COURSE Tournament & Open Play Players
Tournament Players Open Play Players Month 2003 2002 % Change 2003 2002 % Change Break-Out 2003 2002 % Change
Jan 0 0 0.0% 1,165 539 116.1% Out-of-Town Players: Feb 0 89 -100.0% 987 957 3.1% Tournament Players 4,107** 4,569** -10.1% Mar 0 0 0.0% 1,755 1,198 46.5% Open Play, Winter 895 775 15.5% Apr 179 50 258.0% 1,161 1,810 -35.9% Open Play, Summer 9,271 9,759 -5.0% May 791 892 -11.3% 2,448 1,988 23.1% Total Out-of-Town 14,273 15,103 -5.5% Jun 970 1,457 -33.4% 2,580 2,321 11.2% Jul 1,063 845 25.8% 2,211 2,448 -9.7% Local Players: Aug 446 502 -11.2% 2,246 2,541 -11.6% Tournament Players 725 806 -10.0% Sep 697 886 -21.3% 1,945 2,356 -17.4% Open Play, Winter 1,613 1,163 38.7% Oct 686 654 4.9% 1,526 1,651 -7.6% Open Play, Summer 7,182 7,693 -6.6% Nov 0 0 0.0% 581 1,139 -49.0% Annual Ticket Rounds 8,681 6,479 34.0% Dec 0 0 0.0% 356 442 -19.5% Total Local 18,201 16,141 12.8%
Total 4,832 5,375 -10.1% 18,961 19,390 -2.2% 32,474* 31,244* 3.9% *Total player equals tournament players, open players and annual ticket rounds. ** Estimated to be 85% of all tournament players.
NORTHGATE GOLF CLUB Tournament & Open Play Players
Tournament Players Open Play Players Month 2003 2002 % Change 2003 2002 % Change Break-Out 2003 2002 % Change
Jan 0 0 0.0% 0 236 -100.0% Out-of-Town Players: Feb 0 0 0.0% 0 431 -100.0% Tournament Players 1,536** 2,346** -34.5% Mar 0 0 0.0% 529 501 5.6% Open Play, Winter 0 366 -100.0% Apr 19 0 100.0% 597 1,175 -49.2% Open Play, Summer 7,015 7,600 -7.7% May 124 249 -50.2% 1,602 1,757 -8.8% Total Out-of-Town 8,551 10,312 -17.1% Jun 478 479 -0.2% 1,929 2,169 -11.1% Jul 254 554 -54.2% 1,802 2,233 -19.3% Local Players: Aug 488 683 -28.6% 1,989 2,484 -19.9% Tournament Players 271 414 -12.6% Sep 170 562 -69.8% 1,865 1,576 18.3% Open Play, Winter 0 301 -100.0% Oct 202 233 -13.3% 1,620 1,206 34.3% Open Play, Summer 5,201 5,653 -8.0% Nov 72 0 100.0% 283 152 86.2% Annual Ticket Rounds 4,130 7,805 -47.1% Dec 0 0 0.0% 0 0 0.0% Total Local 9,602 14,173 -32.2%
Total 1,807 2,760 -34.5% 12,216 13,920 -12.2% 18,153* 24,485* -25.9% *Total player equals tournament players, open players and annual ticket rounds. ** Estimated to be 85% of all tournament players.

22
TEN YEAR TRENDS Motel/Limited Total Estimated Convention Hotel Service Hotel/Motel
Year Visitors Attendance* Occupancy** Occupancy** Occupancy** 2003 4,865,485 362,713 74.6% 52.9% 70.3% 2002 4,914,854 179,999 75.2% 51.4% 70.7% 2001 5,008,504 190,124 76.9% 53.0% 70.3% 2000 5,188,325 176,926 78.4% 40.2% 71.7% 1999 5,051,101 192,816 78.1% 46.1% 71.1% 1998 5,121,693 256,285 78.3% 45.7% 71.6% 1997 5,155,649 250,184 77.8% 46.1% 71.3% 1996 5,215,010 196,707 82.3% 45.1% 73.9% 1995 4,851,269 314,137 85.1% 51.3% 76.3% 1994 4,472,506 203,389 83.5% 49.0% 74.1%
Licensed Gross Airport Average Daily Room Tax Room/Units Revenue Passengers Highway Traffic
Year (Gross) (All Types)*** Gaming ($000) Total (I-80 @Verdi)
2003 $32,246,808 26,816 $1,010,452 4,586,027 34,560 2002 $32,258,237 28,136 $1,034,789 4,510,406 30,095 2001 $33,162,884 27,257 $1,080,732 4,932,648 28,226 2000 $32,803,096 27,583 $1,140,598 5,620,246 28,386 1999 $29,548,900 27,793 $1,073,550 6,104,086 27,349 1998 $23,465,500 27,573 $1,024,626 6,782,468 25,488 1997 $22,899,700 28,422 $995,371 6,862,965 25,686 1996 $21,324,000 28,085 $975,629 6,747,173 24,604 1995 $21,531,800 27,414 $984,353 5,801,197 24,338 1994 $19,597,600 25,074 $918,327 5,336,334 23,538
*For historical purposes, attendees at major bowling tournaments are included as "conventioneers". The American Bowling Congress met in Reno in 1995, 1998 and 2001. The Women's International Bowling Congress met in Reno in 1997, 2000 and 2003.
**Occupancy by visitors only. Long-term, semi-permanent occupancy is not included. ***Licensed lodging properties include: Hotels, Motels/Ltd Service, RV Parks, Condos
and Timeshares, properties of any type that do mainly long-term, non-visitor business (28 days or longer) and others.
23
Acknowledgments
The Reno-Sparks Convention & Visitors Authority wishes to thank the following contributors to this report: Airport Authority of Washoe County – Airport traffic data Amtrak Nevada Gaming Control Board – Internet report data Nevada Department of Transportation Western Regional Climate Center – Temperatures U.S. Census Bureau – Population
Reno-Sparks Convention and Visitors Authority P.O. Box 837
Reno, NV 89504-0837 Phone: (775) 827-7600 Fax: (775) 827-7646