Microclimate evaluation of a new design of insect-proof ... · carsia Formosa (Hoddle et al., 1998)...
15
Introduction With a view to reducing the entrance of certain in- sects in the greenhouse (aphids, leaf miners, whitefly, thrips or mealybugs), insect-proof screens are ins- talled on the vents, thus reducing the need for phyto- sanitary treatments (Baker & Jones, 1989; Berlinger et al., 1992), while at the same time avoiding the exit of beneficial insects (Taylor et al., 2001; Teitel, 2007). On the other hand, the use of these materials reduces the greenhouses’ capacity for natural ventilation (Muñoz et al., 1999; Fatnassi et al., 2003; Kittas et al., Microclimate evaluation of a new design of insect-proof screens in a Mediterranean greenhouse Alejandro Lopez-Martinez, Diego L. Valera-Martinez*, Francisco Molina-Aiz, Araceli Peña-Fernandez and Patricia Marin-Membrive Centro de Investigación en Biotecnología Alimentaria BITAL. Universidad de Almería. Ctra. de Sacramento, s/n. 04120 Almería, Spain Abstract This work studies natural ventilation in a Mediterranean greenhouse, comparing a new experimental screen of 13 × 30 threads cm –2 (porosity 39.0%) with a commercial control screen of 10 × 20 threads cm –2 (porosity 33.5%). In addition, both screens were tested in a wind tunnel to determine the discharge coefficients C d of the greenhouse side and roof vents, which proved to be 0.16 for the commercial control screen and 0.18 for the experimental screen at both vents. These values represent a theoretical increase of 11% (C d,ϕ-10 × 20 /C d,ϕ-13 × 30 = 0.89) in the natural ventilation capacity of the greenhouse when the experimental screen is used. The greenhouse was divided into two separate sections allowing us to analyze natural ventilation in both sectors simultaneously. Air velocity was measured in the lateral and roof vents with two 3D and six 2D sonic anemometers. Using the commercial control screen there was an average reduction of 16% in ventilation rate, and an average increase of 0.5°C in the average indoor air temperature, compared to the experimental screen. In addition, the ventilation efficiency η T was higher with the experimental screen (mean value of 0.9) than with the control (mean value 0.6). We have designed an experimental insect-proof screen (13 × 30 threads cm –2 ) with smaller thread diameter, higher thread density, smaller pore size and higher porosity than are used in most commercial meshes. All of these factors promote natural ventilation and improve the greenhouse microclimate. Additional key words: natural ventilation; sonic anemometry; discharge coefficient; ventilation efficiency. * Corresponding author: [email protected] Received: 05-09-13 Accepted: 07-05-14. Abbreviations used. Nomenclature: C d (total discharge coefficient of the opening); C d,LH (discharge coefficient due to the shape of the opening); C d,ϕ (discharge coefficient due to the presence of insect-proof screens); D f [thread density according to the manu- facturer (threads cm –2 )]; D h [diameter of the threads (μm)]; D i [diameter of the inside circumference of the pore (μm)]; D r [thread density measurement (threads cm –2 )]; E [thickness of the screen (μm)]; E G [error in the calculation of volumetric flow rate (%)]; F ϕ (pressure drop coefficient due to the presence of an insect-proof screen); G [mean volumetric flow rate (m 3 s –1 )]; HR [relative air humidity (%)]; K p [screen permeability (m 2 )]; L px [length of the pore in the weft direction (μm)]; L py [length of the pore in the warp direction (μm)]; L V [length of the vent (m)]; P [pressure (Pa)]; q [specific humidity (g g –1 )]; R [ventilation rate (h –1 )]; Re p (Reynolds number based on the screen’s permeability); R o [incoming shortwave radiation (W m –2 )]; S A [greenhouse surface area (m 2 )]; S j [unit surface area corresponding to each measurement point in the vent (m 2 )]; S p [area of the pore (mm 2 )]; S V [vent surfa- ce area (m 2 )]; T [temperature (°C)]; u [air velocity (m s –1 )]; Y (inertial factor). Greek letters: Δ (difference); β [angle of opening (°)]; η T (ventilation efficiency for the temperature); θ [wind direction (°)]; μ [dynamic viscosity of air (kg s –1 m –1 )]; ρ a [air density (kg m –3 )]; ϕ [insect-proof screen porosity (%)]. Subscripts: C (corrected); i (inside); j (measurement point); LS (leeward side vent); M (average value); O (outside); S (sonic); WR (windward roof vent); WS (windward side vent); x (longitudinal component). Su- perscripts: * (corrected with wind speed); c (corrected with inside-outside air temperature). Instituto Nacional de Investigación y Tecnología Agraria y Alimentaria (INIA) Spanish Journal of Agricultural Research 2014 12(2): 338-352 http://dx.doi.org/10.5424/sjar/2014122-4956 ISSN: 1695-971-X eISSN: 2171-9292 RESEARCH ARTICLE OPEN ACCESS
Transcript of Microclimate evaluation of a new design of insect-proof ... · carsia Formosa (Hoddle et al., 1998)...

Introduction
With a view to reducing the entrance of certain in-sects in the greenhouse (aphids, leaf miners, whitefly,thrips or mealybugs), insect-proof screens are ins-talled on the vents, thus reducing the need for phyto-
sanitary treatments (Baker & Jones, 1989; Berlingeret al., 1992), while at the same time avoiding the exitof beneficial insects (Taylor et al., 2001; Teitel, 2007).On the other hand, the use of these materials reducesthe greenhouses’ capacity for natural ventilation (Muñoz et al., 1999; Fatnassi et al., 2003; Kittas et al.,
Microclimate evaluation of a new design of insect-proof screens in a Mediterranean greenhouse
Alejandro Lopez-Martinez, Diego L. Valera-Martinez*, Francisco Molina-Aiz,Araceli Peña-Fernandez and Patricia Marin-Membrive
Centro de Investigación en Biotecnología Alimentaria BITAL. Universidad de Almería. Ctra. de Sacramento, s/n.04120 Almería, Spain
Abstract
This work studies natural ventilation in a Mediterranean greenhouse, comparing a new experimental screen of13 × 30 threads cm–2 (porosity 39.0%) with a commercial control screen of 10 × 20 threads cm–2 (porosity 33.5%). Inaddition, both screens were tested in a wind tunnel to determine the discharge coefficients Cd of the greenhouse sideand roof vents, which proved to be 0.16 for the commercial control screen and 0.18 for the experimental screen at bothvents. These values represent a theoretical increase of 11% (Cd,ϕ-10 × 20 /Cd,ϕ-13 × 30 = 0.89) in the natural ventilation capacityof the greenhouse when the experimental screen is used. The greenhouse was divided into two separate sections allowingus to analyze natural ventilation in both sectors simultaneously. Air velocity was measured in the lateral and roof ventswith two 3D and six 2D sonic anemometers. Using the commercial control screen there was an average reduction of16% in ventilation rate, and an average increase of 0.5°C in the average indoor air temperature, compared to theexperimental screen. In addition, the ventilation efficiency ηT was higher with the experimental screen (mean valueof 0.9) than with the control (mean value 0.6). We have designed an experimental insect-proof screen (13 × 30 threadscm–2) with smaller thread diameter, higher thread density, smaller pore size and higher porosity than are used in mostcommercial meshes. All of these factors promote natural ventilation and improve the greenhouse microclimate.
Additional key words: natural ventilation; sonic anemometry; discharge coefficient; ventilation efficiency.
* Corresponding author: [email protected]: 05-09-13 Accepted: 07-05-14.
Abbreviations used. Nomenclature: Cd (total discharge coefficient of the opening); Cd,LH (discharge coefficient due to the shapeof the opening); Cd,ϕ (discharge coefficient due to the presence of insect-proof screens); Df [thread density according to the manu-facturer (threads cm–2)]; Dh [diameter of the threads (µm)]; Di [diameter of the inside circumference of the pore (µm)]; Dr [threaddensity measurement (threads cm–2)]; E [thickness of the screen (µm)]; EG [error in the calculation of volumetric flow rate (%)];Fϕ (pressure drop coefficient due to the presence of an insect-proof screen); G [mean volumetric flow rate (m3 s–1)]; HR [relativeair humidity (%)]; Kp [screen permeability (m2)]; Lpx [length of the pore in the weft direction (µm)]; Lpy [length of the pore in thewarp direction (µm)]; LV [length of the vent (m)]; P [pressure (Pa)]; q [specific humidity (g g–1)]; R [ventilation rate (h–1)]; Rep
(Reynolds number based on the screen’s permeability); Ro [incoming shortwave radiation (W m–2)]; SA [greenhouse surface area(m2)]; Sj [unit surface area corresponding to each measurement point in the vent (m2)]; Sp [area of the pore (mm2)]; SV [vent surfa-ce area (m2)]; T [temperature (°C)]; u [air velocity (m s–1)]; Y (inertial factor). Greek letters: Δ (difference); β [angle of opening(°)]; ηT (ventilation efficiency for the temperature); θ [wind direction (°)]; µ [dynamic viscosity of air (kg s–1 m–1)]; ρa [air density(kg m–3)]; ϕ [insect-proof screen porosity (%)]. Subscripts: C (corrected); i (inside); j (measurement point); LS (leeward side vent);M (average value); O (outside); S (sonic); WR (windward roof vent); WS (windward side vent); x (longitudinal component). Su-perscripts: * (corrected with wind speed); c (corrected with inside-outside air temperature).
Instituto Nacional de Investigación y Tecnología Agraria y Alimentaria (INIA) Spanish Journal of Agricultural Research 2014 12(2): 338-352http://dx.doi.org/10.5424/sjar/2014122-4956 ISSN: 1695-971-X
eISSN: 2171-9292
RESEARCH ARTICLE OPEN ACCESS

2008; Baeza et al., 2009; Molina-Aiz et al., 2009),which has negative repercussions on the greenhousemicroclimate, increasing the interior temperature andhumidity (Fatnassi et al., 2006; Harmanto et al., 2006).
Growers must install insect-proof screens with anaverage pore size smaller than the size of the tiniestinsect pest (Teitel, 2007), but at the same time the po-rosity of the chosen screens must not be detrimentalto the natural ventilation of the greenhouse. Given thisscenario, the growers’ choice of mesh is limited, as lo-wer porosity meshes reduce the ventilation rate and increase both temperature and humidity inside the greenhouse (Fatnassi et al., 2003). For instance, amesh of 25% porosity can cause a drop in the green-house ventilation rate of 77-87% (Baeza et al., 2009);one of 53% porosity was found to reduce the ventila-tion rate by 50% and increase the greenhouse tempe-rature by 4°C compared to a greenhouse without meshes (Bartzanas et al., 2002). Other studies haveobtained the following results: 27% reduction in ven-tilation rate with a mesh of 50% porosity (Katsoulaset al., 2006), 50% reduction with a mesh of 45% po-rosity (Muñoz et al., 1999), 35% reduction with amesh of 39% porosity (Pérez-Parra et al., 2004), 35%reduction with a mesh of 34% porosity (Campen &Bot, 2003), 38% reduction with a mesh of 34% poro-sity, and 55% reduction with a mesh of 26% porosity(Campen, 2005).
The above-mentioned negative aspects of the screens may be exacerbated by the accumulation ofdust and dirt in the pores of the mesh (Linker et al.,2002; López et al., 2013). Over time the structure ofthe mesh deteriorates, and López et al. (2013) obser-ved that the thread diameter increases by an averageof 3.1% and the porosity of the screen suffers a meanreduction of 6.5%. The accumulation of dust and dirtin the insect-proof screens gives rise to a mean reduc-tion in the porosity of the insect-proof screens of20.3%. The combined total of these two negative effects (mesh degradation and accumulation of dust)amounted to a 26.8% mean reduction in porosity (López et al., 2013).
To avoid the entrance of insects into greenhouse, in-sect-proof screens are indispensable, but solutionsmust be sought to minimize their effect on the naturalventilation and the greenhouse microclimate. At thispoint several possibilities may be put forward:
— (i) Increasing the total ventilation surface in or-der to limit as much as possible the reduction in natu-ral ventilation capacity brought about by the use of in-
sect-proof screens (Muñoz et al., 1999; Teitel, 2007).One option is to increase the maximum angle to whichthe roof vent can be opened in multi-span greenhou-ses (Bailey, 2003), though this is hardly viable in areas with frequent strong winds. Another way is to fitthe frames of the openings with pre-formed concerti-na-shape screens that unfold as the vents open and foldup again when they close (Bailey, 2003).
— (ii) Combining insect-proof screens with othermeans of pest control which allow the use of mesh withlower thread density and greater pore size. For instan-ce, biological control methods making use of other in-sects, mites, fungi, bacteria, viruses, nematodes andweeds (auxiliary), which act as parasites, predators,pathogens, antagonists or competitors of the organismsthat cause damage to the crop. The green revolutionthat Almería (Spain) has undergone over the last fouryears is particularly noteworthy. In this area many ofthe crops are produced using 100% biological controlmethods, which also constitute a competitive advan-tage over rival areas of production. The followingexamples provide an idea of the solutions available togrowers: for the biological control of whitefly (Tria-leurodes vaporariorum Westwood), the parasitic waspEncarsia formosa (Castañé et al., 2004) can be used,and also autochthonous Mediterranean predatory bugssuch as Macrolophus caliginosus or Dicyphus tama-ninii Wagner (Lucas & Alomar, 2002; Castañé et al.,2004); to combat the Bemisia argentifolii whitefly pa-rasitic wasps such as Eretmocerus eremicus and En-carsia Formosa (Hoddle et al., 1998) can be used; whi-le to combat thrips (Frankliniella occidentalis), theparasitic nematode Thripinema nicklewoodi Siddiqi(Arthurs et al., 2003), the fungus Metarhizium aniso-pliae (Ansari et al., 2007), the predatory mite Ambly-seius cucumeris or the wasp Orius insidiosus (Shipp& Wang, 2003) can all be used. Other methods forcombating whitefly have been studied: planting a la-yer of covering vegetation that attracts these insects inorder to reduce their incidence on crops (Hilje &Stansly, 2008); placing chromatographic adhesive trapsshaped like a chrysanthemum flower (Mainali & Lim,2008); and fitting electrostatic meshes (Tanaka et al.,2008).
— (iii) Designing new, more porous insect-proofscreens with larger pores than the current marketedmodels. Along these lines, the present work presentsan experimental mesh of 13 × 30 threads cm–2. The threads of this mesh are of very small diameter, allo-wing us to obtain reduced pore size while at the same
Microclimate evaluation of a new design of insect-proof screens 339
time maintaining an acceptable level of porosity. Thisexperimental insect-proof screen was designed by the“Rural Engineering” Research Group (AGR-198) ofAlmería University in collaboration with Spanish com-panies that manufacture and market such screens. Thedesign allows the cost, and therefore the sale price, tobe similar to that of screens currently on the market.The efficiency of the screen in preventing the entran-ce of whitefly into the greenhouse was tested using yellow sticky traps to calculate the whitefly popula-tion inside the experimental greenhouse described be-low over four crop cycles of Solanum lycopersicum L.In the first crop cycle (autumn-winter 2007/2008) a66% reduction in whitefly population was observed inthe western sector of the greenhouse fitted with the ex-perimental mesh (13 × 30 threads cm–2), as comparedto the control mesh (10 × 20 threads cm–2); in the se-cond cycle (spring-summer 2008) this reduction was12%; in the third one (autumn-winter 2008/2009) itwas 7%; and in the fourth (spring-summer 2009) thereduction was 22% (Escamirosa, 2009).
Sonic anemometry has been used to study the effectof two insect-proof screens on the natural ventilationof a Mediterranean greenhouse; a commercial mesh(10 × 20 threads cm–2) and the experimental one(13 × 30 threads cm–2).
Material and methods
Two types of experiment have been carried out in order to evaluate the new design of insect-proof screens (13 × 30 threads cm–2): A), wind tunnel tests toevaluate the aerodynamic characteristics of the expe-rimental mesh (13 × 30 threads cm–2) and the controlmesh (10 × 20 threads cm–2) in the laboratory (undercontrolled conditions); B), experimental measurementsin the greenhouse, using two 3D and six 2D sonic ane-mometers, as well as other sensors, to analyze the mi-croclimate and natural ventilation of the experimentalgreenhouse fitted with both screens.
Wind tunnel tests
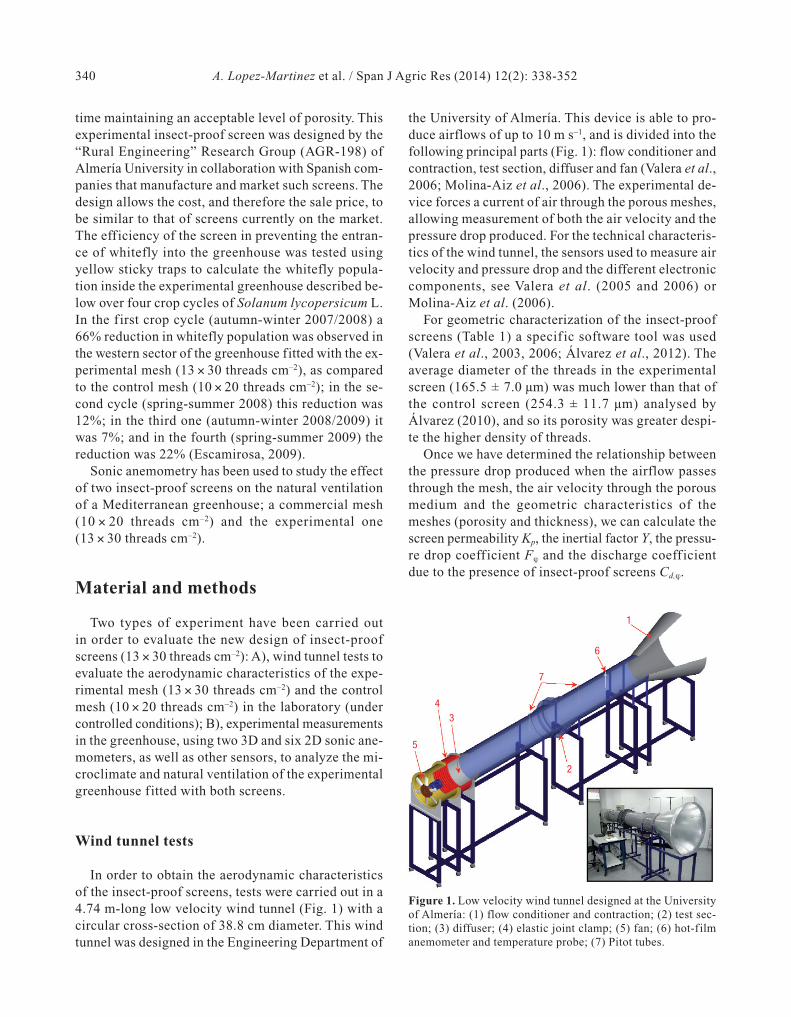
In order to obtain the aerodynamic characteristicsof the insect-proof screens, tests were carried out in a4.74 m-long low velocity wind tunnel (Fig. 1) with acircular cross-section of 38.8 cm diameter. This windtunnel was designed in the Engineering Department of
the University of Almería. This device is able to pro-duce airflows of up to 10 m s–1, and is divided into thefollowing principal parts (Fig. 1): flow conditioner andcontraction, test section, diffuser and fan (Valera et al.,2006; Molina-Aiz et al., 2006). The experimental de-vice forces a current of air through the porous meshes,allowing measurement of both the air velocity and thepressure drop produced. For the technical characteris-tics of the wind tunnel, the sensors used to measure airvelocity and pressure drop and the different electroniccomponents, see Valera et al. (2005 and 2006) or Molina-Aiz et al. (2006).
For geometric characterization of the insect-proofscreens (Table 1) a specif ic software tool was used (Valera et al., 2003, 2006; Álvarez et al., 2012). Theaverage diameter of the threads in the experimentalscreen (165.5 ± 7.0 µm) was much lower than that ofthe control screen (254.3 ± 11.7 µm) analysed by Álvarez (2010), and so its porosity was greater despi-te the higher density of threads.
Once we have determined the relationship betweenthe pressure drop produced when the airflow passesthrough the mesh, the air velocity through the porousmedium and the geometric characteristics of the meshes (porosity and thickness), we can calculate thescreen permeability Kp, the inertial factor Y, the pressu-re drop coefficient Fϕ and the discharge coefficientdue to the presence of insect-proof screens Cd,ϕ.
340 A. Lopez-Martinez et al. / Span J Agric Res (2014) 12(2): 338-352
Figure 1. Low velocity wind tunnel designed at the Universityof Almería: (1) flow conditioner and contraction; (2) test sec-tion; (3) diffuser; (4) elastic joint clamp; (5) fan; (6) hot-filmanemometer and temperature probe; (7) Pitot tubes.
5
43
2
7
6
1

Darcy’s equation depends linearly on velocity forReynolds numbers below the unit. However, for Rey-nolds number Re > 10 a break is observed in linearity,since the resistance to solid objects (in this case themesh) is comparable to the resistance to friction withsolid surfaces (Nield & Bejan, 1998). The airflowthrough the porous medium (the insect-proof screen)can be described by modifying Darcy’s equation(Forchheimer, 1901):
[1]
where P is the pressure (Pa), x the direction of airflow,u the air velocity (m s–1), Y the inertia factor, a dimen-sionless drag constant that depends on the characteris-tics of the porous material, Kp (m2) is an independentcoefficient of the nature of the fluid that depends onthe geometry of the porous medium and is known asthe specific permeability of the porous medium (Nield& Bejan, 1998), µ is the dynamic viscosity of air (kgs–1 m–1) and ρa is the air density (kg m–3). In line withForchheimer’s equation, a second degree polynomialcan be used (Miguel et al., 1997; Dierickx, 1998; Muñoz et al., 1999) to adjust the experimental valuesof pressure drop through the mesh (Molina-Aiz et al.,2006; Valera et al., 2006):
[2]
The independent term cannot be considered if it iscompared with the other terms (Miguel et al., 1997).Equating the coefficients of the first and second orderterms of Forchheimer’s Eq. [1] and of the second degree polynomial that results from the fit of the expe-rimental data Eq. [2], we can obtain the specific permea-bility Kp (m2) and the inertial factor Y (dimensionless)from the following expressions (Molina-Aiz et al., 2009):
[3]
[4]
where e is the thickness of the screen (m). To obtainan accurate measurement of the thickness of the mesh,dimensional contact-free metrology has been used. Theoptical measurements were taken with a TESA-VISIO300 (TESA SA, Switzerland) f itted with video andwith a resolution of 0.05 µm and an uncertainty in measurement of (3 + 10 · e/1,000) (µm), where e is thedimension measured, in this case the thickness of themesh. For the magnitude of the measurements takenthe uncertainty was less than 10 µm.
Bernoulli’s equation can also be used to describe therelationship between pressure drop and air velocitythrough the mesh (Kosmos et al., 1993; Montero et al.,1997; Teitel & Shklyar, 1998):
[5]
where Fϕ is the pressure drop coefficient due to thepresence of an insect-proof screen. This coefficientcan be calculated from the wind tunnel tests accordingto the expression obtained by equaling Eq. [1] and Eq.[5] for ∂P/∂x = ΔP/e (Molina-Aiz et al., 2009):
[6]
This coefficient can be used to predict the pressuredrop through the mesh for Reynolds numbers Rep < 105
(Teitel, 2001). Rep is the Reynolds number based onthe screen’s permeability and it can be calculated byconsidering the square root of specific permeabilityKp (Nield & Bejan, 1998):
[7]
In the present study, to determine Rep we have useda value of 0.25 m s–1 for u (maximum mean value ofthe longitudinal component ux, perpendicular to thevents, in the experimental greenhouse). The dischar-ge coeff icient due to the presence of insect-proof screens Cd,ϕ can be calculated from the pressure dropcoefficient Fϕ as follows (Molina-Aiz et al., 2009):
Rep
=K
puρ
a
μ
Fϕ =2 e
Kp0.5
1
Rep
+ Y⎛
⎝⎜
⎞
⎠⎟
ΔP = − 12
Fϕρau2
Y =a K
p0.5
ρae
Kp
= eμb
ΔP = au2 + bu + c
∂P
∂x= −
μK
p
u + ρa
Y
Kp1/2
⎛
⎝⎜
⎞
⎠⎟ u u
⎛
⎝⎜⎜
⎞
⎠⎟⎟
Microclimate evaluation of a new design of insect-proof screens 341
Table 1. Geometric characteristics of the screens (average values ± standard deviation). Df and Dr are the thread densitiesaccording to the manufacturer and measurement, respectively (threads cm–2). Average value and standard deviation of: ϕ,porosity (m2 m–2); Lpx and Lpy, the lengths of the pore (µm) in the direction of the weft and warp, respectively; Dh, diameterof the threads (µm); Di, diameter of the inside circumference of the pore (µm); Sp, area of the pore (mm2)
Df Dr ϕ Lpx Lpy Dh Di Sp
Eastern sector 10 × 20 9.9 × 19.7 0.335 ± 0.011 233.7 ± 23.9 734.0 ± 29.2 274.5 ± 11.0 236.6 ± 24.0 0.171 ± 0.019Western sector 13 × 30 13.1 × 30.5 0.390 ± 0.006 164.6 ± 9.3 593.3 ± 19.0 165.5 ± 7.0 167.4 ± 9.6 0.098 ± 0.006
[8]
Bernouilli’s law establishes that when a vent is ope-ned the pressure drop between its two sides (potentialenergy) becomes kinetic energy. The main parametersthat determine the aerodynamic behavior of the ventsare their geometry (height and width), the angle towhich they are opened and the presence of insect pro-of screens (porosity and airflow). The coefficient Cd
for each vent can be calculated as follows (Arbel et al.,2000; Kittas et al., 2002; Teitel, 2007):
[9]
where Cd,LH is the discharge coefficient due to the sha-pe of the opening which can be obtained as follows(Bailey et al., 2003):
[10]
where LV is the length of the vent [m], h the height (m)and ‚ the angle of opening, which is 90° for side ventswithout spoiler and 14° for the roof vent.
Experimental setup for greenhousemeasurements
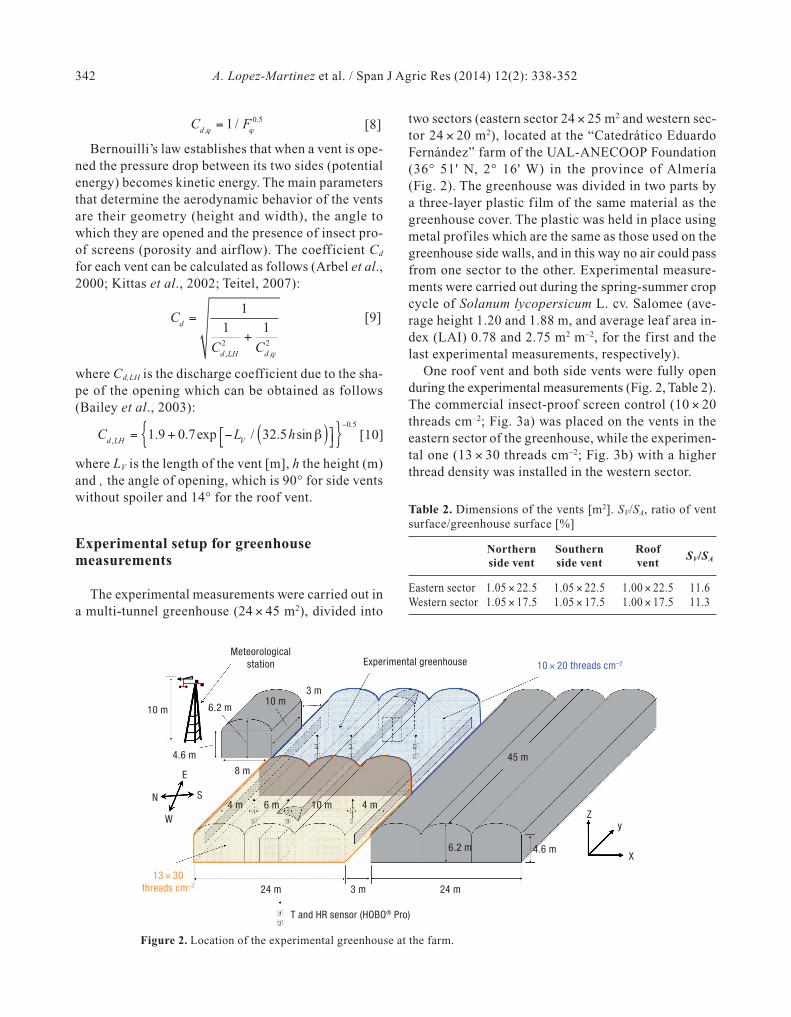
The experimental measurements were carried out ina multi-tunnel greenhouse (24 × 45 m2), divided into
two sectors (eastern sector 24 × 25 m2 and western sec-tor 24 × 20 m2), located at the “Catedrático EduardoFernández” farm of the UAL-ANECOOP Foundation(36° 51' N, 2° 16' W) in the province of Almería(Fig. 2). The greenhouse was divided in two parts bya three-layer plastic film of the same material as thegreenhouse cover. The plastic was held in place usingmetal profiles which are the same as those used on thegreenhouse side walls, and in this way no air could passfrom one sector to the other. Experimental measure-ments were carried out during the spring-summer cropcycle of Solanum lycopersicum L. cv. Salomee (ave-rage height 1.20 and 1.88 m, and average leaf area in-dex (LAI) 0.78 and 2.75 m2 m–2, for the first and thelast experimental measurements, respectively).
One roof vent and both side vents were fully openduring the experimental measurements (Fig. 2, Table 2).The commercial insect-proof screen control (10 × 20threads cm–2; Fig. 3a) was placed on the vents in theeastern sector of the greenhouse, while the experimen-tal one (13 × 30 threads cm–2; Fig. 3b) with a higherthread density was installed in the western sector.
Cd ,LH
= 1.9 + 0.7exp −LV
/ 32.5hsinβ( )⎡⎣ ⎤⎦{ }−0.5
Cd
=1
1
Cd ,LH2
+1
Cd ,ϕ2
Cd ,ϕ = 1 / Fϕ
0.5
342 A. Lopez-Martinez et al. / Span J Agric Res (2014) 12(2): 338-352
Figure 2. Location of the experimental greenhouse at the farm.
10 m 6.2 m
4.6 m
10 m
Meteorologicalstation Experimental greenhouse 10 × 20 threads cm–2
3 m
8 m
W
13 × 30threads cm–2
N S
E
4 m 6 m 10 m 4 m
6.2 m
45 m
4.6 m
Zy
X
24 m3 m24 m
T and HR sensor (HOBO® Pro)
Table 2. Dimensions of the vents [m2]. SV/SA, ratio of ventsurface/greenhouse surface [%]
Northern Southern RoofSV/SAside vent side vent vent
Eastern sector 1.05 × 22.5 1.05 × 22.5 1.00 × 22.5 11.6Western sector 1.05 × 17.5 1.05 × 17.5 1.00 × 17.5 11.3

The natural ventilation of the greenhouse was stu-died in both sectors simultaneously. The air velocitywas measured at 12 points in each side vent (Fig. 4a)and at 3 points in each roof vent (Fig. 4b). The ventarea corresponding to each measurement point was 2.0
m2 (side vents) and 7.5 m2 (roof vent) in the easternsector, and 1.5 m2 (side vents) and 5.8 m2 (roof vent)in the western sector. These values are similar to tho-se used by Boulard et al. (1998) in a tunnel greenhou-se with one roof vent (2.6 m2 per point), by Teitel et al.(2008) in a mono-span greenhouse with two side ventopenings (1.1 m2 per point), by Teitel et al. (2005) ina four-span greenhouse with three roof vents (8.5 m2
per point) and by Molina-Aiz et al. (2009) in a five-span Almería-type greenhouse (2.1 m2 per point).
Two 3D and six 2D sonic anemometers were used:half of the total in each sector. The 3D anemometersmeasured the air velocity over 3 minutes (Molina-Aizet al., 2009; López et al., 2011, 2012) at each point inthe side vents (Fig. 4c). The 2D anemometers were
Microclimate evaluation of a new design of insect-proof screens 343
Figure 3. Microscope image of the control mesh 10 × 20 threadscm–2 (a) and the experimental mesh 13 × 30 threads cm–2 (b).
1 mm 1 mm
a) b)
Figure 4. Measurement points at the side vents (a) and roof vents (b). Details of the experimental setup using 3D anemometers pla-ced at the side vents (c) and 2D anemometers at the roof vent (d).
1.60 m 0.35 m
0.5 m
0.05 m
0.5 m
0.05 m
1 m
3D anemometer in lateral vent
Clamping bar
Bubble within the level
Sample clip
Fixation
2D anemometer in roof vent
1/8 · VL 1/4 · VL
1/3 · VR
VL, lateral vent length (Table 2)
VR, roof vent length (Table 2)
0.18 m
1.05 m
0.97 m
a)
b)
c) d)
344 A. Lopez-Martinez et al. / Span J Agric Res (2014) 12(2): 338-352
used to measure continuously the air velocity at eachpoint in the roof vent (Fig. 4d). The methodology em-ployed has been explained in greater detail in Lópezet al. (2011, 2012).
The side vent of the northern sector of the green-house was partially blocked by a small auxiliary wa-rehouse (Fig. 2). This implies a negative influence onthe experimental design, as the two sectors of the greenhouse are not identical. In order to complementthe results obtained from the experimental measure-ments (B), wind tunnel tests (A) were also carried out.In this way the aerodynamic behaviour of the mesh wasanalyzed without the influence of external factors.
Instrumentation
Air velocity and temperature were measured withtwo CSAT3 3D sonic anemometers (Campbell Scien-tif ic Spain S.L., Spain; resolution: 0.001 m s–1 and0.002°C; accuracy ± 0.04 m s–1 and ± 0.026°C). The airvelocity was also measured with 6 Windsonic 2D so-nic anemometers (Gill Instrument LTD, Lymington,Hampshire, UK; resolution: 0.01 m s–1; accuracy 2%).The data from all sonic anemometers were recordedby two CR3000 Microloggers (Campbell Scientif icSpain S.L., Barcelona, Spain), with a data registrationfrequency of 10 Hz (Shilo et al., 2004) for the 3D and1 Hz for the 2D sonic anemometers (López et al., 2011and 2012).
Outside climatic conditions were recorded by a me-teorological station at a height of 10 m (Fig. 2). Themeteorological station included a BUTRON II (Horti-max S.L., Almería, Spain) measurement box with aPt1000 temperature sensor and a capacitive humiditysensor, with a temperature measurement range of–25°C to 75°C and accuracy of ± 0.01°C, and a humi-dity range of 0% to 100% and accuracy of ± 3%. Out-side wind speed was measured with a Meteostation II(Hortimax S.L.), incorporating a cup anemometer witha measurement range of 0 to 40 m s–1, accuracy of± 5%, and resolution of 0.01 m s–1. Wind direction wasmeasured with a vane (accuracy ± 5° and resolution1°). Solar radiation was measured using a Kipp Sola-ri (Hortimax S.L.) sensor, with a measurement rangeof 0 to 2,000 W m–2, accuracy of ± 20 W m–2, and re-solution of 1 W m–2.
Temperature and humidity inside the greenhousewere measured using 12 autonomous dataloggers(HOBO Pro Temp-HR U23-001, Onset Comput. Corp.,
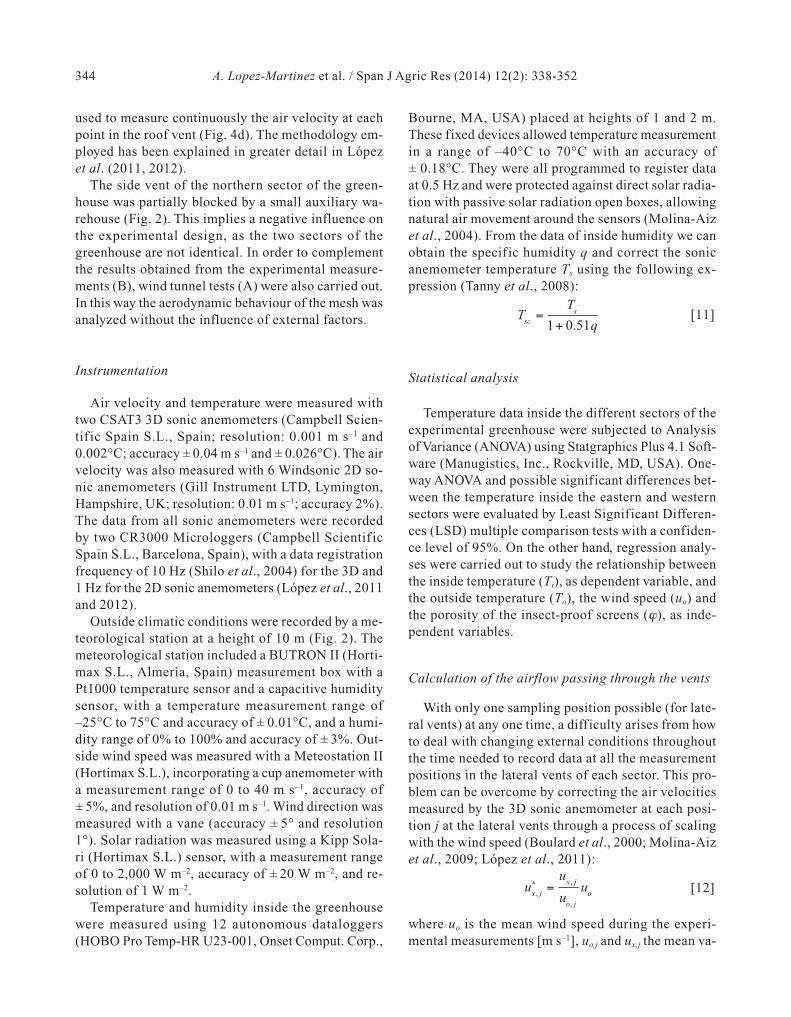
Bourne, MA, USA) placed at heights of 1 and 2 m.These fixed devices allowed temperature measurementin a range of –40°C to 70°C with an accuracy of± 0.18°C. They were all programmed to register dataat 0.5 Hz and were protected against direct solar radia-tion with passive solar radiation open boxes, allowingnatural air movement around the sensors (Molina-Aizet al., 2004). From the data of inside humidity we canobtain the specific humidity q and correct the sonicanemometer temperature Ts using the following ex-pression (Tanny et al., 2008):
[11]
Statistical analysis
Temperature data inside the different sectors of theexperimental greenhouse were subjected to Analysisof Variance (ANOVA) using Statgraphics Plus 4.1 Soft-ware (Manugistics, Inc., Rockville, MD, USA). One-way ANOVA and possible significant differences bet-ween the temperature inside the eastern and westernsectors were evaluated by Least Significant Differen-ces (LSD) multiple comparison tests with a confiden-ce level of 95%. On the other hand, regression analy-ses were carried out to study the relationship betweenthe inside temperature (Ti), as dependent variable, andthe outside temperature (To), the wind speed (uo) andthe porosity of the insect-proof screens (ϕ), as inde-pendent variables.
Calculation of the airflow passing through the vents
With only one sampling position possible (for late-ral vents) at any one time, a difficulty arises from howto deal with changing external conditions throughoutthe time needed to record data at all the measurementpositions in the lateral vents of each sector. This pro-blem can be overcome by correcting the air velocitiesmeasured by the 3D sonic anemometer at each posi-tion j at the lateral vents through a process of scalingwith the wind speed (Boulard et al., 2000; Molina-Aizet al., 2009; López et al., 2011):
[12]
where uo is the mean wind speed during the experi-mental measurements [m s–1], uo,j and ux,j the mean va-
ux, j∗ =
ux, j
uo, j
uo
Tsc
=T
s
1+ 0.51q
lue of the wind speed and of the longitudinal compo-nent of the air velocity ux corresponding to measure-ment point j. The volumetric flow rate G is calculatedby multiplying u*
x,j by the vent surface area corres-ponding to each measurement point (Boulard et al.,1998):
[13]
Results and discussion
Wind tunnel tests
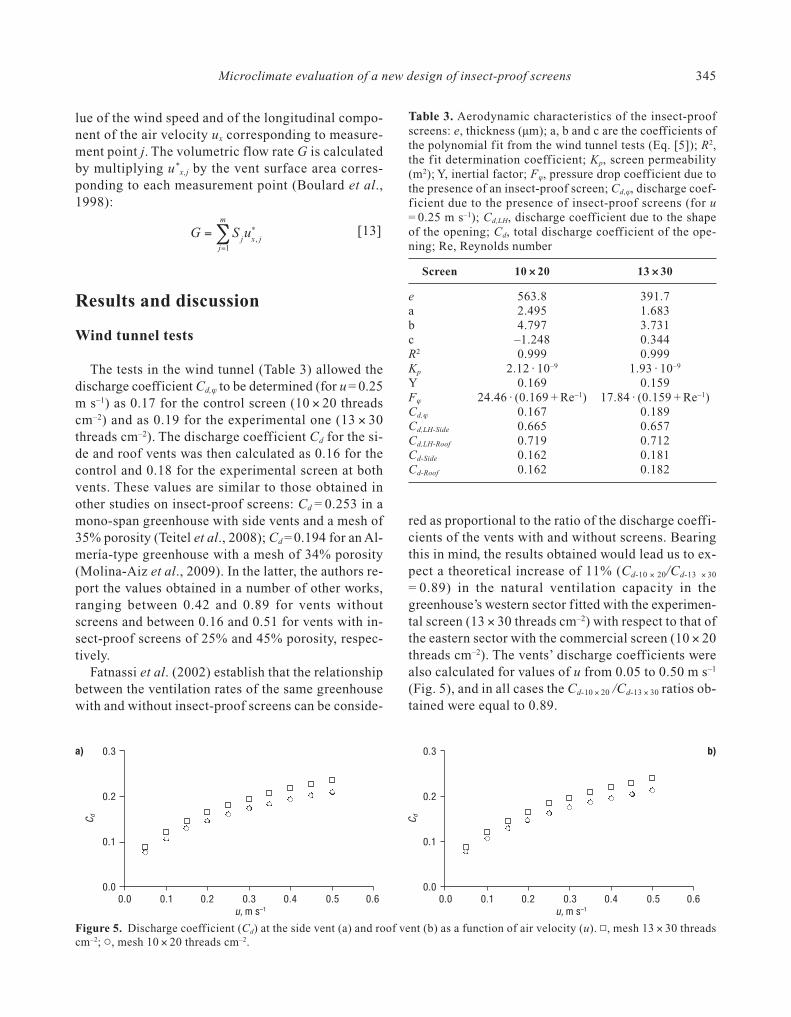
The tests in the wind tunnel (Table 3) allowed thedischarge coefficient Cd,ϕ to be determined (for u = 0.25m s–1) as 0.17 for the control screen (10 × 20 threadscm–2) and as 0.19 for the experimental one (13 × 30threads cm–2). The discharge coefficient Cd for the si-de and roof vents was then calculated as 0.16 for thecontrol and 0.18 for the experimental screen at bothvents. These values are similar to those obtained inother studies on insect-proof screens: Cd = 0.253 in amono-span greenhouse with side vents and a mesh of35% porosity (Teitel et al., 2008); Cd = 0.194 for an Al-mería-type greenhouse with a mesh of 34% porosity(Molina-Aiz et al., 2009). In the latter, the authors re-port the values obtained in a number of other works,ranging between 0.42 and 0.89 for vents without screens and between 0.16 and 0.51 for vents with in-sect-proof screens of 25% and 45% porosity, respec-tively.
Fatnassi et al. (2002) establish that the relationshipbetween the ventilation rates of the same greenhousewith and without insect-proof screens can be conside-
red as proportional to the ratio of the discharge coeffi-cients of the vents with and without screens. Bearingthis in mind, the results obtained would lead us to ex-pect a theoretical increase of 11% (Cd-10 × 20/Cd-13 × 30
= 0.89) in the natural ventilation capacity in the greenhouse’s western sector fitted with the experimen-tal screen (13 × 30 threads cm–2) with respect to that ofthe eastern sector with the commercial screen (10 × 20threads cm–2). The vents’ discharge coefficients werealso calculated for values of u from 0.05 to 0.50 m s–1
(Fig. 5), and in all cases the Cd-10 × 20 /Cd-13 × 30 ratios ob-tained were equal to 0.89.
G = Sju
x, j∗
j=1
m
∑
Microclimate evaluation of a new design of insect-proof screens 345
Table 3. Aerodynamic characteristics of the insect-proofscreens: e, thickness (µm); a, b and c are the coefficients ofthe polynomial fit from the wind tunnel tests (Eq. [5]); R2,the f it determination coefficient; Kp, screen permeability(m2); Y, inertial factor; Fϕ, pressure drop coefficient due tothe presence of an insect-proof screen; Cd,ϕ, discharge coef-f icient due to the presence of insect-proof screens (for u= 0.25 m s–1); Cd,LH, discharge coefficient due to the shapeof the opening; Cd, total discharge coefficient of the ope-ning; Re, Reynolds number
Screen 10 × 20 13 × 30
e 563.8 391.7a 2.495 1.683b 4.797 3.731c –1.248 0.344R2 0.999 0.999Kp 2.12 · 10–9 1.93 · 10–9
Y 0.169 0.159Fϕ 24.46 · (0.169 + Re–1) 17.84 · (0.159 + Re–1)Cd,ϕ 0.167 0.189Cd,LH-Side 0.665 0.657Cd,LH-Roof 0.719 0.712Cd-Side 0.162 0.181Cd-Roof 0.162 0.182
Figure 5. Discharge coefficient (Cd) at the side vent (a) and roof vent (b) as a function of air velocity (u). ▫, mesh 13 × 30 threadscm–2; �, mesh 10 × 20 threads cm–2.
0.3
0.2
0.1
0.0
0.3
0.2
0.1
0.0
a) b)
0.0 0.1 0.2 0.3 0.4 0.5 0.6u, m s–1
0.0 0.1 0.2 0.3 0.4 0.5 0.6u, m s–1
C d C d

Experimental measurements in greenhouse
The measurement tests were carried out under Po-niente wind from the southwest. The outside climaticconditions remained relatively stable over the six measurement tests (Table 4).
Airflow
Given the characteristics of the experimental greenhouse (with a windward facing roof vent, a wind-ward facing side vent that is blocked by another greenhouse and a leeward facing side vent which ispartially blocked in the eastern sector) the eolic andthermal effects are contrary. Due to the eolic effect theincoming air enters through the roof vent (wind pressure) and exits through the leeward side vent (suc-tion of the wind), but also through the windward sidevent, as it is in the shelter of the adjacent greenhouse.Due to the thermal effect, the hot air rises to exitthrough the roof vent, which favours the entrance ofair from outside through the side vents. The combina-tion of these two effects at the three vents means thatthere are opposing incoming and outgoing airflows(Fig. 6). The same ventilation pattern was previouslyobserved for the western sector of the greenhouse un-der prevailing Poniente winds (López et al., 2011 and2012).
Despite the difference in porosity of the tested screens (5.5 points), no major differences were foundin the ventilation patterns of the two greenhouse sec-tors (Fig. 6).
The greenhouse ventilation is affected by the buo-yancy effect generated by the average characteristictemperature difference between the inside and the out-
side air ΔTio. Papadakis et al. (1996) showed that theeffect of buoyancy on greenhouse ventilation could notbe neglected at wind speeds lower than about 1.8 m s–1.In greenhouses with both roof and side openings, Kittas et al. (1997) considered that the stack effect isimportant if the ratio uo/ΔTio
0.5 < 1. In the present case,air was found to both enter and leave the greenhousethrough the roof vent in all experimental measure-ments, which indicates that the thermal effect playeda major role in the natural ventilation, even though theratio uo/ΔTio
0.5 was at times higher than 1 (Table 4).
346 A. Lopez-Martinez et al. / Span J Agric Res (2014) 12(2): 338-352
Figure 6. Airflow at the vents during experimental measurementnumber 1 (height of measurements at the side vents 2.13 m).Eastern sector with the control mesh 10 × 20 threads cm–2
(green mesh, red vectors) and western sector with the experi-mental mesh 13 × 30 threads cm–2 (orange mesh, blue vectors).
Inflow Outflow
uO = 1.94 m s–1
0.2 m s–1
N
Table 4. Outside climatic conditions (average values ± standard deviation): uo, outside wind velocity [m s–1]; θ, wind direc-tion [°]; HRo, outside relative air humidity [%]; To, outside temperature [°C]; Ro, incoming shortwave radiation [W m–2]; N,experimental measurement number
N - Date Time uo θ a HRo To Rouo/Δio
0.5 uo/Δio0.5
(10 × 20) (13 × 30)
1 17/04/2009 11:06-13:07 1.94 ± 0.70 226 ± 25 59 ± 5 16.9 ± 0.4 584 ± 175 0.65 0.652 23/04/2009 11:23-13:16 2.34 ± 0.98 267 ± 14 38 ± 2 22.1 ± 0.6 809 ± 56 0.92 0.943 22/06/2009 11:14-12:58 3.42 ± 0.50 258 ± 8 56 ± 4 25.5 ± 0.4 617 ± 71 2.08 2.554 26/06/2009 11:17-13:04 2.67 ± 0.72 227 ± 20 64 ± 2 24.0 ± 0.5 751 ± 102 1.23 1.295 02/07/2009a 11:00-12:45 2.62 ± 0.63 239 ± 17 65 ± 3 27.0 ± 0.9 725 ± 68 1.26 1.346 02/07/2009b 14:41-16:28 3.22 ± 0.48 242 ± 14 60 ± 2 28.0 ± 0.8 868 ± 37 1.47 1.57
a Direction perpendicular to the vents is 208° for a Poniente wind from southwest (SW).
Air exchange rate
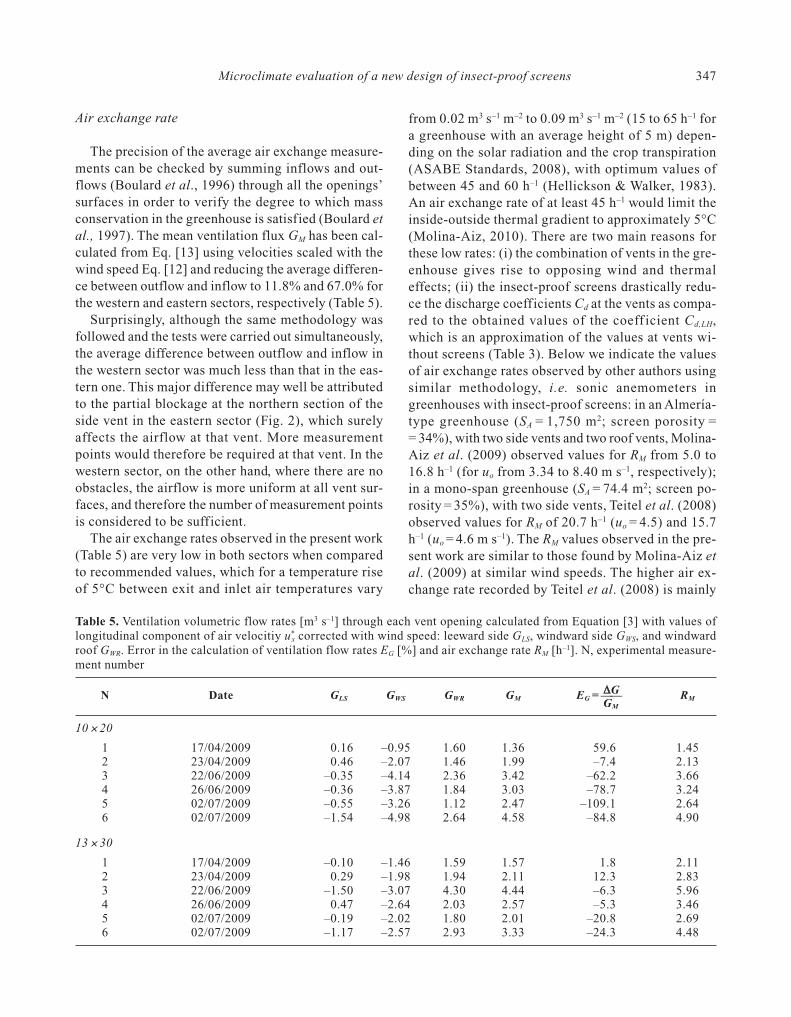
The precision of the average air exchange measure-ments can be checked by summing inflows and out-flows (Boulard et al., 1996) through all the openings’surfaces in order to verify the degree to which massconservation in the greenhouse is satisfied (Boulard etal., 1997). The mean ventilation flux GM has been cal-culated from Eq. [13] using velocities scaled with thewind speed Eq. [12] and reducing the average differen-ce between outflow and inflow to 11.8% and 67.0% forthe western and eastern sectors, respectively (Table 5).
Surprisingly, although the same methodology wasfollowed and the tests were carried out simultaneously,the average difference between outflow and inflow inthe western sector was much less than that in the eas-tern one. This major difference may well be attributedto the partial blockage at the northern section of theside vent in the eastern sector (Fig. 2), which surelyaffects the airflow at that vent. More measurementpoints would therefore be required at that vent. In thewestern sector, on the other hand, where there are noobstacles, the airflow is more uniform at all vent sur-faces, and therefore the number of measurement pointsis considered to be sufficient.
The air exchange rates observed in the present work(Table 5) are very low in both sectors when comparedto recommended values, which for a temperature riseof 5°C between exit and inlet air temperatures vary
from 0.02 m3 s–1 m–2 to 0.09 m3 s–1 m–2 (15 to 65 h–1 fora greenhouse with an average height of 5 m) depen-ding on the solar radiation and the crop transpiration(ASABE Standards, 2008), with optimum values ofbetween 45 and 60 h–1 (Hellickson & Walker, 1983).An air exchange rate of at least 45 h–1 would limit theinside-outside thermal gradient to approximately 5°C(Molina-Aiz, 2010). There are two main reasons forthese low rates: (i) the combination of vents in the gre-enhouse gives rise to opposing wind and thermal effects; (ii) the insect-proof screens drastically redu-ce the discharge coefficients Cd at the vents as compa-red to the obtained values of the coeff icient Cd,LH,which is an approximation of the values at vents wi-thout screens (Table 3). Below we indicate the valuesof air exchange rates observed by other authors usingsimilar methodology, i.e. sonic anemometers in greenhouses with insect-proof screens: in an Almería-type greenhouse (SA = 1,750 m2; screen porosity == 34%), with two side vents and two roof vents, Molina-Aiz et al. (2009) observed values for RM from 5.0 to16.8 h–1 (for uo from 3.34 to 8.40 m s–1, respectively);in a mono-span greenhouse (SA = 74.4 m2; screen po-rosity = 35%), with two side vents, Teitel et al. (2008)observed values for RM of 20.7 h–1 (uo = 4.5) and 15.7h–1 (uo = 4.6 m s–1). The RM values observed in the pre-sent work are similar to those found by Molina-Aiz etal. (2009) at similar wind speeds. The higher air ex-change rate recorded by Teitel et al. (2008) is mainly
Microclimate evaluation of a new design of insect-proof screens 347
Table 5. Ventilation volumetric flow rates [m3 s–1] through each vent opening calculated from Equation [3] with values oflongitudinal component of air velocitiy u*
x corrected with wind speed: leeward side GLS, windward side GWS, and windwardroof GWR. Error in the calculation of ventilation flow rates EG [%] and air exchange rate RM [h–1]. N, experimental measure-ment number
ΔGN Date GLS GWS GWR GM EG = —— RMGM
10 × 20
1 17/04/2009 0.16 –0.95 1.60 1.36 59.6 1.452 23/04/2009 0.46 –2.07 1.46 1.99 –7.4 2.133 22/06/2009 –0.35 –4.14 2.36 3.42 –62.2 3.664 26/06/2009 –0.36 –3.87 1.84 3.03 –78.7 3.245 02/07/2009 –0.55 –3.26 1.12 2.47 –109.1 2.646 02/07/2009 –1.54 –4.98 2.64 4.58 –84.8 4.90
13 × 30
1 17/04/2009 –0.10 –1.46 1.59 1.57 1.8 2.112 23/04/2009 0.29 –1.98 1.94 2.11 12.3 2.833 22/06/2009 –1.50 –3.07 4.30 4.44 –6.3 5.964 26/06/2009 0.47 –2.64 2.03 2.57 –5.3 3.465 02/07/2009 –0.19 –2.02 1.80 2.01 –20.8 2.696 02/07/2009 –1.17 –2.57 2.93 3.33 –24.3 4.48
due to the small dimensions of the greenhouse used,with a distance between vents of only 9.3 m and a greenhouse volume of approximately 300 m3.
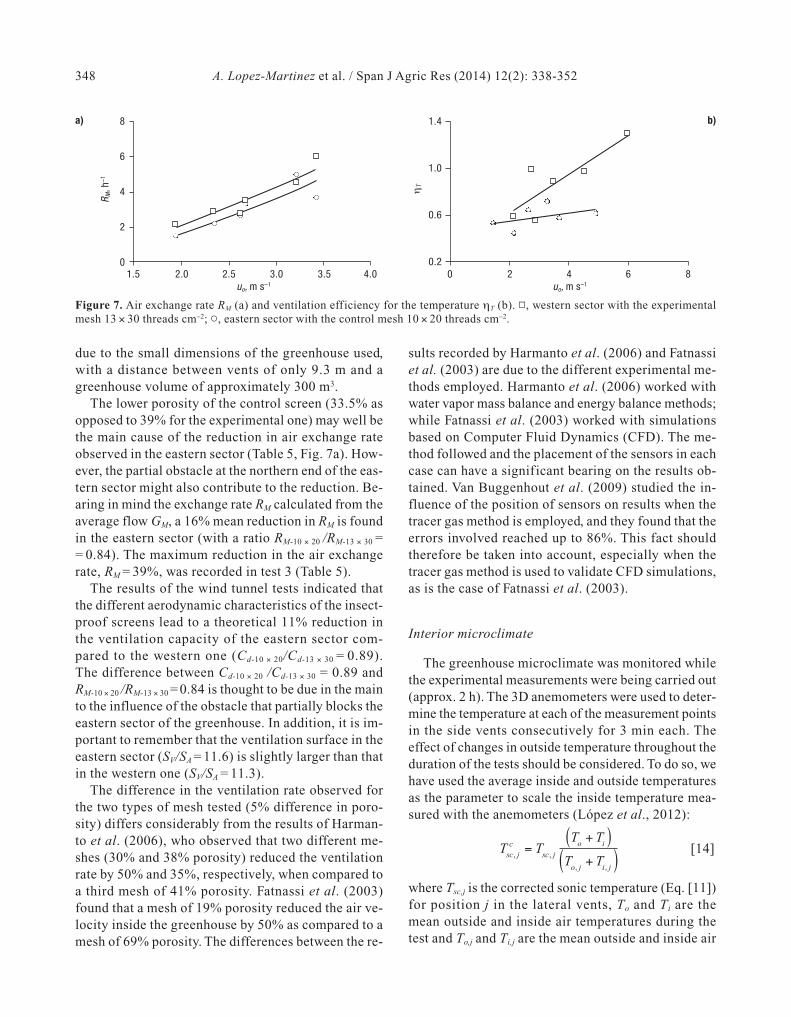
The lower porosity of the control screen (33.5% asopposed to 39% for the experimental one) may well bethe main cause of the reduction in air exchange rateobserved in the eastern sector (Table 5, Fig. 7a). How-ever, the partial obstacle at the northern end of the eas-tern sector might also contribute to the reduction. Be-aring in mind the exchange rate RM calculated from theaverage flow GM, a 16% mean reduction in RM is foundin the eastern sector (with a ratio RM-10 × 20 /RM-13 × 30 == 0.84). The maximum reduction in the air exchangerate, RM = 39%, was recorded in test 3 (Table 5).
The results of the wind tunnel tests indicated thatthe different aerodynamic characteristics of the insect-proof screens lead to a theoretical 11% reduction inthe ventilation capacity of the eastern sector com-pared to the western one (Cd-10 × 20/Cd-13 × 30 = 0.89). The difference between Cd-10 × 20 /Cd-13 × 30 = 0.89 and RM-10 × 20 /RM-13 × 30 = 0.84 is thought to be due in the mainto the influence of the obstacle that partially blocks theeastern sector of the greenhouse. In addition, it is im-portant to remember that the ventilation surface in theeastern sector (SV/SA = 11.6) is slightly larger than thatin the western one (SV/SA = 11.3).
The difference in the ventilation rate observed forthe two types of mesh tested (5% difference in poro-sity) differs considerably from the results of Harman-to et al. (2006), who observed that two different me-shes (30% and 38% porosity) reduced the ventilationrate by 50% and 35%, respectively, when compared toa third mesh of 41% porosity. Fatnassi et al. (2003)found that a mesh of 19% porosity reduced the air ve-locity inside the greenhouse by 50% as compared to amesh of 69% porosity. The differences between the re-
sults recorded by Harmanto et al. (2006) and Fatnassiet al. (2003) are due to the different experimental me-thods employed. Harmanto et al. (2006) worked withwater vapor mass balance and energy balance methods;while Fatnassi et al. (2003) worked with simulationsbased on Computer Fluid Dynamics (CFD). The me-thod followed and the placement of the sensors in eachcase can have a significant bearing on the results ob-tained. Van Buggenhout et al. (2009) studied the in-fluence of the position of sensors on results when thetracer gas method is employed, and they found that theerrors involved reached up to 86%. This fact shouldtherefore be taken into account, especially when thetracer gas method is used to validate CFD simulations,as is the case of Fatnassi et al. (2003).
Interior microclimate
The greenhouse microclimate was monitored whilethe experimental measurements were being carried out(approx. 2 h). The 3D anemometers were used to deter-mine the temperature at each of the measurement pointsin the side vents consecutively for 3 min each. The effect of changes in outside temperature throughout theduration of the tests should be considered. To do so, wehave used the average inside and outside temperaturesas the parameter to scale the inside temperature mea-sured with the anemometers (López et al., 2012):
[14]
where Tsc,j is the corrected sonic temperature (Eq. [11])for position j in the lateral vents, To and Ti are the mean outside and inside air temperatures during thetest and To,j and Ti,j are the mean outside and inside air
Tsc, jc = T
sc, j
To
+ Ti( )
To, j
+ Ti, j( )
348 A. Lopez-Martinez et al. / Span J Agric Res (2014) 12(2): 338-352
Figure 7. Air exchange rate RM (a) and ventilation efficiency for the temperature ηT (b). ▫, western sector with the experimentalmesh 13 × 30 threads cm–2; �, eastern sector with the control mesh 10 × 20 threads cm–2.
8
6
4
2
0
1.4
1.0
0.6
0.21.5 2.0 2.5 3.0 3.5 4.0
uo, m s–10 2 4 6 8
uo, m s–1
R M,h
–1
ηT
a) b)

temperatures recorded by the fixed sensors over the 3min used for measurement at position j.
In order to judge objectively the effect of ventila-tion on the inside temperature, we have determined theventilation efficiency for the temperature ηT (Qingyanet al., 1988):
[15]
where Ti-o is the mean temperature of the air that lea-ves the greenhouse through the side vents and ΔTio isthe difference in temperature between inside and out-side the greenhouse during the course of the experi-mental measurements. The term ηT represents the effectiveness to eliminate heat of the greenhouse areaoccupied by the crop. A value of ηT equal to 1 indica-tes that the outside air enters into greenhouse and itmixes perfectly with the inside air.
A mean drop in the inside temperature of 0.5°C wasobserved in the sector with the experimental mesh,compared to the sector that was f itted with the commercial model (Table 6). The maximum tempera-ture difference between both sectors (0.9°C) was recor-ded during experimental measurement number 3. Thelower air exchange rate recorded in the sector with thecommercial mesh means that there is less capacity ofnatural ventilation to force out the heat from the gre-enhouse. The ventilation efficiency was always grea-ter in the sector which was fitted with the experimen-tal mesh (mean value of ηT = 0.9) than in the one withthe commercial mesh (mean value of ηT = 0.6) (Fig. 7b).
In the western sector with the experimental mesh,where there was no obstacle by the leeward facing si-de vent, the air that entered the greenhouse through theroof vent mixed better with the air in the crop zone and
left the greenhouse through the side vents, at highertemperature than the air in the eastern sector with thecontrol mesh.
The results obtained in the present work confirm themean increase in temperature observed by Harmantoet al. (2006), i.e. 0.1°C for each percentage point diffe-rence in the porosity of the screens. The increase in the temperature difference ΔTio due to the lower poro-sity of the control mesh, expressed as the ratio ΔTio-10 × 20/ΔTio-13 × 30 = 1.16, is similar to the value of1.25 recorded by Kittas et al. (2002), who comparedmeshes of de 50 and 60%. Fatnassi et al. (2003, 2006)obtained different values for the same ratio, 1.50, 1.43and 2.67, recorded between meshes of 29 and 40%; of20 and 41%, and of 56 and 69% porosity, respectively.
The statistical analysis based on the multiple regres-sion between the porosity of the mesh ϕ (per 1%), theinside and outside temperatures Ti and To (°C) and theair velocity uo (m s–1) provide us with the following ex-pression:
[16]
The inside temperature increases with the outsidetemperature and decreases with the air velocity andporosity. A 10% increase in the mesh porosity gives ri-se to a 0.9°C drop in inside temperature, while a 1 ms–1 increase in air velocity produces a 2.5°C tempera-ture drop. When the difference in porosity betweenmeshes is not so marked, as in this study, the wind ve-locity is more influential. However, when the ventila-tion of the greenhouse is due to the thermal effect, ondays with little wind, higher porosity of the insect-proof screen proves essential.
R2 = 86.1%; p−value = 0.001( )
Ti
= 0.8 ⋅To− 2.5 ⋅u
o− 9.4 ⋅ϕ + 20.4
ηT
=T
i−o− T
o
ΔTio
Microclimate evaluation of a new design of insect-proof screens 349
Table 6. Microclimate conditions inside greenhouses for the different tests (average values ± standard deviation): Ti, insidetemperature [°C]; TWS and TLS, air temperature [°C] near windward and leeward vents, respectively (measured with 3D so-nic anemometers and corrected with Equation [1]). ΔTio, inside to outside temperature difference [°C]; ηT ventilation effi-ciency for the temperature. N, experimental measurement number
NTi ΔTio TWS TLS ηT Ti ΔTio TWS TLS ηT
Eastern sector (10 × 20 threads cm–2) Western sector (13 × 30 threads cm–2)
1 26.0 ± 0.9* 9.0 21.2 ± 0.7 22.4 ± 0.3 0.54 25.7 ± 1.0* 8.8 21.4 ± 0.9 22.8 ± 0.6 0.592 28.6 ± 0.5* 6.5 24.2 ± 0.9 25.8 ± 0.1 0.45 28.3 ± 0.1* 6.2 24.9 ± 0.8 26.3 ± 0.5 0.563 28.2 ± 0.4* 2.7 26.4 ± 1.0 27.6 ± 0.1 0.58 27.2 ± 0.5* 1.8 27.5 ± 0.7 28.0 ± 0.6 1.304 28.6 ± 0.2* 4.7 26.5 ± 0.6 28.2 ± 0.0 0.72 28.2 ± 0.2* 4.3 27.4 ± 0.5 28.2 ± 0.3 0.895 31.3 ± 0.2* 4.3 29.1 ± 0.6 30.4 ± 0.5 0.65 30.8 ± 0.4* 3.8 30.5 ± 0.7 31.0 ± 0.3 0.996 32.7 ± 0.5* 4.8 30.3 ± 0.6 31.5 ± 0.1 0.62 32.1 ± 0.5* 4.2 31.5 ± 1.2 32.6 ± 0.7 0.98
* Indicate statistically significant differences between eastern and western sectors (95% confidence level).

The results obtained indicate that reducing the po-rosity of the insect-proof screen also reduces the airexchange rate. Consequently, the porosity can alsoexert a considerable influence on the greenhouse insi-de temperature (increasing it by 0.1°C per percentagedifference in mesh porosity). This negative effect onthe greenhouse microclimate is particularly notablearound midday when the vents are fully open. Never-theless, during the rest of the day the negative effectcan be offset by opening the windows wider. In pre-vious works analyzing four crop cycles (2007-09) inthe same greenhouse, the experimental mesh was notfound to cause significant variations in mean tempe-rature or yield (Molina-Aiz et al., 2012), but it did re-duce the incidence of whitefly (Escamirosa, 2009).
As final conclusions, by using finer threads, insect-proof screens can be designed to combine smaller po-re size and greater porosity; this results in improve-ments in the greenhouse microclimate due to theimproved natural ventilation, which is a key feature ofMediterranean greenhouses.
In comparison to the commercial control mesh(10 × 20 threads cm–2; 33.5% porosity), the experimen-tal mesh (13 × 30 threads cm–2; 39.0% porosity):
— (i) provides an 11% higher discharge coefficientat the vents (Cd-10 × 20/Cd-13 × 30 = 0.89), which leads to atheoretical 11% increase in the greenhouse’s naturalventilation capacity.
— (ii) does not have a negative effect on the greenhouse airflow pattern.
— (iii) produces a mean increase of 16% in the airexchange rate.
— (iv) produces a 0.5°C drop in inside temperatu-re (0.1°C per 1% difference in porosity).
— (v) improves the ventilation efficiency for thetemperature ηT (mean value of 0.9 as compared to 0.6with the commercial mesh).
Insect-proof screens with smaller thread diameter en-able a greater mesh porosity, which improves greenhouse ventilation when greater cooling is required(around midday). At the same time the pore size is redu-ced, which prevents the entrance of pests and the exit ofbeneficial insects used in Integrated Pest Management,a widespread practice in Almería’s greenhouses.
Acknowledgements
This work has been financed by the Junta de Anda-lucía and the Spanish Ministerio de Ciencia e Innova-
ción by means of the research grants P09-AGR-4593and AGL2010-22284-C03-01, respectively.
References
Alvarez AJ, 2010. Analysis of the geometric characteristicsand aerodynamic behaviour of insect-proof screens usedin greenhouses to protect crops. Doctoral thesis. Univer-sidad de Almería, Almería, Spain. [In Spanish].
Alvarez AJ, Oliva RM, Valera DL, 2012. Software for thegeometric characterisation of insect-proof screens. Com-put Electron Agric 82: 134-144.
Ansari MA, Shah FA, Whittaker M, Prasad M, Butt TM, 2007.Control of western flower thrips (Frankliniella occidenta-lis) pupae with Metarhizium anisopliae in peat and peat al-ternative growing media. Biol Control 40: 293-297.
Arbel A, Shklyar A, Barak M, 2000. Buoyancy-driven ven-tilation in a greenhouse cooled by a fogging system. Ac-ta Hort 534: 327-334.
Arthurs S, Heinz KM, Thompson S, Krauter PC, 2003. Effect of temperature on infection, development and reproduction of the parasitic nematode Thripinema nicklewoodi in Frankliniella occidentalis. BioControl 48:417-429.
ASABE Standards, 2008. EP406.4: Heating, ventilating andcooling greenhouses. ASAE, St. Joseph, MI, USA.
Baeza EJ, Pérez-Parra JJ, Montero JI, Bailey BJ, López JC,Gázquez JC, 2009. Analysis of the role of sidewall ventson buoyancy-driven natural ventilation in parral-type greenhouses with and without insect screens using com-putational fluid dynamics. Biosyst Eng 104: 86-96.
Bailey BJ, 2003. Screens stop insects but slow airflow. FruitVeg Tech 3: 6-8.
Bailey BJ, Montero JI, Pérez-Parra JJ, Robertson AP, Baeza E, Kamaruddin R, 2003. Airflow resistance of greenhouse ventilators with and without insect screens.Biosyst Eng 86(2): 217-229.
Baker JR, Jones RK, 1989. Screening as part of insect anddisease management in the greenhouse. North CarolinaFlower Growers’ Bulletin 34: 1-9.
Bartzanas T, Boulard T, Kittas C, 2002. Numerical simula-tion of the airflow and temperature distribution in a tunnel greenhouse equipped with insect-proof screen inthe openings. Comput Electron Agric 34: 207-221.
Berlinger MJ, Leblush-Mordechl S, Fridja D, Mor N, 1992.The effect of types of greenhouse screens on the presen-ce of western flower thrips: a preliminary study. OILB-SROP Bull 16(2): 13-19.
Boulard T, Meneses JF, Mermier M, Papadakis G, 1996. Themechanisms involved in the natural ventilation of green-houses. Agric Forest Meteorol 79: 61-77.
Boulard T, Feuilloley P, Kittas C, 1997. Natural ventilationperformance of six greenhouse and tunnel types. J AgrEng Res 67(4): 249-266.
Boulard T, Kittas C, Papadakis G, Mermier M, 1998. Pressure field and airflow at the opening of a naturallyventilated greenhouse. J Agr Eng Res 71: 93-102.
350 A. Lopez-Martinez et al. / Span J Agric Res (2014) 12(2): 338-352

Boulard T, Wang S, Haxaire R, 2000. Mean and turbulent airflows and microclimatic patterns in an empty greenhou-se tunnel. Agric Forest Meteorol 100: 169-181.
Campen JB, 2005. Greenhouse design applying CFD for In-donesian conditions. Acta Hort 691: 419-424.
Campen JB, Bot GPA, 2003. Determination of green-house specific aspects of ventilation using three dimen-sional computational fluid dynamics. Biosyst Eng 84(1):69-77.
Castañé C, Alomar O, Goula M, Gabarra R, 2004. Coloni-zation of tomato greenhouses by the predatory mirid bugsMacrolophus caliginosus and Dicyphus tamaninii. BiolControl 30: 591-597.
Dierickx IE, 1998. Flow reduction of synthetic screens ob-tanined with both a water and airflow apparatus. J AgrEng Res 71: 67-73.
Escamirosa C, 2009. Analysis of the effect of new anti-in-sect methods on several crops in Mediterranean green-houses. Doctoral thesis. Universidad de Almería, Alme-ría, Spain. [In Spanish].
Fatnassi H, Boulard T, Demrati H, Bouirden L, Sappe G,2002. Ventilation performance of a large Canarian-typegreenhouse equipped with insect-proof nets. Biosyst Eng82(1): 97-105.
Fatnassi H, Boulard T, Bouirden L, 2003. Simulation of cli-matic conditions in full-scale greenhouse fitted with in-sect-proof screens. Agric Forest Meteorol 118: 97-111.
Fatnassi H, Boulard T, Poncet C, Chave M, 2006. Optimisa-tion of greenhouse insect screening with computationalfluid dynamics. Biosyst Eng 93(3): 301-312.
Forchheimer P, 1901. Easserbewegung durch boden. Z VerDeutsch 45: 1782-1788.
Harmanto, Tantau H, Salokhe VM, 2006. Microclimate andair exchange rates in greenhouses covered with differentnets in the humid tropics. Biosyst Eng 94(2): 239-253.
Hellickson MA, Walker JN, 1983. Ventilation of agricultu-ral structures. ASAE Monograph No 6. ASABE, St Jo-seph, MI, USA.
Hilje L, Stansly PA, 2008. Living ground covers for mana-gement of Bemisia tabaci (Gennadius) (Homoptera: Aley-rodidae) and tomato yellow mottle virus (ToYMoV) inCosta Rica. Crop Prot 27: 10-16.
Hoddle MS, van Driesche RG, Elkinton JS, Sanderson JP,1998. Discovery and utilization of Bemisia argentifoliipatches by Eretmocerus eremicus and Encarsia formosa(Beltsville strain) in greenhouses. Entomol Exp Appl 87:15-28.
Katsoulas N, Bartzanas T, Boulard T, Mermier M, Kittas C,2006. Effect of vent openings and insect screens on greenhouse ventilation. Biosyst Eng 93(4): 427-436.
Kittas C, Boulard T, Papadakis G, 1997. Natural ventilationof a greenhouse with ridge and side openings: sensitivityto temperature and wind effects. T ASAE 40(2): 415-425.
Kittas C, Boulard T, Bartzanas T, Katsoulas N, Mermier M,2002. Influence of an insect screen on greenhouse venti-lation. T ASAE 45(4): 1083-1090.
Kittas C, Katsoulas N, Bartzanas T, Mermier M, Boulard T,2008. The impact of insect screens and ventilation ope-
nings on the greenhouse microclimate. T ASABE 51(6):2151-2165.
Kosmos SR, Riskowski GL, Christianson LL, 1993. For-ce and static pressure resulting from airflow through screens. T ASAE 36(5): 1467-1472.
Linker R, Tarnopolsky M, Seginer I, 2002. Increased resis-tance to flow and temperature-rise resulting from dust accumulation on greenhouse insect-proof screens. ASAEAnn Int Meeting, Chicago (USA), July 28-31. Paper 024040.
López A, Valera DL, Molina-Aiz FD, 2011. Sonic anemo-metry to measure natural ventilation in greenhouses. Sen-sors 11: 9820-9838.
López A, Valera DL, Molina-Aiz FD, Peña A, 2012. Sonic ane-mometry measurements to determine airflow patterns inmulti-tunnel greenhouse. Span J Agric Res 10(3): 631-642.
López-Martínez A, Valera DL, Molina-Aiz FD, Peña A, Ma-rín P, 2013. Field analysis of the deterioration after someyears of use of four insect-proof screens utilized in Mediterranean greenhouses. Span J Agric Res 11(4): 958-967.
Lucas E, Alomar A, 2002. Impact of the presence of Dicy-phus tamaninii Wagner (Heteroptera: Miridae) on whi-tefly (Homoptera: Aleyrodidae) predation by Macrolo-phus caliginosus (Wagner) (Heteroptera: Miridae). BiolControl 25: 123-128.
Mainali BP, Lim UT, 2008. Use of flower model trap to re-duce the infestation of greenhouse whitefly on tomato. JAsia Pac Entomol 11: 65-68.
Miguel AF, Van de Braak NJ, Bot GPA, 1997. Analysis ofthe airflow characteristics of greenhouse screening ma-terials. J Agr Eng Res 67: 105-112.
Molina-Aiz FD, 2010. Ventilation simulation and modellingby computational fluid dynamics (CFD) in Almería-typegreenhouses. Doctoral thesis. Universidad de Almería,Almería, Spain. [In Spanish].
Molina-Aiz FD, Valera DL, Álvarez AJ, 2004. Measurementand simulation of climate inside Almería-type greenhou-ses using computational fluid dynamics. Agric Forest Me-teorol 125: 33-51.
Molina-Aiz FD, Valera DL, Álvarez AJ, Madueño A, 2006.A wind tunnel study of airflow through horticulturalcrops: determination of the drag coefficient. Biosyst Eng93(4): 447-457.
Molina-Aiz FD, Valera DL, Peña AA, Gil JA, López A, 2009.A study of natural ventilation in an Almería-type green-house with insect screens by means of tri-sonic anemo-metry. Biosyst Eng 104: 224-242.
Molina-Aiz FD, Valera DL, López A, Álvarez AJ, Escami-rosa C, 2012. Effects of insect-proof screens used in greenhouse on microclimate and fruit yield of tomato (Solanum lycopersicum L.) in a mediterranean climate.Acta Hort 927: 707-714.
Montero JI, Muñoz P, Anton A, 1997. Discharge coefficientsof greenhouse windows with insect-proof screens. ActaHort 443: 71-77.
Muñoz P, Montero JI, Antón A, Giuffrida F, 1999. Effect ofinsect-proof screens and roof openings on greenhouseventilation. J Agr Eng Res 73: 171-178.
Microclimate evaluation of a new design of insect-proof screens 351

Nield DA, Bejan A, 1998. Convection in porous media.Springer, NY (USA).
Papadakis G, Mermier M, Meneses JF, Boulard T, 1996. Me-asurement and analysis of air exchange rates in a green-house with continuous roof and side openings. J Agr EngRes 63: 219-228.
Pérez-Parra JJ, Baeza E, Montero JI, Bailey BJ, 2004. Na-tural ventilation of parral greenhouses. Biosyst Eng 87:89-100.
Qingyan C, Van der Kooi J, Meyers AT, 1988. Measurementsand computations of ventilation efficiency and tempera-ture eff iciency in a ventilated room. Energ Buildings12(2): 85-99.
Shilo E, Teitel M, Mahrer Y, Boulard T, 2004. Air-flow patterns and heat fluxes in roof-ventilated multi-span greenhouse with insect-proof screens. Agric Forest Me-teorol 122: 3-20.
Shipp JL, Wang K, 2003. Evaluation of Amblyseius cucu-meris (Acari: Phytoseiidae) and Orius insidiosus (Hemip-tera: Anthocoridae) for control of Frankliniella occiden-talis (Thysanoptera: Thripidae) on greenhouse tomatoes.Biol Control 28: 271-281.
Tanaka N, Matsuda Y, Kato E, Kokabe K, Furukawa T, Nonomura T, Honda K, Kusakari S, Imura T, Kimbara J,Toyoda H, 2008. An electric dipolar screen with opposi-tely polarized insulators for excluding whiteflies fromgreenhouses. Crop Prot 27: 215-221.
Tanny J, Haslavsky V, Teitel M, 2008. Airflow and heat flux through the vertical opening of buoyancy-indu-ced naturally ventilated enclosures. Energ Buildings 40:637-646.
Taylor RAJ, Shalhevet S, Spharim I, Berlinger MJ, Lebiush-Mordechi S, 2001. Economic evaluation of insect-proof
screens for preventing tomato yellow leaf curl virus of to-matoes in Israel. Crop Prot 20: 561-569.
Teitel M, 2001. The effect of insect-proof screens in roofopenings on greenhouse microclimate. Agric Forest Me-teorol 110(1): 13-25.
Teitel M, 2007. The effect of screened openings on greenhou-se microclimate. Agric Forest Meteorol 143(3-4): 159-175.
Teitel M, Shklyar A, 1998. Pressure drop across insect-pro-of screens. T ASAE 41(6): 1829-1834.
Teitel T, Tanny J, Ben-Yakir D, Barak M, 2005. Airflow patterns through roof openings of a naturally ventilatedgreenhouse and their effect on insect penetration. BiosystEng 92(3): 341-353.
Teitel M, Liran O, Tanny J, Barak M, 2008. Wind driven ven-tilation of a mono-span greenhouse with a rose crop andcontinuous screened side vents and its effect on flow patterns and microclimate. Biosyst Eng 101(1): 111-122.
Valera DL, Álvarez AJ, Molina FD, Peña A, López JA, Madueño A, 2003. Caracterización geométrica de dife-rentes tipos de agrotextiles utilizados en invernaderos.Proc II Congreso Nacional de Agroingeniería, Córdoba(Spain), Sept 24-16. pp: 670-675.
Valera DL, Molina FD, Álvarez AJ, López JA, Terrés-Nico-li JM, Madueño A, 2005. Contribution to characterizationof insect-proof screens: experimental measurements inwind tunnel and CFD simulation. Acta Hort 691: 441-448.
Valera DL, Álvarez AJ, Molina FD, 2006. Aerodynamicanalysis of several insect-proof screens used in greenhou-ses. Span J Agric Res 4(4): 273-279.
Van Buggenhout S, Van Brecht A, Eren Özcan S, VrankenE, Van Malcot W, Berckmans D, 2009. Influence of sam-pling positions on accuracy of tracer gas measurementsin ventilated spaces. Biosyst Eng 104: 216-223.
352 A. Lopez-Martinez et al. / Span J Agric Res (2014) 12(2): 338-352

![€¦ · Web viewMiranda: [beep] Who just joined us? Jackson: Steve Jackson. Miranda: Okay. And, uh, visitors? Hoddle: Vance Hoddle. ... didn’t hear a word of report to Eric on](https://static.fdocuments.us/doc/165x107/5b58f22f7f8b9a4e1b8ca188/-web-viewmiranda-beep-who-just-joined-us-jackson-steve-jackson-miranda-okay.jpg)