Micro Project E-Poster-Final
15
Isolation and Quantification of Normal Mouth Flora Relative to Diet and Soft Drink Consumption Jane M. Tonello Jason M. Dillon Microbiology 222 Spring 2009
-
Upload
jason-dillon -
Category
Documents
-
view
21 -
download
0
Transcript of Micro Project E-Poster-Final

Isolation and Quantification of Normal Mouth Flora
Relative to Diet and Soft Drink Consumption
Jane M. TonelloJason M. Dillon
Microbiology 222Spring 2009

The average human mouth contains a multitude of
bacteria. Such bacteria include: Staphylococcus
epidermidis, Streptococcus mitis, Streptococcus
salivarius, Streptococcus mutans, Lactobacillus sp.,
Spirochetes, Actinomyces odontolyticus, anaerobes,
and numerous others (Hanks 1,Todar 1). The human
esophageal cavity contains many nutrients and
remains very moist, thus it provides an environment
that is vital to common oral bacterial growth. Many of
these common bacteria found in the human mouth
have the ability to ferment carbohydrates, such as
lactose and glucose, into lactic acid.
Introduction

Acid fermenting bacteria have the ability to multiply
greatly at pH’s of between 4.0 and 5.2, demonstrating
that artificially lowering the pH by introducing
carbonic acid from a soft drink may further promote
bacterial growth (Bibby 2). The normal flora of the
mouth also helps prevent transient flora growth and
infections from pathogenic bacteria by utilizing the
available resources in the mouth. This experiment will
quantify the oral bacteria for a number of individuals,
and determine if factors such as vegetarian versus
non-vegetarian diet, and the amount of daily soft drink
intake affects oral bacterial growth.
Intro contd.
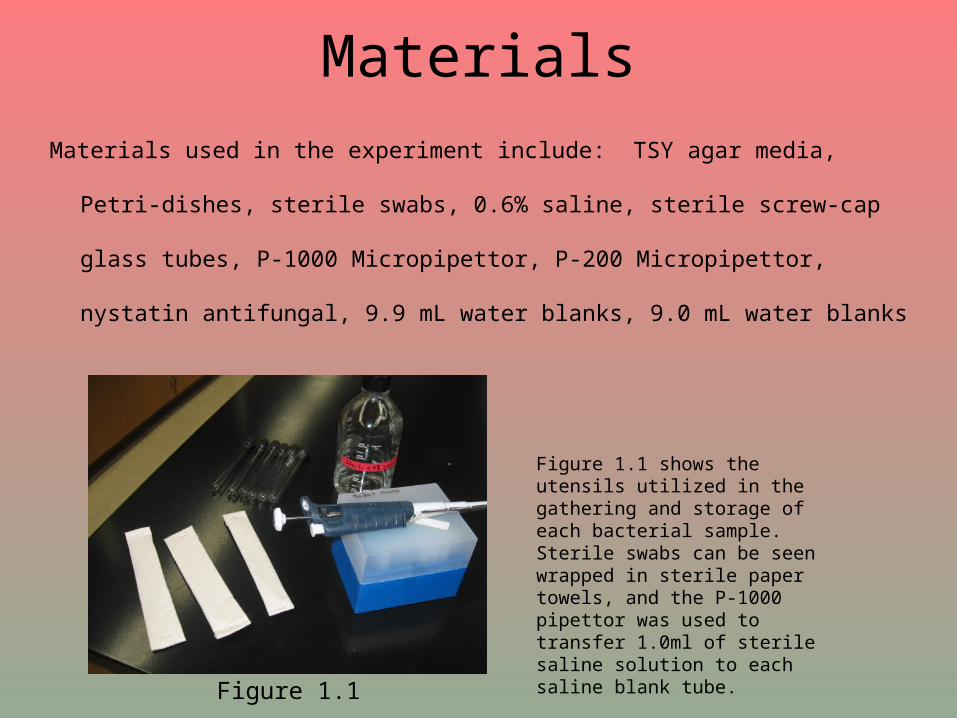
Materials
Materials used in the experiment include: TSY agar media, Petri-
dishes, sterile swabs, 0.6% saline, sterile screw-cap glass
tubes, P-1000 Micropipettor, P-200 Micropipettor, nystatin
antifungal, 9.9 mL water blanks, 9.0 mL water blanks
Figure 1.1
Figure 1.1 shows the utensils utilized in the gathering and storage of each bacterial sample. Sterile swabs can be seen wrapped in sterile paper towels, and the P-1000 pipettor was used to transfer 1.0ml of sterile saline solution to each saline blank tube.

Methods 250.0mL of TSY agar recipe is made, and TSY agar plates poured
Six screw-cap vials are filled with 1.0mL of 0.6% saline
Bacterial samples are taken from six subjects by swabbing mouth with sterile swabs and put into saline screw cap vial
Six TSY agar plates are streaked from the inoculated saline solution
After one week of incubation in the room temperature (20-25oC) incubator, all
plates are observed and morphologies recorded
Figure 1.2
Figure 1.2 demonstrates the electronic scale that was used during the process of TSY Agar media creation. All ingredients were weighed out to the hundredths place.

Gram stains are performed for isolated colonies and all observations are recorded
500.0mL of TSY agar plates poured
Bacterial samples obtained through previous method
Serial dilutions are made for each sample possible (10-3, 10-4, 10-5, and 10-6) using P-1000 and P-200 micropipetters
Plates are incubated for one week at room temperature, and then observed for the quantity of bacteria for each subject
500.0mL of TSY agar plates are poured with Nystatin
More samples are collected and dilutions are made for each sample possible (10-5, 10-6, 10-7, 10-8)
Plates are incubated for one week, and then removed for final observations and recordings of bacterial amount for each subject
Methods contd.

Results-Gram Stains
Two streak plates were performed for the very
first bacterial sampling. Gram stains were
completed for each of these two pure cultures,
and Gram positive, tiny cocci were observed for
each plate. Also, Gram stains were performed for
two of the first spot plates that were made, and
Gram positive, tiny clustered cocci were also
observed for these plates. For all four Gram
stains, pairing of two to three cocci were
observed.

Results
Figures 2.1 and 2.2 show the spot plates that were prepared for the second bacterial samples. The dilutions were 10^-3, 10^-4, 10^-5, and 10^-6, and demonstrate that many of the plates contained bacteria that was too numerous to count. As can be seen, there is a diverse amount and types of bacteria present.
Figure 2.1
Figure 2.2
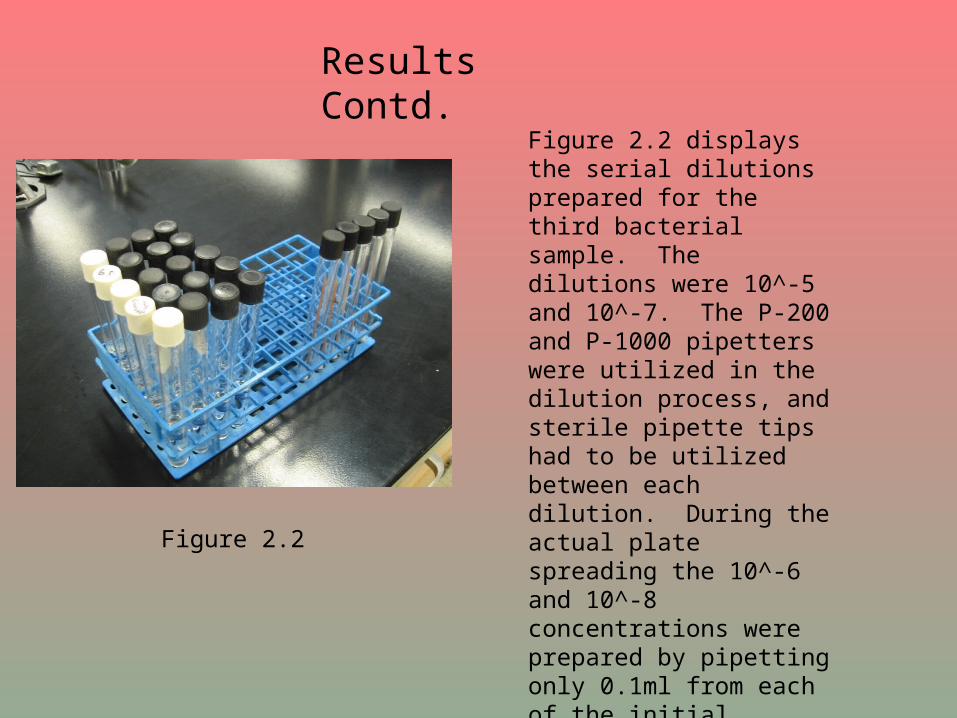
Figure 2.2
Figure 2.2 displays the serial dilutions prepared for the third bacterial sample. The dilutions were 10^-5 and 10^-7. The P-200 and P-1000 pipetters were utilized in the dilution process, and sterile pipette tips had to be utilized between each dilution. During the actual plate spreading the 10^-6 and 10^-8 concentrations were prepared by pipetting only 0.1ml from each of the initial dilutions.
Results Contd.

Results-Bacterial QuantificationNon-vegetarian (NV), soda #/day
10^-5 (4-14-09)
10^-5 (4-20-09)
10^-7 (4-20-09)
10^-8 (4-20-09)
AH (NV, 2 sodas)
20,800,000 NG NG NG
HK (NV, 1 soda)
NG NG 580,000,000
TNTC
KK (NV, 1 soda)
NG 11,700,000
NG 123,000,000,000
MC (NV, 1 soda)
TNTC 400,000 NG NG
As seen in Figure 2.3, some of the spot plates demonstrated no growth (NG) at all, and many of them demonstrated bacterial growth that was too numerous to count (TNTC). This table represents the data that could actually be quantified, and displays that the bacterial concentration found in a person’s mouth is particular to him or her.
Figure 2.3
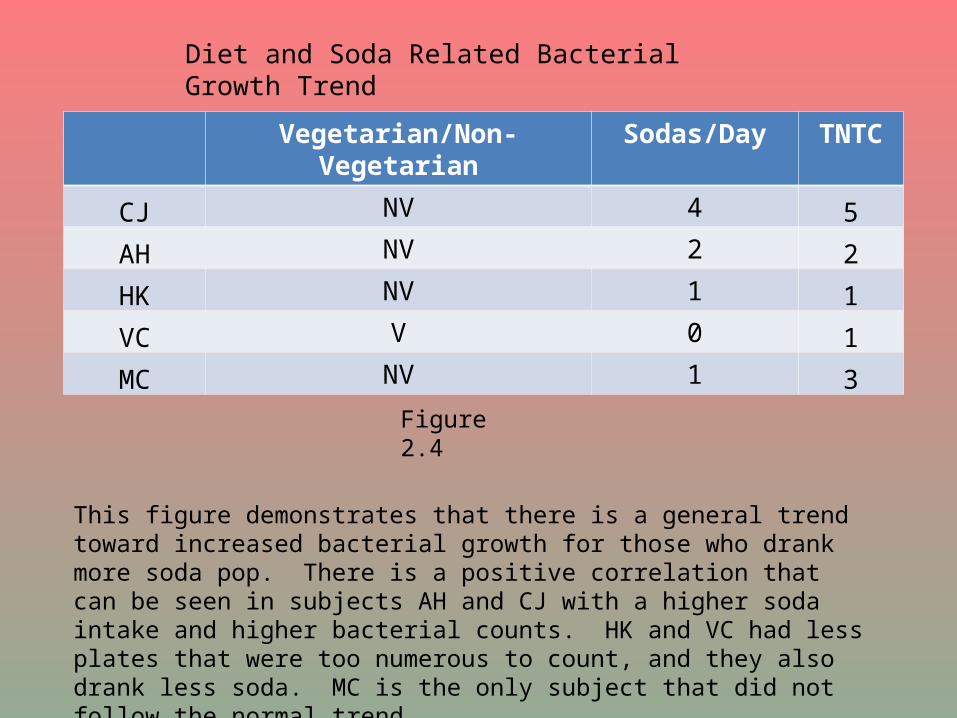
Vegetarian/Non-Vegetarian
Sodas/Day TNTC
CJ NV 4 5
AH NV 2 2
HK NV 1 1
VC V 0 1
MC NV 1 3
Figure 2.4
This figure demonstrates that there is a general trend toward increased bacterial growth for those who drank more soda pop. There is a positive correlation that can be seen in subjects AH and CJ with a higher soda intake and higher bacterial counts. HK and VC had less plates that were too numerous to count, and they also drank less soda. MC is the only subject that did not follow the normal trend.
Diet and Soda Related Bacterial Growth Trend

DiscussionSix different subjects were chosen, all with different diets, and
relatively different soda consumption, including one subject that did
not drink any soft drinks at all as a control. Since it is nearly
impossible to have all six subjects to have the exact same oral
hygiene and eat the exact same thing every day, bacterial levels
varied greatly sample from sample. In gathering the bacterial
samples using sterile swabs for each subject’s mouth, the same
amount of sample can’t be extracted every time. This leads to further
variation in bacteria amount for each subject. In the initial inoculation
of TSY agar plates mold growth became overwhelming. The mold
spores could have been present in the subject’s mouth, or could have
been introduced from the air. Nystatin anti-fungal was used in the
second inoculation to limit mold and promote bacterial growth.

Discussion Cont. Due to further fungal contamination only three plates could be
inoculated for the second bacterial sampling, and only five
plates for the third. Also, the Gram stains exhibited Gram
positive, paired cocci, which indicates Streptococcus sp., which
is very common in mouth flora. A fourth sample was taken from
each subject, but an autoclave malfunction prohibited TSY Agar
plate production, prematurely ending the experiment. The
data, despite all errors, showed that there was a trend between
diet and soda consumption in comparison with bacteria growth.
Subjects with a non-vegetarian diet and larger soft-drink
consumption tended to have more bacteria growth compared
with those who did not drink soda and had a vegetarian diet.

Literature Cited
Bibby,B.G., J.F. Volker, and M. Van Kersteren. Acid Production and Tooth Decalcification By Oral Bacteria. Journal of Dental Research. 1942. 5 May 2009. http://jdr.sagepub.com/cgi/reprint/21/1/61
Hanks, Hershell. Microbial Flora of the Mouth-Experiment 60. Collin County Community College District. 2009. 15 March 2009. http://209.85.173.132/search?q=cache:aAXhEayMyjgJ:iws.ccccd.edu/hhanks/Lab%2520Lectures/MICROBIAL%2520FLORA%2520OF%2520THE%2520MOUTH,%2520Exp.%252060.doc+mouth+flora&hl=en&ct=clnk&cd=3&gl=us.
Todar, Kenneth. The Normal Bacterial Flora of Humans. Todar’s Online Textbook of Bacteriology. 2008. 15 March 2009. http://www.textbookofbacteriology.net/normalflora.html.

Acknowledgments
A special thanks to:Dr. Anderson
Dikshya Bastakoty (and all other TAs)And to our anonymous test subjects!