MICHIGAN INTERSECTION GUIDE - mdotcf.state.mi.us INTERSECTION ... in urban areas where traffic...
146
MICHIGAN INTERSECTION GUIDE July 2008
Transcript of MICHIGAN INTERSECTION GUIDE - mdotcf.state.mi.us INTERSECTION ... in urban areas where traffic...

MICHIGAN INTERSECTION
GUIDE
July 2008
Engineering Manual Preamble
This manual provides guidance to administrative, engineering, and technical staff. Engineering practice requires that professionals use a combination of technical skills and judgment in decision making. Engineering judgment is necessary to allow decisions to account for unique site-specific conditions and considerations to provide high quality products, within budget, and to protect the public health, safety, and welfare. This manual provides the general operational guidelines; however, it is understood that adaptation, adjustments, and deviations are sometimes necessary. Innovation is a key foundational element to advance the state of engineering practice and develop more effective and efficient engineering solutions and materials. As such, it is essential that our engineering manuals provide a vehicle to promote, pilot, or implement technologies or practices that provide efficiencies and quality products, while maintaining the safety, health, and welfare of the public. It is expected when making significant or impactful deviations from the technical information from these guidance materials, that reasonable consultations with experts, technical committees, and/or policy setting bodies occur prior to actions within the timeframes allowed. It is also expected that these consultations will eliminate any potential conflicts of interest, perceived or otherwise. MDOT Leadership is committed to a culture of innovation to optimize engineering solutions.
The National Society of Professional Engineers Code of Ethics for Engineering is founded on six fundamental canons. Those canons are provided below.
Engineers, in the fulfillment of their professional duties, shall:
1. Hold paramount the safety, health, and welfare of the public. 2. Perform Services only in areas of their competence. 3. Issue public statement only in an objective and truthful manner. 4. Act for each employer or client as faithful agents or trustees. 5. Avoid deceptive acts. 6. Conduct themselves honorably, reasonably, ethically and lawfully so as to enhance the
honor, reputation, and usefulness of the profession.

MICHIGAN INTERSECTION GUIDE
TABLE OF CONTENTS 1.0 Introduction..................................................................................................1 2.0 Basic Terminology and Information............................................................1 3.0 Planning .......................................................................................................4 3.1 Design Considerations and Objectives ............................................4 3.2 Locations Needing Careful Review.................................................5 3.3 Data for Operational Review/Feasibility .........................................5 4.0 Safety ..........................................................................................................5 5.0 Design Information ......................................................................................6 6.0 Operational Analysis....................................................................................6 7.0 MDOT Intersection Comparison Matrix Tool.............................................8 8.0 Miscellaneous Topics.................................................................................11 APPENDIX A Strategies to Improve Safety and Operations at Signalized Intersections Strategies to Improve Safety and Operations at Unsignalized Intersections APPENDIX B MDOT Roundabout Quick Guide APPENDIX C Intersection Crash Reports (2004-2006) APPENDIX D Intersection Conflict Diagrams APPENDIX E MDOT’s Crash Reduction Factors for Various Countermeasures (January 2008) CREDITS This document was prepared by Wilcox Professional Services, LLC under the direction of MDOT’s Intersection Committee which consists of the following individuals: Jack Benac Imad Gedaoun Stephanie Palmer Terry Palmer Bob Rios

REFERENCES
1. A Policy on Geometric Design of Highways and Streets, American Association of State Highway and Transportation Officials, 2004
2. NCHRP Report 500, Guidance for Implementation of the AASHTO Strategic Highway Safety Plan, Transportation Research Board, 2003
3. Michigan Manual on Uniform Traffic Control Devices, Federal Highway Administration and MDOT, 2005
4. Traffic and Safety Notes, Michigan Department of Transportation – Traffic and Safety
5. Unconventional Arterial Intersection Design, Management and Operations Strategies, Parsons Brinckerhoff Quade and Douglas, Inc., 2003
6. MDOT Geometric Design Guide 7. MDOT Road Design Manual 8. MDOT Sight Distance Guidelines 9. MDOT Signing Design, Placement , and Application Guidelines 10. MDOT Traffic Signal Guidance for Vehicle Change Intervals 11. Guidelines for Four-Lane to Three-Lane Conversions, Michigan State University,
2001 12. Guide for the Development of Bicycle Facilities, American Association of State
Highway and Transportation Officials 13. Older Driver Highway Design Handbook, Federal Highway Administration 14. Traffic Engineering Handbook, Institute of Transportation Engineers

1
1.0 Introduction The American Association of State Highway and Transportation Officials (AASHTO) defines an intersection as the general area where two or more highways join or cross, including the roadway and roadside facilities for traffic movements within the area. Intersections are an important part of a highway facility because the efficiency, safety, speed, cost of operation, and capacity of the facility depend on their design. The Intersection Guide is a summary that describes the different types of intersections, identifies some of the situations where different types of intersections could be used, outlines countermeasures that are available to correct deficiencies, and estimates maximum capacities for various types of intersections. Appendix A is a more thorough description of strategies to improve safety and operations at signalized and unsignalized intersections. Included in Appendix B is The Roundabout Guide, which contains information regarding roundabout planning, safety, geometric design, pavement markings and signing, public involvement, and other design/operational considerations. The guide also contains crash history data in Appendix C that can help the engineer determine whether the crash experience at an existing site is above the average for similar intersections within defined traffic volume ranges and geographic locations. Conflict diagrams are included in Appendix D that show conflicts for different types of intersections. Appendix E includes the MDOT crash reduction factors for various countermeasures. 2.0 Basic Terminology and Information The basic types of intersections are the three-leg or T, the four-leg, multileg, and roundabouts. At each particular location, the intersection type is determined by the number of intersections legs, whether or not the highway is divided, the topography, the traffic volumes, patterns, and speeds, and the desired type of operation. A brief discussion of these intersection types follows. The basic intersections types vary greatly in scope, shape, and degree of channelization. More detailed information regarding intersection types and examples are provided in AASHTO’s “A policy on Geometric Design of Highways and Streets” (The Green Book) and the MDOT Geometric Design Guides. Three-Leg or T-Intersections- The normal pavement widths of both highways should be maintained at T-intersections except for the paved returns or where widening is needed to accommodate large commercial vehicles, or where auxiliary turn lanes are needed to improve safety and capacity for turning vehicles. Typical T-intersection details are shown in Geometric Design Guide VII-650, and the Green Book in Chapter 9. Guidelines for auxiliary lanes are found in the Traffic and Safety Notes 603 (7.3), 604 (7.5) and 605 (7.6). Four-Leg Intersections- Four-leg intersections vary from the simple intersection of two lightly traveled local streets to complex intersection of two main highways. The overall design principles, channelization, use of auxiliary lanes, and traffic control vary greatly depending on human factors, traffic considerations, physical elements, and economic

2
factors. Typical four-leg intersections are shown in Geometric Design Guide VII-650, and VII-670, and the Green Book in Chapter 9. Guidelines for auxiliary lanes are found in the Traffic and Safety Notes. Multileg Intersections- Intersections with more than four legs are seldom used and should be avoided where possible. Most often they are found in urban areas where traffic volumes are light and stop control is used. Sometimes safety and efficiency can be improved by eliminating some the movements or legs, or constructing a roundabout. Roundabouts- Road junction at which traffic enters a counter clockwise, one-way stream around a central island. See MDOT Roundabout Quick Guide in Appendix B.
Alternative Intersection Designs- There are several innovative intersections designs, shown in the “Green Book,” that have been used in Michigan and other states. Some of these designs include:
• Median U-Turn Crossovers- See the “Green Book” Chapter 9, Exhibit 9-91, and Geometric Design Guide VII-670. This design utilizes u-turn directional crossovers, located approximately 600-700 ft from the crossroad, for the redirection of left turns vehicles.
M-59 (Highland Rd) and Hickory Ridge Rd – Median U-Turn Crossovers

3
• Jughandles- See the “Green Book” Chapter 9, Exhibit 9-88, 9-89, 9-93. This design has been used in Michigan to a limited extent. In a jughandle, the ramp leaves before the intersection and left turning traffic turns left off it rather than the through road. In a reverse jughandle, the ramp leaves after the intersection and left turning traffic loops around to the right and merges with the crossroad before the intersection. The jughandle movement eliminates direct left turns at the cross street intersection reducing delay to though traffic. The jughandle design also includes what is commonly referred to as ground loops, which have also been used in Michigan.
M-53 (Van Dyke Ave) and US-24 (Telegraph Rd) and M-153 15 Mile Rd – Reverse Jughandle (Ford Rd) – Jughandle & Quadrant
Roadway
Pennsylvania Ave and Cedar St – Ground Loops

4
• Quadrant Roadway – Michigan has used at-grade left turn ramps, in advance of the cross road intersection, to direct the left turns to the crossroad. All left turns are removed from the primary intersection.
US-24 (Telegraph Rd) and Plymouth Rd – Quadrant Roadway with U-turn directional crossovers to redirect left turns.
• Bowties, superstreets, paired intersections, continuous flow, flyover intersections-
These are some other innovative designs being used by other states. See a study done by Parsons Brinkerhoff Quade and Douglas, Inc, entitled “Unconventional Arterial Intersection Design, Management, and Operations Strategies” for more information.
3.0 Planning 3.1 Design Considerations and Objectives The main objectives of intersection design are to facilitate the safe and efficient movements of vehicles, bicyclists, and pedestrians. Basic elements to consider in intersection design are discussed in AASHTO documents and include the following:
• Human Factors- include driving habits, ability to make decisions, driver expectancy, decision reaction times, pedestrian and bicyclist use, and habits.
• Traffic Considerations- include design hour movements, capacity, size and operating characteristics of vehicles, speeds, crossing distances, traffic control devices, complexity, crash experience, bicycle and pedestrian movements, traffic growth and/or future developments.
• Physical Elements- include vertical and horizontal alignment, sight distance, angle of intersection, conflicts, speed-change lanes, traffic control devices, lighting, drainage features, environmental factors, pedestrian facilities, driveways, medians and islands.
• Economic Factors- include cost of improvements, energy consumption, delay, cost, air quality, right of way available, number of approach lanes, and number of legs.

5
3.2 Locations Needing Careful Review Any intersections with a Level of Service worse than D or higher than average crash experience may justify an operational analysis to determine if corrective measures are warranted. Corrective measures are detailed in 4.0 Safety section. 3.3 Data for Operational Review/Feasibility During the scoping phase of a project, data is required to adequately analyze the operations of an intersection and possible improvement options. Data that is typically needed to evaluate an intersection includes the following:
• Existing and future AM and PM peak traffic movements • Design vehicle identification including percentage of trucks • Existing intersection geometrics • Right of Way • Crash data and pattern identification for 3 years, 7 years if fatal crash occurred • Utility information • Location of access points • Pedestrian and bicyclist needs • Transit stop locations • Sight distances • Physical inventory including: existing traffic control devices, signs, signals,
pavement markings, visibility of traffic control devices, driveway locations, fixed objects, guardrail, pavement conditions, curb conditions, and drainage
• Operational review including: length of traffic queues, signal timing, erratic maneuvers, vehicles having problems turning, weaving or merging, pedestrian vehicle conflicts, evidence of hit objects at intersection
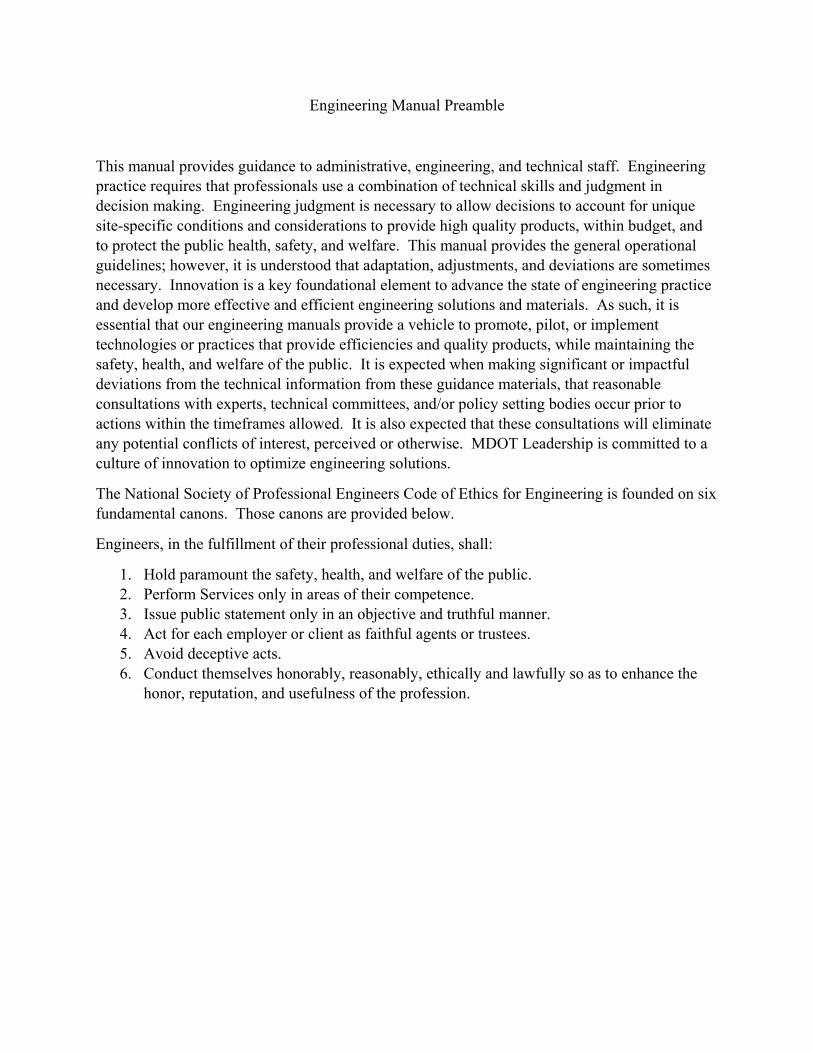
4.0 Safety General Intersections constitute only a small part of the overall highway system, yet intersection related crashes in Michigan constitute more than 24 percent of fatal crashes in 2006 (258 fatalities) and 30 percent of all the reported crashes (93,790 crashes). It is not unusual that crashes are concentrated at intersections because they are the point on the roadway system where traffic movements most frequently conflict with one another. Good geometric design combined with proper traffic control can result in an intersection that operates efficiently and safely. The following charts depict the percentage of 2006 Michigan intersection crashes by traffic control type.
6
Appendix A is an in depth discussion of strategies to improve safety and operations at signalized and unsignalized intersections. Appendix B is the MDOT Roundabout Quick Guide. Appendix C is historical crash data for various types of intersections on the state trunkline system. It includes the average number of crashes and crash types for different types of intersections at different ADT levels. The data can be used to determine if an existing intersection has more than the average number of crashes when compared to similar locations. When reviewing crashes, special attention should be given to the severity of the crashes even if the total number of crashes is lower than the average for similar intersections. Conflict diagrams are included in Appendix D that show conflicts for different types of intersections. Appendix E includes the MDOT crash reduction factors for various countermeasures. 5.0 Design Information Guidance for developing intersection geometrics can be found in the AASHTO Green Book, MDOT Geometric Design Guides, and the Road Design Manual (Chapter 3). Guidance for developing roundabouts can be found in Section 4 of MDOT’s Roundabout Guidance Document. 6.0 Operational Analysis An operational analysis of any intersection type, except roundabouts can be completed using The Highway Capacity Manual or SYNCHRO software package. The following tables estimate the hourly capacity of different intersections with different traffic control: T-Intersection (Two-Lane Highway) STOP Control One Lane Approach on All Legs 1400 vph for entire intersection With CLFLT on All Approaches 1600 vph for entire intersection T-Intersection (Two-Lane Highway) ALL-WAY STOP Control One Lane Approach on All Legs 1400 vph for entire intersection With CLFLT on All Approaches 1650 vph for entire intersection
Fatal Crashes
Signal32%
Stop Sign40%
Yield Sign2%
None of These24%
Unknown2%
Signal Stop Sign Yield Sign None of These Unknown
All Crashes
Signal 47%
Stop Sign 24%
Yield Sign 2%
None of These 25%
Unknown 2%
Signal Stop Sign Yield Sign None of These Unknown

7
T-Intersection (Two-Lane Highway) Signal Control One Lane Approach on All Legs 2400 vph for entire intersection With Left Turn Lanes on All Approaches 3550 vph for entire intersection Four-Leg Intersection (Two-Lane Highway) 2-Way Stop Control 1 Lane Approach All Legs
1300 vph for entire intersection
2-Way Stop Control + CLFTL All Legs 1550 vph for entire intersection 4-Way Stop Control 1 Lane Approach All Legs
1400 vph for entire intersection
4-Way Stop Control + CLFTL All Legs 1600 vph for entire intersection Signal Control With CLFTL All Legs 3700 vph for entire intersection Signal + Left & Right Turn Lanes All Legs 4000 vph for entire intersection Four-Leg Intersection (Four-Lane Highway) Signal Control With CLFTL All Legs 5150 vph for entire intersection 2-Way Stop 1400 vph for entire intersection Four-Leg Intersection (Divided Highway) Signal Control (All left turns redirected to U-turn crossover) Four-Lane Divided 6200 vph for entire intersection Four-Lane + Right Turn Lanes (Mainline) 7500 vph for entire intersection Six-Lane Divided 7850 vph for entire intersection Six-Lane + Right-Turn Lanes (Mainline) 8350 vph for entire intersection Eight-Lane Divided 8300 vph for entire intersection Eight-Lane + Right-Turn Lanes (Mainline) 8650 vph for entire intersection Typical Roundabout Capacities Type of Roundabout Approximate Peak Hour Capacity Single Lane Up to 2,000 vph for all approaches Two-Lane Up to 4,000 vph for all approaches Three-Lane Up to 7,000 vph for all approaches 7.0 MDOT Intersection Comparison Matrix Tool MDOT’s evaluation matrix aids in the decision making process. The matrix includes a list of information that can be used to evaluate different intersection alternatives.

8
MDOT Intersection Comparison Matrix Tool (For Safety, Scoping, and EPE Studies)* * Additional information regarding this matrix can be found on the next page. ** Roundabout delays from Rodel are stop delay, while delay for other intersections in HCS/Synchro are control delay. In order to evenly compare these numbers, geometric delay should be added to roundabout stop delay from Rodel to get control delay. See MDOT’s Roundabout Guidance Document for more information on calculating roundabout geometric delay. ***For more information regarding C/B methodology, see page 10 of this document. The following criteria may also be helpful for comparing alternatives:
• Is funding available? • Are traffic counts/projections available (Existing, 10-year, or 20-year)? • Does the alternative create the potential for enhancements? • Are bike/pedestrian facilities present or planned? • Are bike accommodations required? • What is the percentage of heavy truck traffic? • Is the intersection designed for trucks? • Is the intersection located within a system of progressed traffic signals? • Is the intersection adjacent to bridge or railroad crossing? • Is the intersection adjacent to another intersection? • Pedestrian Count___________
Road Improvement Alternatives/Options
Total Cost Estimate* Control Delay** Level of
Service Design Life Cost/Benefit Ratio*** Safety Benefits ROW Impacts
(acres) Environmental
Issues Potential Utility
Conflicts Construction
Impacts
Driveway Accommodation/
Good Access Management
Public Input/ Community
Support

9
MDOT INTERSECTION COMPARISON MATRIX
Below is a brief description of all of Matrix items.
• Road Improvement Alternatives/Options – Alternatives are the potential solutions being considered for each location. Options are variations within an alternative. (e.g., for Alternative 1 - Upgraded Signalized Intersection, there could be two options which are Alternative 1a - Upgraded Signalized Intersection with dual left turn lanes and Alternative 1b - Upgraded Signalized Intersection with single left turn lanes and different signal timing.)
• Cost Estimate – Total cost. Can consist of safety, CMAQ, R&R, EDA, capacity, local, etc. • Delay – Average seconds of control delay per vehicle as defined in the Highway Capacity
Manual • LOS – Level of Service • Design Life – Typical 10 or 20 years • Cost Benefit Ratio (C/B) – Includes maintenance and safety and delay costs (see the following
page for calculations) • Safety Benefits – Text description of potential safety improvements • ROW Impacts – Text description and acreage of impacts • Environmental Issues – Text description of any potential environmental impacts (e.g. wetlands,
cultural resources, etc.) • Potential Utility Conflicts – Text description of potential utility conflicts (e.g. water/sewer lines,
utility poles, etc.) • Construction Impacts – Text description of construction on local roads, business, traffic etc. • Driveway/Access Management – Text description of how easy the project will fit relative to other
options • Public Input/Community Support – Input on each option

10
C/B = T+[(M+E) X L] Calculation of Cost/Benefit Ratio [(D+A) x L] T = Total Cost: All costs related to the proposed alternative including PE, CE
and Right-of-Way costs. M = Maintenance Cost: All anticipated yearly maintenance cost in dollars per
year. Typical yearly maintenance cost for a signalized intersection is $1200, and a roundabout is $0.00.
E = Energy Cost: The total expected yearly energy cost in dollars per year. Typical energy cost for signalized intersection is $550, and a roundabout is $1800.
L = Design Life: The projected design life for all options. Typically this value is 20 years. A = Accident Reduction Factor: The annual benefit from the reduction of crashes. This value is provided by MDOT Traffic and Safety staff. D = Average Delay Cost: The total benefit from the reduction in delay
between the existing condition and proposed alternative. It is calculated as follows:
D = [Delay (Existing*) – Delay (Proposed*)] x ADT x N x Z 3600 Delay = AM peak delay**(sec/veh) + PM peak delay** (sec/veh) 2 * The above delay should be computed for the existing conditions with future
projected traffic volumes and for the proposed conditions with the projected 20 year traffic volumes for each alternative.
** Add geometric delay for roundabouts according to the MDOT Roundabout Guide
to the average delay provided by RODEL.
ADT = Average daily traffic. If not known, compute as follows: ADT = (AM + PM peak volumes) x 10
2
N = Number of days per year (365 days) Z = Hourly delay Cost/Vehicle ($14.83). This dollar value should be updated
yearly.

11
8.0 Miscellaneous Topics More detailed information for the following topics may be found on MDOT’s website www.michigan.gov/mdot and in the following documents:
• Intersection Design – MDOT Geometric Design Guides, MDOT Road Design Manual and MDOT Traffic & Safety Notes
• Sight Distance – AASHTO “Green Book,” MDOT Sight Distance Guidelines • Signals – MMUTCD, Highway Capacity Manual, ITE Traffic Engineering
Handbook, MDOT Traffic Signal Special Details, Michigan Signal Optimization Guidelines, and Michigan Timing Permit Development
• Signing – MMUTCD, MDOT Standard Highway Sign, MDOT Sign Support Special Details/Standard Plans, MDOT Signing Design, Placement, and Application Guidelines and MDOT Traffic & Safety Notes
• Pavement Markings – MMUTCD, MDOT Pavement Marking Special Details/Standard Plans and MDOT Traffic & Safety Notes

APPENDIX A
TABLE OF CONTENTS Strategies to Improve Safety and Operations at Signalized Intersections ..........................................................................................................1 1.0 Reduce Frequency and Severity of Intersection Conflicts Through Traffic Control
and Operational Improvements....................................................................1 1.1 Employ Multiphase Signal Operation..............................................1
1.1.a Protected Left Turns 1.1.b Use Split Phases
1.2 Optimize Clearance Intervals...........................................................4 1.3 Evaluations – Left/Right Turn Maneuvers at Signalized Intersections
..........................................................................................................5 1.4 Coordinate Signals ...........................................................................6 1.5 Improve Operation of Pedestrian and Bicycle Facilities at Signalized
Intersections .....................................................................................6 1.6 Remove Unwarranted Signals..........................................................7
2.0 Reduce Frequency and Severity of Intersection Conflicts Through Geometric
Improvements ..............................................................................................8 2.1 Provide or Improve Left-Turn Channelization ................................8
2.1.a Install Left-Turn Lanes 2.1.b Improve Left-Turn Lane Geometry 2.1.c Lengthen Left-Turn Lane 2.1.d Provide Positive Offset for Left-Turn Lanes 2.1.e Delineate Turn Path 2.1.f Four-Lane to Three-Lane Conversion
2.2 Provide or Improve Right-Turn Lanes...........................................10 2.2.a Construct Right-Turn Lanes 2.2.b Lengthen Right-Turn Lanes 3.0 Improve Geometry of Pedestrian, Bicycle, and Transit Facilities .............11 4.0 Revise Geometry of Complex Intersections ..............................................13 4.1 Convert One Four-Leg Intersection to Two T-Intersections .........13 4.2 Convert Two T-Intersections to One Four-Leg Intersection .........14 4.3 Improve Intersection Skew Angle .................................................14 4.4 Remove Deflection in Through-Vehicle Travel Path ....................15 4.5 Close Intersection Leg ...................................................................15 5.0 Construct Special Solutions .......................................................................15 5.1 Provide Indirect Left Turns............................................................16 5.2 Convert Two-Way Streets to a One-Way Pair...............................16

6.0 Improve Sight Distance at Signalized Intersections ..................................17 6.1 Clear Sight Triangles .....................................................................17 6.2 Redesign Intersection Approaches.................................................17 7.0 Improve Driver Awareness of Intersections and Signal Control ...............18 7.1 Improve Visibility of Intersections on Approaches .......................18 7.2 Improve Signing and Delineation ..................................................18 7.3 Install Larger Signs ........................................................................19 7.4 Provide Intersection Lighting ........................................................19 7.5 Install Rumble Strips on Approaches ............................................19 7.6 Install Queue Detection System.....................................................19 7.7 Improve Visibility of Signals and Signs at Intersection ................20 8.0 Improve Access Management Near Signalized Intersections....................20 8.1 Restrict Access to Properties Using Driveway Closures or Turn
Restrictions ................................................................................................21 8.2 Restrict Cross-Median Access Near Intersections.........................21 9.0 Improve Safety Through Other Infrastructure Treatments ........................22 9.1 Improve Drainage in Intersection and on Approaches ..................22 9.2 Provide Skid Resistance in Intersection and on Approaches.........22 9.3 Restrict or Eliminate Parking on Intersection Approaches............22 Strategies to Improve Safety and Operations at Unsignalized Intersections ......................................................................................................24 1.0 Improve Management of Access Near Unsignalized Intersections ...........24 1.1 Implement Driveway Closures/Relocations ..................................24 1.2 Implement Driveway Turn Restrictions.........................................24
2.0 Reduce the Frequency and Severity of Conflicts Through Geometric
Improvements ............................................................................................25 2.1 Provide Left-Turn Lanes at Intersections ......................................25 2.2 Provide Longer Left-Turn Lanes at Intersections..........................25 2.3 Provide Offset Left-Turn Lanes at Intersections ...........................25 2.4 Provide Passing Flares on Shoulders at T-Intersections ................26 2.5 Provide Right-Turn Lanes at Intersections ....................................26 2.6 Provide Longer Right-Turn Lanes at Intersections........................26 2.7 Provide Offset Right-Turn Lanes at Intersections .........................27 2.8 Provide Full-Width Paved Shoulders in Intersection Areas ..........27 2.9 Restrict or Eliminate Turning Maneuvers by Signing ...................27 2.10 Close or Relocate “High-Risk” Intersections ................................28 2.11 Convert One Four-Leg Intersection to Two T-Intersections .........28 2.12 Convert Offset T-Intersections to a Four-Leg Intersection............28

2.13 Realign Intersection Approaches to Reduce or Eliminate Intersection Skew...............................................................................................29
2.14 Use Indirect Left-Turn Treatments to Minimize Conflicts at Divided Highway Intersections ...................................................................29
3.0 Improve Pedestrian and Bicycle Facilities to Reduce Conflicts Between Motorists
and Non-Motorists .....................................................................................30 4.0 Improve Sight Distance..............................................................................30 4.1 Improve Intersection Sight Distance at Unsignalized Intersections ........................................................................................................30 4.2 Clear Sight Triangles in the Medians of Divided Highways Near
Intersections ...................................................................................31 4.3 Change Horizontal and/or Vertical Alignment of Approaches to Provide
More Sight Distance ......................................................................31 4.4 Eliminate Parking that Restricts Sight Distance ............................31
5.0 Improve Driver Awareness of Intersections as Viewed from the Intersection
Approach....................................................................................................32 5.1 Improve Visibility of Intersection by Providing Enhanced Signing and
Delineation.....................................................................................32 5.2 Improve Visibility of Intersection by Providing Lighting .............32 5.3 Install Larger Regulatory and Warning Signs at Intersections ......32 5.4 Call Attention to the Intersection by Installing Rumble Strips on
Intersection Approaches.................................................................33 5.5 Provide Supplementary Stop Signs Mounted Over the Roadway .33 5.6 Provide Pavement Markings with Supplementary Messages, Such as
STOP AHEAD...............................................................................34 5.7 Install Intersection Control Beacons at Stop-Controlled Intersections
........................................................................................................34
6.0 Choose Appropriate Intersection Traffic Control to Minimize Crash Frequency and Severity ...............................................................................................34
6.1 Avoid Signalizing Through Roads.................................................34 6.2 Provide All-Way Stop Control at Appropriate Intersections.........35 6.3 Provide Roundabouts at Appropriate Locations ............................35
7.0 Guide Motorists More Effectively Through Complex Intersections .........35 7.1 Provide Turn Path Markings..........................................................35 7.2 Provide Lane Assignment Signing or Marking at Complex Intersections ...................................................................................36

Strategies to Improve Safety and Operations at Signalized Intersections
The strategies for improving safety at signalized intersections are outlined below. Physical improvements include both geometric design modifications and changes to traffic control devices. 1.0 Reduce Frequency and Severity of Intersection Conflicts Through Traffic
Control and Operational Improvements Virtually all traffic signal timing and phasing schemes are established with the primary objective being the safe and efficient movement of traffic. Certain timing, phasing, and control strategies can produce safety benefits with only marginal adverse effects on delay or capacity. Low-cost improvements to signalized intersections that can be implemented in a short time period include revising the signal phasing and/or operational controls at the intersection to explicitly address safety concerns. Signalization improvements may include adding phases, lengthening clearance intervals, eliminating or restricting higher-risk movements, optimizing timing, and coordinating signals. Installing push buttons for pedestrians crossing the trunk line can increase the green time for trunk line traffic. A review of crash history at a specific signalized intersection can provide insight into the most appropriate strategy for improving safety at the intersection.
1.1 Employ Multiphase Signal Operation
This strategy includes using protected left-turn phases and split phases. A two-phase signal is the simplest method for operating a traffic signal, but multiple phases may be employed to improve intersection safety. Left turns are widely recognized as the highest-risk movements at signalized intersections. Protected left-turn phases (i.e., the provision for a specific phase for a turning movement) significantly improve the safety for left-turn maneuvers by removing conflicts with the opposing thru traffic. Split phases may be considered when the geometric design of the intersection or traffic flow warrants such operation. This provides individual phases for opposing approaches which could increase the overall delay experienced at an intersection. However, this strategy may improve intersection safety, as it allows conflicting movements to proceed through the intersection independently on separate phases.
1.1.a Use Protected Left Turns The safety problems that left-turning vehicles encounter arise from three sources of conflict: • Opposing through traffic, • Through traffic in the same direction, and • Crossing vehicular and pedestrian traffic.

These conflict types often produce left turn, angle, sideswipe same direction, and rear-end crashes. There are several treatments that could alleviate operational and safety impacts of—and on—left-turn traffic. Protected left-turn phases are warranted based on such factors as turning and opposing traffic volumes, delay, visibility, opposing vehicle speed, and safety experience of the intersections. There are various options available for controlling left turns with signals: permissive only, protected only, and permissive / protected. The use of “permissive / protected” phasing represents a compromise between fully protected phasing and permissive-only phasing. This operational strategy has several advantages, the most important being the reduction in delay for left-turning vehicles achieved by permitting left turns while the opposing through movement has a green indication. Other benefits include less green time needed for the protected left turn phase (and hence more time for other high priority movements) and the potential for improved arterial progression. The safety performance of permissive/protected left-turn phases is not as good as that of protected-only phases, due to the increased exposure of left-turning and opposing through vehicles to conflicts with each other during the permissive phase. Dual or triple left-turn lanes should only operate with protected turn phases at four legged intersections. The choice of lead versus lag phasing for protected left-turn phases depends on intersection capacity and the presence of, or desire for, coordinated system timing. Providing the left turn arrow before the conflicting through movement receives a green indication (“lead” left turn) minimizes the conflicts between left-turning and through vehicles. There can be operational advantages (increased capacity) of leading left turns if the turns are actuated and the left turn demands are unbalanced, With a “lag” left turn phase, however, left-turning vehicles may turn left during a permissive portion of the cycle, which may allow clearing all or part of the left-turn queue, resulting in a shorter left turn phase or eliminating the need for it during that specific cycle. In general, lagging left turn strategy will cut off platoon stragglers, making platoon movements along coordinated roadways more effective (reduced delays). In turn, the coordinated platoon movements provide gaps for safe ingress and egress to unsignalized side street and driveways along the coordinated corridor.

Target- This countermeasure is targeted at reducing the number of head on and left turn crashes associated with left-turn maneuvers involving left turning and opposing vehicles.
1.1.b Use Split Phases Certain geometric configurations and traffic volumes may require the use of split phasing at an intersection. Split phasing allows opposing movements on the same roadway to proceed through the intersection at different times and is a way to address several geometric situations that pose safety problems for vehicles on opposite approaches. These include the following: • Skewed intersections, • Intersections with a large deflection angle for the through movement, • Wide medians, • Intersections with lanes shared by left-turn and through movements (i.e., without separate left-turn lanes), • Intersections with significantly unbalanced opposing left-turn volumes Split phasing targets crashes that occur related to opposing movements proceeding on the same phase through an intersection. Crash types related to this situation include angle, head-on left turn, rear-end-left turn, and other rear-ends. Though studies have not conclusively proven that implementation of split phases reduces fatalities and severe injuries at signalized intersections, the elimination of conflicts can logically be expected to reduce crashes. The effectiveness in reducing crashes involving left-turning vehicles should be similar to that of adding a protected-only left turn phase. With no movements conflicting with vehicles on a given approach, head-on left turn, and rear-end-left turn crashes should be eliminated. A key to success is balancing the safety benefits of split phases with the operational disadvantages, such as increased lost time and intersection delay. Care should be taken to examine other potential strategies that could provide the same safety benefit, but with less operational cost. Such strategies might include restricting turning maneuvers, improving left-turn channelization or construction of headed up left-turn lanes. The use of split phasing will generally result in less efficient intersection operations, depending on the intersection characteristics. Increasing the number of phases usually requires a longer signal cycle and increases lost time, resulting in longer overall intersection delay. The delay on an approach could be increased to a point where queues will exceed available storage lengths. This should be a factor to consider in any change of

phasing and timing. Adverse effects on arterial progression may also result from implementation of this strategy. Target-This strategy targets crashes related to opposing and conflicting movements through an intersection. Crash types include sideswipes between opposing left turns, rear ends, left turn head ons, and angles.
1.2 Optimize Clearance Intervals
The clearance interval is the portion of a signal cycle between the end of a green phase and the beginning of the next green phase for a conflicting movement. Clearance times provide safe, orderly transitions in right of way assignment between conflicting streams of traffic. The clearance interval can include both yellow and all-red time between conflicting green phases. Clearance intervals are a function of operating speed, the width of the intersection area, lengths of vehicles, and driver operational parameters such as reaction time, braking, and decision-making time. MDOT has adopted ITE equation for determining the length of the change interval. Clearance intervals that are too short in duration can contribute to rear-end crashes related to drivers stopping abruptly and right-angle crashes resulting from signal violations. One study showed clearance intervals shorter than those calculated using the ITE equation have higher rear-end and right-angle crash rates than intersections with timings that exceed the ITE value. In the extreme, a too-short interval can result in drivers operating at the legal speed limit being forced to violate the red phase. A study by Retting et al. (2000) noted that signal clearance intervals that are considered too short are associated with vehicle conflicts and red-light running. Lengthening clearance intervals will often require a commensurate lengthening of the total cycle length, or decreasing the amount of green time. Clearance intervals represent time that is lost to movement of traffic. Lengthening the cycle reduces the percentage of time that is “lost” for clearance. Unfortunately, widespread use of longer clearance times and cycle lengths has led in many areas of the country to a growing problem of red-light violations. Drivers are with greater frequency learning that the clearance time is long and that if they stop for the signal the delay they incur will be long. MDOT has a policy for determining clearance interval durations. See the MDOT Traffic Signal Guidance for Vehicle Change Intervals. Target-The target of this strategy is crashes related to clearance interval lengths that are too short for a particular intersection. These crashes include angle crashes between vehicles continuing through the intersection after one phase has ended (possibly due to being in the dilemma zone as the clearance interval started) and the vehicles entering the intersection on the following phase. Rear-end crashes may also be a symptom of short clearance intervals. A vehicle

stopping at a signal may be rear ended by a vehicle following it when the following driver expected to be able to proceed through the intersection during a longer clearance interval.
1.3 Evaluation - Restrict or Eliminate Left or Right Turning Maneuvers
Left-turnsAt signalized intersections, left-turning vehicles should have sufficient sight distance to select gaps in oncoming traffic and complete left-turns. If this sight distance is not available, then left-turning maneuvers should be allowed under a protected phase only. This strategy will enhance safety at the intersection and reduce head-on crashes associated with left-turning vehicles. Right-turns Regarding right-turns-on-red (RTOR), Michigan law allows this movement from one-way or two-way streets onto a two-way street or into a one-way street carrying traffic in the direction of the right-turn except when a sign is in place prohibiting this turn on red. The overall impact of permitting RTOR is improved traffic flow at all signalized intersections during on and off peak hours. A listing of the benefits associated with RTOR is as follows:
• Reduction in fuel consumption • Reduction in motorist delay • Improve level of service by increasing capacity • Reduces unnecessary delay and frustration for motorists
There are conditions that require restricting this movement in response to safety. The guidelines that follow provide guidance to personnel in deciding when to restrict or prohibit RTOR at a specific signalized intersection. These guidelines take into consideration the safe movement of vehicular traffic, pedestrians, bicyclists, and other road users while providing for efficient movement of traffic. Each intersection approach should be evaluated on an individual basis. Engineering judgment is the basis for each potential RTOR prohibition. Prohibitions of RTOR, totally or in part, should be considered only when:
• Intersections have sight distance restrictions to the left that inhibit right turns from that approach.
• More than three RTOR crashes reported in a 12-month period for the particular approach.
• A signalized intersection with a railroad crossing (and pre-signal) in close proximity (less than 100 feet) shall have a NO TURN ON RED if one of the following conditions exists:
- Insufficient clear storage distance for a design vehicle between the signalized intersection and the railroad crossing.
- The highway-rail grade crossing does not have gates.

When a RTOR is prohibited, a NO TURN ON RED sign shall be located above or adjacent to the traffic signal or as close as possible, to the point where the turn is made, or at both locations, so that one or more of the signs are visible to a driver intending to turn, at the point where the turn is made, as per the “Michigan Vehicle Code.” An additional NO TURN ON RED sign may be used at the far side of the intersection in the direct vision of the turning driver.
August 11, 2008 Target- Prohibition of right turn on red can help reduce crashes related to limited sight distance and those between pedestrians and right turning traffic. It can help reduce the frequency of crashes between vehicles turning right on red and vehicles approaching from the left on the cross street or turning left from the opposing direction.
1.4 Coordinate Signals
Signal coordination has long been recognized as having beneficial effects on the quality of traffic flow along a street or arterial. Good signal coordination can also generate measurable safety benefits, primarily in two ways. 1. Coordinated signals produce platoons of vehicles that can proceed without stopping at multiple signalized intersections. Reducing the number and frequency of required stops and maintaining constant speeds for all vehicles reduce rear-end and angle conflicts. 2. Signal coordination can improve the operation of turning movements. Drivers may have difficulty making permitted turning maneuvers at signalized intersections (e.g., permitted left turns, RTOR after stop) because of a lack of gaps in opposing traffic of sufficient length to safely make the turns. Crashes may occur when drivers become impatient and accept a gap that is smaller than needed to complete a safe maneuver. Such crashes could be reduced if longer gaps were made available. Increased platooning can create more gaps of increased length for permitted vehicle movements at intersections and result in improved intersection operation. Also, platooning will contribute to consistent vehicle speeds along a corridor, which will help decrease rear-end type crashes. Target-The target of this strategy is crashes involving major-street left-turning and minor-street right-turning vehicles where safe gaps in opposing traffic are not available. Rear-end crashes associated with speed changes can also be reduced by retiming signals to promote platooning. 1.5 Improve Operation of Pedestrian and Bicycle Facilities at
Signalized Intersections
Nearly one-third of all pedestrian-related crashes occur at or within 50 feet of an intersection. Of these, 30 percent involve a turning vehicle, whereas another 22 percent involve a pedestrian either running across the intersection or darting in front of a vehicle whose view was blocked just prior to the impact. Another 16
6

percent of these intersection related crashes occur because of driver violation (e.g., failure to yield the ROW). Traffic control improvements that can be made to an intersection to increase pedestrian safety include the following: • Pedestrian signs, signals, and markings, • Crossing guards for school children, • Prohibition of right turn on red • Public information or signs that educate pedestrians regarding use of push buttons Providing pedestrian push buttons may facilitate safe pedestrian roadway crossings at signalized intersections (vs. midblock crossings), where pedestrian conflicts with motor vehicles can be managed through use of pedestrian crossing signals and/or exclusive pedestrian-only phases during the signal operation. The AASHTO Guide for the Development of Bicycle Facilities should be consulted for information on bicycle safety.
1.6 Remove Unwarranted Signals
Traffic signals can remedy many safety and operational problems at intersections. However, signals often can adversely affect intersections. It is possible that a signal may no longer be warranted due to changes in traffic conditions. Problems created by an unwarranted signal, such as excessive delay, increased rerouting of traffic to less-appropriate roads and intersections, higher crash rates, and disregard of the traffic signal can be addressed by removing the signal if doing so would not create worse problems. Signalized intersections generally experience crashes of different types than unsignalized intersections but not necessarily a lower total crash rate. Converting the intersection to unsignalized may not improve the total crash rate. Studies should be performed when considering removing a signal, just as installation of a signal is studied. This study should identify the appropriate replacement traffic control devices and any sight distance restrictions that may not have been an issue while under signalized control. Target- Removing unwarranted signals is targeted at intersections where traffic volumes and safety record do not warrant a traffic signal. Signalized intersections tend to have higher rear-end crash rates than non-signalized intersections and conversion to two-way or all-way stop control may reduce the number of rear-end crashes.
7

2.0 Reduce Frequency and Severity of Intersection Conflicts Through Geometric Improvements
Geometric improvements can provide both operational and safety benefits at signalized intersections. Improvements to turning movements, through channelization or even physically preventing turns can result in reductions in certain types of crashes. Geometric changes can also improve safety for pedestrians and bicyclists. Higher-cost, longer-term improvements, such as redesign of the intersection, can also improve safety and are briefly discussed in this section.
2.1 Provide or Improve Left-Turn Channelization
This strategy includes the following: • Providing headed up left-turn lanes, • Lengthening left-turn lanes, • Providing positive offset for left-turn lanes, • Providing positive guidance with channelization, and • Delineating turn path. Many intersection safety problems can be traced to difficulties in accommodating left-turning vehicles. A key strategy for minimizing collisions related to left-turning vehicles (head-on left turn, rear end left turn, angle, other rear end, and head on crash types) is to provide exclusive left-turn lanes, particularly on high-volume and high speed major-road approaches. Left-turn lanes allow separation of left-turn and through-traffic streams, thus reducing the potential for rear-end collisions. Because they provide a sheltered location for drivers to wait for a gap in opposing traffic, left-turn lanes may encourage drivers to be more selective in choosing a gap to complete the left-turn maneuver. This may reduce the potential for collisions between left-turn and opposing through vehicles. Provision of a left-turn lane also provides additional flexibility in designing a phasing plan.
2.1.a Install Left-Turn Lanes
Left-turn lanes are a proven treatment for addressing safety problems associated with left-turning vehicles. By removing left-turning vehicles from the through traffic stream, conflicts with through vehicles traveling in the same direction can be reduced and even eliminated, depending on the signal timing and phasing scheme. Drivers wait in the turn lane until there is a gap in opposing traffic through which they can turn, which helps reduce the conflicts with the opposing through traffic. (See Traffic and Safety Note 605a (7.6) for warranting guidelines)
2.1.b Improve Left-Turn Lane Geometry
Safety improvements can also be made to approaches that already incorporate separate left-turn lanes. Three treatments are discussed below:
8
lengthening of the left-turn lane, redesigning to provide positive visual offset, and delineating the turning path.
2.1.c Lengthen Left-Turn Lane
The length of a left-turn lane consists of three components: entering taper, deceleration length, and storage length. The left-turn lane length should allow for the removal of slow or decelerating vehicles from through traffic, thus reducing the potential for rear-end collisions. A turn lane long enough to accommodate deceleration can have safety benefits for higher-speed intersections such as are typically found on rural highways. The turn lane should be of adequate length to store vehicles waiting to turn left without the queue overflowing into the adjacent through lane. If a left-turn queue extends into the adjacent through lane, through vehicles will be forced to stop or, if there are multiple through lanes, change lanes. These maneuvers can lead to rear-end and sideswipe crashes. Design criteria for selecting an appropriate left-turn lane length are presented in the AASHTO Policy on Geometric Design for Highways and Streets (American Association of State Highway and Transportation Officials). Geometric Design Guide VII-650 Series has recommended taper and storage lengths.
2.1.d Provide Positive Offset for Left-Turn Lanes
A potential for conflict exists when vehicles in opposing turn lanes on the major road block the drivers’ views of approaching traffic. A left turning driver’s view of opposing through traffic may be blocked by left-turning vehicles on the opposite approach. When left-turning traffic has a permissive green signal phase, this can lead to collisions between vehicles turning left and the through vehicles on the opposing road approach. To reduce the potential for crashes of this type, the left-turn lanes can be offset by moving them laterally, so that vehicles in opposing left turn lanes no longer obstruct the view of the opposing through traffic. This helps improve safety and operations of the left-turn movement by improving driver acceptance of gaps in opposing through traffic. This is especially true for older drivers who have difficulty judging gaps between oncoming vehicles. Note that the effectiveness of this strategy is greatest where signal operations include permissive signal phasing or permissive/protected phasing for left-turning movements. AASHTO’s Policy recommends that medians wider than 18 feet should have offset left-turn lanes. One method for laterally shifting left-turning vehicles is to narrow the turn lane width using pavement markings. This is accomplished by painting a wider stripe at the right side of the left-turn lane, which causes left-turning vehicles to position themselves closer to the median. The width of these lines ranged
9

from 0.5 feet to 3 feet. The wider the left turn lane line used to offset vehicles, the greater the effect on improving sight distance.
2.1.e Delineate Turn Path
Even at signalized intersections, where the traffic signals help to eliminate confusion about ROW, driver confusion can exist in regard to choosing the proper turn path. This is especially relevant at intersections where multiple left-turn lanes are provided, the overall pavement area of the intersection is large, or other unfamiliar elements are presented to the driver. Delineation of turn paths is especially useful to drivers making simultaneous opposing left turns, as well as some cases involving drivers turning right for which a clear path is not readily apparent. This strategy is also appropriate for application where the roadway alignment may be confusing or unusual, such as a deviation in the path for through vehicles. Providing positive guidance to the driver in the form of pavement markings can help eliminate driver confusion and eliminate vehicle conflict by “channeling” vehicles in their proper path. Target- These strategies target intersections where crashes related to left-turn movements are an issue. Crash types that could be reduced include angle, sideswipe, rear-end, and head-on crashes. 2.1.f Four-Lane to Three-Lane Conversion See Guidelines for Four-Lane to Three-Lane Conversions by Michigan State University.
2.2 Provide or Improve Right-Turn Lanes
This strategy includes the following: • Providing right-turn lanes, • Lengthening right-turn lanes The provision of right-turn lanes can minimize collisions between vehicles turning right and following vehicles, particularly on high-volume and high-speed major roads. See Traffic and Safety Note 604 (7.5).
2.2.a Construct Right Turn Lanes A right-turn lane may be appropriate in situations where there are an unusually high number of rear-end collisions on a particular approach. Installation of a right-turn lane on one major road approach at a signalized intersection is expected to reduce total crashes.
It is possible that installation of a right-turn lane could create other safety or operational problems at the intersection. For example, vehicles in the
10
right-turn lane may block the cross street right-turning drivers’ view of through traffic; this would be a significant issue where RTOR are permitted on the cross street. If a right shoulder is re-striped to provide a turn lane, there may be an adverse effect on safety due to the decrease in distance to roadside objects. Delineation of the turn lane also should be carefully considered, so that adequate guidance is provided through the intersection. Right-turn roadways can reduce the safety of pedestrian crossings. Crossing distances are increased, as is pedestrian exposure to traffic. Elderly and mobility-impaired pedestrians may have difficulty crossing intersections with large corner radii.
2.2.b Lengthen Right-Turn Lanes
Lengthening a right-turn lane can help improve operations and safety by providing additional sheltered space for vehicles to decelerate or wait to turn. If the length of a right-turn lane is inadequate, vehicles waiting to turn may be doing so from the through-traffic stream, thus increasing the potential for rear-end collisions. Providing longer entering tapers and deceleration lengths can reduce the potential for rear-enders. Also, if access to a right-turn lane is blocked by a queue of through vehicles at a signal, the right-turners may block the movement of through traffic, if the two movements operate on separate or split phases. This could lead to unsafe lane changes and added delay. The length of a right-turn lane consists of three components: entering taper, deceleration length, and storage length. Design criteria for selecting an appropriate right-turn lane length are presented in both the AASHTO Policy on Geometric Design for Highways and Streets and the TRB Highway Capacity Manual, as well as in the MDOT Geometric Design Guide VII-650. Ensure proper pavement marking (such as right turn arrows) and signing (such as Right Lane Must Turn Right) so a lengthened right turn lane is not confused for another thru lane.
3.0 Improve Geometry of Pedestrian, Bicycle, and Transit Facilities The mix of travel modes at intersections, along with the vehicle-vehicle conflicts possible, can create safety and operational concerns for non-motorists. A variety of relatively low-cost treatments can be implemented to help pedestrians and bicyclists proceed through the intersection more safely and more efficiently. Multi-vehicle crashes (specifically rear-ends) can be reduced if pedestrians are more visible and more drivers expect to encounter them. Geometric or physical improvements that can be made to an intersection to increase pedestrian safety include the provision of the following: • Continuous sidewalks, • Signed and marked crosswalks, • ADA compliant sidewalk ramps,
11

• Sidewalk set-backs, • Median refuge areas, • Bulb-outs, • Pedestrian overpasses, • Intersection lighting, • Physical barriers to restrict pedestrian crossing maneuvers at higher-risk locations, • Relocation of transit stops from the near side to the far side of the intersection, and • Other traffic calming applications to reduce vehicle speeds or traffic volumes on intersection approaches. Improvements to pedestrian facilities are discussed in greater detail in Volume 10 of the NCHRP Report 500, “A Guide for Reducing Collisions Involving Pedestrians”. Some of the problems facing bicyclists at intersections include high traffic volumes and speeds as well as the lack of space for bikes. Possible improvement projects include the following: • Widening outside through lanes (or adding bike lanes), • Providing median refuge areas, • Providing independent crossing structures, • Upgrading storm drain grates with bicycle-safe designs, and • Implementing lighting. Also refer to the AASHTO Guide for Non-Motorized Facilities. The demand for bus service is largely a function of land-use patterns. The general location of bus stops is largely dictated by patronage and by the locations of intersection bus routes and transfer points. Bus stops at intersections may be located on the near (approach) or far (departure) side of the intersection. Far-side bus stops are advantageous at intersections where:
• Other buses may turn left or right from the arterial • Turning movements from the arterial by other vehicle types, particularly right
turns are heavy • Approach volumes are heavy, creating a large demand for vehicle storage on the
near-side approach Far-side bus stops are also effective at reducing collisions involving pedestrians. Sight distance conditions generally favor far-side bus stops, especially at signalized intersections. The interference between buses and other traffic can be considerably reduced by providing bus turnouts (stops clear of the through lanes). However, since bus operators may not use the turnout if they have difficulty maneuvering back into traffic, the bus turnout should be designed so that a bus can enter and leave easily. Refer to the AASHTO Policy on Geometric Design of Highways and Streets for more information regarding transit facilities.
12
4.0 Revise Geometry of Complex Intersections
This strategy includes a series of mostly higher-cost solutions: • Converting a four-leg intersection to two T intersections, • Converting two T intersections to one four-leg intersection, • Improving intersection skew angle, and • Improving deflection in the through-vehicle travel path. A fifth solution, closing an intersection leg, is one commonly tried when addressing the problem of complex intersections. This can be a low-cost solution because it does not typically require major reconstruction. Making one approach one-way away can also decrease conflicts. Some geometric problems with signalized intersections will not be remedied using signing, channelization, or signal phasing. Physical modifications to all or part of an intersection may be needed to reduce severe crash rates. There may be multiple problems associated with one or more movements at the intersection that can be best addressed with significant improvements to intersection design. 4.1 Convert One Four-Leg Intersection to Two T-Intersections
For some signalized four-leg intersections with very low through volumes on the cross street, the best method of improving safety may be to convert the intersection to two T intersections. This strategy should help reduce crashes related to the intersection layout, such as angle crashes involving left-turning vehicles in which drivers are not expecting to encounter one of the infrequent through-vehicles. This conversion to two T intersections can be accomplished by realigning the two cross-street approaches an appreciable distance along the major road, thus creating separate intersections that operate relatively independently of one another. The intersections should be separated enough to ensure the provision of adequate turn-lane channelization on the major road to prevent left turns interlocking. If through volumes are high, the intersection may be safer if left as a conventional four-leg intersection. Converting it to two T intersections would only create excessive turning movements at each of the T intersections. In a study conducted by Hanna et al., (1976) offset intersections had accident rates that were approximately 43 percent of the crash rate at comparable four-leg intersections. Thus, it is expected that this strategy would reduce the crash experience of targeted four-leg intersections. (See Geometric Design Guide GEO-640 Series)
13
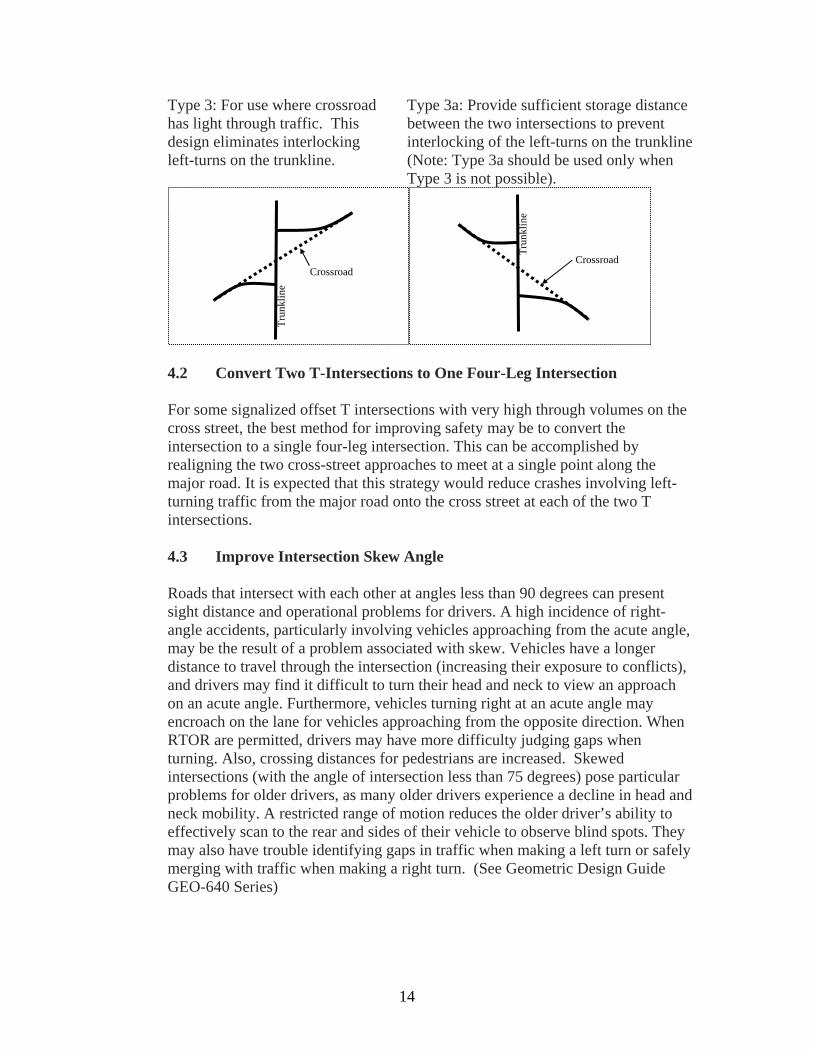
Type 3: For use where crossroad Type 3a: Provide sufficient storage distance has light through traffic. This between the two intersections to prevent design eliminates interlocking interlocking of the left-turns on the trunkline left-turns on the trunkline. (Note: Type 3a should be used only when Type 3 is not possible).
Trun
klin
e
Crossroad
Trun
klin
e
Crossroad
4.2 Convert Two T-Intersections to One Four-Leg Intersection
For some signalized offset T intersections with very high through volumes on the cross street, the best method for improving safety may be to convert the intersection to a single four-leg intersection. This can be accomplished by realigning the two cross-street approaches to meet at a single point along the major road. It is expected that this strategy would reduce crashes involving left-turning traffic from the major road onto the cross street at each of the two T intersections. 4.3 Improve Intersection Skew Angle
Roads that intersect with each other at angles less than 90 degrees can present sight distance and operational problems for drivers. A high incidence of right-angle accidents, particularly involving vehicles approaching from the acute angle, may be the result of a problem associated with skew. Vehicles have a longer distance to travel through the intersection (increasing their exposure to conflicts), and drivers may find it difficult to turn their head and neck to view an approach on an acute angle. Furthermore, vehicles turning right at an acute angle may encroach on the lane for vehicles approaching from the opposite direction. When RTOR are permitted, drivers may have more difficulty judging gaps when turning. Also, crossing distances for pedestrians are increased. Skewed intersections (with the angle of intersection less than 75 degrees) pose particular problems for older drivers, as many older drivers experience a decline in head and neck mobility. A restricted range of motion reduces the older driver’s ability to effectively scan to the rear and sides of their vehicle to observe blind spots. They may also have trouble identifying gaps in traffic when making a left turn or safely merging with traffic when making a right turn. (See Geometric Design Guide GEO-640 Series)
14
4.4 Remove Deflection in Through-Vehicle Travel Path
Intersections with substantial deflections between approach alignments can produce operational and safety problems for through-vehicles as they navigate through an intersection. Forced path changes for through-vehicles violate driver expectations and may be difficult for unfamiliar drivers to navigate. Violation of driver expectancy can result in reduced speed of the vehicle through the intersection. Crashes influenced by a deflection in travel path are likely to include rear-end, sideswipe, and head-on. Acceptable deflection angles through intersections vary by individual agency, but are typically related to the design and/or posted speed on an intersection approach. Typical maximum deflection angles are 3 to 5 degrees. The use of curves is preferable to deflections. Pavement markings can be a low-cost solution to guide through vehicles through the intersection. Dashed lines similar to those used to delineate left-turn paths are appropriate for delineation of the through path. Redesign of an intersection approach is a relatively high-cost solution. Proper design of an intersection involves providing traffic lanes that are clearly visible to drivers at all times, clearly understandable for any desired direction of travel, free from the potential for conflicts to appear suddenly, and consistent in design with the portions of the highway approaching the intersection.
4.5 Close Intersection Leg
For some signalized intersections with crash histories, the best method for improving safety may be to close access to a leg of the intersection. This may be an unpopular approach to safety improvement that should generally be considered only when less restrictive measures have been tried and have failed. Closure of access to an intersection leg can be accomplished by closing and abandoning a minor approach using channelizing devices or by reconstructing the minor approach so that it dead-ends before reaching the intersection with the major street. An alternative to closing the entire intersection leg is to convert the leg to a one-way street that departs the intersection. Though it is a significant modification to an intersection, it can be a low-cost treatment. A major consideration in deciding to implement this strategy is the impact closure will have on traffic patterns and volumes at other locations. This treatment may be most applicable to those intersections with more than four legs. Target- Signalized intersections with high levels of crashes on a leg where other strategies have not been successful or are not considered appropriate. Any crash type could be targeted since reasons for closing at intersections leg can vary.
5.0 Construct Special Solutions
This strategy includes the following: • Providing indirect left turn, • Reconstructing intersections, converting intersections to roundabouts,
15

• Convert two-way streets to a one-way pair, and • Constructing interchanges. Signalized intersections may have such a significant crash problem that the only alternative is to change the nature of the intersection itself. These types of projects will be higher cost and require substantial time for implementation.
5.1 Provide Indirect Left Turns
As traffic growth on arterial roadways continues to result in congestion and safety problems at major (high-volume) at-grade intersections, indirect left turn designs are increasingly being considered and constructed. A few indirect left-turn designs are relatively common to some areas, while many involve rather innovative solutions. Safety problems associated with left-turns at major signalized intersections are magnified at high-volume intersections—or, at least, intersections with high volumes of left turns. Indirect left-turn treatments, such as jughandles before the crossroad, directional median crossovers, and loop roadways beyond the crossroad, can address both safety and operational problems related to left turns by eliminating them at the crossroad intersections. These treatments also remove the left turning vehicles from the traffic stream without causing them to stop in a through-traffic lane, thereby reducing the potential for rear-end crashes with through vehicles. This strategy should also reduce right-angle collisions resulting from the conflict between vehicles turning left and oncoming through-vehicles.
5.2 Convert Two-Way Streets to a One-Way Pair
When two-way streets are converted to one-way streets, it is generally for the purpose of increasing capacity, but the removal of opposing traffic flows can improve safety as well. Removal of one direction of traffic from a two-way street allows for better signal synchronization and progression of platoons. Smooth progression and reduced congestion can reduce rear-end crashes. In addition, the removal of one direction of traffic can reduce congestion and improve safety by: • Reducing the number of vehicle/vehicle conflict points at intersections, • Allowing for unopposed turn maneuvers, • Simplifying operations and signal phasing, • Allowing pedestrians to only have to deal with traffic from one direction, reducing conflicts with vehicles, and • Providing more gaps for vehicles and pedestrians at unsignalized crossings. The ITE Traffic Safety Toolbox (Institute of Transportation Engineers, 1999) reports that studies have shown a 10- to 50-percent reduction in total crashes after conversion of a two way street to one-way operation. At the same time, this
16

strategy increases capacity significantly; a one-way street pair can handle up to 50 percent more volume than two parallel two-way streets.
6.0 Improve Sight Distance at Signalized Intersections Adequate intersection sight distance contributes to the safety of the intersection. In general, sight distance is needed at signalized intersections for the first vehicle stopped at an approach to be able to see the first vehicles stopped at the other approaches, for drivers making permitted left turns, and for right-turning vehicles. Where RTOR are allowed, adequate sight distance should be available. It should also be available for signals that have flash schedules in off peak hours. Improvements in sight distance can lead to a reduction in crashes caused by drivers stopping suddenly (rear-end), drivers proceeding through the intersection when the signal has not assigned them the right-of-way (angle), and drivers turning through an inadequate gap in opposing traffic (angle).
6.1 Clear Sight Triangles
Sight distance improvements can often be achieved at relatively low cost by clearing sight triangles to restore sight distance obstructed by vegetation, roadside appurtenances, buildings, bus stops, parked cars, or other natural or man-made objects. Research has established a relationship between intersection safety and sight distance at unsignalized intersections. No such research quantifies the effectiveness of improving sight distance at signalized intersections. One may expect that crashes related to inadequate sight distance (specifically, angle and turning related) would be reduced if the sight distance problems are improved. However, as the signal assigns ROW for most vehicles crossing paths at right angles and because traffic volumes affected by the other situations cited above are low, the overall impact on crashes could be relatively small.
6.2 Redesign Intersection Approaches
Signalized intersections with sight-distance-related safety problems that cannot be addressed with less expensive methods (such as clearing sight triangles, adjusting signal phasing, or prohibiting turning movements) may require horizontal or vertical (or both) realignment of approaches. Realigning both of the minor-road approaches so that they intersect the major road at a different location, or a different angle, can help address horizontal sight distance issues. This is a high-cost, longer-term treatment for the intersection, but if completed according to applicable design policy, it should help alleviate crashes related to sight distance. The current AASHTO Policy on Geometric Design of Highways and Streets contains updated sight distance guidelines, and these guidelines should be considered when revising intersection approach geometry. Intersection relocation and closure, elimination of intersection skew, and offsetting of left turn lanes are
17

all strategies that involve improvements to approach alignment to improve sight distance.
7.0 Improve Driver Awareness of Intersections and Signal Control Driver awareness of both downstream intersections and traffic control devices is critical to intersection safety. The inability to perceive an intersection or its control or the back of a stopped queue in time to react as necessary can result in safety problems. Drivers caught unaware could be involved in serious crashes, especially at intersections with high speeds on the approaches. This objective details strategies aimed at improving driver awareness of signalized intersections and the traffic control in place.
7.1 Improve Visibility of Intersections on Approaches
This strategy includes the following: • Improving signing and delineation, • Installing larger signs, and signal heads • Providing intersection lighting, • Installing rumble strips on approaches, • Installing queue detection system, and • Supplemental flasher on advance warning signs. Some crashes at signalized intersections may occur because drivers are unaware of the presence of an intersection or are unable to see the traffic signals in time to comply. These crashes are generally rear-end or angle collisions. The ability of approaching drivers to perceive signalized intersections immediately downstream can be enhanced by signing, delineation, and active warning devices. Other strategies to improve the visibility of an intersection include providing lighting, improving the visibility of the signals, and using devices to call attention to the signals. The FHWA report Synthesis of Human Factors Research on Older Drivers and Highway Safety: Volume 2 (Staplin et al., 1997) reviews research on older drivers’ visual abilities related to driving. Research shows that recognition and legibility distances as well as response speeds are lower for older drivers than for younger ones. The Synthesis summarizes recent research by stating that if recognition of an intersection is based on signs being legible to drivers, older drivers will take longer to recognize intersections. Therefore, consideration should be given to providing traffic control devices that contribute to improved legibility and response times for older drivers. This may include redundant signing, overhead signing, and advanced route signing. The older drivers guide should be consulted for more information.
7.2 Improve Signing and Delineation
Installing or upgrading signs and pavement markings on intersection approaches can help better prepare drivers for the intersection ahead. This may include advance guide signs, advance street name signs, warning signs, pavement
18

markings, overhead street signing, and post-mounted delineators. Advance warning signs, such as the standard intersection warning sign or the standard sign with flashers, can also alert drivers to the presence of an intersection. Installing advance warning signs on both sides of the roadway to provide redundancy in signing may be appropriate in some situations, such as when the intersection approach is on a curve. Street name and lane assignment signs in advance of the intersection prepare drivers for choosing and moving into the lane they will need to use for their desired maneuver.
7.3 Install Larger Signs
The visibility of intersections with existing regulatory and warning signs and the ability of drivers to perceive the signs can be enhanced by installing larger signs with larger letters. Such improvements may include advance guide signs, warning signs, pavement markings, and post-mounted delineators.
7.4 Provide Intersection Lighting
Providing lighting at the intersection itself or at both the intersection and on its approaches can make drivers aware of the presence of the intersection and reduce nighttime crashes. Crash data should be studied to ensure that safety at the intersection could be improved by providing lighting (this strategy would be supported by a significant number of crashes that occur at night). The costs involved with intersection lighting are the responsibility of the local jurisdiction.
7.5 Install Rumble Strips on Approaches
Rumble strips can be installed on the roadway on intersection approaches transverse to the direction of travel to call attention to the presence of the intersection and the traffic control used. Rumble strips are particularly appropriate on intersections where a pattern of crashes related to lack of driver recognition of the presence of the signal is evident, often on high-speed approaches. This strategy should be used sparingly, as the effectiveness of rumble strips is dependent on their being unusual. Rumble strips are normally applied when less intrusive measures, such as “signal ahead” signs or flashers, have been tried and have failed to correct the crash pattern, and they are typically used in combination with the advance warning signs. Care must be taken to avoid use of rumble strips where the noise generated will be disturbing to adjacent properties. See Traffic and Safety Note 609B (7.11).
7.6 Install Queue Detection System
Queue detection systems are standard tools for operation of traffic signals. In normal practice, queue detection is used for actuated signal systems to “call-up” a phase given the presence of a vehicle in a specific lane or movement. The application of queue detection systems as safety devices is a new and potentially
19
effective device. One such system has been implemented in Oregon on an approach to a signalized intersection in a rural setting that regularly experiences significant queues, especially during the summer when seasonal traffic increases. Two loop detectors in each lane on the intersection approach detect when a vehicle is stopped at that location. The detectors are connected to an overhead sign with beacons located a half mile upstream. The sign contains the message “Prepare to stop when lights flash.” When a vehicle is continuously present at a detector, beacons on the overhead sign flash to warn drivers of the stopped vehicle ahead. A preliminary evaluation indicates a reduction in crashes after installation of this system, but additional data are needed to determine if other factors contributed to this decrease.
7.7 Improve Visibility of Signals and Signs at Intersections
Lack of visibility of traffic control devices may contribute to crash experience at signalized intersections. Visibility of traffic signals and signs at intersections may be obstructed by physical objects (such as signs or other vehicles) or may be obscured by weather conditions, such as fog or bright sunlight. Also, drivers’ attention may be focused on other objects at the intersection, such as extraneous signs. Poor visibility of signs and signals may result in vehicles not being able to stop in time for a signal change or otherwise violating the intended message of a regulatory or directional sign. Providing adequate visibility of signs and signals also aids in drivers’ advance perception of the upcoming intersection. The FHWA Older Driver Highway Design Handbook should be consulted to ensure that improvements to visibility of traffic control devices will be adequate for older drivers. Methods for improving visibility of traffic signals and signs include the following: • Install additional signal head, • Provide visors to shade signal lenses from sunlight, • Provide louvers, visors, or special lenses so drivers are able to view signals only for their approach, • Remove trees and street hardware that restrict visibility to signals, • Install larger (12-in.) signal lenses, • Remove or relocate unnecessary signs, and • Provide far-side left-turn signal. Target- These strategies are targeted at crashes that occur because drivers are unable to see traffic signals and signs sufficiently in advance to safely negotiate the approaching intersection. Crash types would include angle and rear-end crashes.
8.0 Improve Access Management Near Signalized Intersections Effective access management is a key to improving safety at, and adjacent to, intersections. The number of access points, coupled with the speed differential between vehicles traveling along the roadway and vehicles using driveways, contributes to rear-
20

end crashes. The AASHTO Policy on Geometric Design states that driveways should not be located within the functional area of an intersection. The ITE Traffic Engineering Handbook suggests that the functional area include storage lengths for turning movements and space to maneuver into turn lanes, and consideration should be given to locating driveways, so as to provide enough space to store queues ahead of or behind driveways. Closing or relocating driveways will reduce turning movements near intersections. Prohibiting turn movements is another strategy to address access management at intersections.
8.1 Restrict Access to Properties Using Driveway Closures or Turn Restrictions
Restricting access to commercial properties near intersections by closing driveways on major streets, moving them to cross streets, or restricting turns into and out of driveways will help reduce conflicts between through and turning traffic. Such conflicts can lead to rear-end and angle crashes related to vehicles turning into and out of driveways and speed changes near the intersection and the driveway(s). Locations of driveways on both the cross street and major street should be determined based on the probability that a queue at the signal will block the driveway. Directing vehicles to exits on signalized cross streets will help eliminate or restrict the access to the main roadway. Restricting turns to rights-in and rights-out only will address conflicts involving vehicles turning left from the road and left from the driveway.
8.2 Restrict Cross-Median Access near Intersections
When a median opening on a high-volume street is near a signalized intersection, it may be appropriate to restrict cross-median access for adjacent driveways. For example, left and U-turns can be prohibited from the through traffic stream, and left turns from adjacent driveways can be eliminated. Restrictions can be implemented by signing, by redesign of driveway channelization, or by closing the median access point via raised channelization, and constructing U-turn directional crossovers per MDOT spacing requirements. Target- The target of this strategy is crashes involving drivers making turns across medians on approaches to signalized intersections. Angle crashes between vehicles turning through the median and opposing vehicles, as well as rear-end crashes involving vehicles waiting to turn and following vehicles, are crashes related to the cross median movement. Sideswipe crashes may occur when a following vehicle on the major road attempts to pass a vehicle waiting to turn left through the median. Restricting cross-median access is expected to eliminate conflicts related to vehicles using the median opening, as well as related rear-end and angle crashes.
21
9.0 Improve Safety Through Other Infrastructure Treatments Safety problems at signalized intersections may not be specifically related to traffic control, geometry, enforcement, or driver awareness of the intersection. This section provides information on strategies for special intersection conditions that were not covered in the objectives above.
9.1 Improve Drainage in Intersection and on Approaches
One of the most important principles of good highway design is drainage. Drainage problems on approaches to and within intersections can contribute to crashes just as they can on roadway sections between intersections. However, within an intersection, the potential for vehicles on cross streets being involved in crashes contributes to the likelihood for severe crashes, specifically angle crashes. It is necessary to intercept concentrated storm water at all intersection locations before it reaches the highway and to remove over-the-curb flow and surface water without interrupting traffic flow or causing a problem for vehicle occupants, pedestrians, or bicyclists. The target for this strategy is crashes at signalized intersections that are related to poor drainage. Such crashes involve vehicles that hydroplane and hence are not able to stop when required; these crash types include angle, rear end, and head on. Pedestrians and bicyclists would also be at risk. Improved drainage can help improve safety, increase traffic capacity, and increase the load capacity of the pavement. However, no adequate documentation of the effect on crash experience seems to be published. It can be expected that improved drainage would reduce crashes related to hydroplaning and wet crashes.
9.2 Provide Skid Resistance in Intersection and on Approaches
Slippery pavement should be addressed to reduce the potential for skidding. The coefficient of friction is most influenced by vehicle speed, vehicle tire condition, and road surface condition. Consideration should be given to improving the pavement condition to provide good skid resistance, especially during wet weather. This can be accomplished by: • Providing adequate drainage, • Grooving existing pavement, • Overlaying existing pavement, and • Grinding concrete pavement.
9.3 Restrict or Eliminate Parking on Intersection Approaches
Parking adjacent to turning and/or through lanes on intersection approaches may create a safety issue. It can cause a frictional effect on the through traffic stream, can often block the sight triangle of stopped vehicles, and may occasionally cause the blocking of traffic lanes as vehicles move into and out of parking spaces.
22

Restricting and/or eliminating parking on intersection approaches can improve visibility for the driver and limit additional collision opportunities. Parking restrictions can be implemented through signing, pavement markings, or restrictive channelization. Restrictions can be implemented for specific times of day or specific vehicle types. Enforcement of parking restrictions, accompanied by public information, including towing offending vehicles, is a necessary component to this strategy. This strategy targets crashes related to parking on intersection approaches. The parking, though currently permitted, may present a safety issue by restricting sight distance (and contributing to angle crashes) or due to parking maneuvers (contributing to rear-end and sideswipe crashes). On-street parking can decrease pedestrian safety if parked vehicles block drivers’ and pedestrians’ views of each other. Curb extension (bump out) can be constructed where pedestrians cross streets, and parking should not be permitted on approaches to crosswalks. Further information on this aspect of the problem is covered in the pedestrian crash guide (NCHRP Report 500: Guidance for Implementation for the ASHTO Strategic Highway Safety Plan, Volume 10: A Guide for Reducing Collisions Involving Pedestrians).
23

Strategies to Improve Safety and Operations at Unsignalized Intersections
The strategies for improving safety at unsignalized intersections are directed at the physical improvement of the intersections and their approaches. The improvements considered include geometric design modifications and changes to traffic control devices. 1.0 Improve Access Management Near Unsignalized Intersections Refer to MDOT’s The Access Management Guidelines.
1.1 Implement Driveway Closures/Relocations
Effective access management is key to improving safety at and adjacent to unsignalized intersections. A key element of access management is closure or relocation of driveways adjacent to intersections. Access points less than the recommended distances in Traffic and Safety Note 608 (7.9) upstream and downstream of an intersection are generally undesirable. Strategies for mitigating safety problems that may arise from a driveway located too close to an unsignalized intersection are to close the driveway (if other access to the property already exists) or to relocate the driveway (if no other appropriate access is available). It is desirable to relocate access points on the major-road approach to an intersection, to the minor-road approach (away from the intersection), or (where practical) to another street or frontage road. Where there is access from the minor road, from a side street, or from a frontage road, relocating the driveway on the major road farther from the intersection may be considered. Target- Unsignalized intersections with high crash frequencies related to driveways adjacent to the intersection. Generally, driveways within 250 feet of the intersection are considered closer than optimum.
1.2 Implement Driveway Turn Restrictions
When a driveway on a high-volume street adjacent to an unsignalized intersection cannot be closed or relocated, it may be appropriate to restrict turning maneuvers at the driveway. For example, left turns at the driveway can be restricted and driveway movements limited to right turns in and right turns out. See Traffic and Safety Note 603A (7.3). In other cases, turning movements into a property may be permitted at a particular driveway, but turning movements out of the property may be diverted to a different driveway. Furthermore, driveway usage may be restricted at particularly critical times of the day. Such restrictions can be implemented by signing. Other methods of restricting turning movements can be accomplished by channelizing islands where the driveway enters the major street, by redesign of internal circulation patterns within a property, by provision of a median on the major street, or by a combination of these approaches. Restricting
24

turning movements through signage is only marginally effective, physical restrictions (such as channelizing islands) are preferred, when possible. Target- Driveways located near unsignalized intersections that experience high crash frequencies but cannot practically be closed or relocated.
2.0 Reduce the Frequency and Severity of Conflicts Through Geometric Improvements
2.1 Provide Left-Turn Lanes at Intersections
Left-turn lanes remove vehicles waiting to turn left from the through traffic lane, thus reducing the potential for rear-end collisions. Left turn lanes provided a sheltered location for drivers to wait for a gap in opposing traffic, encouraging drivers to be more selective picking a gap to complete their left turn maneuver. Design criteria for left-turn lanes are presented in the AASHTO Policy on Geometric Design for Highways and Streets, and Geometric Design Guide VII-650. Traffic volume guidelines for the installation of left turn lanes are found in Traffic and Safety Note 605 (7.6). Target- Reduce the frequency of crashes resulting from the conflict between (1) vehicles turning left and following vehicles and (2) vehicles turning left and opposing through vehicles.
2.2 Provide Longer Left-Turn Lanes at Intersections
The length of a left-turn lane is among its most important design elements. Left-turn lanes should be designed to accommodate vehicle deceleration and storage. In particular, the left turn lane length should allow for the removal of slow or decelerating vehicles from through traffic, thus reducing the potential for rear-end collisions. The length of a left-turn lane consists of three components: (1) entering taper, (2) deceleration length, and (3) storage length. Design criteria for selecting an appropriate left-turn lane length are presented in the AASHTO Policy on Geometric Design for Highways and Streets, and Geometric Design Guide VII-650. Target- This countermeasure is targeted to reduce the frequency of rear-end collisions between through traffic and left turning vehicles queued up in through lanes due to insufficient storage.
2.3 Provide Offset Left-Turn Lanes at Intersections
A potential problem in installing left-turn lanes at intersections is that vehicles in opposing turn lanes on the road may block drivers’ views of approaching traffic. This can lead to collisions between vehicles turning left from the major road and through vehicles on the opposing major-road approach. To reduce the potential
25
for crashes of this type, the left-turn lanes can be offset by moving them laterally so that vehicles in opposing lanes no longer obstruct the opposing driver. Two treatments for offsetting turn lanes are parallel and tapered offset left-turn lanes. These treatments are addressed in the AASHTO Policy on Geometric Design of Highways and Streets. While offset left-turn lanes have been used most extensively at signalized intersections, they are suitable for use at unsignalized intersections as well. Target- Off set left-turn lanes, with the inherent improvement in sight distance, helps reduce the frequency of collisions between vehicles turning left and opposing through vehicles particularly in the median of divided highways.
2.4 Provide Passing Flares on Shoulders at T-Intersections
At three-legged intersections on two-lane highways, passing flares can provide an effective substitute for a left-turn lane on the major road where provision of a left-turn lane is economically infeasible. Instead of providing a left-turn lane for drivers turning left from the major road, part of the shoulder may be marked as a passing flare to encourage through drivers to use this lane to pass vehicles waiting to turn left. This treatment involves substantially less cost than providing a conventional left-turn lane and, at low-volume intersections, it may be just as effective. See Geometric Design Guide VII-650. Traffic volume guidelines for the installation of by-pass lanes are found in Traffic and Safety Note 605 (7.6). Target- Intersections that have a pattern of rear-end collisions involving vehicles waiting to turn left from the highway.
2.5 Provide Right-Turn Lanes at Intersections
Many collisions at unsignalized intersections are related to right-turn maneuvers. A key strategy for minimizing such collisions is to provide exclusive right-turn lanes, particularly on high-volume and high-speed major-road approaches. Right-turn lanes remove slow vehicles that are decelerating to turn right from the through-traffic stream, thus reducing the potential for rear-end collisions. See Geometric Design Guide VII-650. Traffic volume guidelines are found in Traffic and Safety Note 604 (7.5). Target- Intersections that have a pattern of rear-end collisions involving vehicles turning right from the highway and following vehicles.
2.6 Provide Longer Right-Turn Lanes at Intersections
The provision of exclusive right-turn lanes minimizes collisions related to right-turn maneuvers, particularly on high-volume and high-speed major roads. However, if the length of a right-turn lane is inadequate, vehicles waiting to turn may be doing so from the through-traffic lane, thus increasing the potential for
26

rear-end collisions. If long enough, right-turn lanes provide sheltered locations for drivers decelerating or waiting to make a right turn maneuver. The length of a right-turn lane consists of three components: (1) entering taper, (2) deceleration length, and (3) storage length. Design criteria for selecting an appropriate right-turn lane length are presented in the AASHTO Policy on Geometric Design for Highways and Streets. Target- Intersections that have a pattern of rear-end collisions involving vehicles waiting to turn right from the highway and following vehicles.
2.7 Provide Offset Right-Turn Lanes at Intersections
A potential problem in installing right-turn lanes at intersections is that vehicles in the right turn lane on the major road may block the minor-road drivers’ views of traffic approaching on the major road. This can lead to collisions between vehicles turning left, turning right, or crossing from the minor road and through vehicles on the major road. To reduce the potential for crashes of this type, the right-turn lanes can be offset by moving them laterally so that vehicles in the right-turn lanes no longer obstruct the view of the minor-road driver. Target- Reduce the frequency of crashes between vehicles from the cross street and through vehicles by improving the intersection sight distance.
2.8 Provide Full-Width Paved Shoulders in Intersection Areas
Well-designed and properly maintained shoulders in intersection areas provide
• Space for the motorist to avoid potential crashes or reduce crash severity, • Improved lateral placement of vehicles and space for encroachment of
vehicles, • Space for pedestrian and bicycle use, and • Space to park disabled vehicles out of the traveled way.
Full-width shoulders can be used for temporary storage of snow that is plowed from the road during times of heavy snowfall, allowing the full width of the lanes to be available for moving traffic and minimizing the potential sight obstruction of plowed snow. Target- Unsignalized intersections, particularly on divided highways, with shoulders less 8 feet in width that experience a high number of run off the road crashes as a result of avoidance maneuvers, or a high number of rear-end crashes that may have been avoided had a full width shoulder been provided.
2.9 Restrict or Eliminate Turning Maneuvers by Signing
Safety at some unsignalized intersections can be enhanced by restricting turning maneuvers, particularly left turns, during certain periods of the day (such as peak
27

traffic periods) or by prohibiting particular turning movements altogether. Turn restrictions and prohibitions can be implemented by signing. Target- Unsignalized intersections with patterns of crashes related left turning movements when it is impractical to construct a passing flare or left turn lane.
2.10 Close or Relocate “High-Risk” Intersections
For some unsignalized intersections with high crash histories, the best method of improving safety may be to close or relocate the intersection. This is a radical approach to safety improvement that should generally be considered only when less restrictive measures have been tried and have failed. Intersection relocation can be accomplished by realigning the minor-road approaches so that they intersect the major road at a different location or a different angle. Intersection closure can be accomplished by closing and abandoning the intersecting minor streets or by converting those minor streets so that they dead-end before reaching their former intersection with the major street. Target- Intersections with high numbers of intersection related crashes that other countermeasures have been unsuccessful in correcting.
2.11 Convert One Four-Leg Intersection to Two T-Intersections
For some unsignalized four-legged intersections with very low through volumes on the cross street, the best method of improving safety may be to convert the intersection to two T-intersections. This conversion to two T-intersections can be accomplished by separating the two cross-street approaches an appreciable distance along the major road, thus creating two separate T-intersections that operate independently of one another. The intersections should be separated enough to ensure the provision of adequate turn-lane channelization on the major road to prevent left turns interlocking. See GEO-640 Series. Target- Unsignalized four-legged intersections with very low through volumes on the cross street, that have skewed geometry.
2.12 Convert Offset T-Intersections to One Four-Leg Intersection
For some unsignalized offset T-intersections with very high through volumes on the cross street, the best method of improving safety may be to convert the intersection to a single four-legged intersection. This conversion to a four-legged intersection can be accomplished by realigning the two cross-street approaches to meet at a single point along the major road, thus creating one four-legged intersection. See GEO-604 Series. Target- Unsignalized offset T- intersections with very high through volumes on the cross street.
28

2.13 Realign Intersection Approaches to Reduce or Eliminate Intersection Skew
When roadways intersect at skewed angles, the intersections may experience one or more of the following problems:
• Vehicles may have a longer distance to traverse while crossing or turning onto the intersecting roadway, resulting in an increased time of exposure to the cross-street traffic.
• Older drivers may find it more difficult to turn their head, neck, or upper body for an adequate line of sight down an acute-angle approach.
• The driver’s sight angle for convenient observation of opposing traffic and pedestrian crossings is decreased.
• Drivers may have more difficulty aligning their vehicles as they enter the cross street to make a right or left turn.
• Drivers making right turns around an acute-angle radius may encroach on lanes intended for oncoming traffic from the right.
• The larger intersection area may confuse drivers or cause them to deviate from the intended path.
• Through-roadway drivers making left turns across an obtuse angle may attempt to maintain a higher than normal turning speed and cut across the oncoming traffic lane on the intersecting street.
• The vehicle body may obstruct the line of sight of drivers with an acute-angle approach to their right.
Realignment of intersection approaches to reduce or eliminate intersection skew may be desirable to improve safety at a skewed intersection. See Geometric Design Guide GEO-640 Series. Target- Reduce the frequency of crashes resulting from insufficient intersection sight distance and awkward sight lines at a skewed intersection. 2.14 Use Indirect Left-Turn Treatments to Minimize Conflicts at
Divided Highway Intersections
Many intersection operational and safety problems at two-lane and divided-highway intersections can be traced to difficulties of accommodating left-turn demand. Such difficulties involve both demand volume and the frequency of demand along a corridor. Furthermore, vehicles that slow down or stop to turn left in a lane used primarily by through traffic increase the potential for rear-end collisions. One way to address the impacts of such left-turn movements is the use of indirect left-turn treatments. Indirect left-turn treatments include the use of jug-handle roadways before the crossroad, loop roadways beyond the crossroad, and directional median crossovers beyond the crossroad, see Geometric Design Guide VII-670. Indirect left turn treatments enable drivers to make left turns efficiently on divided highways, including highways with relatively narrow medians.
29

Target- Unsignalized intersections with operational and safety problems that can be traced to difficulties of accommodating left-turn demand.
3.0 Improve Pedestrian and Bicycle Facilities to Reduce Conflicts Between
Motorists and Non-Motorists Nearly one-third (32.2 percent) of all pedestrian-related crashes occur at or within 50 feet of an intersection. Of these, 30 percent involve a turning vehicle. Another 22 percent of pedestrian crashes involve a pedestrian either running across the intersection or darting out in front of a vehicle whose view was blocked just prior to the impact. Finally, 16 percent of these intersection-related crashes occur because of a driver violation (e.g., failure to yield right-of-way). Improvements to pedestrian facilities (short of grade separation) that may reduce conflicts between motorists and nonmotorists include
• Continuous sidewalks; • Signed and marked crosswalks; • Pedestrian signs, signals, and markings; • Sidewalk set-backs; and • Lighting.
Some of the problems that bicyclists face at intersections include high traffic volumes and speeds and lack of space for bicyclists. Possible improvement projects include:
• Widening the outside through lanes or adding bike lanes, • Providing median refuges at key minor-street crossings, • Providing independent bicycle/pedestrian structures where necessary, • Replacing drain grates with bicycle-safe models, and • Providing smooth paved shoulders.
Further details may be found in the implementation guide for addressing pedestrian crashes. FHWA maintains a site that provides detailed information on pedestrian crash countermeasures at intersections 4.0 Improve Sight Distance
4.1 Improve Intersection Sight Distance at Unsignalized Intersections Adequate sight distance for drivers at stop or yield controlled approaches to intersections has long been recognized as among the most important factors contributing to overall safety at unsignalized intersections. Estimates of the safety effectiveness of providing adequate intersection sight distance (ISD) where it does not currently exist suggest that up to a 20-percent reduction in related crashes can be expected. Sight distance improvements can often be achieved at relatively low cost by clearing sight triangles to restore sight distance obstructed by vegetation, roadside appurtenances, or other natural or artificial objects. See AASHTO Policy on Geometric Design of Highways and Streets and MDOT Sight Distance Guidelines.
30

Target- Unsignalized intersections that have restricted sight distance where improvements can be made by removing obstructions to reduce patterns of crashes related to a lack of adequate intersection sight distance.
4.2 Clear Sight Triangles in the Medians of Divided Highways
Near Intersections
Adequate sight distance for drivers at stopped approaches to intersections has long been recognized as among the most important factors contributing to overall safety at unsignalized intersections. A particular concern at divided highway intersections is sight obstructions located in the highway median. Such obstructions can restrict sight distance for drivers of vehicles passing through the median, including through vehicles on the crossroad and vehicles making left turns onto and off of the divided highway. Sight obstructions can include vegetation, roadside appurtenances, or other natural and artificial objects. Since sight obstructions located in the highway median are located in the highway right-of-way, MDOT has the authority to remove them. Target- Unsignalized intersections on divided highways that have restricted sight distance where improvements can be made by removing obstructions in the median, and where there is a pattern of crashes related to the lack of sight distance.
4.3 Change Horizontal and/or Vertical Alignment of Approaches to
Provide More Sight Distance
This strategy addresses costly geometric improvements that involve changing the horizontal or vertical alignment of the intersecting roadways. Such strategies should generally be considered only at intersections with a persistent crash pattern that cannot be ameliorated by less expensive methods. Target- Unsignalized intersections with restricted sight distance due to horizontal and vertical alignment, and with pattern of crashes related to the lack of sight distance where less expensive countermeasures have not reduced crashes.
4.4 Eliminate Parking that Restricts Sight Distance
Although geometrically an intersection might have adequate sight distance, parking within the sight triangle might restrict it and should, therefore, be taken into consideration. Estimates of the safety effectiveness of eliminating parking that restricts sight distance have not been yet developed. Target- Unsignalized intersections where parked cars restrict intersection sight distance and have a pattern of right angle or turning crashes.
31
5.0 Improve Driver Awareness of Intersections as Viewed From the Intersection Approach
5.1 Improve Visibility of Intersections by Providing Enhanced Signing
and Delineation
Many unsignalized intersections are not readily visible to approaching drivers, particularly drivers on major-road approaches that are not controlled by stop or yield signs. Thus, intersection crashes may occur because approaching drivers may be unaware of the presence of the intersection. The visibility of intersections and, thus, the ability of approaching drivers to perceive them can be enhanced by signing and delineation. Improvements may include advance guide signs, advance street name signs, warning signs, pavement markings, and post-mounted delineators. The FHWA Older Driver Highway Design Handbook (Staplin et al., 1998) encourages such improvements to contribute to a better driving environment for older drivers. In particular, the handbook addresses advance guide signs and letter height on guide signs as key issues for older drivers. Advance warning signs, such as the standard intersection warning sign, can also alert drivers to the presence of an intersection. Providing a break in pavement markings—including centerlines, lane lines, and edge lines—at intersections also helps to alert drivers to the presence of an intersection. Target- Intersections that are not clearly visible to approaching traffic, and have a pattern of rear-end, right-angle, or turning crashes related to driver not being unaware of the intersection.
5.2 Improve Visibility of the Intersection by Providing Lighting
Providing lighting at the intersection itself, or both at the intersection and on its approaches, can make drivers aware of the presence of the intersection and reduce nighttime crashes. Lighting is the responsibility of the local government agency. Target- Unsignalized intersections with a substantial pattern of night time crashes, such as rear-end, right angle, or turning collisions.
5.3 Install Larger Regulatory and Warning Signs at Intersections
The visibility of intersections and, thus, the ability of approaching drivers to perceive them can be enhanced by installing larger regulatory and warning signs at intersections. Such improvements may include advance guide signs, doubling up warning signs, pavement markings, post-mounted delineators, and adding reflective strips to the sign posts. The FHWA Older Driver Highway Design Handbook encourages such improvements to contribute to a better driving environment for older drivers.
32

Target- Unsignalized intersections with a substantial pattern of rear-end, right angle, or turning collisions related to drivers not being aware of an intersection.
5.4 Install Rumble Strips On Intersection Approaches
Rumble strips can be installed on intersection approaches to call attention to the presence of the intersection and to the traffic control in use at the intersection. Rumble strips are particularly appropriate on stop-controlled approaches to intersections where a pattern of crashes is present related to lack of driver recognition of the presence of the stop sign. Rumble strips should be used sparingly. Their effectiveness is dependent on being unusual. Rumble strips are normally applied when less intrusive measures—such as pavement markings, “STOP AHEAD” signs, or flashers—have been tried and have failed to correct the crash pattern. Rumble strips can be used to supplement such traffic control devices. For example, a rumble strip can be located so that when the driver crosses the rumble strip, a key traffic control device such as a “STOP AHEAD” sign is directly in view. Rumble strips in the traveled way can also be used on a temporary basis to call attention to changes in traffic control devices, such as installation of a stop sign where none was present before. See Traffic and Safety Note 609 (7.11). Target- Locations should be identified by patterns of crashes related to lack of driver recognition of traffic control devices at an intersection (e.g. right-angle crashes related to stop sign violations).
5.5 Provide Supplementary Stop Signs Mounted Over the
Roadway
Many stop signs at stop-controlled intersections are not readily visible to approaching drivers due to geometric conditions, presence of vegetation, or other objects (such as tall vehicles) that can limit the view of the regular stop signs. Thus, intersection crashes may occur because approaching drivers may be unaware of the presence of the stop sign at the intersection. The visibility of stop signs and, thus, the ability of approaching drivers to perceive them can be enhanced by providing supplementary stop signs suspended over the roadway. Target- Unsignalized intersections with stop signs that are not clearly visible to approaching motorists. The strategy is particularly appropriate for intersections with patterns of rear-end, right-angle, or turning collisions related to lack of driver awareness of the presence of the intersection or stop sign.
33

5.6 Provide Pavement Markings with Supplementary Messages, Such as STOP AHEAD
Providing pavement markings with supplementary messages (such as STOP AHEAD) can help alert drivers and thus enhance the ability of approaching drivers to be more aware of the presence of the intersection. These marking should follow MMUTCD guidelines. Target- This strategy is particularly appropriate for intersections with patterns of rear-end, right-angle, or turning collisions related to lack of driver awareness of the presence of the intersection or stop sign.
5.7 Install Intersection Control Beacons at Stop-Controlled Intersections
Overhead flashing beacons can be used at stop-controlled intersections to supplement and call driver attention to stop signs. Flashing beacons are intended to reinforce driver awareness of the stop sign and to help mitigate patterns of right-angle crashes related to stop sign violations. At two-way stop-controlled intersections, flashing beacons are used with red flashers facing the stop-controlled approaches and yellow flashers facing the unstopped approaches. At all-way stop-controlled intersections, red flashers face all approaches. Use of overhead flashing beacons can increase the visibility of intersections for approaching drivers, thus supplementing the signing and delineation improvements discussed previously. Intersection control beacons can also be used on intersection approaches to supplement and call attention to stop signs or STOP AHEAD signs. See the MMUTCD for guidance. Target- This strategy is particularly appropriate for unsignalized intersections with patterns of right-angle crashes related to lack of driver awareness of the presence of the intersection or stop control.
6.0 Choose Appropriate Intersection Traffic Control to Minimize Crash
Frequency and Severity
6.1 Avoid Signalizing Through Roads
Signalization of an intersection often leads to an increased frequency of crashes on major roadways. Signals associated with new developments introduce congestion and increase crashes on through roadways that previously operated relatively safely and smoothly. Thus, the key to crash reduction is to avoid installing signal control whenever possible. Alternatives to signal control include all-way stop control; roundabouts; turn prohibitions (e.g., limiting movements to right-turn in and right-turn out); indirect left-turn movements (e.g., jug handles, loops, and median crossovers); and provision of flyovers and other grade separations.
34

Target- Medium to high volume intersections where signalization is being considered.
6.2 Provide All-Way Stop Control at Appropriate Intersections
All-way stop control can reduce right-angle and turning collisions at unsignalized intersections by providing more orderly movement at an intersection, reducing through and turning speeds, and minimizing the safety effect of any sight distance restrictions that may be present. However, all-way stop control is suitable only at intersections with moderate and relatively balanced volume levels on the intersection approaches. Under other conditions, the use of all-way stop control may create unnecessary delays and aggressive driver behavior. See MMUTCD for warrants Target- Unsignalized intersections with patterns of right-angle and turning collisions and moderate and relatively balanced traffic volumes on the intersection.
6.3 Provide Roundabouts at Appropriate Locations
Roundabouts provide an important alternative to signalized and all-way stop-controlled intersections. Modern roundabouts differ from traditional traffic circles in that they operate in such a manner that traffic entering the roundabout must yield the right-of-way to traffic already in it. Roundabouts can serve moderate traffic volumes with less delay than signalized or all-way stop-controlled intersections because traffic can normally traverse the roundabout without stopping. Target-See roundabout section.
7.0 Guide Motorists More Effectively Through Complex Intersections
7.1 Provide Turn Path Markings
At most intersections, pavement markings are provided on the intersection approaches, but the pavement markings end near the stop line. Rarely are pavement markings extended into or continued through intersections. At complex intersections, however, it may be beneficial to provide motorists with additional information to help with vehicle positioning through the intersections. In particular, it may be desirable to extend pavement markings through intersections that have offset approaches, are skewed, have multiple turn lanes, or are located at unsignalized ramp terminals. This approach is especially useful for delineating vehicle turning paths through an intersection. The MMUTCD and MDOT Pavement Marking Special Details/Standard Plans provide guidance on extending pavement markings through intersections.
35

Target- Intersections where stop sign violations and patterns of crashes related to stop sign violations have been observed. Crash types include right-angle and turning collisions.
7.2 Provide Lane Assignment Signing or Marking at Complex
Intersections
Sometimes, as drivers approach a complex intersection, they have difficulty determining the appropriate lane from which to perform a certain maneuver. This can cause indecision among drivers and result in maneuvers being made from certain lanes that are unexpected. These maneuvers could potentially lead to crashes. Crash patterns that are characteristic of driver indecision related to lane assignment include rear-end and sideswipe crashes on intersection approaches and potentially angle crashes when a driver performs an unexpected maneuver from an inappropriate lane (e.g., a vehicle makes a left turn from a through lane). Providing lane assignment signs (or markings) to guide motorists through complex intersections can alleviate this confusion and lead to safer driving conditions. Pavement markings are often used to supplement lane assignment signs. Target- This strategy is to reduce crashes caused by driver indecision in lane assignment.
36

APPENDIX B
TABLE OF CONTENTS MDOT Roundabout Quick Guide 1.0 Introduction..................................................................................................1 2.0 Basic Terminology And Information...........................................................1 3.0 Planning .......................................................................................................2 3.1 Typical Locations and Applications ................................................2 3.2 Locations Needing Careful Review.................................................3 3.3 Data for Operational Review/Feasibility .........................................3 4.0 Safety ..........................................................................................................3 5.0 Design Information ......................................................................................4 6.0 Operational Analysis....................................................................................4 7.0 MDOT Intersection Comparison Matrix Tool.............................................6 8.0 Miscellaneous Topics...................................................................................6

MDOT Roundabout Quick Guide November 2007
1
1.0 Introduction This quick guide is a very brief summary that describes some basic roundabout terminology, identifies some of the situations where roundabouts could be used, outlines procedures for determining the feasibility of a roundabout, and summarizes how to perform operational analyses for roundabouts. Additional information and details regarding MDOT’s policy can be found in MDOT’s Roundabout Guidance Document. 2.0 Basic Terminology And Information The following terms are some of the most commonly used relative to roundabouts. A single-lane roundabout is a roundabout with one entering lane per approach. Two-lane roundabouts have at least one entry with two lanes separated by pavement markings and are more complex. Three-lane roundabouts have at least one entry with three lanes. A bypass lane or right turn bypass lane is typically used to accommodate heavy right turn movements to improve the capacity of a roundabout. The bypass lane is typically separated from an entrance by a curbed island and allows right-turning traffic to avoid entering the roundabout. The decision to use bypass lanes should take into account pedestrian and ROW constraints. In some cases, bypass lanes provide significant benefits, especially for rural interchanges. Entry Width is the width of an approach where it enters the roundabout. Flare Length is the distance over which the approach roadway widens to the entry width. Longer flare lengths give motorists more time to adjust and utilize all lanes. The Entry Radius is the radius of the outside curb at the entry. Inscribed Circle Diameter is also abbreviated as ICD. This is the outside diameter of the roundabout. The figure below also shows these common terms as they relate to an actual roundabout.

MDOT Roundabout Quick Guide November 2007
2
Some other common elements are:
• Signing and pavement markings – provides notification and guidance to drivers • Lighting – helps drivers identify intersection features such as splitter islands and curbs at decision
points • Landscaping – can help to direct drivers’ attention where you want them to look and enhance
aesthetics. Table 1 describes typical roundabout types and sizes based on traffic volumes. Table 1. Typical Roundabout Capacities and Inscribed Circle Diameters
Type of Roundabout Approximate Peak Hour Capacity (Combined entering volume for all approaches) Inscribed Circle Diameter
Compact Urban Up to 4,000 vehicles per hour 90’ – 130’ Single Lane Up to 2,000 vehicles per hour 120’ – 170’ Two Lane Up to 4,000 vehicles per hour 145’ – 200’ Three Lane Up to 7,000 vehicles per hour 210’ – 250’
3.0 Planning 3.1 Typical Locations and Applications Implementation of roundabouts can be beneficial to the traveling public in a wide variety of situations. The list which follows below identifies some of the most common locations and/or applications where installation of a roundabout may be advantageous.

MDOT Roundabout Quick Guide November 2007
3
• High-speed rural intersections (approach design speed >45 mph) • Intersections with high injury crash histories (80% reduction factor based on research) • Intersections with traffic operational problems • Closely spaced intersections • Intersections near structures (fewer approach lanes for roundabouts can reduce costs) • Freeway interchanges (vehicles exit roundabouts randomly spaced and need fewer lanes) • As part of an access management program (accommodate U-turns with closed medians) • Intersections with unusual geometry (roundabout geometry is relatively flexible) • Multi-leg intersections (i.e. five or more legs) 3.2 Locations Needing Careful Review As might be expected, there are also locations and applications where roundabouts may not be beneficial, and as with traffic signals, care should be exercised when considering a roundabout in these situations. • Intersections within a system of coordinated signals (multiple signals with good progression). • Intersections with steep grade running through the intersection (greater than 5%) • Intersections where stopping sight distance cannot be achieved • Intersections near railroad crossings (careful evaluation of queue lengths) • Closely spaced intersections (careful evaluation of queue lengths) 3.3 Data for Operational Review/Feasibility During the scoping phase of a project, data is required to adequately analyze the operations of a roundabout and its feasibility. Data that is typically needed in order to evaluate a roundabout would include the following:
• Existing AM and PM peak hour turning movement counts • MDOT approved design year (i.e., 20-year) AM and PM peak hour turning movement projections • Design vehicle to be accommodated • Base mapping (either aerial photograph, aerial mapping, or survey) • Right-of-way mapping • Crash data for the most recent three-year period available • Location of nearby intersections and signal timing information (if applicable) • Location of any major constraints near the intersection (i.e. expensive ROW, major utilities,
structures, railroad crossings, water bodies) • Existing and future planned bicycle and pedestrian facilities • Truck percentages
Data that is desirable to obtain, though not necessarily required in all situations, includes: • Existing pedestrian counts • Previously prepared construction plans or as-built plans showing the existing intersection(s) • Utility information
4.0 Safety U.S. studies have shown that relative to other intersection types, roundabouts typically reduce overall crashes by approximately 40 percent, reduce injury crashes by approximately 75 percent, and reduce serious injury and fatal crashes by about 90 percent (Insurance Institute for Highway Safety, 2000). Thus,

MDOT Roundabout Quick Guide November 2007
4
the potential for improved intersection safety in Michigan is substantial. The figure below shows the differences in the number and type of conflict points between a standard intersection and a roundabout. In addition to reducing the number of conflict points, a roundabout also eliminates the types of conflicts that typically result in the most serious crashes (i.e., left turn head-on crashes and angle crashes). 5.0 Design Information When developing roundabout geometry, following the guidance provided in this document and Section 4 of MDOT’s Roundabout Guidance Document is extremely important in order to ensure the safest possible geometric design. Section 4 of the supplement document provides information regarding geometric design (including information on sight distance, geometric layout, grades, cross slopes, etc.). Table 1 provides some general ranges of roundabout sizes. 6.0 Operational Analysis This section is a summary that outlines procedures for conducting a roundabout operational analysis. Sections 2 and 4 of MDOT’s Roundabout Guidance Document provide additional information regarding operational analysis for roundabouts. General Process The operational analysis should begin by using Rodel software to determine the required geometry and corresponding queues and delays for 20-year peak hour turning movement volumes. Rodel software should be used to analyze roundabout capacity and determine roundabout geometry in all cases. When conducting this analysis, geometric parameters should be adjusted through an iterative process to achieve the desired delays and Level of Service (LOS) in each peak hour. During this optimizing process, the designer needs to keep in mind site constraints and other roundabout design principles related to speed control so that the geometric parameters entered into Rodel are realistic. Once preferred geometry has been identified, lane balance and utilization should be tested on multilane roundabout models for both peak hours by manipulating the “capacity factor” function in Rodel.

MDOT Roundabout Quick Guide November 2007
5
Confidence Level Analysis Capacity analyses should initially be conducted at the 50 percent confidence level setting in Rodel. Once acceptable geometry has been identified, it should be tested at the 85 percent confidence level, and geometry should be adjusted if necessary (the 85 percent confidence level assumes below average capacity and builds in a reasonable safety buffer). When adjusting the geometry, each entrance should function at level of service D or better (level of service B or better is preferred when possible) at the 85 percent confidence level. Note that the 50 percent confidence level results should be used in reporting queues, delays, and level of service and for comparison to other intersection alternatives being considered. Flow Ratio Rodel does not use a peak hour factor when calculating queues and delays. Instead it uses the “flow ratio” parameter to represent the rise and fall of traffic during a peak hour. In most cases, the default flow ratio should be used. However, certain unique situations with very high or very low peak hour factors may warrant adjustment of the flow ratio to more accurately represent the peak within the peak hour. Accounting for Trucks and Pedestrians Designers need to exercise care when evaluating single lane roundabouts using Rodel when entries are going to be wide (i.e., 18 to 20 feet) to accommodate trucks. Rodel assumes these widths represent two narrow entry lanes instead of one wide lane. When only one entering and one circulating lane are actually present at these widths, this results in over prediction of capacity and under prediction of delays and queues. Therefore, single lane entries should be modeled in Rodel at 15 feet or less with 13 to 14 feet being more conservative yet. This capacity analysis procedure will be reasonably conservative and should be used even when actual entry geometry is designed wider to accommodate trucks. High volumes of pedestrians and trucks can reduce the capacity of roundabouts. Truck percentages should be represented by modifying Rodel inputs. In situations with relatively high pedestrian volumes, the effect on capacity can be assessed by using the pedestrian capacity reduction factors noted in Exhibits 4-7 and 4-8 of the FHWA roundabout guide. These factors can be entered into the capacity factor field of Rodel for each leg of the roundabout. Right Turn Bypass Lanes Bypass lanes are used mainly in situations were a large portion of turning movements are right turns. Typically, bypass lanes should only be used when other geometric layouts fail to provide acceptable traffic operations, and the decision to use bypass lanes should take into account pedestrian volumes/facilities and ROW constraints. Two types of bypass lanes may be used. The first is a free flow bypass lane which allows vehicles to bypass the roundabout and then merge into the exiting stream of traffic. The second type is a semi-bypass lane which requires approaching vehicles to yield to traffic leaving the adjacent exit. Geometric Delay Most software that is used to evaluate intersections controlled by traffic signals reports delays in the form of “control” delay. Control delay includes both stop delay (the time when a vehicle is actually stopped while waiting to enter an intersection) and “geometric” delay (the time that is lost as a vehicle decelerates while approaching an intersection, maneuvers through the intersection, and accelerates away before reaching its original speed). Rodel reports delays in the form of “stop” delay. Geometric delay for roundabouts can be estimated to allow comparison against control delay reported for intersections controlled by signals. The MDOT Roundabout Guidance Document provides more details regarding this process.
MDOT Roundabout Quick Guide November 2007
6
Reporting Results Results of the operational analysis can be reported and compared against other potential intersection improvement options. Typically, reported results (at the 50% confidence level) would include delay, level of service, and the estimated design life in years. 7.0 MDOT Intersection Comparison Matrix Tool MDOT’s evaluation matrix template was developed in order to aid in the decision making process Table 2). The matrix can be used as a tool to help a designer or manager weigh the advantages of different types of intersections. The more complete the information used in the matrix, the better the choice which can be made. This matrix can be used for safety, scoping, and Early Preliminary Engineering (EPE) studies. 8.0 Miscellaneous Topics More detailed information for the following topics may be found in MDOT’s Roundabout Guidance Document: • Signing • Pavement Markings • Maintenance of Traffic • Accommodation of Design Vehicle • Three-lane Roundabouts • Lighting • Landscaping • Public Involvement

MDOT Roundabout Quick Guide November 2007
7
Table 2. MDOT Intersection Comparison Matrix Tool (For Safety, Scoping, and EPE Studies)*
* Additional information regarding this matrix can be found on the next page. ** Roundabout delays from Rodel are stop delay, while delay for other intersections in HCS/Synchro are control delay. In order to evenly compare these numbers, geometric delay should be added to roundabout stop delay from Rodel to get control delay. See MDOT’s Roundabout Guidance Document for more information on calculating roundabout geometric delay. ***For more information regarding C/B methodology, see the last page of this document. The following criteria may also be helpful for comparing alternatives:
• Is funding available? • Are traffic counts/projections available (Existing, 10-year, or 20-year)? • Does the alternative create the potential for enhancements? • Are bike/pedestrian facilities present or planned? • Are bike accommodations required? • What is the percentage of heavy truck traffic? • Is the intersection designed for trucks? • Is the intersection located within a system of progressed traffic signals? • Is the intersection adjacent to bridge or railroad crossing? • Is the intersection adjacent to another intersection? • Pedestrian Count___________
****Note: If pedestrian counts meet or exceed traffic signal warrants for pedestrians as detailed in the current MMUTCD and a Roundabout is the preferred intersection, than this intersection must be approved by MDOT’s Engineering Operations Committee (EOC).
Road Improvement Alternatives/Options
Total Cost Estimate* Control Delay** Level of
Service Design Life Cost/Benefit Ratio*** Safety Benefits ROW Impacts
(acres) Environmental
Issues Potential Utility
Conflicts Construction
Impacts
Driveway Accommodation/
Good Access Management
Public Input/ Community
Support

MDOT Roundabout Quick Guide November 2007
8
MDOT INTERSECTION COMPARISON MATRIX
Below is a brief description of all of Matrix items.
• Road Improvement Alternatives/Options – Alternatives are the potential solutions being considered for each location. Options are variations within an alternative. (e.g., for Alternative 1 - Upgraded Signalized Intersection, there could be two options which are Alternative 1a - Upgraded Signalized Intersection with dual left turn lanes and Alternative 1b - Upgraded Signalized Intersection with single left turn lanes and different signal timing.)
• Cost Estimate – Total cost. Can consist of safety, CMAC, R&R, EDA, capacity, local, etc. • Delay – Average seconds of control delay per vehicle • LOS – Level of Service • Design Life – Typical 10 or 20 years • Cost Benefit Ratio (C/B) – Includes maintenance and safety and delay costs (see the following
page for calculations) • Safety Benefits – Text description of potential safety improvements • ROW Impacts – Text description and acreage of impacts • Environmental Issues – Text description of any potential environmental impacts (e.g. wetlands,
cultural resources, etc.) • Potential Utility Conflicts – Text description of potential utility conflicts (e.g. water/sewer lines,
utility poles, etc.) • Construction Impacts – Text description of construction on local roads, business, traffic etc. • Driveway/Access Management – Text description of how easy the project will fit relative to other
options • Public Input/Community Support – Input on each option
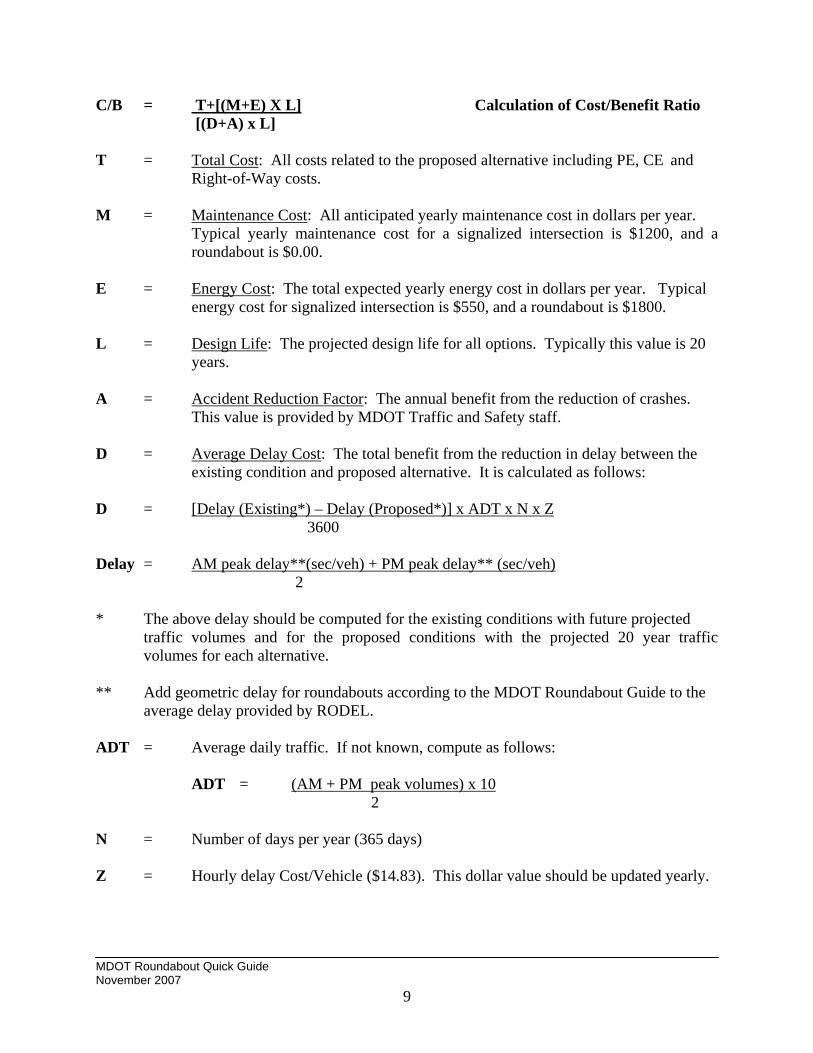
MDOT Roundabout Quick Guide November 2007
9
C/B = T+[(M+E) X L] Calculation of Cost/Benefit Ratio [(D+A) x L] T = Total Cost: All costs related to the proposed alternative including PE, CE and Right-of-Way costs. M = Maintenance Cost: All anticipated yearly maintenance cost in dollars per year.
Typical yearly maintenance cost for a signalized intersection is $1200, and a roundabout is $0.00.
E = Energy Cost: The total expected yearly energy cost in dollars per year. Typical energy cost for signalized intersection is $550, and a roundabout is $1800. L = Design Life: The projected design life for all options. Typically this value is 20 years. A = Accident Reduction Factor: The annual benefit from the reduction of crashes. This value is provided by MDOT Traffic and Safety staff. D = Average Delay Cost: The total benefit from the reduction in delay between the existing condition and proposed alternative. It is calculated as follows: D = [Delay (Existing*) – Delay (Proposed*)] x ADT x N x Z 3600 Delay = AM peak delay**(sec/veh) + PM peak delay** (sec/veh) 2 * The above delay should be computed for the existing conditions with future projected
traffic volumes and for the proposed conditions with the projected 20 year traffic volumes for each alternative.
** Add geometric delay for roundabouts according to the MDOT Roundabout Guide to the
average delay provided by RODEL.
ADT = Average daily traffic. If not known, compute as follows:
ADT = (AM + PM peak volumes) x 10 2
N = Number of days per year (365 days) Z = Hourly delay Cost/Vehicle ($14.83). This dollar value should be updated yearly.
APPENDIX C
Intersection Crash Reports (2004-2006) Intersection crash reports can be used to determine if an existing intersection has more than the average number of crashes when compared to similar locations. When reviewing crashes, special attention should be given to the severity of the crashes even if the total number of crashes is lower than the average for similar intersections. The following data includes the average number of crashes per year that occurred during the three year period 2004-2006 for:
• Various types of intersections (i.e. 2 Lane 2 Way, Divided Road, etc…). • Different traffic control (Unsignalized, Signalized). • Various ADT levels (ADT Less Than 10,000, ADT 10,000 to 20,000, and Greater
Than 20,000). • Different geographic locations (North and Superior Regions, the remaining
Regions). Notes regarding the following data:
• The data is the average number of crashes per year that occurred during the three
year period 2004-2006. • Animal crashes were excluded. • Analysis includes intersection related crashes only. • Intersection crashes include:
1. All crashes on the trunkline that occurred 150’ from the intersection. 2. Crashes that occurred on the trunkline half way between adjacent
intersections and coded as an intersection crash. 3. Crossroad crashes that occurred 150’ from the intersection.

NORTH & SUPERIOR REGIONS 2 Lane 2 Way Unsignalized Intersections ADT Less Than 10,000 ................................................1 Signalized Intersections ADT Less Than 10,000 ....................................................2 Unsignalized Intersections ADT 10,000 to 20,000..................................................3 Signalized Intersections ADT 10,000 to 20,000......................................................4 Unsignalized Intersections ADT Greater Than 20,000............................................5 Signalized Intersections ADT Greater Than 20,000................................................6 3 Lane 2 Way Unsignalized Intersections ADT Less Than 10,000 ................................................7 Signalized Intersections ADT Less Than 10,000 ...................................................8 Unsignalized Intersections ADT 10,000 to 20,000 .................................................9 Signalized Intersections ADT 10,000 to 20,000 ...................................................10 Unsignalized Intersections ADT Greater Than 20,000 .........................................11 Signalized Intersections ADT Greater Than 20,000 .............................................12 4 Lane 2 Way Unsignalized Intersections ADT Less Than 10,000 .............................................13 Signalized Intersections ADT Less Than 10,000 .................................................14 Unsignalized Intersections ADT 10,000 to 20,000 ...............................................15 Signalized Intersections ADT 10,000 to 20,000 ...................................................16 Unsignalized Intersections ADT Greater Than 20,000 .........................................17 Signalized Intersections ADT Greater Than 20,000 .............................................18 5 Lane 2 Way Unsignalized Intersections ADT Less Than 10,000 .............................................19 Signalized Intersections ADT Less Than 10,000 .................................................20 Unsignalized Intersections ADT 10,000 to 20,000 ..............................................21
Signalized Intersections ADT 10,000 to 20,000 ...................................................22 Unsignalized Intersections ADT Greater Than 20,000..........................................23 Signalized Intersections ADT Greater Than 20,000 .............................................24 7 Lane 2 Way Unsignalized Intersections ADT Less Than 10,000 .............................................25 Signalized Intersections ADT Less Than 10,000 .................................................26 Unsignalized Intersections ADT 10,000 to 20,000................................................27 Signalized Intersections ADT 10,000 to 20,000 ...................................................28 Unsignalized Intersections ADT Greater Than 20,000 .........................................29 Signalized Intersections ADT Greater Than 20,000 .............................................30 Divided Road Unsignalized Intersections ADT Less Than 10,000 .............................................31 Signalized Intersections ADT Less Than 10,000 .................................................32 Unsignalized Intersections ADT 10,000 to 20,000 ...............................................33 Signalized Intersections ADT 10,000 to 20,000 ...................................................34 Unsignalized Intersections ADT Greater Than 20,000 .........................................35 Signalized Intersections ADT Greater Than 20,000..............................................36

GRAND, BAY, SOUTHWEST, UNIVERSITY AND METRO REGIONS 2 Lane 2 Way Unsignalized Intersections ADT Less Than 10,000 .............................................37 Signalized Intersections ADT Less Than 10,000 .................................................38 Unsignalized Intersections ADT 10,000 to 20,000 ...............................................39 Signalized Intersections ADT 10,000 to 20,000 ...................................................40 Unsignalized Intersections ADT Greater Than 20,000 .........................................41 Signalized Intersections ADT Greater Than 20,000 .............................................42 3 Lane 2 Way Unsignalized Intersections ADT Less Than 10,000 .............................................43 Signalized Intersections ADT Less Than 10,000 .................................................44 Unsignalized Intersections ADT 10,000 to 20,000 ...............................................45 Signalized Intersections ADT 10,000 to 20,000 ...................................................46 Unsignalized Intersections ADT Greater Than 20,000 .........................................47 Signalized Intersections ADT Greater Than 20,000 .............................................48 4 Lane 2 Way Unsignalized Intersections ADT Less Than 10,000 .............................................49 Signalized Intersections ADT Less Than 10,000 .................................................50 Unsignalized Intersections ADT 10,000 to 20,000 ...............................................51 Signalized Intersections ADT 10,000 to 20,000 ...................................................52 Unsignalized Intersections ADT Greater Than 20,000 .........................................53 Signalized Intersections ADT Greater Than 20,000..............................................54 5 Lane 2 Way Unsignalized Intersections ADT Less Than 10,000 .............................................55 Signalized Intersections ADT Less Than 10,000 .................................................56 Unsignalized Intersections ADT 10,000 to 20,000 ...............................................57

Signalized Intersections ADT 10,000 to 20,000 ...................................................58 Unsignalized Intersections ADT Greater Than 20,000 .........................................59 Signalized Intersections ADT Greater Than 20,000 .............................................60 7 Lane 2 Way Unsignalized Intersections ADT Less Than 10,000 .............................................61 Signalized Intersections ADT Less Than 10,000 .................................................62 Unsignalized Intersections ADT 10,000 to 20,000 ...............................................63 Signalized Intersections ADT 10,000 to 20,000 ...................................................64 Unsignalized Intersections ADT Greater Than 20,000 .........................................65 Signalized Intersections ADT Greater Than 20,000 .............................................66 Divided Road Unsignalized Intersections ADT Less Than 10,000 .............................................67 Signalized Intersections ADT Less Than 10,000 .................................................68 Unsignalized Intersections ADT 10,000 to 20,000 ...............................................69 Signalized Intersections ADT 10,000 to 20,000 ...................................................70 Unsignalized Intersections ADT Greater Than 20,000 .........................................71 Signalized Intersections ADT Greater Than 20,000 .............................................72

2004-2006 2 LANE 2 WAY UNSIGNALIZED INTERSECTIONS Average Annual Crash Frequency
ADT LESS THAN 10,000 (Includes intersections with zero ADT) SUPERIOR AND NORTH REGIONS
AVG ADT = 3,482 TOT INTERSECTIONS = 5,404
AVERAGE AVG ANNUAL
CRASH TYPE ANNUAL FREQ CRASHES/INT % OF TOTAL
TOTAL 1609 0.30 100.0% INJURY ACC 443 0.08 27.5% FATAL ACC 12 0.00 0.7% WET 232 0.04 14.4% ICY 165 0.03 10.3% DARK 407 0.08 25.3% MISC SINGLE VEH 59 0.01 3.7% OVERTURNED 72 0.01 4.5% TRAIN 1 0.00 0.1% PRKED VEHICLE 4 0.00 0.2% MISC MULTI VEH 91 0.02 5.7% BACKING 44 0.01 2.7% PARKING 7 0.00 0.4% PEDESTRIAN 8 0.00 0.5% FIXED OBJ 307 0.06 19.1% ON ROAD OBJ 25 0.00 1.6% ANIMAL 0 0.00 0.0% BICYCLE 9 0.00 0.6% HEAD ON 31 0.01 1.9% ANGLE STRAIT 240 0.04 14.9% REAR-END 267 0.05 16.6% ANGLE TURN 78 0.01 4.8% SIDESWIPE SAME 92 0.02 5.7% REAR-END LEFT 59 0.01 3.7% REAR-END RIGHT 22 0.00 1.4% OTHER DRIVEWAY 17 0.00 1.1% ANGLE DRIVEWAY 32 0.01 2.0% REAR-END DRIVE 30 0.01 1.9% SIDESWIPE OPP 57 0.01 3.5% HEAD ON LEFT 48 0.01 3.0% DUAL LEFT TURN 3 0.00 0.2% DUAL RIGHT TURN 6 0.00 0.4%
DATA SOURCE: Traffic Count Data (ADT) Roadway Features
Bureau of Transportation Planning (Sufficiency) Intersection Data (Location, Traffic Control, Influence Zone) Traffic and Safety Division Crash Data Department of State Police Analysis includes intersection related crashes only Animal crashes excluded
1

2004-2006 2 LANE 2 WAY SIGNALIZED INTERSECTIONS Average Annual Crash Frequency
ADT LESS THAN 10,000 (Includes intersections with zero ADT) SUPERIOR AND NORTH REGIONS
AVG ADT = 5,188 TOT INTERSECTIONS = 58
AVERAGE AVG ANNUAL
CRASH TYPE ANNUAL FREQ CRASHES/INT % OF TOTAL
TOTAL 139 2.40 100.0% INJURY ACC 32 0.55 23.0% FATAL ACC 0 0.00 0.0% WET 30 0.52 21.6% ICY 5 0.09 3.6% DARK 25 0.43 18.0% MISC SINGLE VEH 2 0.03 1.4% OVERTURNED 0 0.00 0.0% TRAIN 0 0.00 0.0% PRKED VEHICLE 0 0.00 0.0% MISC MULTI VEH 9 0.16 6.5% BACKING 2 0.03 1.4% PARKING 1 0.02 0.7% PEDESTRIAN 0 0.00 0.0% FIXED OBJ 5 0.09 3.6% ON ROAD OBJ 1 0.02 0.7% ANIMAL 0 0.00 0.0% BICYCLE 1 0.02 0.7% HEAD ON 1 0.02 0.7% ANGLE STRAIT 21 0.36 15.1% REAR-END 50 0.86 36.0% ANGLE TURN 8 0.14 5.8% SIDESWIPE SAME 8 0.14 5.8% REAR-END LEFT 2 0.03 1.4% REAR-END RIGHT 2 0.03 1.4% OTHER DRIVEWAY 3 0.05 2.2% ANGLE DRIVEWAY 5 0.09 3.6% REAR-END DRIVE 3 0.05 2.2% SIDESWIPE OPP 3 0.05 2.2% HEAD ON LEFT 9 0.16 6.5% DUAL LEFT TURN 1 0.02 0.7% DUAL RIGHT TURN 1 0.02 0.7%
DATA SOURCE: Traffic Count Data (ADT) Roadway Features
Bureau of Transportation Planning (Sufficiency) Intersection Data (Location, Traffic Control, Influence Zone) Traffic and Safety Division Crash Data Department of State Police Analysis includes intersection related crashes only Animal crashes excluded
2

2004-2006 2 LANE 2 WAY UNSIGNALIZED INTERSECTIONS Average Annual Crash Frequency
ADT 10,000 TO 20,000 SUPERIOR AND NORTH REGIONS
AVG ADT = 12,792 TOT INTERSECTIONS = 211
AVERAGE AVG ANNUAL
CRASH TYPE ANNUAL FREQ CRASHES/INT % OF TOTAL
TOTAL 301 1.43 100.0% INJURY ACC 74 0.35 24.6% FATAL ACC 2 0.01 0.7% WET 57 0.27 18.9% ICY 25 0.12 8.3% DARK 54 0.26 17.9% MISC SINGLE VEH 6 0.03 2.0% OVERTURNED 4 0.02 1.3% TRAIN 0 0.00 0.0% PRKED VEHICLE 0 0.00 0.0% MISC MULTI VEH 14 0.07 4.7% BACKING 7 0.03 2.3% PARKING 1 0.00 0.3% PEDESTRIAN 2 0.01 0.7% FIXED OBJ 18 0.09 6.0% ON ROAD OBJ 1 0.00 0.3% ANIMAL 0 0.00 0.0% BICYCLE 3 0.01 1.0% HEAD ON 3 0.01 1.0% ANGLE STRAIT 32 0.15 10.6% REAR-END 113 0.54 37.5% ANGLE TURN 15 0.07 5.0% SIDESWIPE SAME 18 0.09 6.0% REAR-END LEFT 16 0.08 5.3% REAR-END RIGHT 6 0.03 2.0% OTHER DRIVEWAY 4 0.02 1.3% ANGLE DRIVEWAY 9 0.04 3.0% REAR-END DRIVE 11 0.05 3.7% SIDESWIPE OPP 8 0.04 2.7% HEAD ON LEFT 10 0.05 3.3% DUAL LEFT TURN 0 0.00 0.0% DUAL RIGHT TURN 1 0.00 0.3%
DATA SOURCE: Traffic Count Data (ADT) Roadway Features
Bureau of Transportation Planning (Sufficiency) Intersection Data (Location, Traffic Control, Influence Zone) Traffic and Safety Division Crash Data Department of State Police Analysis includes intersection related crashes only Animal crashes excluded
3

2004-2006 2 LANE 2 WAY SIGNALIZED INTERSECTIONS Average Annual Crash Frequency
ADT 10,000 TO 20,000 SUPERIOR AND NORTH REGIONS
AVG ADT = 13,731 TOT INTERSECTIONS = 12
AVERAGE AVG ANNUAL
CRASH TYPE ANNUAL FREQ CRASHES/INT % OF TOTAL
TOTAL 59 4.92 100.0% INJURY ACC 14 1.17 23.7% FATAL ACC 1 0.08 1.7% WET 13 1.08 22.0% ICY 5 0.42 8.5% DARK 15 1.25 25.4% MISC SINGLE VEH 0 0.00 0.0% OVERTURNED 0 0.00 0.0% TRAIN 0 0.00 0.0% PRKED VEHICLE 0 0.00 0.0% MISC MULTI VEH 3 0.25 5.1% BACKING 0 0.00 0.0% PARKING 0 0.00 0.0% PEDESTRIAN 0 0.00 0.0% FIXED OBJ 1 0.08 1.7% ON ROAD OBJ 0 0.00 0.0% ANIMAL 0 0.00 0.0% BICYCLE 0 0.00 0.0% HEAD ON 0 0.00 0.0% ANGLE STRAIT 11 0.92 18.6% REAR-END 28 2.33 47.5% ANGLE TURN 3 0.25 5.1% SIDESWIPE SAME 2 0.17 3.4% REAR-END LEFT 0 0.00 0.0% REAR-END RIGHT 1 0.08 1.7% OTHER DRIVEWAY 0 0.00 0.0% ANGLE DRIVEWAY 2 0.17 3.4% REAR-END DRIVE 1 0.08 1.7% SIDESWIPE OPP 1 0.08 1.7% HEAD ON LEFT 3 0.25 5.1% DUAL LEFT TURN 0 0.00 0.0% DUAL RIGHT TURN 0 0.00 0.0%
DATA SOURCE: Traffic Count Data (ADT) Roadway Features
Bureau of Transportation Planning (Sufficiency) Intersection Data (Location, Traffic Control, Influence Zone) Traffic and Safety Division Crash Data Department of State Police Analysis includes intersection related crashes only Animal crashes excluded
4

2004-2006 2 LANE 2 WAY UNSIGNALIZED INTERSECTIONS Average Annual Crash Frequency
ADT GREATER THAN 20,000 SUPERIOR AND NORTH REGIONS
AVG ADT = 22,362 TOT INTERSECTIONS = 2
AVERAGE AVG ANNUAL
CRASH TYPE ANNUAL FREQ CRASHES/INT % OF TOTAL
TOTAL 3 1.50 100.0% INJURY ACC 0 0.00 0.0% FATAL ACC 0 0.00 0.0% WET 0 0.00 0.0% ICY 0 0.00 0.0% DARK 1 0.50 33.3% MISC SINGLE VEH 0 0.00 0.0% OVERTURNED 0 0.00 0.0% TRAIN 0 0.00 0.0% PRKED VEHICLE 0 0.00 0.0% MISC MULTI VEH 0 0.00 0.0% BACKING 0 0.00 0.0% PARKING 0 0.00 0.0% PEDESTRIAN 0 0.00 0.0% FIXED OBJ 1 0.50 33.3% ON ROAD OBJ 0 0.00 0.0% ANIMAL 0 0.00 0.0% BICYCLE 0 0.00 0.0% HEAD ON 0 0.00 0.0% ANGLE STRAIT 0 0.00 0.0% REAR-END 2 1.00 66.7% ANGLE TURN 0 0.00 0.0% SIDESWIPE SAME 0 0.00 0.0% REAR-END LEFT 0 0.00 0.0% REAR-END RIGHT 0 0.00 0.0% OTHER DRIVEWAY 0 0.00 0.0% ANGLE DRIVEWAY 0 0.00 0.0% REAR-END DRIVE 0 0.00 0.0% SIDESWIPE OPP 0 0.00 0.0% HEAD ON LEFT 0 0.00 0.0% DUAL LEFT TURN 0 0.00 0.0% DUAL RIGHT TURN 0 0.00 0.0%
DATA SOURCE: Traffic Count Data (ADT) Roadway Features
Bureau of Transportation Planning (Sufficiency) Intersection Data (Location, Traffic Control, Influence Zone) Traffic and Safety Division Crash Data Department of State Police Analysis includes intersection related crashes only Animal crashes excluded
5

2004-2006 2 LANE 2 WAY SIGNALIZED INTERSECTIONS Average Annual Crash Frequency
ADT GREATER THAN 20,000 SUPERIOR AND NORTH REGIONS
AVG ADT = 22,362 TOT INTERSECTIONS = 1
AVERAGE AVG ANNUAL
CRASH TYPE ANNUAL FREQ CRASHES/INT % OF TOTAL
TOTAL 5 5.00 100.0% INJURY ACC 0 0.00 0.0% FATAL ACC 0 0.00 0.0% WET 1 1.00 20.0% ICY 0 0.00 0.0% DARK 0 0.00 0.0% MISC SINGLE VEH 0 0.00 0.0% OVERTURNED 0 0.00 0.0% TRAIN 0 0.00 0.0% PRKED VEHICLE 0 0.00 0.0% MISC MULTI VEH 1 1.00 20.0% BACKING 0 0.00 0.0% PARKING 0 0.00 0.0% PEDESTRIAN 0 0.00 0.0% FIXED OBJ 0 0.00 0.0% ON ROAD OBJ 0 0.00 0.0% ANIMAL 0 0.00 0.0% BICYCLE 0 0.00 0.0% HEAD ON 0 0.00 0.0% ANGLE STRAIT 1 1.00 20.0% REAR-END 1 1.00 20.0% ANGLE TURN 0 0.00 0.0% SIDESWIPE SAME 1 1.00 20.0% REAR-END LEFT 0 0.00 0.0% REAR-END RIGHT 0 0.00 0.0% OTHER DRIVEWAY 0 0.00 0.0% ANGLE DRIVEWAY 0 0.00 0.0% REAR-END DRIVE 0 0.00 0.0% SIDESWIPE OPP 0 0.00 0.0% HEAD ON LEFT 0 0.00 0.0% DUAL LEFT TURN 0 0.00 0.0% DUAL RIGHT TURN 0 0.00 0.0%
DATA SOURCE: Traffic Count Data (ADT) Roadway Features
Bureau of Transportation Planning (Sufficiency) Intersection Data (Location, Traffic Control, Influence Zone) Traffic and Safety Division Crash Data Department of State Police Analysis includes intersection related crashes only Animal crashes excluded
6

2004-2006 3 LANE 2 WAY UNSIGNALIZED INTERSECTIONS Average Annual Crash Frequency
ADT LESS THAN 10,000 (Includes intersections with zero ADT) SUPERIOR AND NORTH REGIONS
AVG ADT = 5,949 TOT INTERSECTIONS = 132
AVERAGE AVG ANNUAL
CRASH TYPE ANNUAL FREQ CRASHES/INT % OF TOTAL
TOTAL 89 0.67 100.0% INJURY ACC 22 0.17 24.7% FATAL ACC 0 0.00 0.0% WET 17 0.13 19.1% ICY 5 0.04 5.6% DARK 19 0.14 21.3% MISC SINGLE VEH 1 0.01 1.1% OVERTURNED 0 0.00 0.0% TRAIN 0 0.00 0.0% PRKED VEHICLE 1 0.01 1.1% MISC MULTI VEH 8 0.06 9.0% BACKING 4 0.03 4.5% PARKING 1 0.01 1.1% PEDESTRIAN 1 0.01 1.1% FIXED OBJ 5 0.04 5.6% ON ROAD OBJ 1 0.01 1.1% ANIMAL 0 0.00 0.0% BICYCLE 1 0.01 1.1% HEAD ON 1 0.01 1.1% ANGLE STRAIT 15 0.11 16.9% REAR-END 17 0.13 19.1% ANGLE TURN 7 0.05 7.9% SIDESWIPE SAME 7 0.05 7.9% REAR-END LEFT 3 0.02 3.4% REAR-END RIGHT 3 0.02 3.4% OTHER DRIVEWAY 1 0.01 1.1% ANGLE DRIVEWAY 3 0.02 3.4% REAR-END DRIVE 1 0.01 1.1% SIDESWIPE OPP 2 0.02 2.2% HEAD ON LEFT 5 0.04 5.6% DUAL LEFT TURN 0 0.00 0.0% DUAL RIGHT TURN 0 0.00 0.0%
DATA SOURCE: Traffic Count Data (ADT) Roadway Features
Bureau of Transportation Planning (Sufficiency) Intersection Data (Location, Traffic Control, Influence Zone) Traffic and Safety Division Crash Data Department of State Police Analysis includes intersection related crashes only Animal crashes excluded
7

2004-2006 3 LANE 2 WAY SIGNALIZED INTERSECTIONS Average Annual Crash Frequency
ADT LESS THAN 10,000 (Includes intersections with zero ADT) SUPERIOR AND NORTH REGIONS
AVG ADT = 6,837 TOT INTERSECTIONS = 9
AVERAGE AVG ANNUAL
CRASH TYPE ANNUAL FREQ CRASHES/INT % OF TOTAL
TOTAL 17 1.89 100.0% INJURY ACC 2 0.22 11.8% FATAL ACC 0 0.00 0.0% WET 2 0.22 11.8% ICY 2 0.22 11.8% DARK 5 0.56 29.4% MISC SINGLE VEH 0 0.00 0.0% OVERTURNED 0 0.00 0.0% TRAIN 0 0.00 0.0% PRKED VEHICLE 0 0.00 0.0% MISC MULTI VEH 1 0.11 5.9% BACKING 1 0.11 5.9% PARKING 0 0.00 0.0% PEDESTRIAN 0 0.00 0.0% FIXED OBJ 1 0.11 5.9% ON ROAD OBJ 0 0.00 0.0% ANIMAL 0 0.00 0.0% BICYCLE 0 0.00 0.0% HEAD ON 0 0.00 0.0% ANGLE STRAIT 5 0.56 29.4% REAR-END 6 0.67 35.3% ANGLE TURN 0 0.00 0.0% SIDESWIPE SAME 1 0.11 5.9% REAR-END LEFT 0 0.00 0.0% REAR-END RIGHT 0 0.00 0.0% OTHER DRIVEWAY 0 0.00 0.0% ANGLE DRIVEWAY 0 0.00 0.0% REAR-END DRIVE 1 0.11 5.9% SIDESWIPE OPP 1 0.11 5.9% HEAD ON LEFT 2 0.22 11.8% DUAL LEFT TURN 0 0.00 0.0% DUAL RIGHT TURN 0 0.00 0.0%
DATA SOURCE: Traffic Count Data (ADT) Roadway Features
Bureau of Transportation Planning (Sufficiency) Intersection Data (Location, Traffic Control, Influence Zone) Traffic and Safety Division Crash Data Department of State Police Analysis includes intersection related crashes only Animal crashes excluded
8
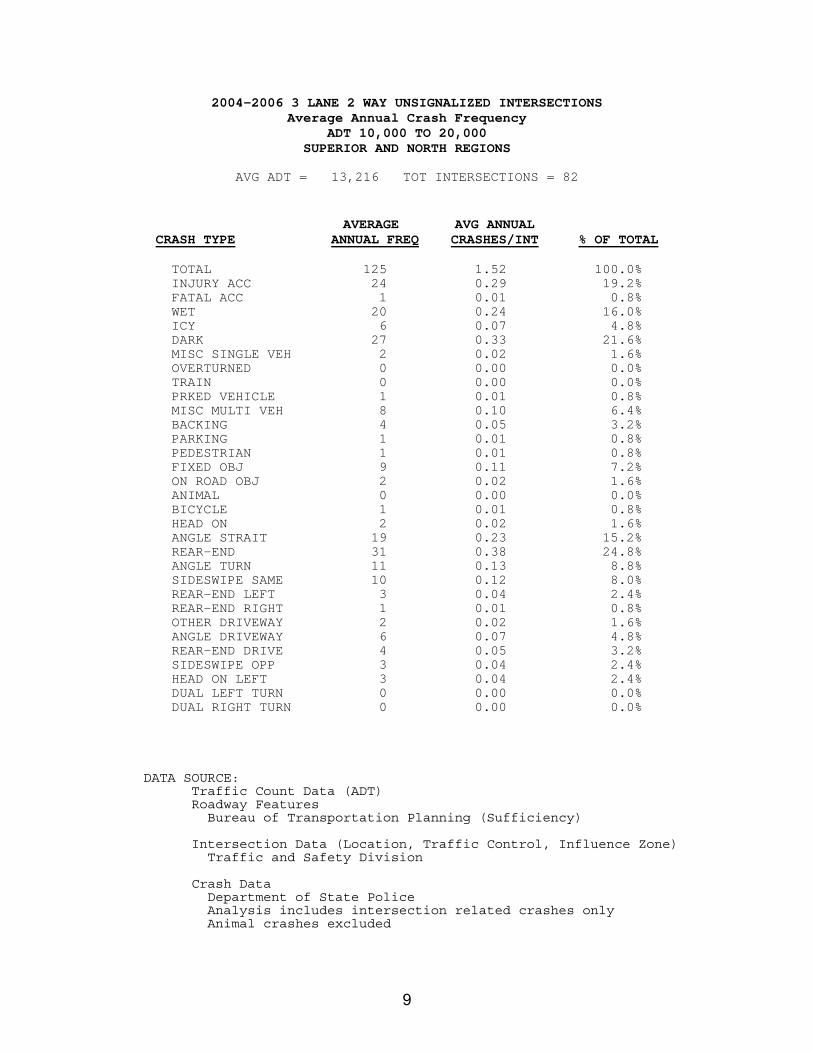
2004-2006 3 LANE 2 WAY UNSIGNALIZED INTERSECTIONS Average Annual Crash Frequency
ADT 10,000 TO 20,000 SUPERIOR AND NORTH REGIONS
AVG ADT = 13,216 TOT INTERSECTIONS = 82
AVERAGE AVG ANNUAL
CRASH TYPE ANNUAL FREQ CRASHES/INT % OF TOTAL
TOTAL 125 1.52 100.0% INJURY ACC 24 0.29 19.2% FATAL ACC 1 0.01 0.8% WET 20 0.24 16.0% ICY 6 0.07 4.8% DARK 27 0.33 21.6% MISC SINGLE VEH 2 0.02 1.6% OVERTURNED 0 0.00 0.0% TRAIN 0 0.00 0.0% PRKED VEHICLE 1 0.01 0.8% MISC MULTI VEH 8 0.10 6.4% BACKING 4 0.05 3.2% PARKING 1 0.01 0.8% PEDESTRIAN 1 0.01 0.8% FIXED OBJ 9 0.11 7.2% ON ROAD OBJ 2 0.02 1.6% ANIMAL 0 0.00 0.0% BICYCLE 1 0.01 0.8% HEAD ON 2 0.02 1.6% ANGLE STRAIT 19 0.23 15.2% REAR-END 31 0.38 24.8% ANGLE TURN 11 0.13 8.8% SIDESWIPE SAME 10 0.12 8.0% REAR-END LEFT 3 0.04 2.4% REAR-END RIGHT 1 0.01 0.8% OTHER DRIVEWAY 2 0.02 1.6% ANGLE DRIVEWAY 6 0.07 4.8% REAR-END DRIVE 4 0.05 3.2% SIDESWIPE OPP 3 0.04 2.4% HEAD ON LEFT 3 0.04 2.4% DUAL LEFT TURN 0 0.00 0.0% DUAL RIGHT TURN 0 0.00 0.0%
DATA SOURCE: Traffic Count Data (ADT) Roadway Features
Bureau of Transportation Planning (Sufficiency) Intersection Data (Location, Traffic Control, Influence Zone) Traffic and Safety Division Crash Data Department of State Police Analysis includes intersection related crashes only Animal crashes excluded
9

2004-2006 3 LANE 2 WAY SIGNALIZED INTERSECTIONS Average Annual Crash Frequency
ADT 10,000 TO 20,000 SUPERIOR AND NORTH REGIONS
AVG ADT = 14,035 TOT INTERSECTIONS = 8
AVERAGE AVG ANNUAL
CRASH TYPE ANNUAL FREQ CRASHES/INT % OF TOTAL
TOTAL 45 5.63 100.0% INJURY ACC 9 1.13 20.0% FATAL ACC 0 0.00 0.0% WET 7 0.88 15.6% ICY 2 0.25 4.4% DARK 6 0.75 13.3% MISC SINGLE VEH 0 0.00 0.0% OVERTURNED 0 0.00 0.0% TRAIN 0 0.00 0.0% PRKED VEHICLE 0 0.00 0.0% MISC MULTI VEH 1 0.13 2.2% BACKING 0 0.00 0.0% PARKING 0 0.00 0.0% PEDESTRIAN 1 0.13 2.2% FIXED OBJ 1 0.13 2.2% ON ROAD OBJ 0 0.00 0.0% ANIMAL 0 0.00 0.0% BICYCLE 0 0.00 0.0% HEAD ON 0 0.00 0.0% ANGLE STRAIT 6 0.75 13.3% REAR-END 22 2.75 48.9% ANGLE TURN 2 0.25 4.4% SIDESWIPE SAME 4 0.50 8.9% REAR-END LEFT 1 0.13 2.2% REAR-END RIGHT 1 0.13 2.2% OTHER DRIVEWAY 0 0.00 0.0% ANGLE DRIVEWAY 1 0.13 2.2% REAR-END DRIVE 2 0.25 4.4% SIDESWIPE OPP 0 0.00 0.0% HEAD ON LEFT 2 0.25 4.4% DUAL LEFT TURN 0 0.00 0.0% DUAL RIGHT TURN 0 0.00 0.0%
DATA SOURCE: Traffic Count Data (ADT) Roadway Features
Bureau of Transportation Planning (Sufficiency) Intersection Data (Location, Traffic Control, Influence Zone) Traffic and Safety Division Crash Data Department of State Police Analysis includes intersection related crashes only Animal crashes excluded
10

2004-2006 3 LANE 2 WAY UNSIGNALIZED INTERSECTIONS Average Annual Crash Frequency
ADT GREATER THAN 20,000 SUPERIOR AND NORTH REGIONS
AVG ADT = 21,663 TOT INTERSECTIONS = 16
AVERAGE AVG ANNUAL
CRASH TYPE ANNUAL FREQ CRASHES/INT % OF TOTAL
TOTAL 29 1.81 100.0% INJURY ACC 6 0.38 20.7% FATAL ACC 0 0.00 0.0% WET 8 0.50 27.6% ICY 1 0.06 3.4% DARK 4 0.25 13.8% MISC SINGLE VEH 0 0.00 0.0% OVERTURNED 0 0.00 0.0% TRAIN 0 0.00 0.0% PRKED VEHICLE 0 0.00 0.0% MISC MULTI VEH 1 0.06 3.4% BACKING 0 0.00 0.0% PARKING 0 0.00 0.0% PEDESTRIAN 0 0.00 0.0% FIXED OBJ 2 0.13 6.9% ON ROAD OBJ 0 0.00 0.0% ANIMAL 0 0.00 0.0% BICYCLE 0 0.00 0.0% HEAD ON 0 0.00 0.0% ANGLE STRAIT 2 0.13 6.9% REAR-END 15 0.94 51.7% ANGLE TURN 1 0.06 3.4% SIDESWIPE SAME 2 0.13 6.9% REAR-END LEFT 0 0.00 0.0% REAR-END RIGHT 1 0.06 3.4% OTHER DRIVEWAY 0 0.00 0.0% ANGLE DRIVEWAY 0 0.00 0.0% REAR-END DRIVE 3 0.19 10.3% SIDESWIPE OPP 1 0.06 3.4% HEAD ON LEFT 1 0.06 3.4% DUAL LEFT TURN 0 0.00 0.0% DUAL RIGHT TURN 0 0.00 0.0%
DATA SOURCE: Traffic Count Data (ADT) Roadway Features
Bureau of Transportation Planning (Sufficiency) Intersection Data (Location, Traffic Control, Influence Zone) Traffic and Safety Division Crash Data Department of State Police Analysis includes intersection related crashes only Animal crashes excluded
11
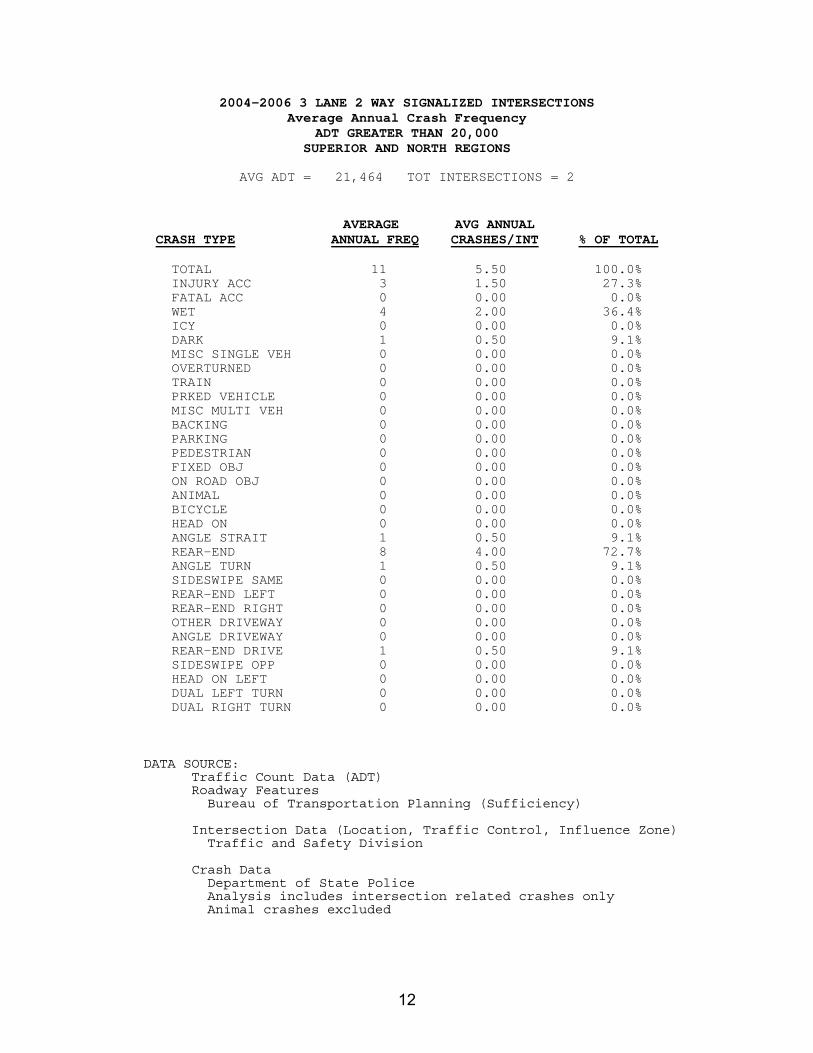
2004-2006 3 LANE 2 WAY SIGNALIZED INTERSECTIONS Average Annual Crash Frequency
ADT GREATER THAN 20,000 SUPERIOR AND NORTH REGIONS
AVG ADT = 21,464 TOT INTERSECTIONS = 2
AVERAGE AVG ANNUAL
CRASH TYPE ANNUAL FREQ CRASHES/INT % OF TOTAL
TOTAL 11 5.50 100.0% INJURY ACC 3 1.50 27.3% FATAL ACC 0 0.00 0.0% WET 4 2.00 36.4% ICY 0 0.00 0.0% DARK 1 0.50 9.1% MISC SINGLE VEH 0 0.00 0.0% OVERTURNED 0 0.00 0.0% TRAIN 0 0.00 0.0% PRKED VEHICLE 0 0.00 0.0% MISC MULTI VEH 0 0.00 0.0% BACKING 0 0.00 0.0% PARKING 0 0.00 0.0% PEDESTRIAN 0 0.00 0.0% FIXED OBJ 0 0.00 0.0% ON ROAD OBJ 0 0.00 0.0% ANIMAL 0 0.00 0.0% BICYCLE 0 0.00 0.0% HEAD ON 0 0.00 0.0% ANGLE STRAIT 1 0.50 9.1% REAR-END 8 4.00 72.7% ANGLE TURN 1 0.50 9.1% SIDESWIPE SAME 0 0.00 0.0% REAR-END LEFT 0 0.00 0.0% REAR-END RIGHT 0 0.00 0.0% OTHER DRIVEWAY 0 0.00 0.0% ANGLE DRIVEWAY 0 0.00 0.0% REAR-END DRIVE 1 0.50 9.1% SIDESWIPE OPP 0 0.00 0.0% HEAD ON LEFT 0 0.00 0.0% DUAL LEFT TURN 0 0.00 0.0% DUAL RIGHT TURN 0 0.00 0.0%
DATA SOURCE: Traffic Count Data (ADT) Roadway Features
Bureau of Transportation Planning (Sufficiency) Intersection Data (Location, Traffic Control, Influence Zone) Traffic and Safety Division Crash Data Department of State Police Analysis includes intersection related crashes only Animal crashes excluded
12

2004-2006 4 LANE 2 WAY UNSIGNALIZED INTERSECTIONS Average Annual Crash Frequency
ADT LESS THAN 10,000 (Includes intersections with zero ADT) NORTH AND SUPERIOR REGIONS
AVG ADT = 7,008 TOT INTERSECTIONS = 244
AVERAGE AVG ANNUAL
CRASH TYPE ANNUAL FREQ CRASHES/INT % OF TOTAL
TOTAL 145 0.59 100.0% INJURY ACC 35 0.14 24.1% FATAL ACC 0 0.00 0.0% WET 23 0.09 15.9% ICY 6 0.02 4.1% DARK 29 0.12 20.0% MISC SINGLE VEH 4 0.02 2.8% OVERTURNED 1 0.00 0.7% TRAIN 0 0.00 0.0% PRKED VEHICLE 1 0.00 0.7% MISC MULTI VEH 13 0.05 9.0% BACKING 6 0.02 4.1% PARKING 1 0.00 0.7% PEDESTRIAN 1 0.00 0.7% FIXED OBJ 17 0.07 11.7% ON ROAD OBJ 1 0.00 0.7% ANIMAL 0 0.00 0.0% BICYCLE 1 0.00 0.7% HEAD ON 1 0.00 0.7% ANGLE STRAIT 26 0.11 17.9% REAR-END 19 0.08 13.1% ANGLE TURN 10 0.04 6.9% SIDESWIPE SAME 18 0.07 12.4% REAR-END LEFT 5 0.02 3.4% REAR-END RIGHT 2 0.01 1.4% OTHER DRIVEWAY 1 0.00 0.7% ANGLE DRIVEWAY 5 0.02 3.4% REAR-END DRIVE 1 0.00 0.7% SIDESWIPE OPP 3 0.01 2.1% HEAD ON LEFT 8 0.03 5.5% DUAL LEFT TURN 0 0.00 0.0% DUAL RIGHT TURN 0 0.00 0.0%
DATA SOURCE: Traffic Count Data (ADT) Roadway Features
Bureau of Transportation Planning (Sufficiency) Intersection Data (Location, Traffic Control, Influence Zone) Traffic and Safety Division Crash Data Department of State Police Analysis includes intersection related crashes only Animal crashes excluded
13

2004-2006 4 LANE 2 WAY SIGNALIZED INTERSECTIONS Average Annual Crash Frequency
ADT LESS THAN 10,000 (Includes intersections with zero ADT) NORTH AND SUPERIOR REGIONS
AVG ADT = 8,263 TOT INTERSECTIONS = 13
AVERAGE AVG ANNUAL CRASH TYPE ANNUAL FREQ CRASHES/INT % OF TOTAL
TOTAL 40 3.08 100.0% INJURY ACC 11 0.85 27.5% FATAL ACC 0 0.00 0.0% WET 7 0.54 17.5% ICY 1 0.08 2.5% DARK 8 0.62 20.0% MISC SINGLE VEH 1 0.08 2.5% OVERTURNED 0 0.00 0.0% TRAIN 0 0.00 0.0% PRKED VEHICLE 0 0.00 0.0% MISC MULTI VEH 2 0.15 5.0% BACKING 0 0.00 0.0% PARKING 0 0.00 0.0% PEDESTRIAN 0 0.00 0.0% FIXED OBJ 2 0.15 5.0% ON ROAD OBJ 0 0.00 0.0% ANIMAL 0 0.00 0.0% BICYCLE 0 0.00 0.0% HEAD ON 0 0.00 0.0% ANGLE STRAIT 8 0.62 20.0% REAR-END 13 1.00 32.5% ANGLE TURN 4 0.31 10.0% SIDESWIPE SAME 2 0.15 5.0% REAR-END LEFT 1 0.08 2.5% REAR-END RIGHT 1 0.08 2.5% OTHER DRIVEWAY 0 0.00 0.0% ANGLE DRIVEWAY 0 0.00 0.0% REAR-END DRIVE 1 0.08 2.5% SIDESWIPE OPP 1 0.08 2.5% HEAD ON LEFT 3 0.23 7.5% DUAL LEFT TURN 0 0.00 0.0% DUAL RIGHT TURN 1 0.08 2.5%
DATA SOURCE: Traffic Count Data (ADT) Roadway Features
Bureau of Transportation Planning (Sufficiency) Intersection Data (Location, Traffic Control, Influence Zone) Traffic and Safety Division Crash Data Department of State Police Analysis includes intersection related crashes only Animal crashes excluded
14

2004-2006 4 LANE 2 WAY UNSIGNALIZED INTERSECTIONS Average Annual Crash Frequency
ADT 10,000 TO 20,000 NORTH AND SUPERIOR REGIONS
AVG ADT = 14,306 TOT INTERSECTIONS = 259
AVERAGE AVG ANNUAL CRASH TYPE ANNUAL FREQ CRASHES/INT % OF TOTAL
TOTAL 451 1.74 100.0% INJURY ACC 105 0.41 23.3% FATAL ACC 1 0.00 0.2% WET 91 0.35 20.2% ICY 13 0.05 2.9% DARK 67 0.26 14.9% MISC SINGLE VEH 8 0.03 1.8% OVERTURNED 0 0.00 0.0% TRAIN 0 0.00 0.0% PRKED VEHICLE 1 0.00 0.2% MISC MULTI VEH 20 0.08 4.4% BACKING 14 0.05 3.1% PARKING 3 0.01 0.7% PEDESTRIAN 4 0.02 0.9% FIXED OBJ 26 0.10 5.8% ON ROAD OBJ 4 0.02 0.9% ANIMAL 0 0.00 0.0% BICYCLE 5 0.02 1.1% HEAD ON 4 0.02 0.9% ANGLE STRAIT 57 0.22 12.6% REAR-END 114 0.44 25.3% ANGLE TURN 43 0.17 9.5% SIDESWIPE SAME 48 0.19 10.6% REAR-END LEFT 26 0.10 5.8% REAR-END RIGHT 5 0.02 1.1% OTHER DRIVEWAY 5 0.02 1.1% ANGLE DRIVEWAY 15 0.06 3.3% REAR-END DRIVE 18 0.07 4.0% SIDESWIPE OPP 12 0.05 2.7% HEAD ON LEFT 20 0.08 4.4% DUAL LEFT TURN 0 0.00 0.0% DUAL RIGHT TURN 1 0.00 0.2%
DATA SOURCE: Traffic Count Data (ADT) Roadway Features
Bureau of Transportation Planning (Sufficiency) Intersection Data (Location, Traffic Control, Influence Zone) Traffic and Safety Division Crash Data Department of State Police Analysis includes intersection related crashes only Animal crashes excluded
15

2004-2006 4 LANE 2 WAY SIGNALIZED INTERSECTIONS Average Annual Crash Frequency
ADT 10,000 TO 20,000 NORTH AND SUPERIOR REGIONS
AVG ADT = 15,384 TOT INTERSECTIONS = 35
AVERAGE AVG ANNUAL CRASH TYPE ANNUAL FREQ CRASHES/INT % OF TOTAL
TOTAL 240 6.86 100.0% INJURY ACC 53 1.51 22.1% FATAL ACC 0 0.00 0.0% WET 51 1.46 21.3% ICY 10 0.29 4.2% DARK 41 1.17 17.1% MISC SINGLE VEH 2 0.06 0.8% OVERTURNED 0 0.00 0.0% TRAIN 0 0.00 0.0% PRKED VEHICLE 1 0.03 0.4% MISC MULTI VEH 8 0.23 3.3% BACKING 4 0.11 1.7% PARKING 1 0.03 0.4% PEDESTRIAN 2 0.06 0.8% FIXED OBJ 6 0.17 2.5% ON ROAD OBJ 0 0.00 0.0% ANIMAL 0 0.00 0.0% BICYCLE 7 0.20 2.9% HEAD ON 2 0.06 0.8% ANGLE STRAIT 41 1.17 17.1% REAR-END 85 2.43 35.4% ANGLE TURN 20 0.57 8.3% SIDESWIPE SAME 21 0.60 8.8% REAR-END LEFT 6 0.17 2.5% REAR-END RIGHT 4 0.11 1.7% OTHER DRIVEWAY 1 0.03 0.4% ANGLE DRIVEWAY 6 0.17 2.5% REAR-END DRIVE 8 0.23 3.3% SIDESWIPE OPP 4 0.11 1.7% HEAD ON LEFT 11 0.31 4.6% DUAL LEFT TURN 0 0.00 0.0% DUAL RIGHT TURN 1 0.03 0.4%
DATA SOURCE: Traffic Count Data (ADT) Roadway Features
Bureau of Transportation Planning (Sufficiency) Intersection Data (Location, Traffic Control, Influence Zone) Traffic and Safety Division Crash Data Department of State Police Analysis includes intersection related crashes only Animal crashes excluded
16

2004-2006 4 LANE 2 WAY UNSIGNALIZED INTERSECTIONS Average Annual Crash Frequency
ADT GREATER THAN 20,000 NORTH AND SUPERIOR REGIONS
AVG ADT = 23,692 TOT INTERSECTIONS = 34
AVERAGE AVG ANNUAL
CRASH TYPE ANNUAL FREQ CRASHES/INT % OF TOTAL
TOTAL 164 4.82 100.0% INJURY ACC 31 0.91 18.9% FATAL ACC 0 0.00 0.0% WET 39 1.15 23.8% ICY 7 0.21 4.3% DARK 26 0.76 15.9% MISC SINGLE VEH 2 0.06 1.2% OVERTURNED 0 0.00 0.0% TRAIN 0 0.00 0.0% PRKED VEHICLE 0 0.00 0.0% MISC MULTI VEH 3 0.09 1.8% BACKING 3 0.09 1.8% PARKING 1 0.03 0.6% PEDESTRIAN 0 0.00 0.0% FIXED OBJ 9 0.26 5.5% ON ROAD OBJ 0 0.00 0.0% ANIMAL 0 0.00 0.0% BICYCLE 1 0.03 0.6% HEAD ON 1 0.03 0.6% ANGLE STRAIT 14 0.41 8.5% REAR-END 63 1.85 38.4% ANGLE TURN 17 0.50 10.4% SIDESWIPE SAME 22 0.65 13.4% REAR-END LEFT 7 0.21 4.3% REAR-END RIGHT 2 0.06 1.2% OTHER DRIVEWAY 0 0.00 0.0% ANGLE DRIVEWAY 6 0.18 3.7% REAR-END DRIVE 7 0.21 4.3% SIDESWIPE OPP 4 0.12 2.4% HEAD ON LEFT 3 0.09 1.8% DUAL LEFT TURN 0 0.00 0.0% DUAL RIGHT TURN 0 0.00 0.0%
DATA SOURCE: Traffic Count Data (ADT) Roadway Features
Bureau of Transportation Planning (Sufficiency) Intersection Data (Location, Traffic Control, Influence Zone) Traffic and Safety Division Crash Data Department of State Police Analysis includes intersection related crashes only Animal crashes excluded
17

2004-2006 4 LANE 2 WAY SIGNALIZED INTERSECTIONS Average Annual Crash Frequency
ADT GREATER THAN 20,000 NORTH AND SUPERIOR REGIONS
AVG ADT = 25,169 TOT INTERSECTIONS = 5
AVERAGE AVG ANNUAL
CRASH TYPE ANNUAL FREQ CRASHES/INT % OF TOTAL
TOTAL 53 10.60 100.0% INJURY ACC 9 1.80 17.0% FATAL ACC 0 0.00 0.0% WET 14 2.80 26.4% ICY 1 0.20 1.9% DARK 9 1.80 17.0% MISC SINGLE VEH 0 0.00 0.0% OVERTURNED 0 0.00 0.0% TRAIN 0 0.00 0.0% PRKED VEHICLE 0 0.00 0.0% MISC MULTI VEH 1 0.20 1.9% BACKING 1 0.20 1.9% PARKING 0 0.00 0.0% PEDESTRIAN 1 0.20 1.9% FIXED OBJ 2 0.40 3.8% ON ROAD OBJ 0 0.00 0.0% ANIMAL 0 0.00 0.0% BICYCLE 1 0.20 1.9% HEAD ON 1 0.20 1.9% ANGLE STRAIT 7 1.40 13.2% REAR-END 20 4.00 37.7% ANGLE TURN 3 0.60 5.7% SIDESWIPE SAME 5 1.00 9.4% REAR-END LEFT 0 0.00 0.0% REAR-END RIGHT 1 0.20 1.9% OTHER DRIVEWAY 0 0.00 0.0% ANGLE DRIVEWAY 3 0.60 5.7% REAR-END DRIVE 4 0.80 7.5% SIDESWIPE OPP 1 0.20 1.9% HEAD ON LEFT 2 0.40 3.8% DUAL LEFT TURN 1 0.20 1.9% DUAL RIGHT TURN 0 0.00 0.0%
DATA SOURCE: Traffic Count Data (ADT) Roadway Features
Bureau of Transportation Planning (Sufficiency) Intersection Data (Location, Traffic Control, Influence Zone) Traffic and Safety Division Crash Data Department of State Police Analysis includes intersection related crashes only Animal crashes excluded
18

2004-2006 5 LANE 2 WAY UNSIGNALIZED INTERSECTIONS Average Annual Crash Frequency
ADT LESS THAN 10,000 (Includes intersections with zero ADT) NORTH AND SUPERIOR REGIONS
AVG ADT = 7,829 TOT INTERSECTIONS = 60
AVERAGE AVG ANNUAL
CRASH TYPE ANNUAL FREQ CRASHES/INT % OF TOTAL
TOTAL 34 0.57 100.0% INJURY ACC 12 0.20 35.3% FATAL ACC 0 0.00 0.0% WET 5 0.08 14.7% ICY 3 0.05 8.8% DARK 8 0.13 23.5% MISC SINGLE VEH 2 0.03 5.9% OVERTURNED 1 0.02 2.9% TRAIN 0 0.00 0.0% PRKED VEHICLE 0 0.00 0.0% MISC MULTI VEH 2 0.03 5.9% BACKING 1 0.02 2.9% PARKING 1 0.02 2.9% PEDESTRIAN 0 0.00 0.0% FIXED OBJ 4 0.07 11.8% ON ROAD OBJ 0 0.00 0.0% ANIMAL 0 0.00 0.0% BICYCLE 0 0.00 0.0% HEAD ON 1 0.02 2.9% ANGLE STRAIT 9 0.15 26.5% REAR-END 3 0.05 8.8% ANGLE TURN 2 0.03 5.9% SIDESWIPE SAME 3 0.05 8.8% REAR-END LEFT 1 0.02 2.9% REAR-END RIGHT 1 0.02 2.9% OTHER DRIVEWAY 0 0.00 0.0% ANGLE DRIVEWAY 1 0.02 2.9% REAR-END DRIVE 1 0.02 2.9% SIDESWIPE OPP 0 0.00 0.0% HEAD ON LEFT 2 0.03 5.9% DUAL LEFT TURN 0 0.00 0.0% DUAL RIGHT TURN 0 0.00 0.0%
DATA SOURCE: Traffic Count Data (ADT) Roadway Features
Bureau of Transportation Planning (Sufficiency) Intersection Data (Location, Traffic Control, Influence Zone) Traffic and Safety Division Crash Data Department of State Police Analysis includes intersection related crashes only Animal crashes excluded
19

2004-2006 5 LANE 2 WAY SIGNALIZED INTERSECTIONS Average Annual Crash Frequency
ADT LESS THAN 10,000 (Includes intersections with zero ADT) NORTH AND SUPERIOR REGIONS
AVG ADT = 8,955 TOT INTERSECTIONS = 1
AVERAGE AVG ANNUAL
CRASH TYPE ANNUAL FREQ CRASHES/INT % OF TOTAL
TOTAL 1 1.00 100.0% INJURY ACC 0 0.00 0.0% FATAL ACC 0 0.00 0.0% WET 0 0.00 0.0% ICY 0 0.00 0.0% DARK 0 0.00 0.0% MISC SINGLE VEH 0 0.00 0.0% OVERTURNED 0 0.00 0.0% TRAIN 0 0.00 0.0% PRKED VEHICLE 0 0.00 0.0% MISC MULTI VEH 0 0.00 0.0% BACKING 0 0.00 0.0% PARKING 0 0.00 0.0% PEDESTRIAN 0 0.00 0.0% FIXED OBJ 0 0.00 0.0% ON ROAD OBJ 0 0.00 0.0% ANIMAL 0 0.00 0.0% BICYCLE 0 0.00 0.0% HEAD ON 0 0.00 0.0% ANGLE STRAIT 0 0.00 0.0% REAR-END 1 1.00 100.0% ANGLE TURN 0 0.00 0.0% SIDESWIPE SAME 0 0.00 0.0% REAR-END LEFT 0 0.00 0.0% REAR-END RIGHT 0 0.00 0.0% OTHER DRIVEWAY 0 0.00 0.0% ANGLE DRIVEWAY 0 0.00 0.0% REAR-END DRIVE 0 0.00 0.0% SIDESWIPE OPP 0 0.00 0.0% HEAD ON LEFT 0 0.00 0.0% DUAL LEFT TURN 0 0.00 0.0% DUAL RIGHT TURN 0 0.00 0.0%
DATA SOURCE: Traffic Count Data (ADT) Roadway Features
Bureau of Transportation Planning (Sufficiency) Intersection Data (Location, Traffic Control, Influence Zone) Traffic and Safety Division Crash Data Department of State Police Analysis includes intersection related crashes only Animal crashes excluded
20

2004-2006 5 LANE 2 WAY UNSIGNALIZED INTERSECTIONS Average Annual Crash Frequency
ADT 10,000 TO 20,000 NORTH AND SUPERIOR REGIONS
AVG ADT = 14,930 TOT INTERSECTIONS = 177
AVERAGE AVG ANNUAL
CRASH TYPE ANNUAL FREQ CRASHES/INT % OF TOTAL
TOTAL 340 1.92 100.0% INJURY ACC 87 0.49 25.6% FATAL ACC 1 0.01 0.3% WET 73 0.41 21.5% ICY 19 0.11 5.6% DARK 71 0.40 20.9% MISC SINGLE VEH 4 0.02 1.2% OVERTURNED 2 0.01 0.6% TRAIN 0 0.00 0.0% PRKED VEHICLE 1 0.01 0.3% MISC MULTI VEH 11 0.06 3.2% BACKING 10 0.06 2.9% PARKING 1 0.01 0.3% PEDESTRIAN 3 0.02 0.9% FIXED OBJ 15 0.08 4.4% ON ROAD OBJ 2 0.01 0.6% ANIMAL 0 0.00 0.0% BICYCLE 5 0.03 1.5% HEAD ON 4 0.02 1.2% ANGLE STRAIT 62 0.35 18.2% REAR-END 75 0.42 22.1% ANGLE TURN 35 0.20 10.3% SIDESWIPE SAME 45 0.25 13.2% REAR-END LEFT 7 0.04 2.1% REAR-END RIGHT 5 0.03 1.5% OTHER DRIVEWAY 5 0.03 1.5% ANGLE DRIVEWAY 17 0.10 5.0% REAR-END DRIVE 8 0.05 2.4% SIDESWIPE OPP 9 0.05 2.6% HEAD ON LEFT 14 0.08 4.1% DUAL LEFT TURN 1 0.01 0.3% DUAL RIGHT TURN 1 0.01 0.3%
DATA SOURCE: Traffic Count Data (ADT) Roadway Features
Bureau of Transportation Planning (Sufficiency) Intersection Data (Location, Traffic Control, Influence Zone) Traffic and Safety Division Crash Data Department of State Police Analysis includes intersection related crashes only Animal crashes excluded
21
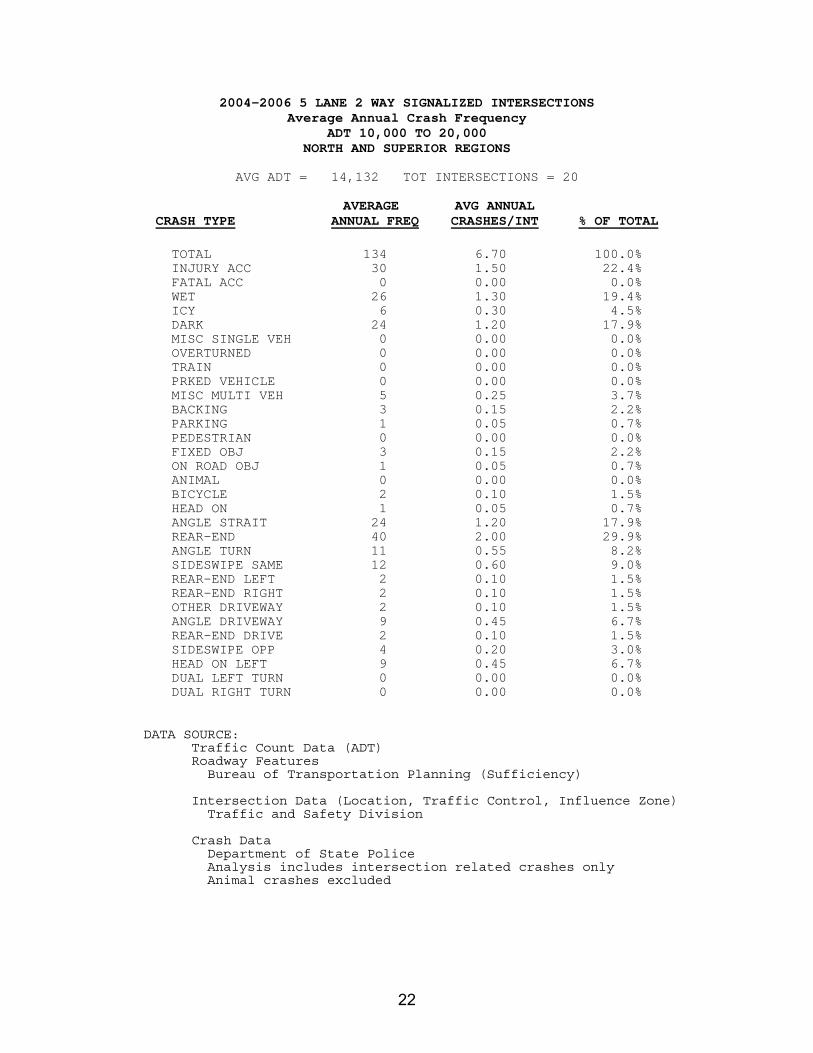
2004-2006 5 LANE 2 WAY SIGNALIZED INTERSECTIONS Average Annual Crash Frequency
ADT 10,000 TO 20,000 NORTH AND SUPERIOR REGIONS
AVG ADT = 14,132 TOT INTERSECTIONS = 20
AVERAGE AVG ANNUAL
CRASH TYPE ANNUAL FREQ CRASHES/INT % OF TOTAL
TOTAL 134 6.70 100.0% INJURY ACC 30 1.50 22.4% FATAL ACC 0 0.00 0.0% WET 26 1.30 19.4% ICY 6 0.30 4.5% DARK 24 1.20 17.9% MISC SINGLE VEH 0 0.00 0.0% OVERTURNED 0 0.00 0.0% TRAIN 0 0.00 0.0% PRKED VEHICLE 0 0.00 0.0% MISC MULTI VEH 5 0.25 3.7% BACKING 3 0.15 2.2% PARKING 1 0.05 0.7% PEDESTRIAN 0 0.00 0.0% FIXED OBJ 3 0.15 2.2% ON ROAD OBJ 1 0.05 0.7% ANIMAL 0 0.00 0.0% BICYCLE 2 0.10 1.5% HEAD ON 1 0.05 0.7% ANGLE STRAIT 24 1.20 17.9% REAR-END 40 2.00 29.9% ANGLE TURN 11 0.55 8.2% SIDESWIPE SAME 12 0.60 9.0% REAR-END LEFT 2 0.10 1.5% REAR-END RIGHT 2 0.10 1.5% OTHER DRIVEWAY 2 0.10 1.5% ANGLE DRIVEWAY 9 0.45 6.7% REAR-END DRIVE 2 0.10 1.5% SIDESWIPE OPP 4 0.20 3.0% HEAD ON LEFT 9 0.45 6.7% DUAL LEFT TURN 0 0.00 0.0% DUAL RIGHT TURN 0 0.00 0.0%
DATA SOURCE: Traffic Count Data (ADT) Roadway Features
Bureau of Transportation Planning (Sufficiency) Intersection Data (Location, Traffic Control, Influence Zone) Traffic and Safety Division Crash Data Department of State Police Analysis includes intersection related crashes only Animal crashes excluded
22

2004-2006 5 LANE 2 WAY UNSIGNALIZED INTERSECTIONS Average Annual Crash Frequency
ADT GREATER THAN 20,000 NORTH AND SUPERIOR REGIONS
AVG ADT = 24,187 TOT INTERSECTIONS = 90
AVERAGE AVG ANNUAL
CRASH TYPE ANNUAL FREQ CRASHES/INT % OF TOTAL
TOTAL 283 3.14 100.0% INJURY ACC 58 0.64 20.5% FATAL ACC 1 0.01 0.4% WET 68 0.76 24.0% ICY 13 0.14 4.6% DARK 51 0.57 18.0% MISC SINGLE VEH 3 0.03 1.1% OVERTURNED 2 0.02 0.7% TRAIN 0 0.00 0.0% PRKED VEHICLE 0 0.00 0.0% MISC MULTI VEH 10 0.11 3.5% BACKING 3 0.03 1.1% PARKING 2 0.02 0.7% PEDESTRIAN 1 0.01 0.4% FIXED OBJ 16 0.18 5.7% ON ROAD OBJ 4 0.04 1.4% ANIMAL 0 0.00 0.0% BICYCLE 0 0.00 0.0% HEAD ON 4 0.04 1.4% ANGLE STRAIT 29 0.32 10.2% REAR-END 100 1.11 35.3% ANGLE TURN 27 0.30 9.5% SIDESWIPE SAME 30 0.33 10.6% REAR-END LEFT 2 0.02 0.7% REAR-END RIGHT 4 0.04 1.4% OTHER DRIVEWAY 2 0.02 0.7% ANGLE DRIVEWAY 14 0.16 4.9% REAR-END DRIVE 10 0.11 3.5% SIDESWIPE OPP 8 0.09 2.8% HEAD ON LEFT 11 0.12 3.9% DUAL LEFT TURN 0 0.00 0.0% DUAL RIGHT TURN 1 0.01 0.4%
DATA SOURCE: Traffic Count Data (ADT) Roadway Features
Bureau of Transportation Planning (Sufficiency) Intersection Data (Location, Traffic Control, Influence Zone) Traffic and Safety Division Crash Data Department of State Police Analysis includes intersection related crashes only Animal crashes excluded
23

2004-2006 5 LANE 2 WAY SIGNALIZED INTERSECTIONS Average Annual Crash Frequency
ADT GREATER THAN 20,000 NORTH AND SUPERIOR REGIONS
AVG ADT = 25,504 TOT INTERSECTIONS = 26
AVERAGE AVG ANNUAL
CRASH TYPE ANNUAL FREQ CRASHES/INT % OF TOTAL
TOTAL 335 12.88 100.0% INJURY ACC 66 2.54 19.7% FATAL ACC 0 0.00 0.0% WET 77 2.96 23.0% ICY 19 0.73 5.7% DARK 69 2.65 20.6% MISC SINGLE VEH 3 0.12 0.9% OVERTURNED 1 0.04 0.3% TRAIN 0 0.00 0.0% PRKED VEHICLE 0 0.00 0.0% MISC MULTI VEH 9 0.35 2.7% BACKING 3 0.12 0.9% PARKING 2 0.08 0.6% PEDESTRIAN 1 0.04 0.3% FIXED OBJ 8 0.31 2.4% ON ROAD OBJ 1 0.04 0.3% ANIMAL 0 0.00 0.0% BICYCLE 1 0.04 0.3% HEAD ON 2 0.08 0.6% ANGLE STRAIT 31 1.19 9.3% REAR-END 144 5.54 43.0% ANGLE TURN 21 0.81 6.3% SIDESWIPE SAME 25 0.96 7.5% REAR-END LEFT 8 0.31 2.4% REAR-END RIGHT 6 0.23 1.8% OTHER DRIVEWAY 4 0.15 1.2% ANGLE DRIVEWAY 25 0.96 7.5% REAR-END DRIVE 15 0.58 4.5% SIDESWIPE OPP 5 0.19 1.5% HEAD ON LEFT 16 0.62 4.8% DUAL LEFT TURN 4 0.15 1.2% DUAL RIGHT TURN 2 0.08 0.6%
DATA SOURCE: Traffic Count Data (ADT) Roadway Features
Bureau of Transportation Planning (Sufficiency) Intersection Data (Location, Traffic Control, Influence Zone) Traffic and Safety Division Crash Data Department of State Police Analysis includes intersection related crashes only Animal crashes excluded
24

2004-2006 7 LANE 2 WAY UNSIGNALIZED INTERSECTIONS Average Annual Crash Frequency
ADT LESS THAN 10,000 (Includes intersections with zero ADT) NORTH AND SUPERIOR REGIONS
AVG ADT = TOT INTERSECTIONS =
AVERAGE AVG ANNUAL
CRASH TYPE ANNUAL FREQ CRASHES/INT % OF TOTAL
NO LOCATIONS
DATA SOURCE: Traffic Count Data (ADT) Roadway Features
Bureau of Transportation Planning (Sufficiency) Intersection Data (Location, Traffic Control, Influence Zone) Traffic and Safety Division Crash Data Department of State Police Analysis includes intersection related crashes only Animal crashes excluded
25

2004-2006 7 LANE 2 WAY SIGNALIZED INTERSECTIONS Average Annual Crash Frequency
ADT LESS THAN 10,000 (Includes intersections with zero ADT) NORTH AND SUPERIOR REGIONS
AVG ADT = TOT INTERSECTIONS =
AVERAGE AVG ANNUAL
CRASH TYPE ANNUAL FREQ CRASHES/INT % OF TOTAL
NO LOCATIONS
DATA SOURCE: Traffic Count Data (ADT) Roadway Features
Bureau of Transportation Planning (Sufficiency) Intersection Data (Location, Traffic Control, Influence Zone) Traffic and Safety Division Crash Data Department of State Police Analysis includes intersection related crashes only Animal crashes excluded
26

2004-2006 7 LANE 2 WAY UNSIGNALIZED INTERSECTIONS Average Annual Crash Frequency
ADT 10,000 TO 20,000 NORTH AND SUPERIOR REGIONS
AVG ADT = TOT INTERSECTIONS =
AVERAGE AVG ANNUAL
CRASH TYPE ANNUAL FREQ CRASHES/INT % OF TOTAL
NO LOCATIONS
DATA SOURCE: Traffic Count Data (ADT) Roadway Features
Bureau of Transportation Planning (Sufficiency) Intersection Data (Location, Traffic Control, Influence Zone) Traffic and Safety Division Crash Data Department of State Police Analysis includes intersection related crashes only Animal crashes excluded
27

2004-2006 7 LANE 2 WAY SIGNALIZED INTERSECTIONS Average Annual Crash Frequency
ADT 10,000 TO 20,000 NORTH AND SUPERIOR REGIONS
AVG ADT = TOT INTERSECTIONS =
AVERAGE AVG ANNUAL
CRASH TYPE ANNUAL FREQ CRASHES/INT % OF TOTAL
NO LOCATIONS
DATA SOURCE: Traffic Count Data (ADT) Roadway Features
Bureau of Transportation Planning (Sufficiency) Intersection Data (Location, Traffic Control, Influence Zone) Traffic and Safety Division Crash Data Department of State Police Analysis includes intersection related crashes only Animal crashes excluded
28

2004-2006 7 LANE 2 WAY UNSIGNALIZED INTERSECTIONS Average Annual Crash Frequency
ADT GREATER THAN 20,000 NORTH AND SUPERIOR REGIONS
AVG ADT = TOT INTERSECTIONS =
AVERAGE AVG ANNUAL
CRASH TYPE ANNUAL FREQ CRASHES/INT % OF TOTAL
NO LOCATIONS
DATA SOURCE: Traffic Count Data (ADT) Roadway Features
Bureau of Transportation Planning (Sufficiency) Intersection Data (Location, Traffic Control, Influence Zone) Traffic and Safety Division Crash Data Department of State Police Analysis includes intersection related crashes only Animal crashes excluded
29

2004-2006 7 LANE 2 WAY SIGNALIZED INTERSECTIONS Average Annual Crash Frequency
ADT GREATER THAN 20,000 NORTH AND SUPERIOR REGIONS
AVG ADT = TOT INTERSECTIONS =
AVERAGE AVG ANNUAL
CRASH TYPE ANNUAL FREQ CRASHES/INT % OF TOTAL
NO LOCATIONS
DATA SOURCE: Traffic Count Data (ADT) Roadway Features
Bureau of Transportation Planning (Sufficiency) Intersection Data (Location, Traffic Control, Influence Zone) Traffic and Safety Division Crash Data Department of State Police Analysis includes intersection related crashes only Animal crashes excluded
30
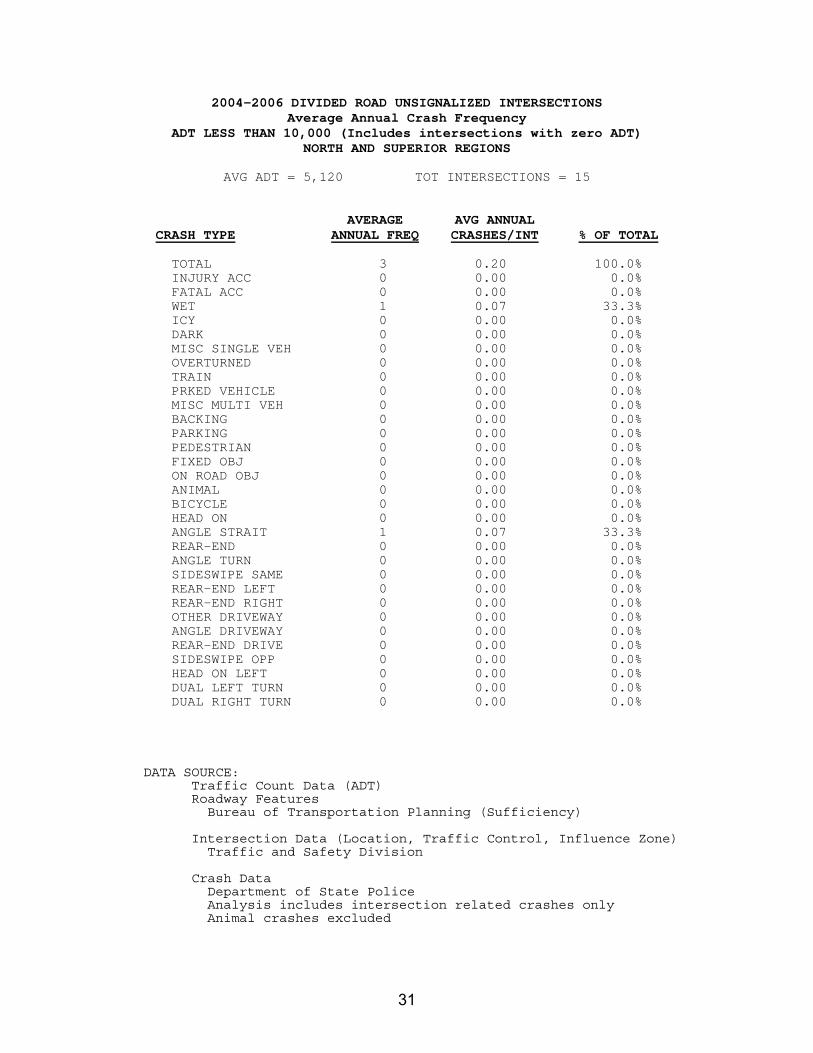
2004-2006 DIVIDED ROAD UNSIGNALIZED INTERSECTIONS Average Annual Crash Frequency
ADT LESS THAN 10,000 (Includes intersections with zero ADT) NORTH AND SUPERIOR REGIONS
AVG ADT = 5,120 TOT INTERSECTIONS = 15
AVERAGE AVG ANNUAL CRASH TYPE ANNUAL FREQ CRASHES/INT % OF TOTAL
TOTAL 3 0.20 100.0% INJURY ACC 0 0.00 0.0% FATAL ACC 0 0.00 0.0% WET 1 0.07 33.3% ICY 0 0.00 0.0% DARK 0 0.00 0.0% MISC SINGLE VEH 0 0.00 0.0% OVERTURNED 0 0.00 0.0% TRAIN 0 0.00 0.0% PRKED VEHICLE 0 0.00 0.0% MISC MULTI VEH 0 0.00 0.0% BACKING 0 0.00 0.0% PARKING 0 0.00 0.0% PEDESTRIAN 0 0.00 0.0% FIXED OBJ 0 0.00 0.0% ON ROAD OBJ 0 0.00 0.0% ANIMAL 0 0.00 0.0% BICYCLE 0 0.00 0.0% HEAD ON 0 0.00 0.0% ANGLE STRAIT 1 0.07 33.3% REAR-END 0 0.00 0.0% ANGLE TURN 0 0.00 0.0% SIDESWIPE SAME 0 0.00 0.0% REAR-END LEFT 0 0.00 0.0% REAR-END RIGHT 0 0.00 0.0% OTHER DRIVEWAY 0 0.00 0.0% ANGLE DRIVEWAY 0 0.00 0.0% REAR-END DRIVE 0 0.00 0.0% SIDESWIPE OPP 0 0.00 0.0% HEAD ON LEFT 0 0.00 0.0% DUAL LEFT TURN 0 0.00 0.0% DUAL RIGHT TURN 0 0.00 0.0%
DATA SOURCE: Traffic Count Data (ADT) Roadway Features
Bureau of Transportation Planning (Sufficiency) Intersection Data (Location, Traffic Control, Influence Zone) Traffic and Safety Division Crash Data Department of State Police Analysis includes intersection related crashes only Animal crashes excluded
31
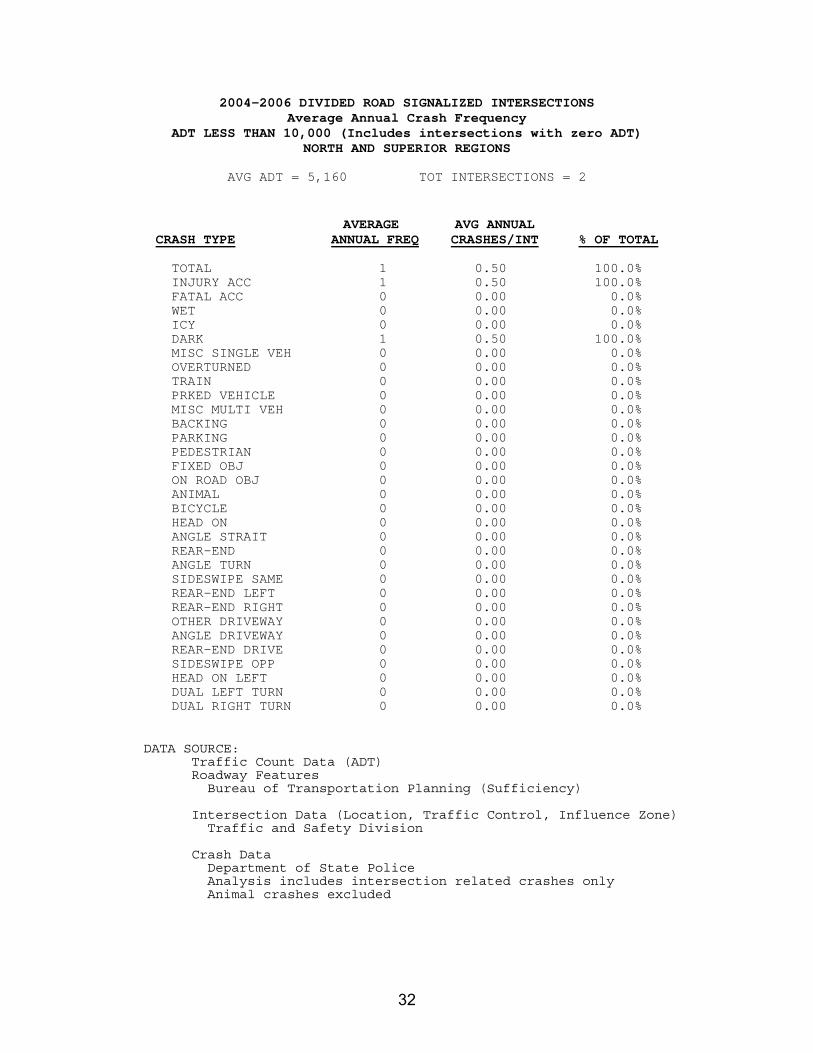
2004-2006 DIVIDED ROAD SIGNALIZED INTERSECTIONS Average Annual Crash Frequency
ADT LESS THAN 10,000 (Includes intersections with zero ADT) NORTH AND SUPERIOR REGIONS
AVG ADT = 5,160 TOT INTERSECTIONS = 2
AVERAGE AVG ANNUAL
CRASH TYPE ANNUAL FREQ CRASHES/INT % OF TOTAL
TOTAL 1 0.50 100.0% INJURY ACC 1 0.50 100.0% FATAL ACC 0 0.00 0.0% WET 0 0.00 0.0% ICY 0 0.00 0.0% DARK 1 0.50 100.0% MISC SINGLE VEH 0 0.00 0.0% OVERTURNED 0 0.00 0.0% TRAIN 0 0.00 0.0% PRKED VEHICLE 0 0.00 0.0% MISC MULTI VEH 0 0.00 0.0% BACKING 0 0.00 0.0% PARKING 0 0.00 0.0% PEDESTRIAN 0 0.00 0.0% FIXED OBJ 0 0.00 0.0% ON ROAD OBJ 0 0.00 0.0% ANIMAL 0 0.00 0.0% BICYCLE 0 0.00 0.0% HEAD ON 0 0.00 0.0% ANGLE STRAIT 0 0.00 0.0% REAR-END 0 0.00 0.0% ANGLE TURN 0 0.00 0.0% SIDESWIPE SAME 0 0.00 0.0% REAR-END LEFT 0 0.00 0.0% REAR-END RIGHT 0 0.00 0.0% OTHER DRIVEWAY 0 0.00 0.0% ANGLE DRIVEWAY 0 0.00 0.0% REAR-END DRIVE 0 0.00 0.0% SIDESWIPE OPP 0 0.00 0.0% HEAD ON LEFT 0 0.00 0.0% DUAL LEFT TURN 0 0.00 0.0% DUAL RIGHT TURN 0 0.00 0.0%
DATA SOURCE: Traffic Count Data (ADT) Roadway Features
Bureau of Transportation Planning (Sufficiency) Intersection Data (Location, Traffic Control, Influence Zone) Traffic and Safety Division Crash Data Department of State Police Analysis includes intersection related crashes only Animal crashes excluded
32

2004-2006 DIVIDED ROAD UNSIGNALIZED INTERSECTIONS Average Annual Crash Frequency
ADT 10,000 TO 20,000 NORTH AND SUPERIOR REGIONS
AVG ADT = 14,412 TOT INTERSECTIONS = 37
AVERAGE AVG ANNUAL
CRASH TYPE ANNUAL FREQ CRASHES/INT % OF TOTAL
TOTAL 73 1.97 100.0% INJURY ACC 20 0.54 27.4% FATAL ACC 0 0.00 0.0% WET 14 0.38 19.2% ICY 5 0.14 6.8% DARK 17 0.46 23.3% MISC SINGLE VEH 2 0.05 2.7% OVERTURNED 1 0.03 1.4% TRAIN 0 0.00 0.0% PRKED VEHICLE 0 0.00 0.0% MISC MULTI VEH 3 0.08 4.1% BACKING 1 0.03 1.4% PARKING 0 0.00 0.0% PEDESTRIAN 1 0.03 1.4% FIXED OBJ 7 0.19 9.6% ON ROAD OBJ 1 0.03 1.4% ANIMAL 0 0.00 0.0% BICYCLE 1 0.03 1.4% HEAD ON 1 0.03 1.4% ANGLE STRAIT 18 0.49 24.7% REAR-END 20 0.54 27.4% ANGLE TURN 3 0.08 4.1% SIDESWIPE SAME 8 0.22 11.0% REAR-END LEFT 1 0.03 1.4% REAR-END RIGHT 3 0.08 4.1% OTHER DRIVEWAY 0 0.00 0.0% ANGLE DRIVEWAY 0 0.00 0.0% REAR-END DRIVE 1 0.03 1.4% SIDESWIPE OPP 2 0.05 2.7% HEAD ON LEFT 2 0.05 2.7% DUAL LEFT TURN 0 0.00 0.0% DUAL RIGHT TURN 0 0.00 0.0%
DATA SOURCE: Traffic Count Data (ADT) Roadway Features
Bureau of Transportation Planning (Sufficiency) Intersection Data (Location, Traffic Control, Influence Zone) Traffic and Safety Division Crash Data Department of State Police Analysis includes intersection related crashes only Animal crashes excluded
33

2004-2006 DIVIDED ROAD SIGNALIZED INTERSECTIONS Average Annual Crash Frequency
ADT 10,000 TO 20,000 NORTH AND SUPERIOR REGIONS
AVG ADT = 14,407 TOT INTERSECTIONS = 5
AVERAGE AVG ANNUAL
CRASH TYPE ANNUAL FREQ CRASHES/INT % OF TOTAL
TOTAL 22 4.40 100.0% INJURY ACC 5 1.00 22.7% FATAL ACC 0 0.00 0.0% WET 5 1.00 22.7% ICY 1 0.20 4.5% DARK 5 1.00 22.7% MISC SINGLE VEH 0 0.00 0.0% OVERTURNED 0 0.00 0.0% TRAIN 0 0.00 0.0% PRKED VEHICLE 0 0.00 0.0% MISC MULTI VEH 0 0.00 0.0% BACKING 0 0.00 0.0% PARKING 0 0.00 0.0% PEDESTRIAN 0 0.00 0.0% FIXED OBJ 1 0.20 4.5% ON ROAD OBJ 1 0.20 4.5% ANIMAL 0 0.00 0.0% BICYCLE 0 0.00 0.0% HEAD ON 0 0.00 0.0% ANGLE STRAIT 5 1.00 22.7% REAR-END 10 2.00 45.5% ANGLE TURN 0 0.00 0.0% SIDESWIPE SAME 1 0.20 4.5% REAR-END LEFT 0 0.00 0.0% REAR-END RIGHT 3 0.60 13.6% OTHER DRIVEWAY 0 0.00 0.0% ANGLE DRIVEWAY 0 0.00 0.0% REAR-END DRIVE 1 0.20 4.5% SIDESWIPE OPP 0 0.00 0.0% HEAD ON LEFT 0 0.00 0.0% DUAL LEFT TURN 0 0.00 0.0% DUAL RIGHT TURN 0 0.00 0.0%
DATA SOURCE: Traffic Count Data (ADT) Roadway Features
Bureau of Transportation Planning (Sufficiency) Intersection Data (Location, Traffic Control, Influence Zone) Traffic and Safety Division Crash Data Department of State Police Analysis includes intersection related crashes only Animal crashes excluded
34

2004-2006 DIVIDED ROAD UNSIGNALIZED INTERSECTIONS Average Annual Crash Frequency
ADT GREATER THAN 20,000 NORTH AND SUPERIOR REGIONS
AVG ADT = 29,250 TOT INTERSECTIONS = 34
AVERAGE AVG ANNUAL
CRASH TYPE ANNUAL FREQ CRASHES/INT % OF TOTAL
TOTAL 105 3.09 100.0% INJURY ACC 25 0.74 23.8% FATAL ACC 0 0.00 0.0% WET 17 0.50 16.2% ICY 4 0.12 3.8% DARK 15 0.44 14.3% MISC SINGLE VEH 0 0.00 0.0% OVERTURNED 0 0.00 0.0% TRAIN 0 0.00 0.0% PRKED VEHICLE 0 0.00 0.0% MISC MULTI VEH 6 0.18 5.7% BACKING 1 0.03 1.0% PARKING 1 0.03 1.0% PEDESTRIAN 0 0.00 0.0% FIXED OBJ 2 0.06 1.9% ON ROAD OBJ 2 0.06 1.9% ANIMAL 0 0.00 0.0% BICYCLE 1 0.03 1.0% HEAD ON 0 0.00 0.0% ANGLE STRAIT 13 0.38 12.4% REAR-END 48 1.41 45.7% ANGLE TURN 4 0.12 3.8% SIDESWIPE SAME 8 0.24 7.6% REAR-END LEFT 2 0.06 1.9% REAR-END RIGHT 5 0.15 4.8% OTHER DRIVEWAY 1 0.03 1.0% ANGLE DRIVEWAY 2 0.06 1.9% REAR-END DRIVE 4 0.12 3.8% SIDESWIPE OPP 2 0.06 1.9% HEAD ON LEFT 1 0.03 1.0% DUAL LEFT TURN 0 0.00 0.0% DUAL RIGHT TURN 1 0.03 1.0%
DATA SOURCE: Traffic Count Data (ADT) Roadway Features
Bureau of Transportation Planning (Sufficiency) Intersection Data (Location, Traffic Control, Influence Zone) Traffic and Safety Division Crash Data Department of State Police Analysis includes intersection related crashes only Animal crashes excluded
35

2004-2006 DIVIDED ROAD SIGNALIZED INTERSECTIONS Average Annual Crash Frequency
ADT GREATER THAN 20,000 NORTH AND SUPERIOR REGIONS
AVG ADT = 25,825 TOT INTERSECTIONS = 6
AVERAGE AVG ANNUAL
CRASH TYPE ANNUAL FREQ CRASHES/INT % OF TOTAL
TOTAL 29 4.83 100.0% INJURY ACC 6 1.00 20.7% FATAL ACC 0 0.00 0.0% WET 5 0.83 17.2% ICY 0 0.00 0.0% DARK 4 0.67 13.8% MISC SINGLE VEH 0 0.00 0.0% OVERTURNED 0 0.00 0.0% TRAIN 0 0.00 0.0% PRKED VEHICLE 0 0.00 0.0% MISC MULTI VEH 1 0.17 3.4% BACKING 1 0.17 3.4% PARKING 0 0.00 0.0% PEDESTRIAN 0 0.00 0.0% FIXED OBJ 2 0.33 6.9% ON ROAD OBJ 0 0.00 0.0% ANIMAL 0 0.00 0.0% BICYCLE 0 0.00 0.0% HEAD ON 0 0.00 0.0% ANGLE STRAIT 3 0.50 10.3% REAR-END 13 2.17 44.8% ANGLE TURN 1 0.17 3.4% SIDESWIPE SAME 4 0.67 13.8% REAR-END LEFT 0 0.00 0.0% REAR-END RIGHT 0 0.00 0.0% OTHER DRIVEWAY 0 0.00 0.0% ANGLE DRIVEWAY 0 0.00 0.0% REAR-END DRIVE 2 0.33 6.9% SIDESWIPE OPP 1 0.17 3.4% HEAD ON LEFT 1 0.17 3.4% DUAL LEFT TURN 0 0.00 0.0% DUAL RIGHT TURN 0 0.00 0.0%
DATA SOURCE: Traffic Count Data (ADT) Roadway Features
Bureau of Transportation Planning (Sufficiency) Intersection Data (Location, Traffic Control, Influence Zone) Traffic and Safety Division Crash Data Department of State Police Analysis includes intersection related crashes only Animal crashes excluded
36

2004-2006 2 LANE 2 WAY UNSIGNALIZED INTERSECTIONS Average Annual Crash Frequency
ADT LESS THAN 10,000 (Includes intersections with zero ADT) GRAND, BAY, SOUTHWEST, UNIVERSITY AND METRO REGIONS
AVG ADT = 5,030 TOT INTERSECTIONS = 5,202
AVERAGE AVG ANNUAL
CRASH TYPE ANNUAL FREQ CRASHES/INT % OF TOTAL
TOTAL 2996 0.58 100.0% INJURY ACC 914 0.18 30.5% FATAL ACC 28 0.01 0.9% WET 511 0.10 17.1% ICY 174 0.03 5.8% DARK 807 0.16 26.9% MISC SINGLE VEH 77 0.01 2.6% OVERTURNED 71 0.01 2.4% TRAIN 0 0.00 0.0% PRKED VEHICLE 6 0.00 0.2% MISC MULTI VEH 184 0.04 6.1% BACKING 67 0.01 2.2% PARKING 8 0.00 0.3% PEDESTRIAN 15 0.00 0.5% FIXED OBJ 505 0.10 16.9% ON ROAD OBJ 30 0.01 1.0% ANIMAL 0 0.00 0.0% BICYCLE 12 0.00 0.4% HEAD ON 52 0.01 1.7% ANGLE STRAIT 568 0.11 19.0% REAR-END 555 0.11 18.5% ANGLE TURN 164 0.03 5.5% SIDESWIPE SAME 169 0.03 5.6% REAR-END LEFT 132 0.03 4.4% REAR-END RIGHT 56 0.01 1.9% OTHER DRIVEWAY 19 0.00 0.6% ANGLE DRIVEWAY 44 0.01 1.5% REAR-END DRIVE 53 0.01 1.8% SIDESWIPE OPP 86 0.02 2.9% HEAD ON LEFT 107 0.02 3.6% DUAL LEFT TURN 2 0.00 0.1% DUAL RIGHT TURN 12 0.00 0.4%
DATA SOURCE: Traffic Count Data (ADT) Roadway Features
Bureau of Transportation Planning (Sufficiency) Intersection Data (Location, Traffic Control, Influence Zone) Traffic and Safety Division Crash Data Department of State Police Analysis includes intersection related crashes only Animal crashes excluded
37

2004-2006 2 LANE 2 WAY SIGNALIZED INTERSECTIONS Average Annual Crash Frequency
ADT LESS THAN 10,000 (Includes intersections with zero ADT) GRAND, BAY, SOUTHWEST, UNIVERSITY AND METRO REGIONS
AVG ADT = 6,649 TOT INTERSECTIONS = 112
AVERAGE AVG ANNUAL
CRASH TYPE ANNUAL FREQ CRASHES/INT % OF TOTAL
TOTAL 318 2.84 100.0% INJURY ACC 72 0.64 22.6% FATAL ACC 1 0.01 0.3% WET 68 0.61 21.4% ICY 6 0.05 1.9% DARK 90 0.80 28.3% MISC SINGLE VEH 4 0.04 1.3% OVERTURNED 2 0.02 0.6% TRAIN 0 0.00 0.0% PRKED VEHICLE 0 0.00 0.0% MISC MULTI VEH 15 0.13 4.7% BACKING 9 0.08 2.8% PARKING 3 0.03 0.9% PEDESTRIAN 3 0.03 0.9% FIXED OBJ 14 0.13 4.4% ON ROAD OBJ 2 0.02 0.6% ANIMAL 0 0.00 0.0% BICYCLE 4 0.04 1.3% HEAD ON 2 0.02 0.6% ANGLE STRAIT 51 0.46 16.0% REAR-END 90 0.80 28.3% ANGLE TURN 17 0.15 5.3% SIDESWIPE SAME 29 0.26 9.1% REAR-END LEFT 7 0.06 2.2% REAR-END RIGHT 5 0.04 1.6% OTHER DRIVEWAY 4 0.04 1.3% ANGLE DRIVEWAY 13 0.12 4.1% REAR-END DRIVE 7 0.06 2.2% SIDESWIPE OPP 10 0.09 3.1% HEAD ON LEFT 22 0.20 6.9% DUAL LEFT TURN 1 0.01 0.3% DUAL RIGHT TURN 3 0.03 0.9%
DATA SOURCE: Traffic Count Data (ADT) Roadway Features
Bureau of Transportation Planning (Sufficiency) Intersection Data (Location, Traffic Control, Influence Zone) Traffic and Safety Division Crash Data Department of State Police Analysis includes intersection related crashes only Animal crashes excluded
38

2004-2006 2 LANE 2 WAY UNSIGNALIZED INTERSECTIONS Average Annual Crash Frequency
ADT 10,000 TO 20,000 GRAND, BAY, SOUTHWEST, UNIVERSITY AND METRO REGIONS
AVG ADT = 13,536 TOT INTERSECTIONS = 911
AVERAGE AVG ANNUAL
CRASH TYPE ANNUAL FREQ CRASHES/INT % OF TOTAL
TOTAL 1486 1.63 100.0% INJURY ACC 410 0.45 27.6% FATAL ACC 8 0.01 0.5% WET 311 0.34 20.9% ICY 59 0.06 4.0% DARK 371 0.41 25.0% MISC SINGLE VEH 18 0.02 1.2% OVERTURNED 16 0.02 1.1% TRAIN 0 0.00 0.0% PRKED VEHICLE 2 0.00 0.1% MISC MULTI VEH 74 0.08 5.0% BACKING 26 0.03 1.7% PARKING 3 0.00 0.2% PEDESTRIAN 7 0.01 0.5% FIXED OBJ 140 0.15 9.4% ON ROAD OBJ 11 0.01 0.7% ANIMAL 0 0.00 0.0% BICYCLE 9 0.01 0.6% HEAD ON 24 0.03 1.6% ANGLE STRAIT 180 0.20 12.1% REAR-END 500 0.55 33.6% ANGLE TURN 99 0.11 6.7% SIDESWIPE SAME 84 0.09 5.7% REAR-END LEFT 63 0.07 4.2% REAR-END RIGHT 23 0.03 1.5% OTHER DRIVEWAY 16 0.02 1.1% ANGLE DRIVEWAY 33 0.04 2.2% REAR-END DRIVE 51 0.06 3.4% SIDESWIPE OPP 40 0.04 2.7% HEAD ON LEFT 58 0.06 3.9% DUAL LEFT TURN 2 0.00 0.1% DUAL RIGHT TURN 7 0.01 0.5%
DATA SOURCE: Traffic Count Data (ADT) Roadway Features
Bureau of Transportation Planning (Sufficiency) Intersection Data (Location, Traffic Control, Influence Zone) Traffic and Safety Division Crash Data Department of State Police Analysis includes intersection related crashes only Animal crashes excluded
39
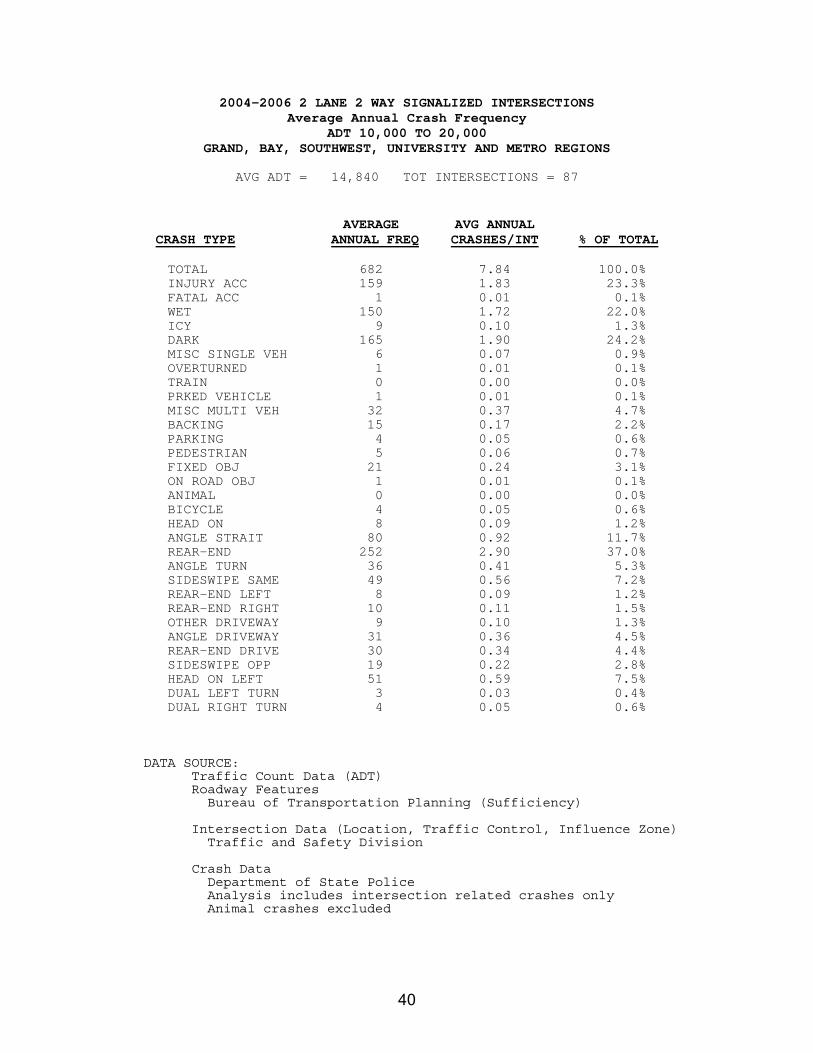
2004-2006 2 LANE 2 WAY SIGNALIZED INTERSECTIONS Average Annual Crash Frequency
ADT 10,000 TO 20,000 GRAND, BAY, SOUTHWEST, UNIVERSITY AND METRO REGIONS
AVG ADT = 14,840 TOT INTERSECTIONS = 87
AVERAGE AVG ANNUAL
CRASH TYPE ANNUAL FREQ CRASHES/INT % OF TOTAL
TOTAL 682 7.84 100.0% INJURY ACC 159 1.83 23.3% FATAL ACC 1 0.01 0.1% WET 150 1.72 22.0% ICY 9 0.10 1.3% DARK 165 1.90 24.2% MISC SINGLE VEH 6 0.07 0.9% OVERTURNED 1 0.01 0.1% TRAIN 0 0.00 0.0% PRKED VEHICLE 1 0.01 0.1% MISC MULTI VEH 32 0.37 4.7% BACKING 15 0.17 2.2% PARKING 4 0.05 0.6% PEDESTRIAN 5 0.06 0.7% FIXED OBJ 21 0.24 3.1% ON ROAD OBJ 1 0.01 0.1% ANIMAL 0 0.00 0.0% BICYCLE 4 0.05 0.6% HEAD ON 8 0.09 1.2% ANGLE STRAIT 80 0.92 11.7% REAR-END 252 2.90 37.0% ANGLE TURN 36 0.41 5.3% SIDESWIPE SAME 49 0.56 7.2% REAR-END LEFT 8 0.09 1.2% REAR-END RIGHT 10 0.11 1.5% OTHER DRIVEWAY 9 0.10 1.3% ANGLE DRIVEWAY 31 0.36 4.5% REAR-END DRIVE 30 0.34 4.4% SIDESWIPE OPP 19 0.22 2.8% HEAD ON LEFT 51 0.59 7.5% DUAL LEFT TURN 3 0.03 0.4% DUAL RIGHT TURN 4 0.05 0.6%
DATA SOURCE: Traffic Count Data (ADT) Roadway Features
Bureau of Transportation Planning (Sufficiency) Intersection Data (Location, Traffic Control, Influence Zone) Traffic and Safety Division Crash Data Department of State Police Analysis includes intersection related crashes only Animal crashes excluded
40

2004-2006 2 LANE 2 WAY UNSIGNALIZED INTERSECTIONS Average Annual Crash Frequency
ADT GREATER THAN 20,000 GRAND, BAY, SOUTHWEST, UNIVERSITY AND METRO REGIONS
AVG ADT = 22,427 TOT INTERSECTIONS = 56
AVERAGE AVG ANNUAL
CRASH TYPE ANNUAL FREQ CRASHES/INT % OF TOTAL
TOTAL 127 2.27 100.0% INJURY ACC 32 0.57 25.2% FATAL ACC 1 0.02 0.8% WET 31 0.55 24.4% ICY 6 0.11 4.7% DARK 37 0.66 29.1% MISC SINGLE VEH 1 0.02 0.8% OVERTURNED 1 0.02 0.8% TRAIN 0 0.00 0.0% PRKED VEHICLE 0 0.00 0.0% MISC MULTI VEH 7 0.13 5.5% BACKING 2 0.04 1.6% PARKING 1 0.02 0.8% PEDESTRIAN 1 0.02 0.8% FIXED OBJ 10 0.18 7.9% ON ROAD OBJ 3 0.05 2.4% ANIMAL 0 0.00 0.0% BICYCLE 0 0.00 0.0% HEAD ON 3 0.05 2.4% ANGLE STRAIT 13 0.23 10.2% REAR-END 43 0.77 33.9% ANGLE TURN 10 0.18 7.9% SIDESWIPE SAME 9 0.16 7.1% REAR-END LEFT 3 0.05 2.4% REAR-END RIGHT 2 0.04 1.6% OTHER DRIVEWAY 2 0.04 1.6% ANGLE DRIVEWAY 3 0.05 2.4% REAR-END DRIVE 4 0.07 3.1% SIDESWIPE OPP 3 0.05 2.4% HEAD ON LEFT 6 0.11 4.7% DUAL LEFT TURN 0 0.00 0.0% DUAL RIGHT TURN 0 0.00 0.0%
DATA SOURCE: Traffic Count Data (ADT) Roadway Features
Bureau of Transportation Planning (Sufficiency) Intersection Data (Location, Traffic Control, Influence Zone) Traffic and Safety Division Crash Data Department of State Police Analysis includes intersection related crashes only Animal crashes excluded
41

2004-2006 2 LANE 2 WAY SIGNALIZED INTERSECTIONS Average Annual Crash Frequency
ADT GREATER THAN 20,000 GRAND, BAY, SOUTHWEST, UNIVERSITY AND METRO REGIONS
AVG ADT = 22,084 TOT INTERSECTIONS = 5
AVERAGE AVG ANNUAL
CRASH TYPE ANNUAL FREQ CRASHES/INT % OF TOTAL
TOTAL 50 10.00 100.0% INJURY ACC 9 1.80 18.0% FATAL ACC 0 0.00 0.0% WET 11 2.20 22.0% ICY 2 0.40 4.0% DARK 12 2.40 24.0% MISC SINGLE VEH 0 0.00 0.0% OVERTURNED 0 0.00 0.0% TRAIN 0 0.00 0.0% PRKED VEHICLE 0 0.00 0.0% MISC MULTI VEH 1 0.20 2.0% BACKING 0 0.00 0.0% PARKING 0 0.00 0.0% PEDESTRIAN 0 0.00 0.0% FIXED OBJ 2 0.40 4.0% ON ROAD OBJ 0 0.00 0.0% ANIMAL 0 0.00 0.0% BICYCLE 0 0.00 0.0% HEAD ON 1 0.20 2.0% ANGLE STRAIT 6 1.20 12.0% REAR-END 18 3.60 36.0% ANGLE TURN 6 1.20 12.0% SIDESWIPE SAME 4 0.80 8.0% REAR-END LEFT 0 0.00 0.0% REAR-END RIGHT 0 0.00 0.0% OTHER DRIVEWAY 2 0.40 4.0% ANGLE DRIVEWAY 5 1.00 10.0% REAR-END DRIVE 2 0.40 4.0% SIDESWIPE OPP 1 0.20 2.0% HEAD ON LEFT 1 0.20 2.0% DUAL LEFT TURN 0 0.00 0.0% DUAL RIGHT TURN 0 0.00 0.0%
DATA SOURCE: Traffic Count Data (ADT) Roadway Features
Bureau of Transportation Planning (Sufficiency) Intersection Data (Location, Traffic Control, Influence Zone) Traffic and Safety Division Crash Data Department of State Police Analysis includes intersection related crashes only Animal crashes excluded
42

2004-2006 3 LANE 2 WAY UNSIGNALIZED INTERSECTIONS Average Annual Crash Frequency
ADT LESS THAN 10,000 (Includes intersections with zero ADT) GRAND, BAY, SOUTHWEST, UNIVERSITY AND METRO REGIONS
AVG ADT = 7,189 TOT INTERSECTIONS = 485
AVERAGE AVG ANNUAL
CRASH TYPE ANNUAL FREQ CRASHES/INT % OF TOTAL
TOTAL 370 0.76 100.0% INJURY ACC 80 0.16 21.6% FATAL ACC 0 0.00 0.0% WET 70 0.14 18.9% ICY 11 0.02 3.0% DARK 78 0.16 21.1% MISC SINGLE VEH 6 0.01 1.6% OVERTURNED 1 0.00 0.3% TRAIN 0 0.00 0.0% PRKED VEHICLE 2 0.00 0.5% MISC MULTI VEH 27 0.06 7.3% BACKING 19 0.04 5.1% PARKING 3 0.01 0.8% PEDESTRIAN 4 0.01 1.1% FIXED OBJ 29 0.06 7.8% ON ROAD OBJ 2 0.00 0.5% ANIMAL 0 0.00 0.0% BICYCLE 5 0.01 1.4% HEAD ON 4 0.01 1.1% ANGLE STRAIT 62 0.13 16.8% REAR-END 96 0.20 25.9% ANGLE TURN 26 0.05 7.0% SIDESWIPE SAME 23 0.05 6.2% REAR-END LEFT 4 0.01 1.1% REAR-END RIGHT 5 0.01 1.4% OTHER DRIVEWAY 3 0.01 0.8% ANGLE DRIVEWAY 11 0.02 3.0% REAR-END DRIVE 12 0.02 3.2% SIDESWIPE OPP 8 0.02 2.2% HEAD ON LEFT 16 0.03 4.3% DUAL LEFT TURN 2 0.00 0.5% DUAL RIGHT TURN 0 0.00 0.0%
DATA SOURCE: Traffic Count Data (ADT) Roadway Features
Bureau of Transportation Planning (Sufficiency) Intersection Data (Location, Traffic Control, Influence Zone) Traffic and Safety Division Crash Data Department of State Police Analysis includes intersection related crashes only Animal crashes excluded
43

2004-2006 3 LANE 2 WAY SIGNALIZED INTERSECTIONS Average Annual Crash Frequency
ADT LESS THAN 10,000 (Includes intersections with zero ADT) GRAND, BAY, SOUTHWEST, UNIVERSITY AND METRO REGIONS
AVG ADT = 7,413 TOT INTERSECTIONS = 40
AVERAGE AVG ANNUAL
CRASH TYPE ANNUAL FREQ CRASHES/INT % OF TOTAL
TOTAL 125 3.13 100.0% INJURY ACC 31 0.77 24.8% FATAL ACC 0 0.00 0.0% WET 24 0.60 19.2% ICY 3 0.08 2.4% DARK 32 0.80 25.6% MISC SINGLE VEH 1 0.03 0.8% OVERTURNED 0 0.00 0.0% TRAIN 0 0.00 0.0% PRKED VEHICLE 0 0.00 0.0% MISC MULTI VEH 10 0.25 8.0% BACKING 5 0.13 4.0% PARKING 2 0.05 1.6% PEDESTRIAN 2 0.05 1.6% FIXED OBJ 8 0.20 6.4% ON ROAD OBJ 0 0.00 0.0% ANIMAL 0 0.00 0.0% BICYCLE 2 0.05 1.6% HEAD ON 1 0.03 0.8% ANGLE STRAIT 22 0.55 17.6% REAR-END 33 0.82 26.4% ANGLE TURN 6 0.15 4.8% SIDESWIPE SAME 7 0.17 5.6% REAR-END LEFT 2 0.05 1.6% REAR-END RIGHT 2 0.05 1.6% OTHER DRIVEWAY 3 0.08 2.4% ANGLE DRIVEWAY 3 0.08 2.4% REAR-END DRIVE 5 0.13 4.0% SIDESWIPE OPP 4 0.10 3.2% HEAD ON LEFT 9 0.22 7.2% DUAL LEFT TURN 0 0.00 0.0% DUAL RIGHT TURN 0 0.00 0.0%
DATA SOURCE: Traffic Count Data (ADT) Roadway Features
Bureau of Transportation Planning (Sufficiency) Intersection Data (Location, Traffic Control, Influence Zone) Traffic and Safety Division Crash Data Department of State Police Analysis includes intersection related crashes only Animal crashes excluded
44
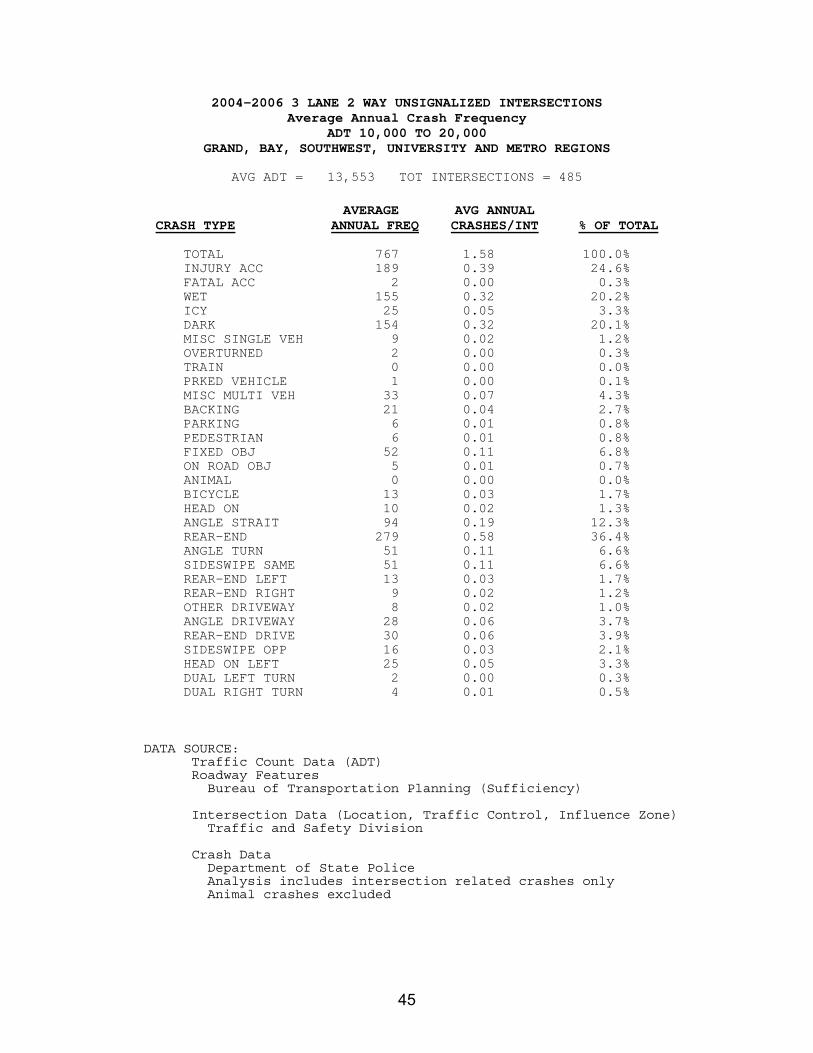
2004-2006 3 LANE 2 WAY UNSIGNALIZED INTERSECTIONS Average Annual Crash Frequency
ADT 10,000 TO 20,000 GRAND, BAY, SOUTHWEST, UNIVERSITY AND METRO REGIONS
AVG ADT = 13,553 TOT INTERSECTIONS = 485
AVERAGE AVG ANNUAL
CRASH TYPE ANNUAL FREQ CRASHES/INT % OF TOTAL
TOTAL 767 1.58 100.0% INJURY ACC 189 0.39 24.6% FATAL ACC 2 0.00 0.3% WET 155 0.32 20.2% ICY 25 0.05 3.3% DARK 154 0.32 20.1% MISC SINGLE VEH 9 0.02 1.2% OVERTURNED 2 0.00 0.3% TRAIN 0 0.00 0.0% PRKED VEHICLE 1 0.00 0.1% MISC MULTI VEH 33 0.07 4.3% BACKING 21 0.04 2.7% PARKING 6 0.01 0.8% PEDESTRIAN 6 0.01 0.8% FIXED OBJ 52 0.11 6.8% ON ROAD OBJ 5 0.01 0.7% ANIMAL 0 0.00 0.0% BICYCLE 13 0.03 1.7% HEAD ON 10 0.02 1.3% ANGLE STRAIT 94 0.19 12.3% REAR-END 279 0.58 36.4% ANGLE TURN 51 0.11 6.6% SIDESWIPE SAME 51 0.11 6.6% REAR-END LEFT 13 0.03 1.7% REAR-END RIGHT 9 0.02 1.2% OTHER DRIVEWAY 8 0.02 1.0% ANGLE DRIVEWAY 28 0.06 3.7% REAR-END DRIVE 30 0.06 3.9% SIDESWIPE OPP 16 0.03 2.1% HEAD ON LEFT 25 0.05 3.3% DUAL LEFT TURN 2 0.00 0.3% DUAL RIGHT TURN 4 0.01 0.5%
DATA SOURCE: Traffic Count Data (ADT) Roadway Features
Bureau of Transportation Planning (Sufficiency) Intersection Data (Location, Traffic Control, Influence Zone) Traffic and Safety Division Crash Data Department of State Police Analysis includes intersection related crashes only Animal crashes excluded
45

2004-2006 3 LANE 2 WAY SIGNALIZED INTERSECTIONS Average Annual Crash Frequency
ADT 10,000 to 20,000 GRAND, BAY, SOUTHWEST, UNIVERSITY AND METRO REGIONS
AVG ADT = 13,961 TOT INTERSECTIONS = 77
AVERAGE AVG ANNUAL
CRASH TYPE ANNUAL FREQ CRASHES/INT % OF TOTAL
TOTAL 446 5.79 100.0% INJURY ACC 97 1.26 21.7% FATAL ACC 0 0.00 0.0% WET 89 1.16 20.0% ICY 12 0.16 2.7% DARK 90 1.17 20.2% MISC SINGLE VEH 4 0.05 0.9% OVERTURNED 0 0.00 0.0% TRAIN 0 0.00 0.0% PRKED VEHICLE 0 0.00 0.0% MISC MULTI VEH 20 0.26 4.5% BACKING 9 0.12 2.0% PARKING 3 0.04 0.7% PEDESTRIAN 5 0.06 1.1% FIXED OBJ 16 0.21 3.6% ON ROAD OBJ 1 0.01 0.2% ANIMAL 0 0.00 0.0% BICYCLE 5 0.06 1.1% HEAD ON 6 0.08 1.3% ANGLE STRAIT 46 0.60 10.3% REAR-END 184 2.39 41.3% ANGLE TURN 24 0.31 5.4% SIDESWIPE SAME 33 0.43 7.4% REAR-END LEFT 3 0.04 0.7% REAR-END RIGHT 6 0.08 1.3% OTHER DRIVEWAY 6 0.08 1.3% ANGLE DRIVEWAY 20 0.26 4.5% REAR-END DRIVE 19 0.25 4.3% SIDESWIPE OPP 9 0.12 2.0% HEAD ON LEFT 23 0.30 5.2% DUAL LEFT TURN 1 0.01 0.2% DUAL RIGHT TURN 3 0.04 0.7%
DATA SOURCE: Traffic Count Data (ADT) Roadway Features
Bureau of Transportation Planning (Sufficiency) Intersection Data (Location, Traffic Control, Influence Zone) Traffic and Safety Division Crash Data Department of State Police Analysis includes intersection related crashes only Animal crashes excluded
46

2004-2006 3 LANE 2 WAY UNSIGNALIZED INTERSECTIONS Average Annual Crash Frequency
ADT GREATER THAN 20,000 GRAND, BAY, SOUTHWEST, UNIVERSITY AND METRO REGIONS
AVG ADT = 22,005 TOT INTERSECTIONS = 23
AVERAGE AVG ANNUAL
CRASH TYPE ANNUAL FREQ CRASHES/INT % OF TOTAL
TOTAL 46 2.00 100.0% INJURY ACC 8 0.35 17.4% FATAL ACC 0 0.00 0.0% WET 9 0.39 19.6% ICY 1 0.04 2.2% DARK 10 0.43 21.7% MISC SINGLE VEH 1 0.04 2.2% OVERTURNED 0 0.00 0.0% TRAIN 0 0.00 0.0% PRKED VEHICLE 0 0.00 0.0% MISC MULTI VEH 1 0.04 2.2% BACKING 1 0.04 2.2% PARKING 0 0.00 0.0% PEDESTRIAN 0 0.00 0.0% FIXED OBJ 4 0.17 8.7% ON ROAD OBJ 1 0.04 2.2% ANIMAL 0 0.00 0.0% BICYCLE 0 0.00 0.0% HEAD ON 0 0.00 0.0% ANGLE STRAIT 3 0.13 6.5% REAR-END 23 1.00 50.0% ANGLE TURN 2 0.09 4.3% SIDESWIPE SAME 2 0.09 4.3% REAR-END LEFT 1 0.04 2.2% REAR-END RIGHT 0 0.00 0.0% OTHER DRIVEWAY 1 0.04 2.2% ANGLE DRIVEWAY 1 0.04 2.2% REAR-END DRIVE 1 0.04 2.2% SIDESWIPE OPP 0 0.00 0.0% HEAD ON LEFT 2 0.09 4.3% DUAL LEFT TURN 0 0.00 0.0% DUAL RIGHT TURN 0 0.00 0.0%
DATA SOURCE: Traffic Count Data (ADT) Roadway Features
Bureau of Transportation Planning (Sufficiency) Intersection Data (Location, Traffic Control, Influence Zone) Traffic and Safety Division Crash Data Department of State Police Analysis includes intersection related crashes only Animal crashes excluded
47

2004-2006 3 LANE 2 WAY SIGNALIZED INTERSECTIONS Average Annual Crash Frequency
ADT GREATER THAN 20,000 GRAND, BAY, SOUTHWEST, UNIVERSITY AND METRO REGIONS
AVG ADT = 22,849 TOT INTERSECTIONS = 7
AVERAGE AVG ANNUAL
CRASH TYPE ANNUAL FREQ CRASHES/INT % OF TOTAL
TOTAL 50 7.14 100.0% INJURY ACC 12 1.71 24.0% FATAL ACC 0 0.00 0.0% WET 10 1.43 20.0% ICY 2 0.29 4.0% DARK 14 2.00 28.0% MISC SINGLE VEH 0 0.00 0.0% OVERTURNED 0 0.00 0.0% TRAIN 0 0.00 0.0% PRKED VEHICLE 0 0.00 0.0% MISC MULTI VEH 1 0.14 2.0% BACKING 0 0.00 0.0% PARKING 0 0.00 0.0% PEDESTRIAN 1 0.14 2.0% FIXED OBJ 1 0.14 2.0% ON ROAD OBJ 0 0.00 0.0% ANIMAL 0 0.00 0.0% BICYCLE 0 0.00 0.0% HEAD ON 0 0.00 0.0% ANGLE STRAIT 4 0.57 8.0% REAR-END 24 3.43 48.0% ANGLE TURN 2 0.29 4.0% SIDESWIPE SAME 5 0.71 10.0% REAR-END LEFT 1 0.14 2.0% REAR-END RIGHT 1 0.14 2.0% OTHER DRIVEWAY 0 0.00 0.0% ANGLE DRIVEWAY 3 0.43 6.0% REAR-END DRIVE 1 0.14 2.0% SIDESWIPE OPP 0 0.00 0.0% HEAD ON LEFT 5 0.71 10.0% DUAL LEFT TURN 0 0.00 0.0% DUAL RIGHT TURN 0 0.00 0.0%
DATA SOURCE: Traffic Count Data (ADT) Roadway Features
Bureau of Transportation Planning (Sufficiency) Intersection Data (Location, Traffic Control, Influence Zone) Traffic and Safety Division Crash Data Department of State Police Analysis includes intersection related crashes only Animal crashes excluded
48

2004-2006 4 LANE 2 WAY UNSIGNALIZED INTERSECTIONS Average Annual Crash Frequency
ADT LESS THAN 10,000 (Includes intersections with zero ADT) GRAND, BAY, SOUTHWEST, UNIVERSITY AND METRO REGIONS
AVG ADT = 7,681 TOT INTERSECTIONS = 503
AVERAGE AVG ANNUAL
CRASH TYPE ANNUAL FREQ CRASHES/INT % OF TOTAL
TOTAL 479 0.95 100.0% INJURY ACC 108 0.21 22.5% FATAL ACC 1 0.00 0.2% WET 89 0.18 18.6% ICY 16 0.03 3.3% DARK 90 0.18 18.8% MISC SINGLE VEH 8 0.02 1.7% OVERTURNED 2 0.00 0.4% TRAIN 0 0.00 0.0% PRKED VEHICLE 1 0.00 0.2% MISC MULTI VEH 29 0.06 6.1% BACKING 19 0.04 4.0% PARKING 3 0.01 0.6% PEDESTRIAN 7 0.01 1.5% FIXED OBJ 36 0.07 7.5% ON ROAD OBJ 3 0.01 0.6% ANIMAL 0 0.00 0.0% BICYCLE 4 0.01 0.8% HEAD ON 7 0.01 1.5% ANGLE STRAIT 79 0.16 16.5% REAR-END 89 0.18 18.6% ANGLE TURN 40 0.08 8.4% SIDESWIPE SAME 54 0.11 11.3% REAR-END LEFT 17 0.03 3.5% REAR-END RIGHT 7 0.01 1.5% OTHER DRIVEWAY 9 0.02 1.9% ANGLE DRIVEWAY 18 0.04 3.8% REAR-END DRIVE 10 0.02 2.1% SIDESWIPE OPP 12 0.02 2.5% HEAD ON LEFT 24 0.05 5.0% DUAL LEFT TURN 0 0.00 0.0% DUAL RIGHT TURN 1 0.00 0.2%
DATA SOURCE: Traffic Count Data (ADT) Roadway Features
Bureau of Transportation Planning (Sufficiency) Intersection Data (Location, Traffic Control, Influence Zone) Traffic and Safety Division Crash Data Department of State Police Analysis includes intersection related crashes only Animal crashes excluded
49
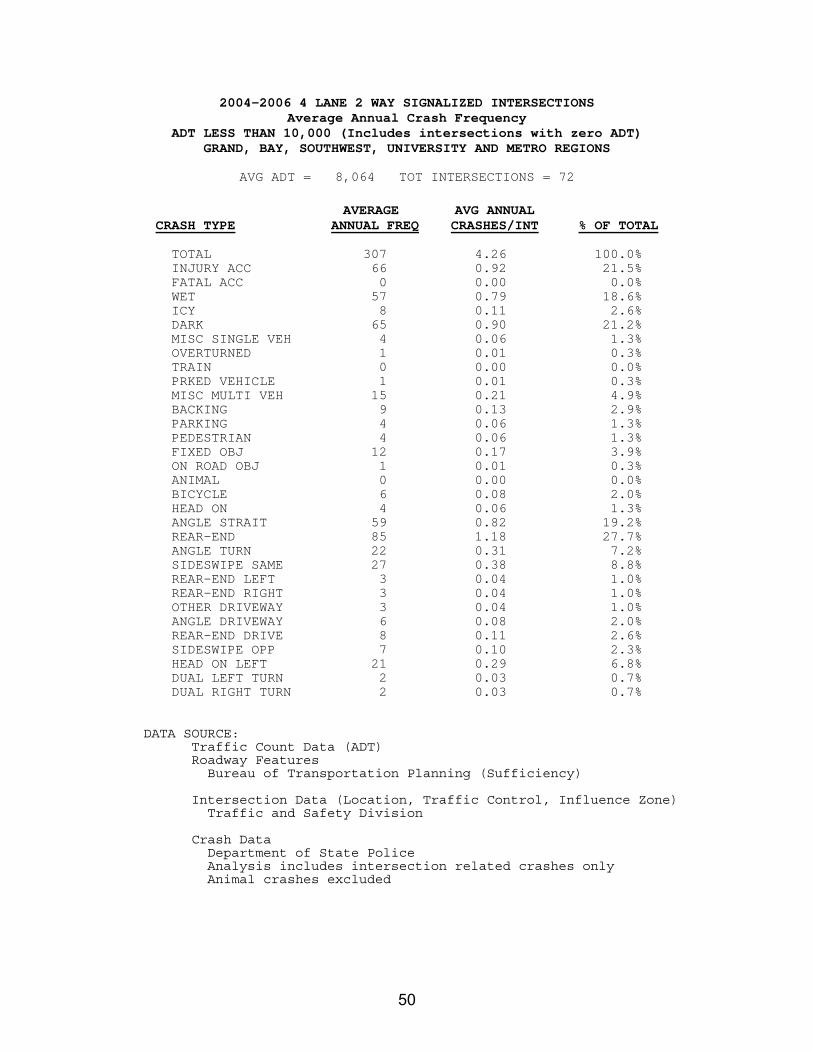
2004-2006 4 LANE 2 WAY SIGNALIZED INTERSECTIONS Average Annual Crash Frequency
ADT LESS THAN 10,000 (Includes intersections with zero ADT) GRAND, BAY, SOUTHWEST, UNIVERSITY AND METRO REGIONS
AVG ADT = 8,064 TOT INTERSECTIONS = 72
AVERAGE AVG ANNUAL
CRASH TYPE ANNUAL FREQ CRASHES/INT % OF TOTAL
TOTAL 307 4.26 100.0% INJURY ACC 66 0.92 21.5% FATAL ACC 0 0.00 0.0% WET 57 0.79 18.6% ICY 8 0.11 2.6% DARK 65 0.90 21.2% MISC SINGLE VEH 4 0.06 1.3% OVERTURNED 1 0.01 0.3% TRAIN 0 0.00 0.0% PRKED VEHICLE 1 0.01 0.3% MISC MULTI VEH 15 0.21 4.9% BACKING 9 0.13 2.9% PARKING 4 0.06 1.3% PEDESTRIAN 4 0.06 1.3% FIXED OBJ 12 0.17 3.9% ON ROAD OBJ 1 0.01 0.3% ANIMAL 0 0.00 0.0% BICYCLE 6 0.08 2.0% HEAD ON 4 0.06 1.3% ANGLE STRAIT 59 0.82 19.2% REAR-END 85 1.18 27.7% ANGLE TURN 22 0.31 7.2% SIDESWIPE SAME 27 0.38 8.8% REAR-END LEFT 3 0.04 1.0% REAR-END RIGHT 3 0.04 1.0% OTHER DRIVEWAY 3 0.04 1.0% ANGLE DRIVEWAY 6 0.08 2.0% REAR-END DRIVE 8 0.11 2.6% SIDESWIPE OPP 7 0.10 2.3% HEAD ON LEFT 21 0.29 6.8% DUAL LEFT TURN 2 0.03 0.7% DUAL RIGHT TURN 2 0.03 0.7%
DATA SOURCE: Traffic Count Data (ADT) Roadway Features
Bureau of Transportation Planning (Sufficiency) Intersection Data (Location, Traffic Control, Influence Zone) Traffic and Safety Division Crash Data Department of State Police Analysis includes intersection related crashes only Animal crashes excluded
50

2004-2006 4 LANE 2 WAY UNSIGNALIZED INTERSECTIONS Average Annual Crash Frequency
ADT 10,000 TO 20,000 GRAND, BAY, SOUTHWEST, UNIVERSITY AND METRO REGIONS
AVG ADT = 14,162 TOT INTERSECTIONS = 706
AVERAGE AVG ANNUAL
CRASH TYPE ANNUAL FREQ CRASHES/INT % OF TOTAL
TOTAL 1385 1.96 100.0% INJURY ACC 361 0.51 26.1% FATAL ACC 3 0.00 0.2% WET 293 0.42 21.2% ICY 35 0.05 2.5% DARK 277 0.39 20.0% MISC SINGLE VEH 13 0.02 0.9% OVERTURNED 4 0.01 0.3% TRAIN 0 0.00 0.0% PRKED VEHICLE 1 0.00 0.1% MISC MULTI VEH 60 0.08 4.3% BACKING 35 0.05 2.5% PARKING 5 0.01 0.4% PEDESTRIAN 14 0.02 1.0% FIXED OBJ 100 0.14 7.2% ON ROAD OBJ 9 0.01 0.6% ANIMAL 0 0.00 0.0% BICYCLE 16 0.02 1.2% HEAD ON 18 0.03 1.3% ANGLE STRAIT 174 0.25 12.6% REAR-END 348 0.49 25.1% ANGLE TURN 134 0.19 9.7% SIDESWIPE SAME 148 0.21 10.7% REAR-END LEFT 58 0.08 4.2% REAR-END RIGHT 9 0.01 0.6% OTHER DRIVEWAY 18 0.03 1.3% ANGLE DRIVEWAY 47 0.07 3.4% REAR-END DRIVE 56 0.08 4.0% SIDESWIPE OPP 34 0.05 2.5% HEAD ON LEFT 81 0.11 5.8% DUAL LEFT TURN 1 0.00 0.1% DUAL RIGHT TURN 2 0.00 0.1%
DATA SOURCE: Traffic Count Data (ADT) Roadway Features
Bureau of Transportation Planning (Sufficiency) Intersection Data (Location, Traffic Control, Influence Zone) Traffic and Safety Division Crash Data Department of State Police Analysis includes intersection related crashes only Animal crashes excluded
51

2004-2006 4 LANE 2 WAY SIGNALIZED INTERSECTIONS Average Annual Crash Frequency
ADT 10,000 TO 20,000 GRAND, BAY, SOUTHWEST, UNIVERSITY AND METRO REGIONS
AVG ADT = 14,361 TOT INTERSECTIONS = 169
AVERAGE AVG ANNUAL
CRASH TYPE ANNUAL FREQ CRASHES/INT % OF TOTAL
TOTAL 1104 6.53 100.0% INJURY ACC 267 1.58 24.2% FATAL ACC 1 0.01 0.1% WET 245 1.45 22.2% ICY 22 0.13 2.0% DARK 241 1.43 21.8% MISC SINGLE VEH 9 0.05 0.8% OVERTURNED 0 0.00 0.0% TRAIN 0 0.00 0.0% PRKED VEHICLE 1 0.01 0.1% MISC MULTI VEH 47 0.28 4.3% BACKING 31 0.18 2.8% PARKING 8 0.05 0.7% PEDESTRIAN 13 0.08 1.2% FIXED OBJ 39 0.23 3.5% ON ROAD OBJ 4 0.02 0.4% ANIMAL 0 0.00 0.0% BICYCLE 14 0.08 1.3% HEAD ON 9 0.05 0.8% ANGLE STRAIT 188 1.11 17.0% REAR-END 331 1.96 30.0% ANGLE TURN 76 0.45 6.9% SIDESWIPE SAME 100 0.59 9.1% REAR-END LEFT 20 0.12 1.8% REAR-END RIGHT 13 0.08 1.2% OTHER DRIVEWAY 8 0.05 0.7% ANGLE DRIVEWAY 39 0.23 3.5% REAR-END DRIVE 37 0.22 3.4% SIDESWIPE OPP 24 0.14 2.2% HEAD ON LEFT 83 0.49 7.5% DUAL LEFT TURN 4 0.02 0.4% DUAL RIGHT TURN 5 0.03 0.5%
DATA SOURCE: Traffic Count Data (ADT) Roadway Features
Bureau of Transportation Planning (Sufficiency) Intersection Data (Location, Traffic Control, Influence Zone) Traffic and Safety Division Crash Data Department of State Police Analysis includes intersection related crashes only Animal crashes excluded
52
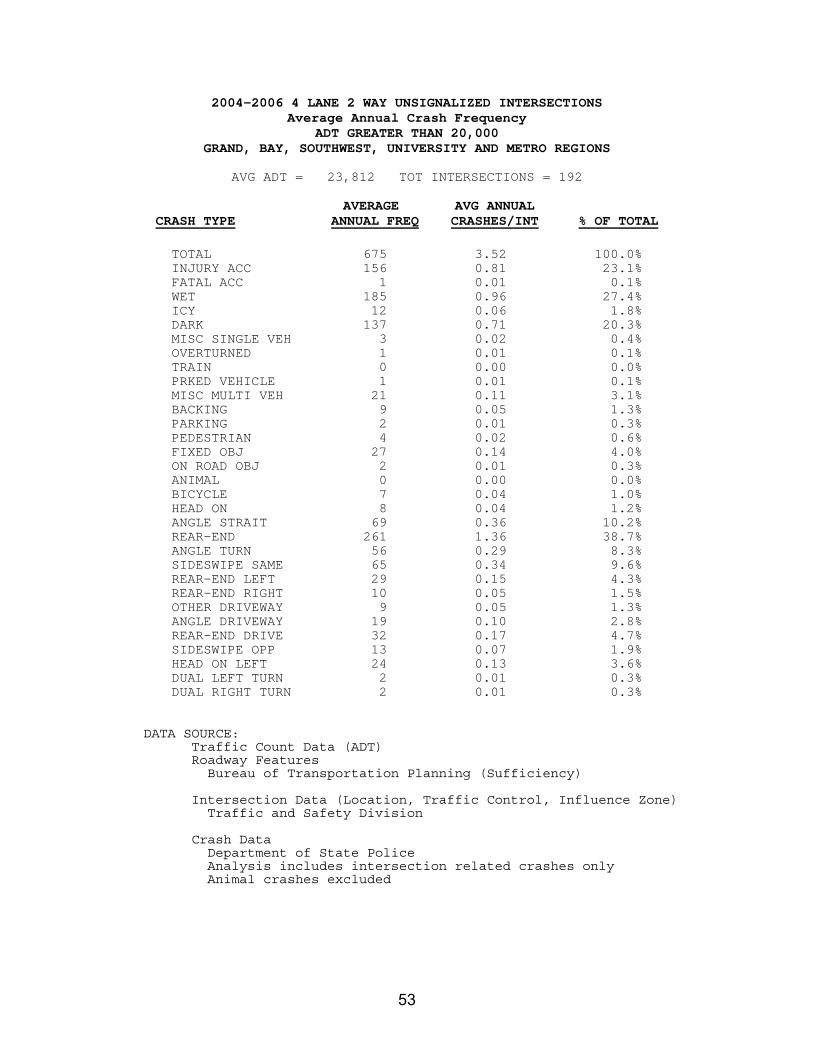
2004-2006 4 LANE 2 WAY UNSIGNALIZED INTERSECTIONS Average Annual Crash Frequency
ADT GREATER THAN 20,000 GRAND, BAY, SOUTHWEST, UNIVERSITY AND METRO REGIONS
AVG ADT = 23,812 TOT INTERSECTIONS = 192
AVERAGE AVG ANNUAL
CRASH TYPE ANNUAL FREQ CRASHES/INT % OF TOTAL
TOTAL 675 3.52 100.0% INJURY ACC 156 0.81 23.1% FATAL ACC 1 0.01 0.1% WET 185 0.96 27.4% ICY 12 0.06 1.8% DARK 137 0.71 20.3% MISC SINGLE VEH 3 0.02 0.4% OVERTURNED 1 0.01 0.1% TRAIN 0 0.00 0.0% PRKED VEHICLE 1 0.01 0.1% MISC MULTI VEH 21 0.11 3.1% BACKING 9 0.05 1.3% PARKING 2 0.01 0.3% PEDESTRIAN 4 0.02 0.6% FIXED OBJ 27 0.14 4.0% ON ROAD OBJ 2 0.01 0.3% ANIMAL 0 0.00 0.0% BICYCLE 7 0.04 1.0% HEAD ON 8 0.04 1.2% ANGLE STRAIT 69 0.36 10.2% REAR-END 261 1.36 38.7% ANGLE TURN 56 0.29 8.3% SIDESWIPE SAME 65 0.34 9.6% REAR-END LEFT 29 0.15 4.3% REAR-END RIGHT 10 0.05 1.5% OTHER DRIVEWAY 9 0.05 1.3% ANGLE DRIVEWAY 19 0.10 2.8% REAR-END DRIVE 32 0.17 4.7% SIDESWIPE OPP 13 0.07 1.9% HEAD ON LEFT 24 0.13 3.6% DUAL LEFT TURN 2 0.01 0.3% DUAL RIGHT TURN 2 0.01 0.3%
DATA SOURCE: Traffic Count Data (ADT) Roadway Features
Bureau of Transportation Planning (Sufficiency) Intersection Data (Location, Traffic Control, Influence Zone) Traffic and Safety Division Crash Data Department of State Police Analysis includes intersection related crashes only Animal crashes excluded
53

2004-2006 4 LANE 2 WAY SIGNALIZED INTERSECTIONS Average Annual Crash Frequency
ADT GREATER THAN 20,000 GRAND, BAY, SOUTHWEST, UNIVERSITY AND METRO REGIONS
AVG ADT = 23,170 TOT INTERSECTIONS = 61
AVERAGE AVG ANNUAL CRASH TYPE ANNUAL FREQ CRASHES/INT % OF TOTAL
TOTAL 640 10.49 100.0% INJURY ACC 129 2.11 20.2% FATAL ACC 1 0.02 0.2% WET 164 2.69 25.6% ICY 14 0.23 2.2% DARK 155 2.54 24.2% MISC SINGLE VEH 3 0.05 0.5% OVERTURNED 0 0.00 0.0% TRAIN 0 0.00 0.0% PRKED VEHICLE 0 0.00 0.0% MISC MULTI VEH 15 0.25 2.3% BACKING 11 0.18 1.7% PARKING 2 0.03 0.3% PEDESTRIAN 6 0.10 0.9% FIXED OBJ 21 0.34 3.3% ON ROAD OBJ 2 0.03 0.3% ANIMAL 0 0.00 0.0% BICYCLE 9 0.15 1.4% HEAD ON 6 0.10 0.9% ANGLE STRAIT 77 1.26 12.0% REAR-END 261 4.28 40.8% ANGLE TURN 37 0.61 5.8% SIDESWIPE SAME 67 1.10 10.5% REAR-END LEFT 12 0.20 1.9% REAR-END RIGHT 9 0.15 1.4% OTHER DRIVEWAY 3 0.05 0.5% ANGLE DRIVEWAY 22 0.36 3.4% REAR-END DRIVE 29 0.48 4.5% SIDESWIPE OPP 14 0.23 2.2% HEAD ON LEFT 29 0.48 4.5% DUAL LEFT TURN 4 0.07 0.6% DUAL RIGHT TURN 2 0.03 0.3%
DATA SOURCE: Traffic Count Data (ADT) Roadway Features
Bureau of Transportation Planning (Sufficiency) Intersection Data (Location, Traffic Control, Influence Zone) Traffic and Safety Division Crash Data Department of State Police Analysis includes intersection related crashes only Animal crashes excluded
54

2004-2006 5 LANE 2 WAY UNSIGNALIZED INTERSECTIONS Average Annual Crash Frequency
ADT LESS THAN 10,000 (Includes intersections with zero ADT) GRAND, BAY, SOUTHWEST, UNIVERSITY AND METRO REGIONS
AVG ADT = 8,875 TOT INTERSECTIONS = 99
AVERAGE AVG ANNUAL
CRASH TYPE ANNUAL FREQ CRASHES/INT % OF TOTAL
TOTAL 85 0.86 100.0% INJURY ACC 17 0.17 20.0% FATAL ACC 0 0.00 0.0% WET 13 0.13 15.3% ICY 3 0.03 3.5% DARK 19 0.19 22.4% MISC SINGLE VEH 1 0.01 1.2% OVERTURNED 0 0.00 0.0% TRAIN 0 0.00 0.0% PRKED VEHICLE 0 0.00 0.0% MISC MULTI VEH 5 0.05 5.9% BACKING 2 0.02 2.4% PARKING 1 0.01 1.2% PEDESTRIAN 2 0.02 2.4% FIXED OBJ 11 0.11 12.9% ON ROAD OBJ 0 0.00 0.0% ANIMAL 0 0.00 0.0% BICYCLE 0 0.00 0.0% HEAD ON 0 0.00 0.0% ANGLE STRAIT 16 0.16 18.8% REAR-END 10 0.10 11.8% ANGLE TURN 14 0.14 16.5% SIDESWIPE SAME 7 0.07 8.2% REAR-END LEFT 0 0.00 0.0% REAR-END RIGHT 5 0.05 5.9% OTHER DRIVEWAY 1 0.01 1.2% ANGLE DRIVEWAY 2 0.02 2.4% REAR-END DRIVE 1 0.01 1.2% SIDESWIPE OPP 2 0.02 2.4% HEAD ON LEFT 4 0.04 4.7% DUAL LEFT TURN 0 0.00 0.0% DUAL RIGHT TURN 0 0.00 0.0%
DATA SOURCE: Traffic Count Data (ADT) Roadway Features
Bureau of Transportation Planning (Sufficiency) Intersection Data (Location, Traffic Control, Influence Zone) Traffic and Safety Division Crash Data Department of State Police Analysis includes intersection related crashes only Animal crashes excluded
55

2004-2006 5 LANE 2 WAY SIGNALIZED INTERSECTIONS Average Annual Crash Frequency
ADT LESS THAN 10,000 (Includes intersections with zero ADT) GRAND, BAY, SOUTHWEST, UNIVERSITY AND METRO REGIONS
AVG ADT = 8,957 TOT INTERSECTIONS = 27
AVERAGE AVG ANNUAL
CRASH TYPE ANNUAL FREQ CRASHES/INT % OF TOTAL
TOTAL 93 3.44 100.0% INJURY ACC 24 0.89 25.8% FATAL ACC 0 0.00 0.0% WET 18 0.67 19.4% ICY 2 0.07 2.2% DARK 22 0.81 23.7% MISC SINGLE VEH 2 0.07 2.2% OVERTURNED 0 0.00 0.0% TRAIN 0 0.00 0.0% PRKED VEHICLE 0 0.00 0.0% MISC MULTI VEH 5 0.19 5.4% BACKING 3 0.11 3.2% PARKING 0 0.00 0.0% PEDESTRIAN 1 0.04 1.1% FIXED OBJ 3 0.11 3.2% ON ROAD OBJ 1 0.04 1.1% ANIMAL 0 0.00 0.0% BICYCLE 1 0.04 1.1% HEAD ON 1 0.04 1.1% ANGLE STRAIT 22 0.81 23.7% REAR-END 21 0.78 22.6% ANGLE TURN 5 0.19 5.4% SIDESWIPE SAME 11 0.41 11.8% REAR-END LEFT 1 0.04 1.1% REAR-END RIGHT 2 0.07 2.2% OTHER DRIVEWAY 1 0.04 1.1% ANGLE DRIVEWAY 1 0.04 1.1% REAR-END DRIVE 2 0.07 2.2% SIDESWIPE OPP 2 0.07 2.2% HEAD ON LEFT 6 0.22 6.5% DUAL LEFT TURN 0 0.00 0.0% DUAL RIGHT TURN 2 0.07 2.2%
DATA SOURCE: Traffic Count Data (ADT) Roadway Features
Bureau of Transportation Planning (Sufficiency) Intersection Data (Location, Traffic Control, Influence Zone) Traffic and Safety Division Crash Data Department of State Police Analysis includes intersection related crashes only Animal crashes excluded
56

2004-2006 5 LANE 2 WAY UNSIGNALIZED INTERSECTIONS Average Annual Crash Frequency
ADT 10,000 TO 20,000 GRAND, BAY, SOUTHWEST, UNIVERSITY AND METRO REGIONS
AVG ADT = 15,690 TOT INTERSECTIONS = 718
AVERAGE AVG ANNUAL
CRASH TYPE ANNUAL FREQ CRASHES/INT % OF TOTAL
TOTAL 1352 1.88 100.0% INJURY ACC 366 0.51 27.1% FATAL ACC 6 0.01 0.4% WET 269 0.37 19.9% ICY 37 0.05 2.7% DARK 329 0.46 24.3% MISC SINGLE VEH 13 0.02 1.0% OVERTURNED 5 0.01 0.4% TRAIN 0 0.00 0.0% PRKED VEHICLE 9 0.01 0.7% MISC MULTI VEH 88 0.12 6.5% BACKING 29 0.04 2.1% PARKING 10 0.01 0.7% PEDESTRIAN 31 0.04 2.3% FIXED OBJ 78 0.11 5.8% ON ROAD OBJ 8 0.01 0.6% ANIMAL 0 0.00 0.0% BICYCLE 15 0.02 1.1% HEAD ON 21 0.03 1.6% ANGLE STRAIT 211 0.29 15.6% REAR-END 319 0.44 23.6% ANGLE TURN 129 0.18 9.5% SIDESWIPE SAME 131 0.18 9.7% REAR-END LEFT 10 0.01 0.7% REAR-END RIGHT 20 0.03 1.5% OTHER DRIVEWAY 22 0.03 1.6% ANGLE DRIVEWAY 64 0.09 4.7% REAR-END DRIVE 33 0.05 2.4% SIDESWIPE OPP 36 0.05 2.7% HEAD ON LEFT 60 0.08 4.4% DUAL LEFT TURN 4 0.01 0.3% DUAL RIGHT TURN 6 0.01 0.4%
DATA SOURCE: Traffic Count Data (ADT) Roadway Features
Bureau of Transportation Planning (Sufficiency) Intersection Data (Location, Traffic Control, Influence Zone) Traffic and Safety Division Crash Data Department of State Police Analysis includes intersection related crashes only Animal crashes excluded
57

2004-2006 5 LANE 2 WAY SIGNALIZED INTERSECTIONS Average Annual Crash Frequency
ADT 10,000 TO 20,000 GRAND, BAY, SOUTHWEST, UNIVERSITY AND METRO REGIONS
AVG ADT = 15,616 TOT INTERSECTIONS = 183
AVERAGE AVG ANNUAL
CRASH TYPE ANNUAL FREQ CRASHES/INT % OF TOTAL
TOTAL 1335 7.30 100.0% INJURY ACC 338 1.85 25.3% FATAL ACC 4 0.02 0.3% WET 271 1.48 20.3% ICY 31 0.17 2.3% DARK 354 1.93 26.5% MISC SINGLE VEH 6 0.03 0.4% OVERTURNED 1 0.01 0.1% TRAIN 0 0.00 0.0% PRKED VEHICLE 5 0.03 0.4% MISC MULTI VEH 87 0.48 6.5% BACKING 22 0.12 1.6% PARKING 8 0.04 0.6% PEDESTRIAN 24 0.13 1.8% FIXED OBJ 39 0.21 2.9% ON ROAD OBJ 3 0.02 0.2% ANIMAL 0 0.00 0.0% BICYCLE 12 0.07 0.9% HEAD ON 20 0.11 1.5% ANGLE STRAIT 212 1.16 15.9% REAR-END 417 2.28 31.2% ANGLE TURN 91 0.50 6.8% SIDESWIPE SAME 140 0.77 10.5% REAR-END LEFT 16 0.09 1.2% REAR-END RIGHT 19 0.10 1.4% OTHER DRIVEWAY 15 0.08 1.1% ANGLE DRIVEWAY 46 0.25 3.4% REAR-END DRIVE 29 0.16 2.2% SIDESWIPE OPP 37 0.20 2.8% HEAD ON LEFT 70 0.38 5.2% DUAL LEFT TURN 8 0.04 0.6% DUAL RIGHT TURN 9 0.05 0.7%
DATA SOURCE: Traffic Count Data (ADT) Roadway Features
Bureau of Transportation Planning (Sufficiency) Intersection Data (Location, Traffic Control, Influence Zone) Traffic and Safety Division Crash Data Department of State Police Analysis includes intersection related crashes only Animal crashes excluded
58
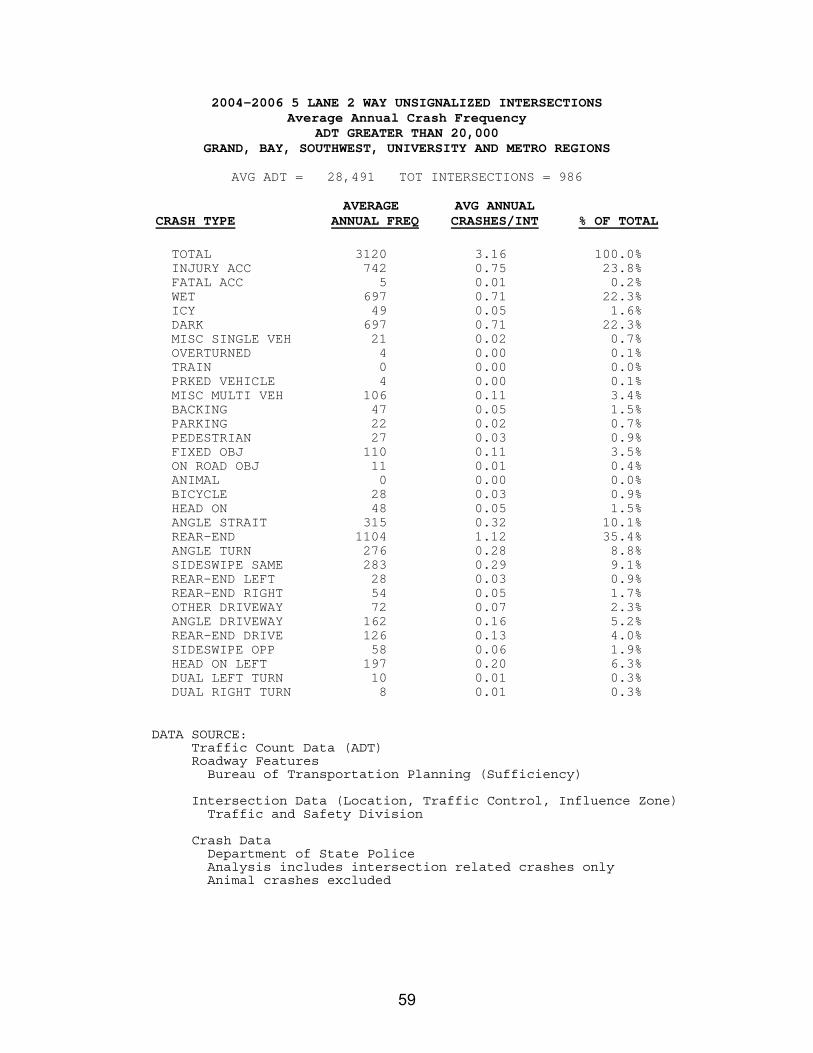
2004-2006 5 LANE 2 WAY UNSIGNALIZED INTERSECTIONS Average Annual Crash Frequency
ADT GREATER THAN 20,000 GRAND, BAY, SOUTHWEST, UNIVERSITY AND METRO REGIONS
AVG ADT = 28,491 TOT INTERSECTIONS = 986
AVERAGE AVG ANNUAL
CRASH TYPE ANNUAL FREQ CRASHES/INT % OF TOTAL
TOTAL 3120 3.16 100.0% INJURY ACC 742 0.75 23.8% FATAL ACC 5 0.01 0.2% WET 697 0.71 22.3% ICY 49 0.05 1.6% DARK 697 0.71 22.3% MISC SINGLE VEH 21 0.02 0.7% OVERTURNED 4 0.00 0.1% TRAIN 0 0.00 0.0% PRKED VEHICLE 4 0.00 0.1% MISC MULTI VEH 106 0.11 3.4% BACKING 47 0.05 1.5% PARKING 22 0.02 0.7% PEDESTRIAN 27 0.03 0.9% FIXED OBJ 110 0.11 3.5% ON ROAD OBJ 11 0.01 0.4% ANIMAL 0 0.00 0.0% BICYCLE 28 0.03 0.9% HEAD ON 48 0.05 1.5% ANGLE STRAIT 315 0.32 10.1% REAR-END 1104 1.12 35.4% ANGLE TURN 276 0.28 8.8% SIDESWIPE SAME 283 0.29 9.1% REAR-END LEFT 28 0.03 0.9% REAR-END RIGHT 54 0.05 1.7% OTHER DRIVEWAY 72 0.07 2.3% ANGLE DRIVEWAY 162 0.16 5.2% REAR-END DRIVE 126 0.13 4.0% SIDESWIPE OPP 58 0.06 1.9% HEAD ON LEFT 197 0.20 6.3% DUAL LEFT TURN 10 0.01 0.3% DUAL RIGHT TURN 8 0.01 0.3%
DATA SOURCE: Traffic Count Data (ADT) Roadway Features
Bureau of Transportation Planning (Sufficiency) Intersection Data (Location, Traffic Control, Influence Zone) Traffic and Safety Division Crash Data Department of State Police Analysis includes intersection related crashes only Animal crashes excluded
59

2004-2006 5 LANE 2 WAY SIGNALIZED INTERSECTIONS Average Annual Crash Frequency
ADT GREATER THAN 20,000 GRAND, BAY, SOUTHWEST, UNIVERSITY AND METRO REGIONS
AVG ADT = 29,548 TOT INTERSECTIONS = 341
AVERAGE AVG ANNUAL
CRASH TYPE ANNUAL FREQ CRASHES/INT % OF TOTAL
TOTAL 5907 17.32 100.0% INJURY ACC 1293 3.79 21.9% FATAL ACC 7 0.02 0.1% WET 1411 4.14 23.9% ICY 96 0.28 1.6% DARK 1440 4.22 24.4% MISC SINGLE VEH 19 0.06 0.3% OVERTURNED 3 0.01 0.1% TRAIN 0 0.00 0.0% PRKED VEHICLE 4 0.01 0.1% MISC MULTI VEH 188 0.55 3.2% BACKING 68 0.20 1.2% PARKING 35 0.10 0.6% PEDESTRIAN 38 0.11 0.6% FIXED OBJ 101 0.30 1.7% ON ROAD OBJ 11 0.03 0.2% ANIMAL 0 0.00 0.0% BICYCLE 38 0.11 0.6% HEAD ON 54 0.16 0.9% ANGLE STRAIT 540 1.58 9.1% REAR-END 2591 7.60 43.9% ANGLE TURN 363 1.06 6.1% SIDESWIPE SAME 495 1.45 8.4% REAR-END LEFT 61 0.18 1.0% REAR-END RIGHT 65 0.19 1.1% OTHER DRIVEWAY 109 0.32 1.8% ANGLE DRIVEWAY 321 0.94 5.4% REAR-END DRIVE 309 0.91 5.2% SIDESWIPE OPP 99 0.29 1.7% HEAD ON LEFT 343 1.01 5.8% DUAL LEFT TURN 32 0.09 0.5% DUAL RIGHT TURN 22 0.06 0.4%
DATA SOURCE: Traffic Count Data (ADT) Roadway Features
Bureau of Transportation Planning (Sufficiency) Intersection Data (Location, Traffic Control, Influence Zone) Traffic and Safety Division Crash Data Department of State Police Analysis includes intersection related crashes only Animal crashes excluded
60

2004-2006 7 LANE 2 WAY UNSIGNALIZED INTERSECTIONS Average Annual Crash Frequency
ADT LESS THAN 10,000 (Includes intersections with zero ADT) GRAND, BAY, SOUTHWEST, UNIVERSITY AND METRO REGIONS
AVG ADT = 8,418 TOT INTERSECTIONS = 6
AVERAGE AVG ANNUAL
CRASH TYPE ANNUAL FREQ CRASHES/INT % OF TOTAL
TOTAL 3 0.50 100.0% INJURY ACC 0 0.00 0.0% FATAL ACC 0 0.00 0.0% WET 1 0.17 33.3% ICY 0 0.00 0.0% DARK 0 0.00 0.0% MISC SINGLE VEH 0 0.00 0.0% OVERTURNED 0 0.00 0.0% TRAIN 0 0.00 0.0% PRKED VEHICLE 0 0.00 0.0% MISC MULTI VEH 0 0.00 0.0% BACKING 0 0.00 0.0% PARKING 0 0.00 0.0% PEDESTRIAN 0 0.00 0.0% FIXED OBJ 0 0.00 0.0% ON ROAD OBJ 0 0.00 0.0% ANIMAL 0 0.00 0.0% BICYCLE 0 0.00 0.0% HEAD ON 0 0.00 0.0% ANGLE STRAIT 0 0.00 0.0% REAR-END 1 0.17 33.3% ANGLE TURN 0 0.00 0.0% SIDESWIPE SAME 0 0.00 0.0% REAR-END LEFT 0 0.00 0.0% REAR-END RIGHT 0 0.00 0.0% OTHER DRIVEWAY 0 0.00 0.0% ANGLE DRIVEWAY 0 0.00 0.0% REAR-END DRIVE 0 0.00 0.0% SIDESWIPE OPP 0 0.00 0.0% HEAD ON LEFT 0 0.00 0.0% DUAL LEFT TURN 0 0.00 0.0% DUAL RIGHT TURN 0 0.00 0.0%
DATA SOURCE: Traffic Count Data (ADT) Roadway Features
Bureau of Transportation Planning (Sufficiency) Intersection Data (Location, Traffic Control, Influence Zone) Traffic and Safety Division Crash Data Department of State Police Analysis includes intersection related crashes only Animal crashes excluded
61
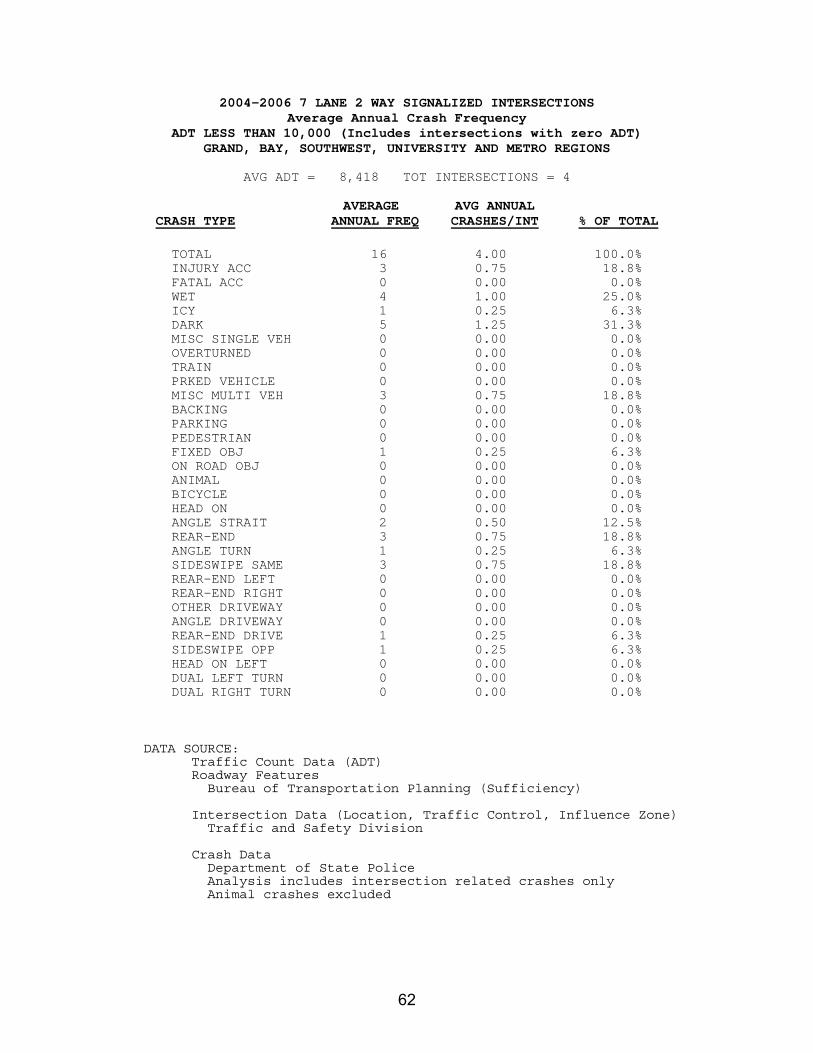
2004-2006 7 LANE 2 WAY SIGNALIZED INTERSECTIONS Average Annual Crash Frequency
ADT LESS THAN 10,000 (Includes intersections with zero ADT) GRAND, BAY, SOUTHWEST, UNIVERSITY AND METRO REGIONS
AVG ADT = 8,418 TOT INTERSECTIONS = 4
AVERAGE AVG ANNUAL
CRASH TYPE ANNUAL FREQ CRASHES/INT % OF TOTAL
TOTAL 16 4.00 100.0% INJURY ACC 3 0.75 18.8% FATAL ACC 0 0.00 0.0% WET 4 1.00 25.0% ICY 1 0.25 6.3% DARK 5 1.25 31.3% MISC SINGLE VEH 0 0.00 0.0% OVERTURNED 0 0.00 0.0% TRAIN 0 0.00 0.0% PRKED VEHICLE 0 0.00 0.0% MISC MULTI VEH 3 0.75 18.8% BACKING 0 0.00 0.0% PARKING 0 0.00 0.0% PEDESTRIAN 0 0.00 0.0% FIXED OBJ 1 0.25 6.3% ON ROAD OBJ 0 0.00 0.0% ANIMAL 0 0.00 0.0% BICYCLE 0 0.00 0.0% HEAD ON 0 0.00 0.0% ANGLE STRAIT 2 0.50 12.5% REAR-END 3 0.75 18.8% ANGLE TURN 1 0.25 6.3% SIDESWIPE SAME 3 0.75 18.8% REAR-END LEFT 0 0.00 0.0% REAR-END RIGHT 0 0.00 0.0% OTHER DRIVEWAY 0 0.00 0.0% ANGLE DRIVEWAY 0 0.00 0.0% REAR-END DRIVE 1 0.25 6.3% SIDESWIPE OPP 1 0.25 6.3% HEAD ON LEFT 0 0.00 0.0% DUAL LEFT TURN 0 0.00 0.0% DUAL RIGHT TURN 0 0.00 0.0%
DATA SOURCE: Traffic Count Data (ADT) Roadway Features
Bureau of Transportation Planning (Sufficiency) Intersection Data (Location, Traffic Control, Influence Zone) Traffic and Safety Division Crash Data Department of State Police Analysis includes intersection related crashes only Animal crashes excluded
62

2004-2006 7 LANE 2 WAY UNSIGNALIZED INTERSECTIONS Average Annual Crash Frequency
ADT 10,000 TO 20,000 GRAND, BAY, SOUTHWEST, UNIVERSITY AND METRO REGIONS
AVG ADT = 16,127 TOT INTERSECTIONS = 70
AVERAGE AVG ANNUAL
CRASH TYPE ANNUAL FREQ CRASHES/INT % OF TOTAL
TOTAL 146 2.09 100.0% INJURY ACC 29 0.41 19.9% FATAL ACC 0 0.00 0.0% WET 26 0.37 17.8% ICY 3 0.04 2.1% DARK 36 0.51 24.7% MISC SINGLE VEH 3 0.04 2.1% OVERTURNED 0 0.00 0.0% TRAIN 0 0.00 0.0% PRKED VEHICLE 2 0.03 1.4% MISC MULTI VEH 20 0.29 13.7% BACKING 4 0.06 2.7% PARKING 3 0.04 2.1% PEDESTRIAN 4 0.06 2.7% FIXED OBJ 6 0.09 4.1% ON ROAD OBJ 0 0.00 0.0% ANIMAL 0 0.00 0.0% BICYCLE 1 0.01 0.7% HEAD ON 2 0.03 1.4% ANGLE STRAIT 25 0.36 17.1% REAR-END 22 0.31 15.1% ANGLE TURN 11 0.16 7.5% SIDESWIPE SAME 24 0.34 16.4% REAR-END LEFT 1 0.01 0.7% REAR-END RIGHT 0 0.00 0.0% OTHER DRIVEWAY 1 0.01 0.7% ANGLE DRIVEWAY 3 0.04 2.1% REAR-END DRIVE 1 0.01 0.7% SIDESWIPE OPP 6 0.09 4.1% HEAD ON LEFT 5 0.07 3.4% DUAL LEFT TURN 1 0.01 0.7% DUAL RIGHT TURN 1 0.01 0.7%
DATA SOURCE: Traffic Count Data (ADT) Roadway Features
Bureau of Transportation Planning (Sufficiency) Intersection Data (Location, Traffic Control, Influence Zone) Traffic and Safety Division Crash Data Department of State Police Analysis includes intersection related crashes only Animal crashes excluded
63
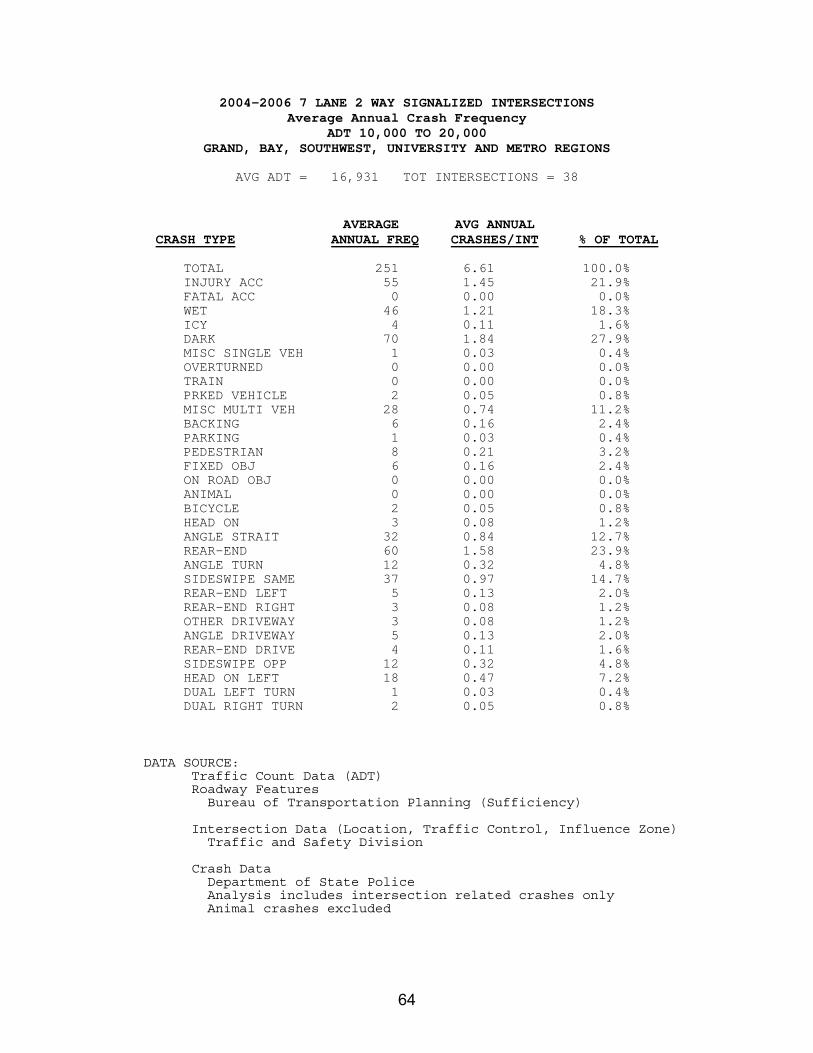
2004-2006 7 LANE 2 WAY SIGNALIZED INTERSECTIONS Average Annual Crash Frequency
ADT 10,000 TO 20,000 GRAND, BAY, SOUTHWEST, UNIVERSITY AND METRO REGIONS
AVG ADT = 16,931 TOT INTERSECTIONS = 38
AVERAGE AVG ANNUAL
CRASH TYPE ANNUAL FREQ CRASHES/INT % OF TOTAL
TOTAL 251 6.61 100.0% INJURY ACC 55 1.45 21.9% FATAL ACC 0 0.00 0.0% WET 46 1.21 18.3% ICY 4 0.11 1.6% DARK 70 1.84 27.9% MISC SINGLE VEH 1 0.03 0.4% OVERTURNED 0 0.00 0.0% TRAIN 0 0.00 0.0% PRKED VEHICLE 2 0.05 0.8% MISC MULTI VEH 28 0.74 11.2% BACKING 6 0.16 2.4% PARKING 1 0.03 0.4% PEDESTRIAN 8 0.21 3.2% FIXED OBJ 6 0.16 2.4% ON ROAD OBJ 0 0.00 0.0% ANIMAL 0 0.00 0.0% BICYCLE 2 0.05 0.8% HEAD ON 3 0.08 1.2% ANGLE STRAIT 32 0.84 12.7% REAR-END 60 1.58 23.9% ANGLE TURN 12 0.32 4.8% SIDESWIPE SAME 37 0.97 14.7% REAR-END LEFT 5 0.13 2.0% REAR-END RIGHT 3 0.08 1.2% OTHER DRIVEWAY 3 0.08 1.2% ANGLE DRIVEWAY 5 0.13 2.0% REAR-END DRIVE 4 0.11 1.6% SIDESWIPE OPP 12 0.32 4.8% HEAD ON LEFT 18 0.47 7.2% DUAL LEFT TURN 1 0.03 0.4% DUAL RIGHT TURN 2 0.05 0.8%
DATA SOURCE: Traffic Count Data (ADT) Roadway Features
Bureau of Transportation Planning (Sufficiency) Intersection Data (Location, Traffic Control, Influence Zone) Traffic and Safety Division Crash Data Department of State Police Analysis includes intersection related crashes only Animal crashes excluded
64

2004-2006 7 LANE 2 WAY UNSIGNALIZED INTERSECTIONS Average Annual Crash Frequency
ADT GREATER THAN 20,000 GRAND, BAY, SOUTHWEST, UNIVERSITY AND METRO REGIONS
AVG ADT = 31,354 TOT INTERSECTIONS = 220
AVERAGE AVG ANNUAL
CRASH TYPE ANNUAL FREQ CRASHES/INT % OF TOTAL
TOTAL 780 3.55 100.0% INJURY ACC 200 0.91 25.6% FATAL ACC 3 0.01 0.4% WET 156 0.71 20.0% ICY 13 0.06 1.7% DARK 210 0.95 26.9% MISC SINGLE VEH 8 0.04 1.0% OVERTURNED 1 0.00 0.1% TRAIN 0 0.00 0.0% PRKED VEHICLE 3 0.01 0.4% MISC MULTI VEH 63 0.29 8.1% BACKING 12 0.05 1.5% PARKING 6 0.03 0.8% PEDESTRIAN 20 0.09 2.6% FIXED OBJ 24 0.11 3.1% ON ROAD OBJ 2 0.01 0.3% ANIMAL 0 0.00 0.0% BICYCLE 10 0.05 1.3% HEAD ON 16 0.07 2.1% ANGLE STRAIT 96 0.44 12.3% REAR-END 243 1.10 31.2% ANGLE TURN 54 0.25 6.9% SIDESWIPE SAME 92 0.42 11.8% REAR-END LEFT 7 0.03 0.9% REAR-END RIGHT 13 0.06 1.7% OTHER DRIVEWAY 11 0.05 1.4% ANGLE DRIVEWAY 28 0.13 3.6% REAR-END DRIVE 16 0.07 2.1% SIDESWIPE OPP 23 0.10 2.9% HEAD ON LEFT 28 0.13 3.6% DUAL LEFT TURN 2 0.01 0.3% DUAL RIGHT TURN 4 0.02 0.5%
DATA SOURCE: Traffic Count Data (ADT) Roadway Features
Bureau of Transportation Planning (Sufficiency) Intersection Data (Location, Traffic Control, Influence Zone) Traffic and Safety Division Crash Data Department of State Police Analysis includes intersection related crashes only Animal crashes excluded
65

2004-2006 7 LANE 2 WAY SIGNALIZED INTERSECTIONS Average Annual Crash Frequency
ADT GREATER THAN 20,000 GRAND, BAY, SOUTHWEST, UNIVERSITY AND METRO REGIONS
AVG ADT = 33,323 TOT INTERSECTIONS = 70
AVERAGE AVG ANNUAL
CRASH TYPE ANNUAL FREQ CRASHES/INT % OF TOTAL
TOTAL 822 11.74 100.0% INJURY ACC 212 3.03 25.8% FATAL ACC 1 0.01 0.1% WET 202 2.89 24.6% ICY 11 0.16 1.3% DARK 213 3.04 25.9% MISC SINGLE VEH 3 0.04 0.4% OVERTURNED 0 0.00 0.0% TRAIN 0 0.00 0.0% PRKED VEHICLE 1 0.01 0.1% MISC MULTI VEH 42 0.60 5.1% BACKING 9 0.13 1.1% PARKING 4 0.06 0.5% PEDESTRIAN 9 0.13 1.1% FIXED OBJ 17 0.24 2.1% ON ROAD OBJ 1 0.01 0.1% ANIMAL 0 0.00 0.0% BICYCLE 5 0.07 0.6% HEAD ON 10 0.14 1.2% ANGLE STRAIT 89 1.27 10.8% REAR-END 358 5.11 43.6% ANGLE TURN 43 0.61 5.2% SIDESWIPE SAME 79 1.13 9.6% REAR-END LEFT 10 0.14 1.2% REAR-END RIGHT 9 0.13 1.1% OTHER DRIVEWAY 7 0.10 0.9% ANGLE DRIVEWAY 39 0.56 4.7% REAR-END DRIVE 28 0.40 3.4% SIDESWIPE OPP 17 0.24 2.1% HEAD ON LEFT 35 0.50 4.3% DUAL LEFT TURN 3 0.04 0.4% DUAL RIGHT TURN 3 0.04 0.4%
DATA SOURCE: Traffic Count Data (ADT) Roadway Features
Bureau of Transportation Planning (Sufficiency) Intersection Data (Location, Traffic Control, Influence Zone) Traffic and Safety Division Crash Data Department of State Police Analysis includes intersection related crashes only Animal crashes excluded
66

2004-2006 DIVIDED ROAD UNSIGNALIZED INTERSECTIONS Average Annual Crash Frequency
ADT LESS THAN 10,000 (Includes intersections with zero ADT) GRAND, BAY, SOUTHWEST, UNIVERSITY AND METRO REGIONS
AVG ADT = 6,890 TOT INTERSECTIONS = 136
AVERAGE AVG ANNUAL
CRASH TYPE ANNUAL FREQ CRASHES/INT % OF TOTAL
TOTAL 100 0.74 100.0% INJURY ACC 31 0.23 31.0% FATAL ACC 1 0.01 1.0% WET 15 0.11 15.0% ICY 5 0.04 5.0% DARK 28 0.21 28.0% MISC SINGLE VEH 1 0.01 1.0% OVERTURNED 2 0.01 2.0% TRAIN 0 0.00 0.0% PRKED VEHICLE 0 0.00 0.0% MISC MULTI VEH 7 0.05 7.0% BACKING 1 0.01 1.0% PARKING 0 0.00 0.0% PEDESTRIAN 0 0.00 0.0% FIXED OBJ 18 0.13 18.0% ON ROAD OBJ 0 0.00 0.0% ANIMAL 0 0.00 0.0% BICYCLE 0 0.00 0.0% HEAD ON 1 0.01 1.0% ANGLE STRAIT 28 0.21 28.0% REAR-END 15 0.11 15.0% ANGLE TURN 6 0.04 6.0% SIDESWIPE SAME 9 0.07 9.0% REAR-END LEFT 1 0.01 1.0% REAR-END RIGHT 2 0.01 2.0% OTHER DRIVEWAY 0 0.00 0.0% ANGLE DRIVEWAY 1 0.01 1.0% REAR-END DRIVE 1 0.01 1.0% SIDESWIPE OPP 2 0.01 2.0% HEAD ON LEFT 3 0.02 3.0% DUAL LEFT TURN 0 0.00 0.0% DUAL RIGHT TURN 1 0.01 1.0%
DATA SOURCE: Traffic Count Data (ADT) Roadway Features
Bureau of Transportation Planning (Sufficiency) Intersection Data (Location, Traffic Control, Influence Zone) Traffic and Safety Division Crash Data Department of State Police Analysis includes intersection related crashes only Animal crashes excluded
67
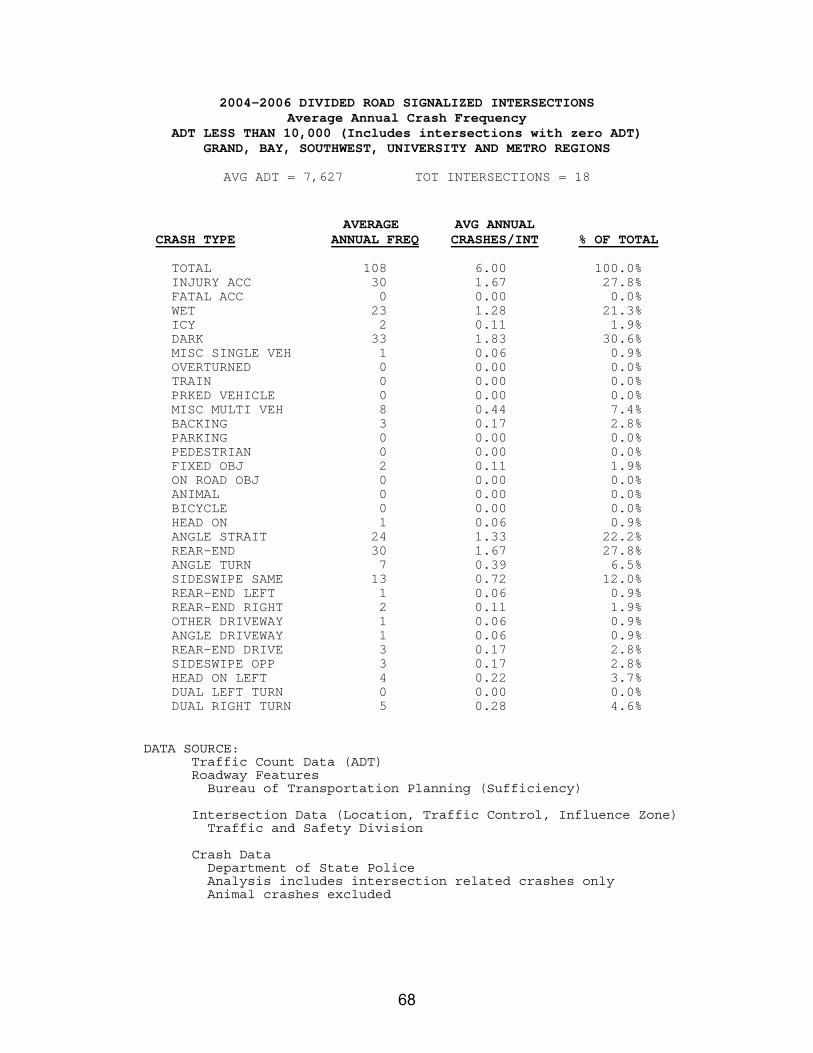
2004-2006 DIVIDED ROAD SIGNALIZED INTERSECTIONS Average Annual Crash Frequency
ADT LESS THAN 10,000 (Includes intersections with zero ADT) GRAND, BAY, SOUTHWEST, UNIVERSITY AND METRO REGIONS
AVG ADT = 7,627 TOT INTERSECTIONS = 18
AVERAGE AVG ANNUAL
CRASH TYPE ANNUAL FREQ CRASHES/INT % OF TOTAL
TOTAL 108 6.00 100.0% INJURY ACC 30 1.67 27.8% FATAL ACC 0 0.00 0.0% WET 23 1.28 21.3% ICY 2 0.11 1.9% DARK 33 1.83 30.6% MISC SINGLE VEH 1 0.06 0.9% OVERTURNED 0 0.00 0.0% TRAIN 0 0.00 0.0% PRKED VEHICLE 0 0.00 0.0% MISC MULTI VEH 8 0.44 7.4% BACKING 3 0.17 2.8% PARKING 0 0.00 0.0% PEDESTRIAN 0 0.00 0.0% FIXED OBJ 2 0.11 1.9% ON ROAD OBJ 0 0.00 0.0% ANIMAL 0 0.00 0.0% BICYCLE 0 0.00 0.0% HEAD ON 1 0.06 0.9% ANGLE STRAIT 24 1.33 22.2% REAR-END 30 1.67 27.8% ANGLE TURN 7 0.39 6.5% SIDESWIPE SAME 13 0.72 12.0% REAR-END LEFT 1 0.06 0.9% REAR-END RIGHT 2 0.11 1.9% OTHER DRIVEWAY 1 0.06 0.9% ANGLE DRIVEWAY 1 0.06 0.9% REAR-END DRIVE 3 0.17 2.8% SIDESWIPE OPP 3 0.17 2.8% HEAD ON LEFT 4 0.22 3.7% DUAL LEFT TURN 0 0.00 0.0% DUAL RIGHT TURN 5 0.28 4.6%
DATA SOURCE: Traffic Count Data (ADT) Roadway Features
Bureau of Transportation Planning (Sufficiency) Intersection Data (Location, Traffic Control, Influence Zone) Traffic and Safety Division Crash Data Department of State Police Analysis includes intersection related crashes only Animal crashes excluded
68

2004-2006 DIVIDED ROAD UNSIGNALIZED INTERSECTIONS Average Annual Crash Frequency
ADT 10,000 TO 20,000 GRAND, BAY, SOUTHWEST, UNIVERSITY AND METRO REGIONS
AVG ADT = 16,090 TOT INTERSECTIONS = 293
AVERAGE AVG ANNUAL
CRASH TYPE ANNUAL FREQ CRASHES/INT % OF TOTAL
TOTAL 523 1.78 100.0% INJURY ACC 135 0.46 25.8% FATAL ACC 2 0.01 0.4% WET 106 0.36 20.3% ICY 20 0.07 3.8% DARK 132 0.45 25.2% MISC SINGLE VEH 8 0.03 1.5% OVERTURNED 4 0.01 0.8% TRAIN 0 0.00 0.0% PRKED VEHICLE 2 0.01 0.4% MISC MULTI VEH 27 0.09 5.2% BACKING 5 0.02 1.0% PARKING 0 0.00 0.0% PEDESTRIAN 2 0.01 0.4% FIXED OBJ 46 0.16 8.8% ON ROAD OBJ 2 0.01 0.4% ANIMAL 0 0.00 0.0% BICYCLE 6 0.02 1.1% HEAD ON 5 0.02 1.0% ANGLE STRAIT 108 0.37 20.7% REAR-END 151 0.52 28.9% ANGLE TURN 28 0.10 5.4% SIDESWIPE SAME 49 0.17 9.4% REAR-END LEFT 7 0.02 1.3% REAR-END RIGHT 22 0.08 4.2% OTHER DRIVEWAY 1 0.00 0.2% ANGLE DRIVEWAY 8 0.03 1.5% REAR-END DRIVE 13 0.04 2.5% SIDESWIPE OPP 10 0.03 1.9% HEAD ON LEFT 12 0.04 2.3% DUAL LEFT TURN 3 0.01 0.6% DUAL RIGHT TURN 3 0.01 0.6%
DATA SOURCE: Traffic Count Data (ADT) Roadway Features
Bureau of Transportation Planning (Sufficiency) Intersection Data (Location, Traffic Control, Influence Zone) Traffic and Safety Division Crash Data Department of State Police Analysis includes intersection related crashes only Animal crashes excluded
69

2004-2006 DIVIDED ROAD SIGNALIZED INTERSECTIONS Average Annual Crash Frequency
ADT 10,000 TO 20,000 GRAND, BAY, SOUTHWEST, UNIVERSITY AND METRO REGIONS
AVG ADT = 16,427 TOT INTERSECTIONS = 75
AVERAGE AVG ANNUAL
CRASH TYPE ANNUAL FREQ CRASHES/INT % OF TOTAL
TOTAL 490 6.53 100.0% INJURY ACC 128 1.71 26.1% FATAL ACC 1 0.01 0.2% WET 105 1.40 21.4% ICY 14 0.19 2.9% DARK 154 2.05 31.4% MISC SINGLE VEH 5 0.07 1.0% OVERTURNED 2 0.03 0.4% TRAIN 0 0.00 0.0% PRKED VEHICLE 0 0.00 0.0% MISC MULTI VEH 26 0.35 5.3% BACKING 3 0.04 0.6% PARKING 2 0.03 0.4% PEDESTRIAN 4 0.05 0.8% FIXED OBJ 21 0.28 4.3% ON ROAD OBJ 2 0.03 0.4% ANIMAL 0 0.00 0.0% BICYCLE 3 0.04 0.6% HEAD ON 5 0.07 1.0% ANGLE STRAIT 109 1.45 22.2% REAR-END 165 2.20 33.7% ANGLE TURN 27 0.36 5.5% SIDESWIPE SAME 45 0.60 9.2% REAR-END LEFT 6 0.08 1.2% REAR-END RIGHT 7 0.09 1.4% OTHER DRIVEWAY 2 0.03 0.4% ANGLE DRIVEWAY 10 0.13 2.0% REAR-END DRIVE 14 0.19 2.9% SIDESWIPE OPP 7 0.09 1.4% HEAD ON LEFT 14 0.19 2.9% DUAL LEFT TURN 3 0.04 0.6% DUAL RIGHT TURN 7 0.09 1.4%
DATA SOURCE: Traffic Count Data (ADT) Roadway Features
Bureau of Transportation Planning (Sufficiency) Intersection Data (Location, Traffic Control, Influence Zone) Traffic and Safety Division Crash Data Department of State Police Analysis includes intersection related crashes only Animal crashes excluded
70

2004-2006 DIVIDED ROAD UNSIGNALIZED INTERSECTIONS Average Annual Crash Frequency
ADT GREATER THAN 20,000 GRAND, BAY, SOUTHWEST, UNIVERSITY AND METRO REGIONS
AVG ADT = 49,779 TOT INTERSECTIONS = 1,890
AVERAGE AVG ANNUAL
CRASH TYPE ANNUAL FREQ CRASHES/INT % OF TOTAL
TOTAL 3796 2.01 100.0% INJURY ACC 839 0.44 22.1% FATAL ACC 9 0.00 0.2% WET 753 0.40 19.8% ICY 93 0.05 2.4% DARK 905 0.48 23.8% MISC SINGLE VEH 34 0.02 0.9% OVERTURNED 9 0.00 0.2% TRAIN 0 0.00 0.0% PRKED VEHICLE 8 0.00 0.2% MISC MULTI VEH 164 0.09 4.3% BACKING 54 0.03 1.4% PARKING 14 0.01 0.4% PEDESTRIAN 30 0.02 0.8% FIXED OBJ 215 0.11 5.7% ON ROAD OBJ 19 0.01 0.5% ANIMAL 0 0.00 0.0% BICYCLE 36 0.02 0.9% HEAD ON 14 0.01 0.4% ANGLE STRAIT 463 0.24 12.2% REAR-END 1580 0.84 41.6% ANGLE TURN 177 0.09 4.7% SIDESWIPE SAME 493 0.26 13.0% REAR-END LEFT 22 0.01 0.6% REAR-END RIGHT 86 0.05 2.3% OTHER DRIVEWAY 11 0.01 0.3% ANGLE DRIVEWAY 60 0.03 1.6% REAR-END DRIVE 140 0.07 3.7% SIDESWIPE OPP 57 0.03 1.5% HEAD ON LEFT 20 0.01 0.5% DUAL LEFT TURN 41 0.02 1.1% DUAL RIGHT TURN 49 0.03 1.3%
DATA SOURCE: Traffic Count Data (ADT) Roadway Features
Bureau of Transportation Planning (Sufficiency) Intersection Data (Location, Traffic Control, Influence Zone) Traffic and Safety Division Crash Data Department of State Police Analysis includes intersection related crashes only Animal crashes excluded
71

2004-2006 DIVIDED ROAD SIGNALIZED INTERSECTIONS Average Annual Crash Frequency
ADT GREATER THAN 20,000 GRAND, BAY, SOUTHWEST, UNIVERSITY AND METRO REGIONS
AVG ADT = 51,996 TOT INTERSECTIONS = 545
AVERAGE AVG ANNUAL
CRASH TYPE ANNUAL FREQ CRASHES/INT % OF TOTAL
TOTAL 5574 10.23 100.0% INJURY ACC 1292 2.37 23.2% FATAL ACC 11 0.02 0.2% WET 1218 2.23 21.9% ICY 102 0.19 1.8% DARK 1327 2.43 23.8% MISC SINGLE VEH 32 0.06 0.6% OVERTURNED 9 0.02 0.2% TRAIN 0 0.00 0.0% PRKED VEHICLE 3 0.01 0.1% MISC MULTI VEH 210 0.39 3.8% BACKING 48 0.09 0.9% PARKING 17 0.03 0.3% PEDESTRIAN 39 0.07 0.7% FIXED OBJ 139 0.26 2.5% ON ROAD OBJ 13 0.02 0.2% ANIMAL 0 0.00 0.0% BICYCLE 45 0.08 0.8% HEAD ON 19 0.03 0.3% ANGLE STRAIT 726 1.33 13.0% REAR-END 2658 4.88 47.7% ANGLE TURN 191 0.35 3.4% SIDESWIPE SAME 624 1.14 11.2% REAR-END LEFT 30 0.06 0.5% REAR-END RIGHT 145 0.27 2.6% OTHER DRIVEWAY 23 0.04 0.4% ANGLE DRIVEWAY 121 0.22 2.2% REAR-END DRIVE 249 0.46 4.5% SIDESWIPE OPP 55 0.10 1.0% HEAD ON LEFT 36 0.07 0.6% DUAL LEFT TURN 41 0.08 0.7% DUAL RIGHT TURN 101 0.19 1.8%
DATA SOURCE: Traffic Count Data (ADT) Roadway Features
Bureau of Transportation Planning (Sufficiency) Intersection Data (Location, Traffic Control, Influence Zone) Traffic and Safety Division Crash Data Department of State Police Analysis includes intersection related crashes only Animal crashes excluded
72

APPENDIX D Intersection Conflict Diagrams 4-Leg Intersection 32 Vehicle to Vehicle Conflicts
(2) T-Intersections 18 Vehicle to Vehicle Conflicts
Divided Highway with Directional Cross-Overs 16 Vehicle to Vehicle Conflicts

(2) Jughandle Intersections 18 Vehicle to Vehicle Conflicts
Split Intersection 22 Vehicle to Vehicle Conflicts
4-Leg Intersection with Quadrant Roadway 28 Vehicle to Vehicle Conflicts
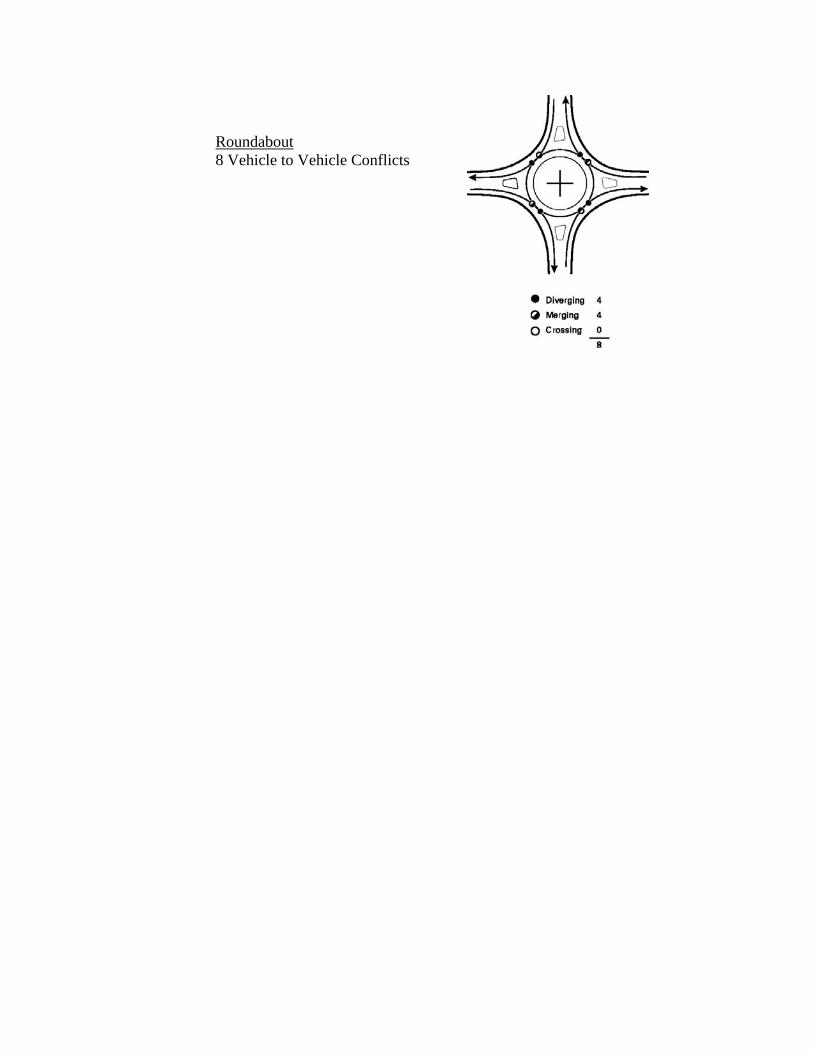
Roundabout 8 Vehicle to Vehicle Conflicts
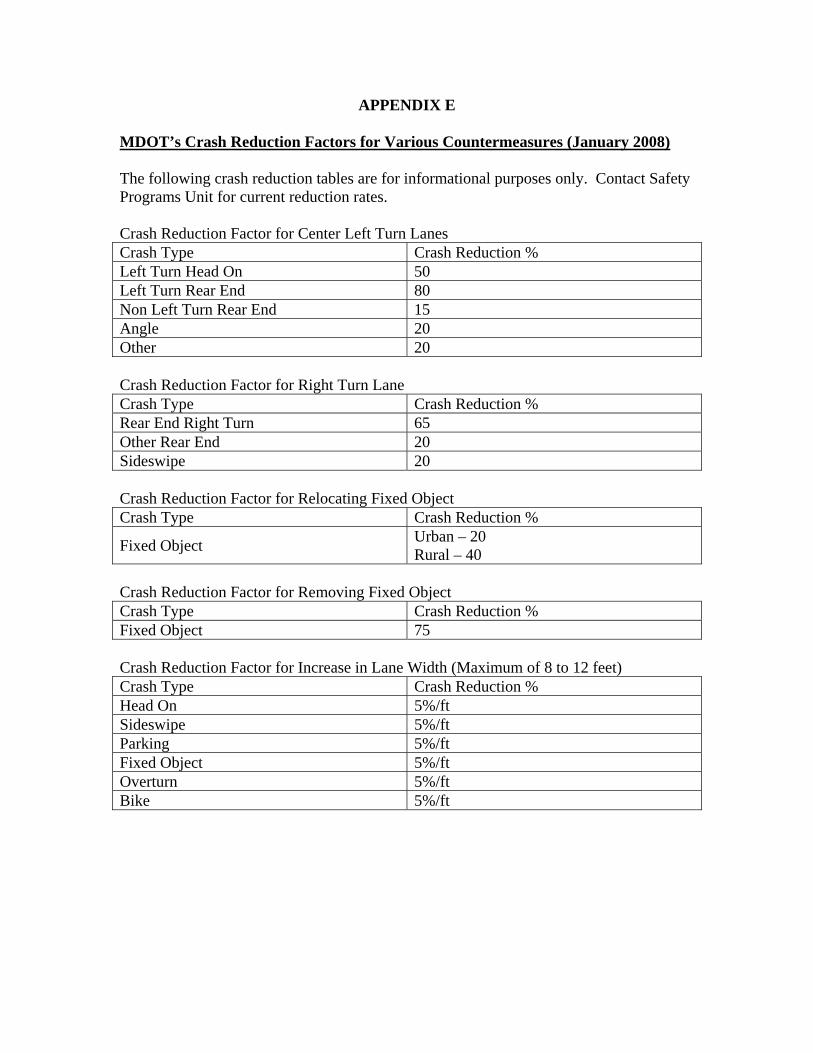
APPENDIX E MDOT’s Crash Reduction Factors for Various Countermeasures (January 2008) The following crash reduction tables are for informational purposes only. Contact Safety Programs Unit for current reduction rates. Crash Reduction Factor for Center Left Turn Lanes Crash Type Crash Reduction % Left Turn Head On 50 Left Turn Rear End 80 Non Left Turn Rear End 15 Angle 20 Other 20 Crash Reduction Factor for Right Turn Lane Crash Type Crash Reduction % Rear End Right Turn 65 Other Rear End 20 Sideswipe 20 Crash Reduction Factor for Relocating Fixed Object Crash Type Crash Reduction %
Fixed Object Urban – 20 Rural – 40
Crash Reduction Factor for Removing Fixed Object Crash Type Crash Reduction % Fixed Object 75 Crash Reduction Factor for Increase in Lane Width (Maximum of 8 to 12 feet) Crash Type Crash Reduction % Head On 5%/ft Sideswipe 5%/ft Parking 5%/ft Fixed Object 5%/ft Overturn 5%/ft Bike 5%/ft

Crash Reduction Factor for Intersection Radii Improvements Crash Type Crash Reduction % Right Turn Angle 15 Rear End 15 Sideswipe 15 Fixed Object 15 Overturn 15 Crash Reduction Factor for Directional Cross-Over Pairs Crash Type Crash Reduction % Rear End Left Turn 80 Head On Left Turn 80 Angle Straight 60 Other Rear End Increase 25 Fixed Object Increase 20 Crash Reduction Factor for Increase to Full Width Shoulder (12 feet) Crash Type Crash Reduction % Head On 15 Sideswipe 15 Parking 15 Fixed Object 15 Bike 15 Crash Reduction Factor for Increase in Bridge Width to Match Road Width Crash Type Crash Reduction % Head On 40 Sideswipe 40 Fixed Object 40 Crash Reduction Factor for Correction/Improvement of Superelevation Crash Type Crash Reduction % Head On 20 Fixed Object 20 Overturn 20 Sideswipe 20