MICHIGAN DEPARTMENT OF COMMUNITY HEALTH€¦ · Measuring Perfluorinated Compounds in Michigan...
54
MICHIGAN DEPARTMENT OF COMMUNITY HEALTH FINAL REPORT USEPA-Great Lakes Restoration Initiative Project MAY 28, 2015 Grant Number: GL-00E01122 Project Title: Measuring Perfluorinated Compounds in Michigan Surface Waters and Fish Reporting Period Covered: September 1, 2012 – February 28, 2015 Principal Investigator: Linda D. Dykema, Ph.D.
Transcript of MICHIGAN DEPARTMENT OF COMMUNITY HEALTH€¦ · Measuring Perfluorinated Compounds in Michigan...
MICHIGAN DEPARTMENT OF COMMUNITY HEALTH
FINAL REPORT
USEPA-Great Lakes Restoration Initiative Project
MAY 28, 2015
Grant Number: GL-00E01122
Project Title: Measuring Perfluorinated Compounds in Michigan Surface Waters and Fish
Reporting Period Covered: September 1, 2012 – February 28, 2015
Principal Investigator: Linda D. Dykema, Ph.D.

Table of Contents
Summary of Work Accomplished ........................................................................ 3
Quality System Documentation .................................................................................................. 3
Fish and Surface Water Sampling................................................................................................ 3
Evaluation of Fish and Surface Water Data ................................................................................. 3
Fish Consumption Screening Level (FCSV) for PFCs .................................................................... 4
Fish Consumption Guidelines ...................................................................................................... 4
Public Communication and Outreach ......................................................................................... 4
Reporting Activities ............................................................................................ 5
Changes to Object Class Categories ..................................................................... 5
Barriers and Corrective Actions ........................................................................... 5
Projected New Work ........................................................................................... 6
Status of Scheduled Work as of 2/28/2015 ......................................................... 6
Status of Budget as of 2/28/2015 ........................................................................ 6
Drawdown Request & Explanation ..................................................................... 7
Principal Investigator Update.............................................................................. 7
Amendment to Project Period ............................................................................ 7
Great Lakes Accountability System Entry Explanation ......................................... 7
Attachment A. Michigan Department of Environmental Quality Staff Report, Reconnaissance Sampling of Perfluorinated Compounds in Michigan Surface Waters and Fish 2010-2014. June 2015.
Attachment B. Michigan Department of Community Health, Technical Support Document for Assessment of Perfluorinated Chemicals and Selection of a Perfluorooctane Sulfonate (PFOS) Reference Dose as the basis for Michigan Fish Consumption Screening Values (FCSVs).
Attachment C. Perfluorooctane Sulfonate (PFOS) Fish Consumption Screening Value Worksheet
Attachment D. Fish Consumption Guidelines for PFCs, Iosco County, Michigan
Measuring Perfluorinated Compounds in Michigan Surface Waters and Fish: GL-00E01122 Reporting Period Covered: September 1, 2012 – February 28, 2015
Page 3 of 9
Summary of Work Accomplished
The following section summarizes the work accomplished on the project, Measuring Perfluorinated Compounds in Michigan Surface Waters and Fish, for the reporting period of September 1, 2012 to February 28, 2015.
Quality System Documentation
The Michigan Department of Community Health (MDCH) submitted the draft Quality Assurance Project Plan (QAPP) for this project on January 4, 2013. MDCH responded to the comments and review provided by the U.S. Environmental Protection Agency (EPA) (dated February 1, 2013) and re-submitted the final draft of the QAPP on March 22, 2013. MDCH received approval for the QAPP on April 9, 2013.
MDCH submitted a revised QAPP (effective date August 9, 2013), which was approved by EPA on August 16, 2013, without further revision.
Fish and Surface Water Sampling
2010-2011 Fish Sample Collection and Analyses - The MDCH Analytical Chemistry Laboratory (ACL) completed perfluorinated compounds (PFC) analysis on all fish tissue samples collected near the former Wurtsmith Air Force Base (WAFB) in 2010-2011 under existing State of Michigan funding and resources. Data for fish collected from the ponds in Clark’s Marsh were available in May 2012. Data for fish samples from the lower Au Sable River and Van Etten Lake were available in October 2012.
2012 Fish Sample Collection and Analyses – The Michigan Department of Natural Resources (MDNR) and the Michigan Department of Environmental Quality (MDEQ) collected 10 smallmouth bass, 8 rock bass, and 4 bluegill/pumpkinseed from the lower Au Sable River (downstream of Van Etten Creek in Oscoda), and 10 pumpkinseed and 10 rock bass from Van Etten Lake. The MDCH lab completed analyses of these fish samples.
2013-2014 Fish Sample Collection and Analysis – The MDNR and the MDEQ collected targeted fish species from the planned sampling sites in 2013. The MDEQ collected an additional four carp and four rock bass from the Tahquamenon River in June 2014. The MDCH lab completed analysis of all fish samples collected in 2013 and 2014.
Surface Water Sampling and Analyses – The MDEQ completed water sampling at all sites by mid-September 2013 and have received all analytical results from TestAmerica.
Evaluation of Fish and Surface Water Data
The MDEQ evaluated all fish and surface water data collected and analyzed for this project and summarized the findings in a Staff Report. The final draft of this report is included here in Attachment A: Reconnaissance Sampling of Perfluorinated Compounds in Michigan Surface Waters and Fish 2010-2014. The MDEQ found that total PFC concentrations in water varied widely across the state and that concentrations are highest in rivers flowing through urban and industrialized areas with the exception of the former WAFB, which is impacted by legacy contaminants. The PFC composition found in fish and surface water also varied significantly across sampling sites, indicating varied sources and magnitudes of contamination. MDEQ
Measuring Perfluorinated Compounds in Michigan Surface Waters and Fish: GL-00E01122 Reporting Period Covered: September 1, 2012 – February 28, 2015
Page 4 of 9
concluded that a more thorough assessment might be warranted to determine whether PFOS is affecting wildlife in the Oscoda area and along the Flint River.
Fish Consumption Screening Level (FCSV) for PFCs
On September 30, 2014, MDCH finalized the Technical Support Document for Assessment of Perfluorinated Chemicals and Selection of a Perfluorooctane Sulfonate (PFOS) Reference Dose as the basis for Michigan Fish Consumption Screening Values (FCSVs) provided in Attachment B and available at www.michigan.gov/eatsafefish.gov.
Attachment C provides the FCSV Worksheet for PFOS1 that presents the ranges of PFOS concentrations in fish samples that are used to determine consumption advisories ranging from 16 meals per month to “Do Not Eat”.
Fish Consumption Guidelines
Attachment D provides selected pages from the Eat Safe Fish Guide2 for the northeast region of Michigan showing the 2014 Fish Consumption Guidelines for PFCs, Iosco County, Michigan based on measured levels of PFOS in edible fish portions (typically filets). MDCH reviewed all of the PFC fish contaminant data collected under this project and determined that PFC levels in fish collected from other regions of Michigan do not indicate the need for fish consumption guidelines.
Public Communication and Outreach
MDCH hosted public open house and community meetings in Oscoda, Michigan, on January 24, 2013 and February 12, 2014. Fact sheets are available on the internet and at area businesses. MDCH provided letters to homeowners along the lower Au Sable River and posted signs at popular fishing spots advising people of the “Eat Safe Fish” guidelines available at www.michigan.gov/eatsafefish.
1 Excerpted from Michigan Fish Consumption Advisory Program Guidance Document (September 17, 2014).
Available at http://www.michigan.gov/eatsafefish.
2 Available at http://www.michigan.gov/eatsafefish.
Allen Lake
Au Sable River

Measuring Perfluorinated Compounds in Michigan Surface Waters and Fish: GL-00E01122 Reporting Period Covered: September 1, 2012 – February 28, 2015
Page 5 of 9
MDCH provided the fact sheet at the January 2013 public meeting, delivered copies to the U.S. Forest Service for distribution to visitors, and mailed copies to the Oscoda-Au Sable Chamber of Commerce. MDCH collaborated with the U.S. Air Force, the U.S. Forest Service, and local and state officials to provide information about the PFC contamination issues at the former WAFB to residents, businesses, and visitors to Oscoda.
MDCH posted updated fish consumption guidelines and advisories signs for Clark’s Marsh, the affected stretch of the Au Sable River, and Allen Lake.
The final site-specific Eat Safe Fish (ESF) brochure for the Oscoda area is available at www.michigan.gov/eatsafefish. MDCH distributed the brochure at several venues in Iosco County including the Wellman Sport Center, Au Sable River Store, US Forest Service, District #2 Health Department, AmericInn Hotel, other local agencies. The local Oscoda newspaper has reported on the ESF guidelines.
Reporting Activities
MDCH has posted quarterly updates in the Great Lakes Accountability System (GLAS) as required and has submitted semi-annual reports to fulfill the terms and conditions of this funding award.
Changes to Object Class Categories
None
Barriers and Corrective Actions
MDEQ was unable to complete fish sample collection on the Tahquamenon River in 2013, but completed the collection of four additional carp and four rock bass from the Tahquamenon River in June 2014.
MDEQ was not able to collect the required fish species in the previously planned stretches of the Flint and Muskegon Rivers, and therefore extended and/or moved the collections sites a few miles downstream.
These minor temporal and spatial sampling variations did not affect the projects ability to complete the data quality objectives.
Measuring Perfluorinated Compounds in Michigan Surface Waters and Fish: GL-00E01122 Reporting Period Covered: September 1, 2012 – February 28, 2015
Page 6 of 9
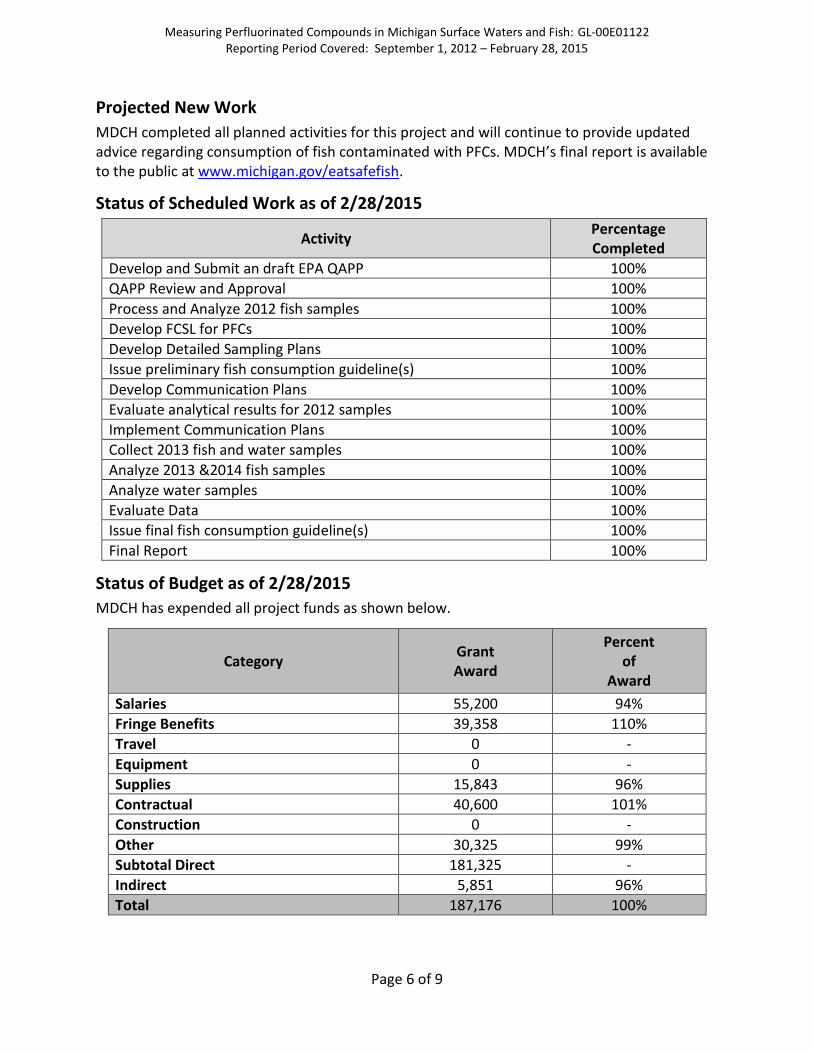
Projected New Work
MDCH completed all planned activities for this project and will continue to provide updated advice regarding consumption of fish contaminated with PFCs. MDCH’s final report is available to the public at www.michigan.gov/eatsafefish.
Status of Scheduled Work as of 2/28/2015
Activity Percentage Completed
Develop and Submit an draft EPA QAPP 100%
QAPP Review and Approval 100%
Process and Analyze 2012 fish samples 100%
Develop FCSL for PFCs 100%
Develop Detailed Sampling Plans 100%
Issue preliminary fish consumption guideline(s) 100%
Develop Communication Plans 100%
Evaluate analytical results for 2012 samples 100%
Implement Communication Plans 100%
Collect 2013 fish and water samples 100%
Analyze 2013 &2014 fish samples 100%
Analyze water samples 100%
Evaluate Data 100%
Issue final fish consumption guideline(s) 100%
Final Report 100%
Status of Budget as of 2/28/2015
MDCH has expended all project funds as shown below.
Category Grant Award
Percent of
Award
Salaries 55,200 94%
Fringe Benefits 39,358 110%
Travel 0 -
Equipment 0 -
Supplies 15,843 96%
Contractual 40,600 101%
Construction 0 -
Other 30,325 99%
Subtotal Direct 181,325 -
Indirect 5,851 96%
Total 187,176 100%
Measuring Perfluorinated Compounds in Michigan Surface Waters and Fish: GL-00E01122 Reporting Period Covered: September 1, 2012 – February 28, 2015
Page 7 of 9
Drawdown Request & Explanation
The final drawdown of $18,439.07 occurred on October 16, 2014. MDCH expended all project funds have been expended.
Principal Investigator Update
Dr. Linda D. Dykema served as the principal investigator throughout this grant project.
Amendment to Project Period
None
Great Lakes Accountability System Entry Explanation
MDCH complied with all reporting requirements.
Attachment A. Michigan Department of Environmental Quality Staff Report, Reconnaissance Sampling of Perfluorinated Compounds in Michigan Surface Waters and Fish 2010-2014. June 2015.
Note: The MDEQ Staff Report originally issued in June 2015 was revised to make corrections on April 6, 2017
1
MICHIGAN DEPARTMENT OF ENVIRONMENTAL QUALITY WATER RESOURCES DIVISION
JUNE 2015
STAFF REPORT
RECONNAISSANCE SAMPLING OF PERFLUORINATED COMPOUNDS IN MICHIGAN SURFACE WATERS AND FISH
2010-2014
1. BACKGROUND
Perfluorinated compounds (PFCs) are a class of organic chemicals in which all of the carbon atoms in the molecular backbone are fluorinated. PFCs in the environment are anthropogenic, have been synthesized for over 50 years, and are used in numerous industrial processes and consumer products. In addition, PFCs are persistent, some of the compounds bioaccumulate in the environment, and several have proven to be toxic to birds and mammals in laboratory testing (Giesy and Kannan, 2002). The toxicities of many PFCs have not yet been tested. PFCs are surfactants used in fire-fighting foams, paints, polishes, and lubricants, and, because of their unique ability to repel both oil and water, have been used in a wide variety of industrial processes and consumer products. Of all the PFCs, perfluorooctanoic acid (PFOA) and perfluorooctane sulfonate (PFOS) have been the subject of the most toxicological work and environmental monitoring. Both compounds were an end product of a manufacturing process, but they can also be generated as byproducts when other fluorinated compounds break down. Since neither PFOA nor PFOS are very volatile, the global distribution of the two might be due to the degradation of more volatile precursor compounds (Giesy and Kannan, 2002). In 2001, staff of the Michigan Department of Environmental Quality (MDEQ), Water Resources Division, sampled surface water from rivers in different parts of the state for the presence of PFOA and PFOS. The sampling was conducted because PFCs had been found at elevated levels in water, fish, and wildlife in Minnesota and other areas of the country, indicating that these compounds might be emerging contaminants of concern. The results of the sampling in 2001 suggested that the levels of these 2 PFCs in Michigan surface waters were not a statewide concern (Aiello, 2005). A decade later, staff of the MDEQ, Remediation and Redevelopment Division, requested assistance from the State of Michigan toxicologists to assess the significance of PFC levels found at the former Wurtsmith Air Force Base (WAFB) in Oscoda, Michigan. This request resulted in an environmental sampling plan to determine the scope of PFC contamination throughout the state, with emphasis on the area surrounding the former WAFB. The contamination of the former WAFB with PFCs was due to the use of fire-fighting foams containing these compounds during training exercises and to extinguish a fire caused by a plane crash in the late 1970s. The contaminated groundwater from the site vents to the Au Sable River via Clark’s Marsh. Extremely high levels of PFOS were found in fillet samples of pumpkinseed (Lepomis gibbosus) and bluegill (L. macrochirus) collected from Clark’s Marsh in 2011, prompting the Michigan Department of Health and Human Services (MDHHS) (previously the Michigan Department of Community Health [MDCH]) to issue a “Do Not Eat” fish consumption advisory
REVISED APRIL 6, 2017 MI/DEQ/WRD-15/019

2
for Clark’s Marsh. Subsequent advice also stated that consumption of fish from the Au Sable River mouth upstream to the first dam should also be avoided. The discovery of the high levels in fish tissue prompted the MDHHS to apply for funding through the United States Environmental Protection Agency (USEPA), Great Lakes Restoration Initiative (GLRI), to support this survey. The current project was undertaken to reassess some of the surface waters that were initially sampled in 2001, determine the extent of PFC contamination throughout the state, and attempt to correlate surface water concentrations of PFCs with those found in fish tissue. 2. SUMMARY
1. A screening survey of levels of PFCs in Michigan surface waters and fish fillets was prompted by the discovery of high levels of contamination at the WAFB in Oscoda, Michigan.
2. Co-located water and fish samples were collected from 11 sites and analyzed for PFCs. In addition, fish samples collected from 8 Great Lakes and inland sites were analyzed for PFCs.
3. The dominant PFC in water varied between sites. Several of the compounds were detected at most of the sites. PFOS was detected in water at 10 of the 13 sites sampled, and PFOA was detected at all but 1 site.
4. Concentrations of PFOS in river water samples were lower at nearly all of the sites sampled in 2013 compared to concentrations in samples collected at the same sites in 2001.
5. PFOS was detected in over 99% of the fish fillets tested, and made up an average of 82% of the total PFC concentration measured.
6. PFOA was detected in fish only from the Saginaw and Thunder Bay Rivers, and low concentrations were measured there.
7. PFC concentrations in fish were not related to fish length or lipid content. Total PFC and PFOS concentrations were generally highest in the top predator fish at a given site.
8. PFOS concentrations in fish fillets are high enough to cause consumption advisories in 67% of the fish populations sampled for this project. In most cases there are already consumption advisories due to other contaminants.
9. PFOS and PFOA concentrations in water may be at sufficiently high concentrations to impact aquatic life in Clark’s Marsh. The PFOS concentrations at 2 sites exceeded the Michigan Rule 57 nondrinking and drinking water human health values. The PFOA concentrations in water and fish are not likely to affect human health.
3. METHODS Following a USEPA-approved quality assurance project plan, fish and ambient water samples were collected for the GLRI-funded survey from the following water bodies in 2013 and 2014: Au Sable, Flint, Kalamazoo, Muskegon, Saginaw, St. Joseph, Thunder Bay, and Tahquamenon Rivers, and Van Etten Lake (Table 1). In addition to those samples collected for the GLRI survey, fillet samples of fish collected between 2010 and 2012 from Lake Erie, Little Bay De Noc (northern Lake Michigan), the St. Marys River, and 4 inland lakes and impoundments were analyzed for PFCs (Figure 1). In 2013, water samples were collected from 12 sites (Table 1) following standard operating procedures (U.S. Geological Survey, variously dated). Three surface water grab samples were collected from stream sites near the thalweg at 15-30 centimeters depth using a stainless steel Kemmerer, a pole dipper, or by hand dipping the bottle. A near-surface, mid-depth, and
3
near-bottom grab sample was collected at the deepest point in each of the 2 impoundment sites using a stainless steel Kemmerer. Surface water samples were collected from the upper pond of Clark’s Marsh in 2011 by means of a peristaltic pump with Tygon tubing deployed to mid-depth at 3 sampling points. Fish were collected using standard electrofishing or netting procedures, and were prepared as standard edible portion samples following the MDEQ, Water Resources Division, Procedure WRD-SWAS-004. The goal for the fish collections was to collect 10 specimens of at least 3 species at each sampling site. The primary target species for the GLRI-funded sampling included common carp (Cyprinus carpio), rock bass (Ambloplites rupestris), and smallmouth bass (Micropterus dolomieu). Carp are insectivores/detritivores and are considered to have a trophic status between level 2 and 3. Rock bass are generally considered to be between trophic level 3 and 4; bluegill and/or pumpkinseed, both trophic level 3 species, were substituted for rock bass at 4 sites. Adult smallmouth bass are considered trophic level 4 (top predators). Largemouth bass (M. salmoides) have diets similar to smallmouth bass and are also considered to be a trophic level 4 species; 4 largemouth bass were collected and analyzed along with 8 smallmouth bass from the Thunder Bay River. The 3 target species were collected at 5 of the GLRI project sites (Table 1). Carp were not collected from either the Au Sable River or Van Etten Lake. Fish collections were completed in 2013 for all GLRI project sites except the Tahquamenon River; sampling was conducted there in 2013 and 2014. Rainbow trout (aka steelhead; Oncorhynchus mykiss) and walleye (Sander vitreus) were collected from the Au Sable River in 2013 and 2014 and were analyzed for PFCs with funding from the Agency for Toxic Substances and Disease Registry. The latter 2 species were assumed to have migrated upstream from Lake Huron. Water samples collected in 2013 were analyzed by TestAmerica for 19 PFCs (Table 2). Fish fillet samples from Clark’s Marsh were analyzed by Axys Analytical Services (Sidney, British Columbia); the remaining fillet samples were analyzed by the MDHHS, Analytical Chemistry Laboratory (ACL). PFCs in water and fish samples were analyzed by Liquid Chromatography Tandem Mass Spectrometry. The list of PFCs analyzed varied slightly between labs and over time (Table 2). The TestAmerica method detection limit for water samples varied by compound from 0.13 to 1.4 nanograms per liter (ng/L), with a reporting limit of 2 ng/L for all PFCs assayed. TestAmerica flagged results below the reporting limit but above the method detection limit; the flagged results were used as reported. The Axys Analytical Services reporting limit in fish tissue was 0.5 micrograms per kilogram (µg/kg). The MDHHS-ACL limit of detection and reporting limit in fish tissue was 0.25 µg/kg. Fish tissue concentrations of PFCs were reported as wet weight and entered into the MDEQ, Fish Contaminant Monitoring Program, Access database. Total PFC values were calculated as the sum of detected values for each individual compound. Values qualified as estimates (J) by the laboratories were treated as the reported value. Non-detect values (K) were assigned a value of zero for the purpose of calculating total PFC and arithmetic means, and were assigned the detection limit when calculating the geometric mean concentration.
4
Between-site comparisons of PFC concentrations were made using the Kruskal-Wallis nonparametric test with Dunn’s test for multiple comparisons. The statistics were run using the Minitab 15 statistical package. 4. RESULTS AND DISCUSSION
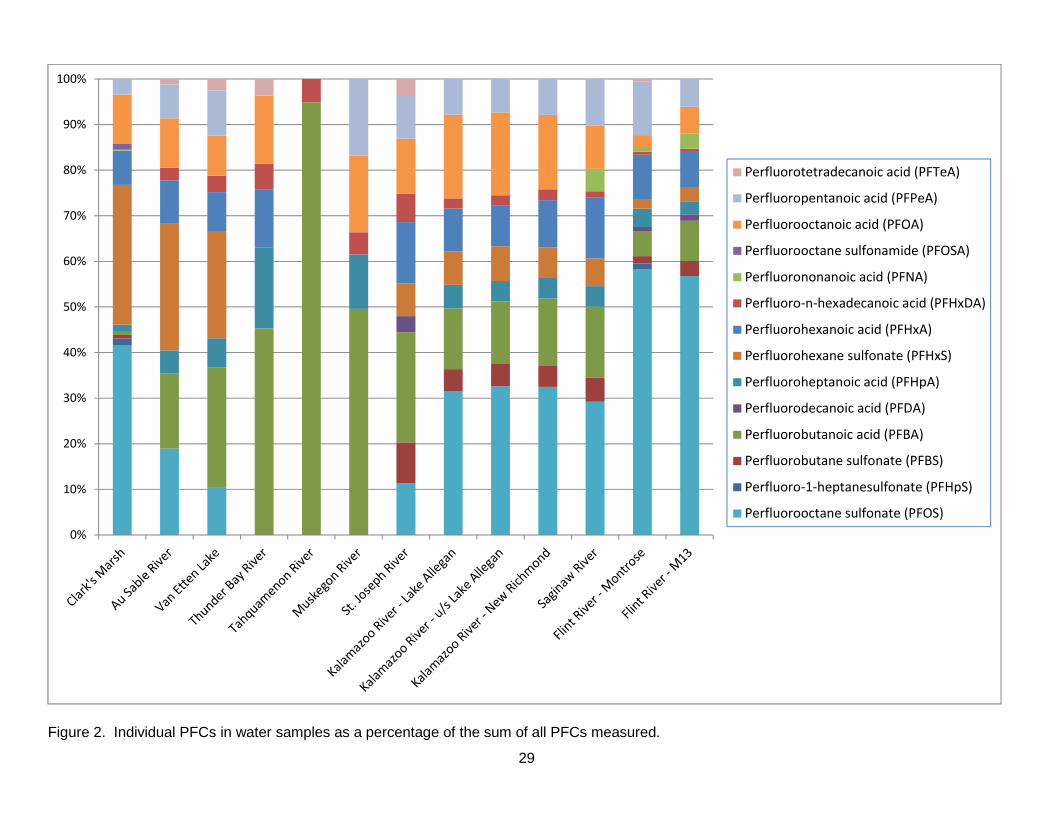
4.1 PFCs in Water Water samples collected in 2011 from Clark’s Marsh had the highest concentrations of total PFC (Table 3); concentrations of nearly all PFCs measured there were at least one order of magnitude higher than the next highest value measured in the 2013 statewide survey. The next highest total PFC concentrations in water samples collected in 2013 for the GLRI project were measured at the Flint River sites, while the Tahquamenon, Thunder Bay, and Muskegon Rivers sites had the lowest total concentrations (Table 3). The relative contribution of each PFC to the total concentration varied noticeably between sites (Figure 2). The greatest number of PFCs (13) was detected in the Flint River, followed by the Saginaw and St. Joseph Rivers (each with 10). Only 2 PFCs (PFBA and PFHxDA) were detected in Tahquamenon River water samples. One PFC, (PFBA), had quantifiable concentrations in all water samples from every site sampled. PFBA was produced for use in making photographic film, and may also be a breakdown product of other PFCs. The highest geometric mean concentration of PFBA was measured in Clark’s Marsh water samples (116 ng/L), although it made up less than 1% of the total PFC concentration. Water samples from the 12 sites sampled in 2013 had geometric mean concentrations of PFBA ranging from 2.83 to 6.38 ng/L. Michigan does not have drinking or surface water criteria for PFBA. The Minnesota Department of Health established a human health risk limit for PFBA of 7 µg/L (7,000 ng/L) in drinking water, substantially higher than concentrations measured in this survey. PFOS was detected in water samples collected from Clark’s Marsh in 2011 and at 9 of the 12 sites sampled in 2013 (Table 3). The geometric mean concentration in the Clark’s Marsh samples was 5,099 ng/L. In comparison, PFOS concentrations at the other 9 sites with detectable levels ranged from 1.4 to 50.7 ng/L. The next highest PFOS surface water concentrations after Clark’s Marsh were found in samples from the Flint River; those concentrations were noticeably higher than concentrations measured at any of the other river sites. The concentrations of PFOS measured at Clark’s Marsh and at both sampling sites on the Flint River exceeded both the Michigan Rule 57 nondrinking and drinking water human health values of 12 ng/L and 11 ng/L, respectively. Only the Clark’s Marsh PFOS concentration exceeded the Rule 57 Final Chronic Value (FCV) (140 ng/L). PFOS was below the limit of detection in samples collected from the Thunder Bay, Tahquamenon, or Muskegon Rivers in 2013. Concentrations of PFOS in river water samples were lower at nearly all of the sites sampled in 2013 compared to concentrations in samples collected at the same sites in 2001 (Figure 3). The exception was the Flint River where the 2013 PFOS concentration was over 3 times higher than measured in 2001. PFOA was detected in water samples collected from Clark’s Marsh, and at all sites sampled in 2013 except the Tahquamenon River (Table 3). The geometric mean concentration in the Clark’s Marsh samples was 1,309 ng/L, and ranged from 1.0 to 4.3 ng/L at the sites sampled in

5
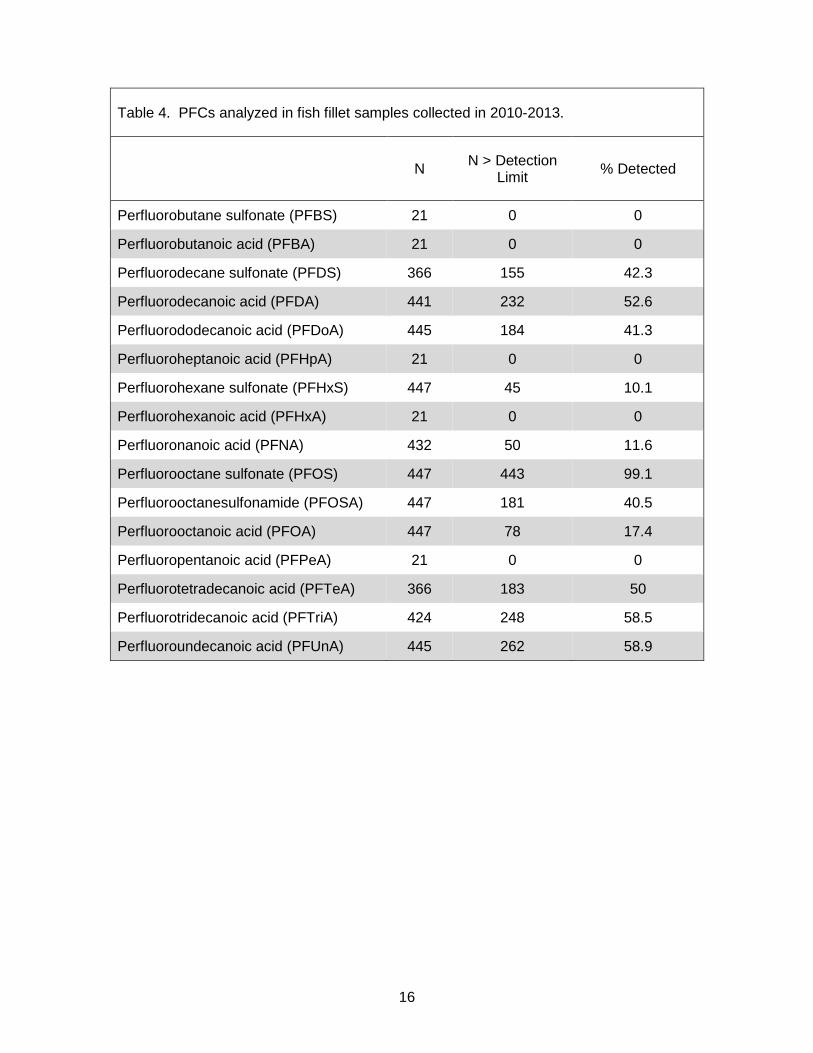
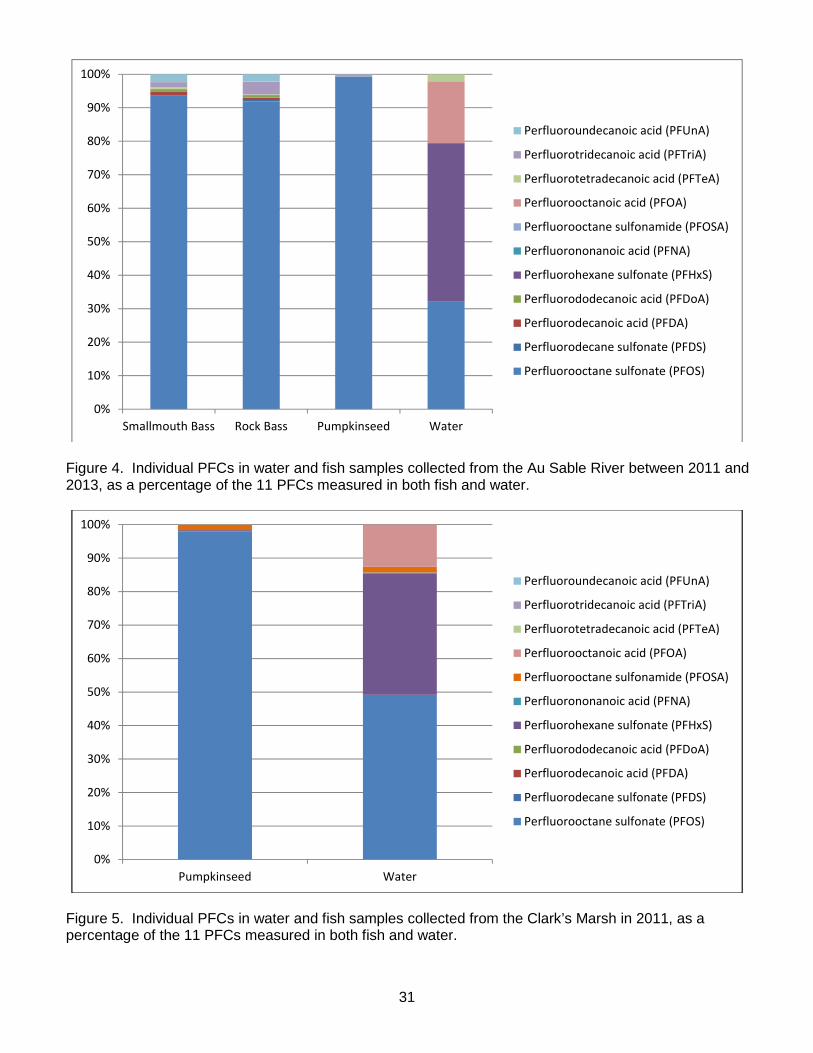
2013 (Table 3). Aside from Clark’s Marsh, PFOA concentrations were highest in the Kalamazoo, Flint, and Saginaw Rivers samples, and the concentrations in samples from those 3 water bodies were roughly equivalent. Geometric mean PFOA concentrations in samples from Van Etten Lake and the Au Sable, Thunder Bay, Muskegon, and St. Joseph Rivers were approximately half the concentrations measured at the other sites sampled in 2013. The Clark’s Marsh PFOA concentration did not exceed the nondrinking water human health value, but it did exceed the Rule 57 drinking water value (420 ng/L) and the FCV (880 ng/L). However, since Clark’s Marsh is not protected as a drinking water source, the drinking water number does not apply. No samples collected in 2013 had PFOA concentrations exceeding Rule 57 water quality values. Concentrations of PFOA in river water samples were substantially lower at 7 of the 8 sites sampled in 2013 compared to concentrations at the same sites in 2001 (Figure 3). The exception was the Au Sable River where the 2013 concentration was slightly higher than measured in 2001. Six PFCs were not detected in any of the 39 water samples, and 1 compound (PFOSA), was detected only in the Clark’s Marsh samples (Table 3). The number of PFCs detected and the total PFC concentrations measured were largely related to the relative urbanization of the watershed, with the exception of the areas sampled near the WAFB (Table 3). The Tahquamenon River flows through primarily forested, undeveloped land in the eastern Upper Peninsula. Two PFCs were detected in the Tahquamenon River water samples, with a total geometric mean of 3.4 ng/L. The Thunder Bay River and upper Muskegon River sample sites also represent areas with relatively low urbanization and had similarly low total PFC concentrations. In contrast, the Flint River sampling site represents a largely urbanized and industrialized watershed; samples taken there had the highest number of PFCs overall and the highest total concentration outside of the WAFB area (Table 3). 4.2 PFCs in Fish Fillets PFCs have been analyzed in a total of 447 fish fillet samples collected between 2010 and 2013. Five compounds (PFBS, PFBA, PFHpA, PFHxA, and PFPeA) were analyzed only in the 21 samples assayed by Axys Analytical Services, and were not detected in any of those samples (Table 4). Two compounds, PFDS and PFTeA, were not assayed in the 2010 and 2011 samples analyzed by the MDHHS-ACL, but were added to the PFC analyte list for the analysis of the 2012 and 2013 samples. PFOS was detected in nearly all of the fish fillet samples analyzed (Table 4). The highest PFOS concentrations were measured in pumpkinseed and bluegill from Clark’s Marsh, with concentrations ranging from 3,170 to 9,580 µg/kg in the upper pond samples. In addition, 1 pumpkinseed collected from the Au Sable River (near the river mouth) had a PFOS concentration of 2,956 µg/kg. PFOS concentrations measured in all other samples from the Au Sable River, Van Etten Lake, and water bodies statewide ranged from at or below the quantitation limit (0.25 µg/kg) to 610 µg/kg. Mean PFOS concentrations in fish and water are presented in Table 5. PFOS comprised from 44.5% to 99.2% of the total PFC concentration in fish fillets, and averaged 82% across all species and sites sampled in 2013 (Tables 6-16; Figures 4-14). The highest average PFOS concentration outside of the Oscoda WAFB area was measured in

6
samples from the Flint River, where smallmouth bass had a mean concentration of 132.1 µg/kg (Table 8; Figure 6). PFOS was also the dominant PFC measured in walleye fillets from 8 selected water bodies sampled between 2010 and 2014 (Figure 15). Four PFCs were detected in 50 to 60% of the fillet samples (Table 4). Those 4 (PFUnA, PFTeA, PFTriA, and PFDA) comprised 3.5%, 3.3%, 3.3%, and 1.6% of the total PFC concentration on average, respectively. PFOA was detected in 17% of all fish samples, but only in samples from the Saginaw and Thunder Bay Rivers (Tables 4, 12, and 15; Figures 10 and 13). Overall PFOA comprised less than 1% of the total PFC concentration. The maximum average PFOA concentration of 2.6 µg/kg was measured in smallmouth bass from the Saginaw River. 4.2.1 Factors Affecting PFC Concentrations in Fish Tissue The concentration of many bioaccumulative contaminants in a fish increases as the fish ages, and comparing concentrations between water bodies should take fish age into account. Determining the age of a fish is somewhat labor intensive; since fish length generally serves as a proxy for fish age, it is substituted when comparing contaminant concentrations between different fish populations. Fish length versus total PFC concentration was evaluated for several species at all locations either graphically or using linear regression. There was no significant relationship between fish length and total PFC or PFOS concentrations. Many contaminants are strongly associated with lipids (e.g., PCBs, chlorinated pesticides, dioxins). PFCs, however, tend to bind to proteins rather than fatty tissues, and percent lipid does not act as a good predictor of PFC concentration in fish. There was no significant relationship between fish lipid content and total PFC or PFOS concentrations. The lack of a relationship between PFC concentration and fish length or lipid content is also reported in work by the Minnesota Pollution Control Agency (MPCA, 2010). 4.2.2 Inter-Species Differences Rates of contaminant uptake and retention tend to vary between fish species, based on food habits, preferred habitat, and inter-species differences in metabolism and physiology. This tendency holds for at least some PFCs assayed in fish tissue for this study. Average concentrations of total PFCs and PFOS were highest in the top predator (smallmouth bass) at all sites sampled in 2013 with the exception of the St. Joseph and Au Sable Rivers (Figures 16 and 17); rock bass and bluegill/pumpkinseed, respectively, had higher average concentrations at those 2 sampling sites. Carp had the lowest average total PFC and PFOS concentrations compared to the other species at all 8 sites where carp were collected.

7
4.2.3 Spatial Differences
Smallmouth bass were collected at all 8 sites sampled in 2013, and all samples had quantifiable levels of PFCs. The smallmouth bass collected from the Au Sable River in 2011 and 2012 also had quantifiable levels of PFCs. PFOS was detected in all smallmouth bass samples. The species provides the best results for use in between-site comparisons. Concentrations of total PFCs and PFOS in smallmouth bass were highest in the Flint River samples. PFOS concentrations there were statistically different than in smallmouth bass from the Saginaw, St. Joseph, Thunder Bay, Tahquamenon, and Muskegon Rivers (Figure 18). Walleye collected from 8 sites (Table 1; Figure 19) also provide an indicator of the distribution of PFOS in Michigan waters. The median PFOS concentrations were low in walleye from Hoist Basin (Marquette County), Lake St. Helen (Roscommon County), Otter Lake (Houghton County), and the St. Marys River at Munuscong Bay. These sampling sites represent watersheds with relatively low population density and little industrial activity. Walleye from Lake Erie and Little Bay De Noc (northern Lake Michigan) represent watersheds that have been impacted by manufacturing activity and a higher degree of urbanization; PFOS concentrations in those fish were relatively elevated. The highest medians and greatest range of PFOS concentrations in walleye were measured in samples from Van Etten Lake and the Au Sable River, both likely to have been influenced by legacy contamination. 4.2.4 Fish Consumption Guidance Based on PFOS MDHHS toxicologists have developed fish consumption screening values (FCSV) for 7 contaminants found in fish, including PFOS (MDCH, 2014a). The MDHHS uses those values to issue consumption advice based on estimated concentrations of the contaminants in sport-caught fish. The protocol for determining a recommended safe rate of consumption includes the calculation of the upper 95% confidence limit (95% UCL) on the mean concentration of a specified contaminant in a fish species collected from a given water body. According to the protocol (MDCH, 2014b) a minimum of 5 fish of legal size are needed for a valid calculation. The 95% UCL is then compared to the FCSV to decide the appropriate safe rate of consumption. The MDHHS developed FCSVs corresponding to fish consumption rates varying from 16 meals per month to a “Do Not Eat” recommendation. The MDHHS does not determine the potential health risk for people consuming more than 16 meals of fish per month. The 95% UCL of the mean PFOS concentration calculated for the 42 different fish populations sampled are presented in Table 17. The corresponding rates of consumption based on the MDHHS screening values for PFOS are presented in Table 18. Note that these consumption rates are based solely on PFOS concentrations, and that the final consumption advice will be provided by the MDHHS in their “Eat Safe Fish” Guides. The “Eat Safe Fish” guidelines are based on all contaminants analyzed in the samples and in some cases are also subject to management determinations. PFOS concentrations exceeded the 16 meals per month FCSV (9 µg/kg) in 28 of the 42 (67%) fish populations sampled. Pumpkinseed from Clark’s Marsh and smallmouth bass from the Kalamazoo River at New Richmond had PFOS concentrations exceeding the Do Not Eat FCSV (300 µg/kg). The Kalamazoo River downstream of Morrow Dam to the river mouth, which includes the New Richmond reach, is under a “Do Not Eat” advisory for all species due to legacy PCB contamination. It is unlikely that PFOS will be the primary contaminant driving

8
consumption advice in any of the waters sampled, with the exception of those waters affected by the WAFB contamination. 4.3 PFC Bioaccumulation Fillet Bioaccumulation Factors (BAFs) were derived for PFOS and PFOA so that they could be compared to fillet BAFs used to derive Rule 57 human health values. Fillet BAFs were not derived for the other PFCs because they were not routinely detected in fish and water samples and insufficient toxicity data were available to derive Rule 57 human health values. Table 19 shows the fillet BAFs that were calculated for PFOS using the data presented in this report. The magnitude of the BAFs varied based on species, trophic level, and location. The trophic level 3 BAF for all sites (bluegill/pumpkinseed) was 3,535 liters per kilogram (L/kg), whereas, the trophic level 4 BAF for all sites (averaging values for largemouth/smallmouth bass and rock bass) was 8,371 L/kg. The data suggested that the fillet BAFs may be lower when levels of PFOS in the water column are extremely high. This finding is supported by a study which found that green mussels (Perna viridis) exposed to 1 ug/L accumulated 1.6 times more PFOS than mussels exposed to 10 ug/L (Liu et al., 2011). The researchers concluded from their study that PFOS exhibited a nonlinear adsorption mechanism. Of the 13 sites analyzed in this study, only the Saginaw and Thunder Bay Rivers had measurable levels of PFOA in water and fish fillets. BAFs of 845 and 781 L/kg were calculated for smallmouth bass and pumpkinseed, respectively, for the Saginaw River and a BAF of 327 L/kg was calculated for smallmouth bass for the Thunder Bay River. It was unclear why the BAFs for these 2 sites were higher than expected. 5. Water Quality Values Sufficient data were only available to derive water quality values for PFOS and PFOA. It is unknown whether the other PFCs measured in surface water and fish in this study could enhance the toxicity of PFOS or PFOA. Provided below is the basis for the human health and aquatic life values for PFOS and PFOA. An estimated wildlife value (WV) was derived for PFOS using the methodology provided in Rule 57 (R 323.1057[3]) of the Part 4 Rules, Water Quality Standards, promulgated under Part 31, Water Resources Protection, of the Natural Resources and Environmental Protection Act, 1994 PA 451, as amended. The surface water concentrations measured in this study were compared to these values to assess whether human health, aquatic life, and wildlife could potentially be impacted.
5.1 Human Health
Human Noncancer Values (HNV)- An HNV is the concentration of a substance that can be present in surface waters without posing a human health concern following lifetime exposure via the ingestion of 15 grams of fish per day and either 0.01 liters (nondrinking water HNV) or 2 liters (drinking water HNV) of water per day. All surface waters of the state are protected for incidental ingestion of water, whereas, the Great Lakes, connecting channels, and surface waters

9
used as a drinking water source are protected for the consumption of 2 liters of water per day. The drinking and nondrinking water HNVs for PFOS are 11 and 12 ng/L, respectively (Appendix A). These 2 values are almost identical because the consumption of fish is the predominant route of exposure to PFOS due to its bioaccumulation potential. Water samples collected from Clark’s Marsh and the 2 sites sampled along the Flint River exceeded both human health values for PFOS. The drinking and nondrinking water HNVs for PFOA are 420 and 12,000 ng/L, respectively (Appendix A). Unlike PFOS, these 2 numbers differ significantly because the consumption of fish is not the predominant route of exposure to PFOA. None of the samples collected during this study exceeded either value. Fillet BAFs- As mentioned previously, HNVs protect for people consuming 15 grams of fish per day. The calculations assume that 76% and 24% of the 15 grams of fish consumed per day are from trophic levels 3 (forage fish) and 4 (piscivorous fish), respectively. BAFs relating fish fillet concentrations to water concentrations are used to determine the exposure of people to the contaminant via the consumption of fish. Trophic level 3 and trophic level 4 fillet BAFs of 2,329 and 5,047 L/kg, respectively, were derived for PFOS using samples collected from the Oscoda area (Table 20). These values were used to generate the PFOS HNVs. The fillet BAFs used to derive the human health values for PFOS were supported by the findings of this study. The additional data were not used to recalculate the fillet BAFs because more samples were available for the Oscoda area and it was more likely that the concentrations in the fish and water samples at this site were in equilibrium. The limited bioaccumulation data suggest that PFOA is not very bioaccumulative. The current BAF of 4 L/kg was based on a 12-day laboratory study using rainbow trout, which estimated a steady-state value using a kinetic model. A study in Minnesota did not detect PFOA in whole fish exposed to concentrations ranging from 18 to 33 ng/L in Lake Calhoun and a Mississippi pool (STS Consultants, 2007). The additional data collected in this study were not used to recalculate the fillet BAFs for PFOA used to derive the human health values because few sites had measurable levels of PFOA in both fish and water. 5.2 Aquatic Life An FCV is the surface water concentration of a substance that is not expected to cause injurious or debilitating effects to aquatic organisms following long-term exposure. The FCVs for PFOS and PFOA are 140 and 880 ug/L, respectively. None of the samples exceeded the FCV for PFOA. Only the water sample from Clark’s Marsh exceeded the Rule 57 FCV for PFOS. An Aquatic Maximum Value (AMV) is the surface water concentration of a substance that an aquatic community can be exposed to briefly without resulting in unacceptable effects.

10
The AMVs for PFOS and PFOA are 1,600 and 15,000 ug/L, respectively. None of the samples exceeded the AMVs for PFOS or PFOA. 5.3 Wildlife WVs- WVs are derived for the bioaccumulative chemicals of concern (BCCs) listed in the Part 4 rules. Even though PFOS is not listed in the Water Quality Standards, WV screening values were derived to aid in this assessment because studies have shown that PFOS has the potential to bioaccumulate to high levels in fish. WV screening levels were not derived for PFOA because it does not have the potential to bioaccumulate in fish to levels that would meet the definition of a BCC. A WV is the concentration of a substance that can be present in surface waters without causing population-level impacts on piscivorous wildlife like herring gulls, kingfishers, bald eagles, mink, and otters. Since the toxicity of PFOS to these wildlife species has not been examined, it was necessary to base the WVs on toxicity studies conducted on more routinely tested animals. The avian WV was based on a toxicity study in bobwhite quail, whereas, the mammalian WV was based on a toxicity study in rats. Safety factors were used to convert the safe doses in these species to doses that would be protective of each of the species of piscivorous wildlife mentioned above. Fish and water consumption rates for each of the wildlife species were then used to determine a surface water concentration that would be protective of each species of piscivorous wildlife. The geometric mean of the 3 avian values was used to derive the avian WV, whereas, the geometric mean of the 2 mammalian values was used to derive the mammalian WV. Avian and mammalian WVs of 35 and 84 ng/L, respectively, were derived for PFOS (Appendix A). The levels of PFOS in Clark’s Marsh and the 2 sites sampled along the Flint River exceeded these 2 values. Whole Fish BAFs- As mentioned previously, a WV is derived to protect piscivorous wildlife like kingfishers, herring gulls, bald eagles, mink, and otters. BAFs relating the concentration of the contaminant in whole fish are used to determine the exposure of wildlife to the contaminant via the consumption of fish. Due to the limited dataset in Michigan, contaminant data from 2 sites in Minnesota were also used to derive BAFs for whole fish. A trophic level 3 BAF of 2,367 L/kg was derived using the data for yellow perch, golden shiner, bluegill sunfish, and white bass (the bass were considered TL3 fish due to their small size). Since no data were available for trophic level 4 fish, the TL4 BAF was derived by multiplying the TL3 BAF for whole fish by the ratio of the TL4 fillet BAF to the TL3 fillet BAF. These values were used to generate the WVs for PFOS (Table 21). 6 CONCLUSIONS Total PFC concentrations in water varied widely across the state, with concentrations highest in rivers flowing through urban and industrialized areas. The former WAFB area has a known legacy contamination issue and is an exception to this. The composition of the PFC totals also varied significantly across sampling sites, indicating varied sources and magnitudes of contamination. Future source investigations should focus on locations where PFOS-based

11
firefighting foam may have been used in large quantities, and on sources in urban centers. The co-location of fish and water samples successfully identified the presence and variation of PFCs in Michigan waters, and identified locations that are minimally impacted by PFCs. The concentrations of PFOS and PFOA in the 13 Michigan surface waters tested are unlikely to impact aquatic life, except in Clark’s Marsh. Comparison of surface water concentrations to the estimated WV for PFOS suggest that a more thorough assessment may be warranted to determine whether PFOS is impacting wildlife in the Oscoda area and along the Flint River. Limited ecological risk assessment work is currently being conducted in the Oscoda area by the U. S. Geological Survey. The results of this study might provide some insight into potential for wildlife to be impacted along the Flint River. The surface water samples taken at the 13 locations listed in Table 1 suggest that human health is not being impacted by PFOA, although it is unclear why levels of PFOA were elevated in some fish species in the Saginaw and Thunder Bay Rivers. The concentrations of PFOS in Clark’s Marsh provide support for the current fish consumption advisories in the Oscoda area. The surface water concentration of PFOS and the accompanying fish data for the Flint River suggest that the MDHHS should assess whether fish consumption advisories specific to PFOS are needed (it is possible that the current fish consumption advisory for PCBs in the Flint River would also protect for PFOS). Report By: Dennis Bush, Toxicologist Joseph Bohr, Aquatic Biologist Specialist Amy Babcock, Toxicologist Surface Water Assessment Section Water Resources Division
ACKNOWLEDGEMENTS Funding for this project was provided, in part, through a USEPA-GLRI grant to the MDHHS. Additional funds were provided through the Clean Michigan Initiative-Clean Water Fund.
12
REFERENCES
Aiello, C. 2005. Michigan Water Chemistry Monitoring Great Lakes Tributaries 2003 Report. MDEQ Staff Report #MI/DEQ/WB-05/058. Giesy, J. and K. Kannan. 2002. Perfluorochemical Surfactants in the Environment. Environ.
Sci. Technol 36:146A-152A. Liu, C., K.Y.H. Gin, V.W.C. Chang, B.P.L. Goh, and M. Reinhard. 2011. Novel Perspectives
on the Bioaccumulation of PFCs—the Concentration Dependency. Environ. Sci. Technol. 45:9758-9764.
MDCH. 2014a. Technical Support Document for Assessment of Perfluorinated Chemicals
and Selection of a Perfluorooctane Sulfonate (PFOS) Reference Dose as the Basis for Michigan Fish Consumption Screening Values (FCSVs). http://www.michigan.gov/documents/MDHHS/MDHHS_PFOS_Health_Consultation_2014_468766_7.pdf.
MDCH. 2014b. Michigan Fish Consumption Advisory Program Guidance Document.
Lansing, Michigan. http://www.michigan.gov/documents/mdch/MDCH_MFCAP_Guidance_Document_417043_7.pdf.
MPCA. 2010. Mississippi River Pool 2 Intensive Study of Perfluorochemicals in Fish and
Water: 2009. http://www.pca.state.mn.us/index.php/view-document.html?gid=15527. Retrieved 3/25/2015.
STS Consultants, Ltd. 2007. Surface Water Quality Criterion for Perfluorooctanoic Acid.
Prepared for the Minnesota Pollution Control Agency. U.S. Geological Survey. Variously Dated. National Field Manual for the Collection of
Water-Quality Data: U.S. Geological Survey Techniques of Water-Resources Investigations, Book 9, Chaps. A1-A9. Available Online at http://pubs.water.usgs.gov/twri9A.

13
Table 1. Water and fish collection sites in Michigan for analysis of PFCs, 2010-2014.
Sample Site Site Selection Rationale Water Sampled
Number of Fish Sampled by Species
Car
p
Blu
egill
/ P
umpk
inse
ed
Roc
k ba
ss
Larg
emou
th /
Sm
allm
outh
ba
ss
Rai
nbow
trou
t (S
teel
head
)
Wal
leye
Whi
te s
ucke
r
Yel
low
per
ch
Au Sable River near mouth Known source upstream X 4 8 20 10
Flint River at M-13 Elevated PFOS water concentration in 2001 X no fish collection
Flint River at Montrose (Genesee County) Alternate fish collection site X 10 10 10
Kalamazoo River at New Richmond Elevated PFOS water concentration in 2001 X 10 10 10
Kalamazoo River / Lake Allegan Upstream/downstream comparisons X 10 10 10
Kalamazoo River upstream of Lake Allegan Downstream comparisons X no fish collection
Muskegon River at Rogers Dam Pond Low PFOS water concentration in 2001 X 10 10 10
Saginaw River near mouth Elevated PFOS water concentration in 2001 X 10 10 10
St. Joseph River near mouth Elevated PFOS water concentration in 2001 X 10 10 10
Tahquamenon River (near mouth) Low PFOS water concentration in 2001 X 6 8 10 6
Thunder Bay River / Lake Besser Low PFOS water concentration in 2001 X 10 10 12
Van Etten Lake (Iosco County) Near known source X 10 10 10 10
Clark's Marsh (Iosco County) Elevated PFOS water concentration in 2011 X 14
Dead River / Hoist Basin (Marquette County) Background fish tissue level 10
Lake Erie (off Monroe) Background fish tissue level 10
Lake Huron (Au Sable River) Popular sport fish (Human health concern)* 10 14
Lake Michigan (Little Bay De Noc) Background fish tissue level 10
Lake St. Helen (Roscommon County) Background fish tissue level 10
Otter Lake (Houghton County) Background fish tissue level 10
Rogue River / Rockford Impoundment (Kent County) Possible legacy source 10 10
St. Marys River (Munuscong Bay) Background fish tissue level 8
Shaded samples indicate analyses funded through EPA-GRI grant. * - analyses funded by Agency for Toxic Substances and Disease Registry

14
Table 2. PFCs as analyzed by media and laboratory.
Compound
Abb
revi
atio
n
T
estA
mer
ica
- W
ater
Axy
s -
Fis
h
M
DH
HS
-AC
L F
ish
- 20
10 &
201
1
M
DH
HS
-AC
L F
ish
– 20
12 &
201
3
Perfluorobutanoic acid PFBA X X
Perfluorooctanoic acid PFOA X X X X
Perfluorooctane sulfonate PFOS X X X X
Perfluoropentanoic acid PFPeA X X
Perfluorohexanoic acid PFHxA X X
Perfluoroheptanoic acid PFHpA X X
Perfluorononanoic acid PFNA X X X X
Perfluorodecanoic acid PFDA X X X X
Perfluoroundecanoic acid PFUnA X X X X
Perfluorododecanoic acid PFDoA X X X X
Perfluorotridecanoic acid PFTriA X X X
Perfluorotetradecanoic acid PFTeA X X
Perfluoro-n-hexadecanoic acid PFHxDA X Perfluoro-n-octandecanoic
acid PFODA X
Perfluorobutane sulfonate PFBS X X
Perfluorohexane sulfonate PFHxS X X X X
Perfluoro-1-heptane sulfonate PFHpS X
Perfluorodecane sulfonate PFDS X X
Perfluorooctane sulfonamide PFOSA X X X X

15
Table 3. Geometric mean concentration (ng/L) of PFCs in surface water samples collected in 2011 and 2013 by sample site. Blank indicates compound was not detected.
Compound
Au
Sab
le R
iver
Cla
rk’s
Mar
sh
Flin
t Riv
er -
M13
Flin
t Riv
er -
Mon
tros
e
Kal
amaz
oo R
iver
- N
ew
Ric
hmon
d
Kal
amaz
oo R
iver
- L
ake
Alle
gan
Kal
amaz
oo R
iver
- u
/s
Lake
Alle
gan
Mus
kego
n R
iver
Sag
inaw
Riv
er
St.
Jose
ph R
iver
Tah
quam
enon
Riv
er
Thu
nder
Bay
Riv
er
Van
Ette
n La
ke
Perfluoro-1-heptanesulfonate (PFHpS) 171 1.11
Perfluorobutane sulfonate (PFBS) 104 2.36 1.43 0.97 1.03 1.15 1.70 1.36
Perfluorobutanoic acid (PFBA) 2.83 116 6.38 4.75 3.10 2.83 3.20 3.54 5.09 3.64 3.18 3.06 3.59
Perfluorodecane sulfonate (PFDS)
Perfluorodecanoic acid (PFDA) 2.5 1.03 0.79 0.47
Perfluorododecanoic acid (PFDoA)
Perfluoroheptanoic acid (PFHpA) 0.85 173 2.12 3.45 0.91 1.01 1.04 0.84 1.48 0.93 0.84
Perfluorohexane sulfonate (PFHxS) 4.77 3756 2.25 1.87 1.40 1.58 1.78 2.00 1.08 3.20
Perfluorohexanoic acid (PFHxA) 1.60 922 5.70 8.43 2.19 2.00 2.07 4.33 2.02 0.85 1.16
Perfluoro-n-hexadecanoic acid (PFHxDA) 0.47 0.33 0.65 0.51 0.47 0.54 0.35 0.45 0.94 0.17 0.38 0.49
Perfluoro-n-octandecanoic acid (PFODA)
Perfluorononanoic acid (PFNA) 24.2 2.43 0.80 1.60
Perfluorooctane sulfonamide (PFOSA) 172
Perfluorooctane sulfonate (PFOS) 3.23 5099 40.98 50.66 6.82 6.73 7.62 9.53 1.55 1.37
Perfluorooctanoic acid (PFOA) 1.86 1309 4.19 2.29 3.42 3.92 4.26 1.03 3.10 1.82 1.01 1.20
Perfluoropentanoic acid (PFPeA) 1.26 418 4.40 10.32 1.65 1.66 1.70 1.06 3.34 1.45 1.22
Perfluorotetradecanoic acid (PFTeA) 0.21 0.44 0.38 0.23 0.25
Perfluorotridecanoic acid (PFTriA)
Perfluoroundecanoic acid (PFUnA)
TOTAL PFCs 17.10 12266 72.19 87.10 21.00 21.32 23.36 7.14 32.62 15.05 3.35 6.75 13.59
16
Table 4. PFCs analyzed in fish fillet samples collected in 2010-2013.
N N > Detection Limit % Detected
Perfluorobutane sulfonate (PFBS) 21 0 0
Perfluorobutanoic acid (PFBA) 21 0 0
Perfluorodecane sulfonate (PFDS) 366 155 42.3
Perfluorodecanoic acid (PFDA) 441 232 52.6
Perfluorododecanoic acid (PFDoA) 445 184 41.3
Perfluoroheptanoic acid (PFHpA) 21 0 0
Perfluorohexane sulfonate (PFHxS) 447 45 10.1
Perfluorohexanoic acid (PFHxA) 21 0 0
Perfluoronanoic acid (PFNA) 432 50 11.6
Perfluorooctane sulfonate (PFOS) 447 443 99.1
Perfluorooctanesulfonamide (PFOSA) 447 181 40.5
Perfluorooctanoic acid (PFOA) 447 78 17.4
Perfluoropentanoic acid (PFPeA) 21 0 0
Perfluorotetradecanoic acid (PFTeA) 366 183 50
Perfluorotridecanoic acid (PFTriA) 424 248 58.5
Perfluoroundecanoic acid (PFUnA) 445 262 58.9

17
Table 5. Mean concentrations of PFOS measured in water and fish fillets collected from Clark’s Marsh in 2011 and from several sites statewide in 2012 and 2013.
Sample Site Collection Date
Geometric Mean
PFOS in Water (ng/L)
Arithmetic Mean PFOS in Fish Fillets (ug/kg)
All
Spe
cies
C
ombi
ned
Car
p
Larg
emou
th /
Sm
allm
outh
Bas
s
Blu
egill
/ P
umpk
inse
ed
Roc
k B
ass
Wal
leye
Whi
te S
ucke
r
Au Sable River - Mill St 7/1/2013 3.2 124.4 -- 80.1 771 24.7 -- 33.9 Clark's Marsh 8/16/2011 5099 5498 -- -- 5498 -- -- -- Flint River - M13 8/2/2013 41 -- -- -- -- -- -- -- Flint River - Montrose 10/31/2013 50.7 92.8 51.6 132.1 -- 94.8 -- -- Kalamazoo River-New Richmond 6/11/2013 6.8 61.6 28.1 111.2 45.4 -- -- -- Kalamazoo-Lake Allegan 6/11/2013 6.7 52.2 36.4 82.5 37.5 -- -- -- Kalamazoo River u-s Lake Allegan 6/11/2013 7.6 -- -- -- -- -- -- -- Muskegon River - Hersey 6/6/2013 1.3 (ND) 1.8 1.0 1.3 3.1 -- -- -- Saginaw River - Essexville 8/2/2013 9.5 22.8 13.8 31 23.4 -- -- -- St. Joseph River - Riverview Park 9/11/2013 1.6 31.1 21.0 21.7 -- 50.7 -- -- Tahquamenon River - mouth 6/18/2013 1.3 (ND) 1.9 0.5 2.2 -- 2.5 -- -- Thunder Bay River - Lake Besser 7/1/2013 1.3 (ND) 1.7 0.3 2.7 -- 1.8 -- -- Van Etten Lake 7/1/2013 1.4 13.9 -- -- 8.4 10.8 23.7 12.6
18
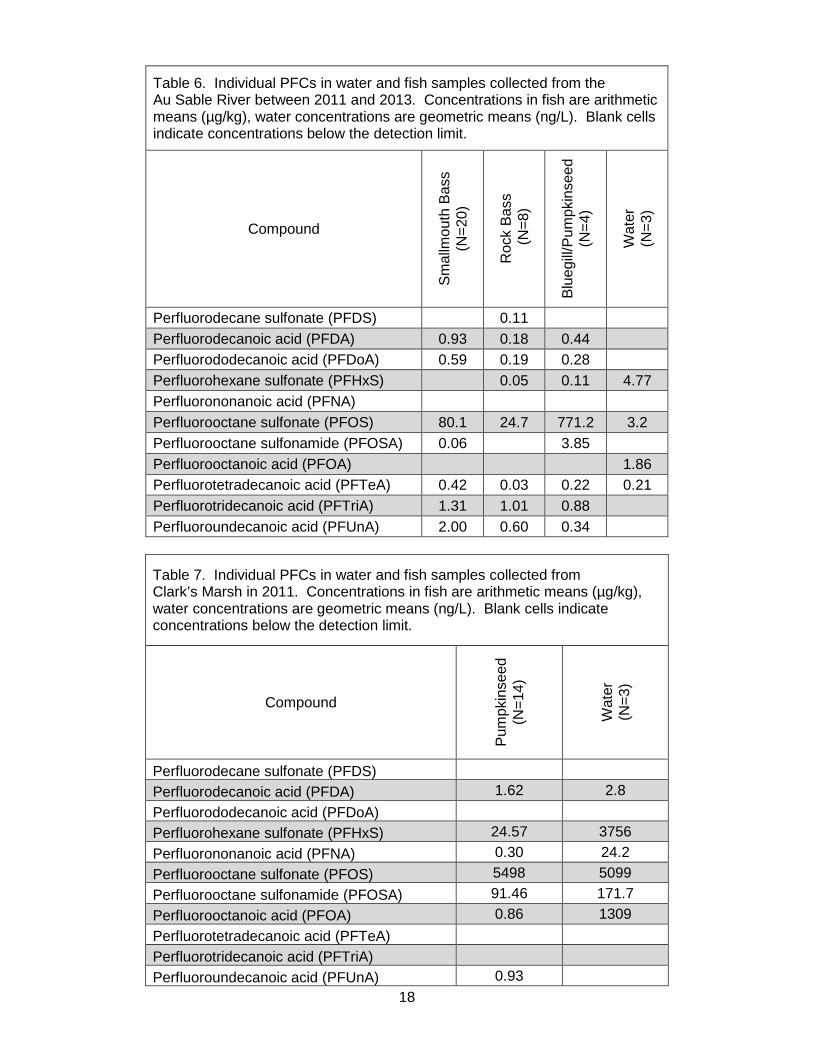
Table 6. Individual PFCs in water and fish samples collected from the Au Sable River between 2011 and 2013. Concentrations in fish are arithmetic means (µg/kg), water concentrations are geometric means (ng/L). Blank cells indicate concentrations below the detection limit.
Compound
Sm
allm
outh
Bas
s (N
=20
)
Roc
k B
ass
(N
=8)
Blu
egill
/Pum
pkin
seed
(N
=4)
Wat
er
(N=
3)
Perfluorodecane sulfonate (PFDS) 0.11
Perfluorodecanoic acid (PFDA) 0.93 0.18 0.44
Perfluorododecanoic acid (PFDoA) 0.59 0.19 0.28
Perfluorohexane sulfonate (PFHxS) 0.05 0.11 4.77 Perfluorononanoic acid (PFNA)
Perfluorooctane sulfonate (PFOS) 80.1 24.7 771.2 3.2 Perfluorooctane sulfonamide (PFOSA) 0.06 3.85
Perfluorooctanoic acid (PFOA) 1.86 Perfluorotetradecanoic acid (PFTeA) 0.42 0.03 0.22 0.21 Perfluorotridecanoic acid (PFTriA) 1.31 1.01 0.88
Perfluoroundecanoic acid (PFUnA) 2.00 0.60 0.34
Table 7. Individual PFCs in water and fish samples collected from Clark’s Marsh in 2011. Concentrations in fish are arithmetic means (µg/kg), water concentrations are geometric means (ng/L). Blank cells indicate concentrations below the detection limit.
Compound
Pum
pkin
seed
(N
=14
)
Wat
er
(N=
3)
Perfluorodecane sulfonate (PFDS)
Perfluorodecanoic acid (PFDA) 1.62 2.8
Perfluorododecanoic acid (PFDoA)
Perfluorohexane sulfonate (PFHxS) 24.57 3756
Perfluorononanoic acid (PFNA) 0.30 24.2
Perfluorooctane sulfonate (PFOS) 5498 5099
Perfluorooctane sulfonamide (PFOSA) 91.46 171.7
Perfluorooctanoic acid (PFOA) 0.86 1309
Perfluorotetradecanoic acid (PFTeA)
Perfluorotridecanoic acid (PFTriA)
Perfluoroundecanoic acid (PFUnA) 0.93

19
Table 8. Individual PFCs in water and fish samples collected from the Flint River in 2013. Concentrations in fish are arithmetic means (µg/kg), water concentrations are geometric means (ng/L). Blank cells indicate concentrations below the detection limit.
Compound
Car
p (N
=10
)
Sm
allm
outh
B
ass
(N=
10)
Roc
k B
ass
(N=
10)
Wat
er
(N=
3)
Perfluorodecane sulfonate (PFDS) 0.95 0.76 0.89
Perfluorodecanoic acid (PFDA) 0.80 2.20 1.62 0.79
Perfluorododecanoic acid (PFDoA) 0.93 2.32 1.50
Perfluorohexane sulfonate (PFHxS) 1.87
Perfluorononanoic acid (PFNA) 0.80
Perfluorooctane sulfonamide (PFOSA) 0.30 0.47 0.36
Perfluorooctane sulfonate (PFOS) 51.6 132.1 94.8 50.7
Perfluorooctanoic acid (PFOA) 2.29
Perfluorotetradecanoic acid (PFTeA) 0.68 0.60 0.44
Perfluorotridecanoic acid (PFTriA) 0.78 0.58
Perfluoroundecanoic acid (PFUnA) 0.49 2.32 1.36
Table 9. Individual PFCs in water and fish samples collected from the Kalamazoo River at Lake Allegan in 2013. Concentrations in fish are arithmetic means (µg/kg), water concentrations are geometric means (ng/L). Blank cells indicate concentrations below the detection limit.
Compound
Car
p (N
=10
)
Sm
allm
outh
Bas
s (N
=10
)
Blu
egill
(N
=10
)
Wat
er
(N=
3)
Perfluorodecane sulfonate (PFDS) 0.68 0.64 0.22 Perfluorodecanoic acid (PFDA) 0.58 0.61 Perfluorododecanoic acid (PFDoA) 0.24 0.04 Perfluorohexane sulfonate (PFHxS) 1.58 Perfluorononanoic acid (PFNA) Perfluorooctane sulfonate (PFOS) 36.4 82.5 37.5 6.7 Perfluorooctane sulfonamide (PFOSA) 0.78 1.63 0.28 Perfluorooctanoic acid (PFOA) 3.92 Perfluorotetradecanoic acid (PFTeA) 0.04 1.18 Perfluorotridecanoic acid (PFTriA) Perfluoroundecanoic acid (PFUnA) 0.36

20
Table 10. Individual PFCs in water and fish samples collected from the Kalamazoo River at New Richmond in 2013. Concentrations in fish are arithmetic means (µg/kg), water concentrations are geometric means (ng/L). Blank cells indicate concentrations below the detection limit.
Compound
Car
p (N
=10
)
Sm
allm
outh
B
ass
(N=
10)
Blu
egill
(N
=10
)
Wat
er
(N=
3)
Perfluorodecane sulfonate (PFDS) 0.52 1.69 0.18 Perfluorodecanoic acid (PFDA) 0.03 2.09 0.17 Perfluorododecanoic acid (PFDoA) 1.06 0.09 Perfluorohexane sulfonate (PFHxS) 1.4 Perfluorononanoic acid (PFNA) Perfluorooctane sulfonate (PFOS) 28.1 111.2 45.4 6.8 Perfluorooctane sulfonamide (PFOSA) 0.51 2.92 0.52 Perfluorooctanoic acid (PFOA) 3.42 Perfluorotetradecanoic acid (PFTeA) 0.66 0.82 Perfluorotridecanoic acid (PFTriA) 1.89 0.43 Perfluoroundecanoic acid (PFUnA) 2.33 0.08
Table 11. Individual PFCs in water and fish samples collected from the Muskegon River in 2013. Concentrations in fish are arithmetic means (µg/kg), water concentrations are geometric means (ng/L). Blank cells indicate concentrations below the detection limit.
Compound
Car
p (N
=10
)
Sm
allm
outh
B
ass
(N=
10)
Blu
egill
(N
=10
)
Wat
er
(N=
3)
Perfluorodecane sulfonate (PFDS) 0.04 Perfluorodecanoic acid (PFDA) 0.05 0.04 Perfluorododecanoic acid (PFDoA) 0.03 Perfluorohexane sulfonate (PFHxS) Perfluorononanoic acid (PFNA) Perfluorooctane sulfonate (PFOS) 1.0 1.3 3.1 Perfluorooctane sulfonamide (PFOSA) Perfluorooctanoic acid (PFOA) 1.03 Perfluorotetradecanoic acid (PFTeA) 0.03 0.3 Perfluorotridecanoic acid (PFTriA) 0.03 0.03 Perfluoroundecanoic acid (PFUnA) 0.3 0.1
21
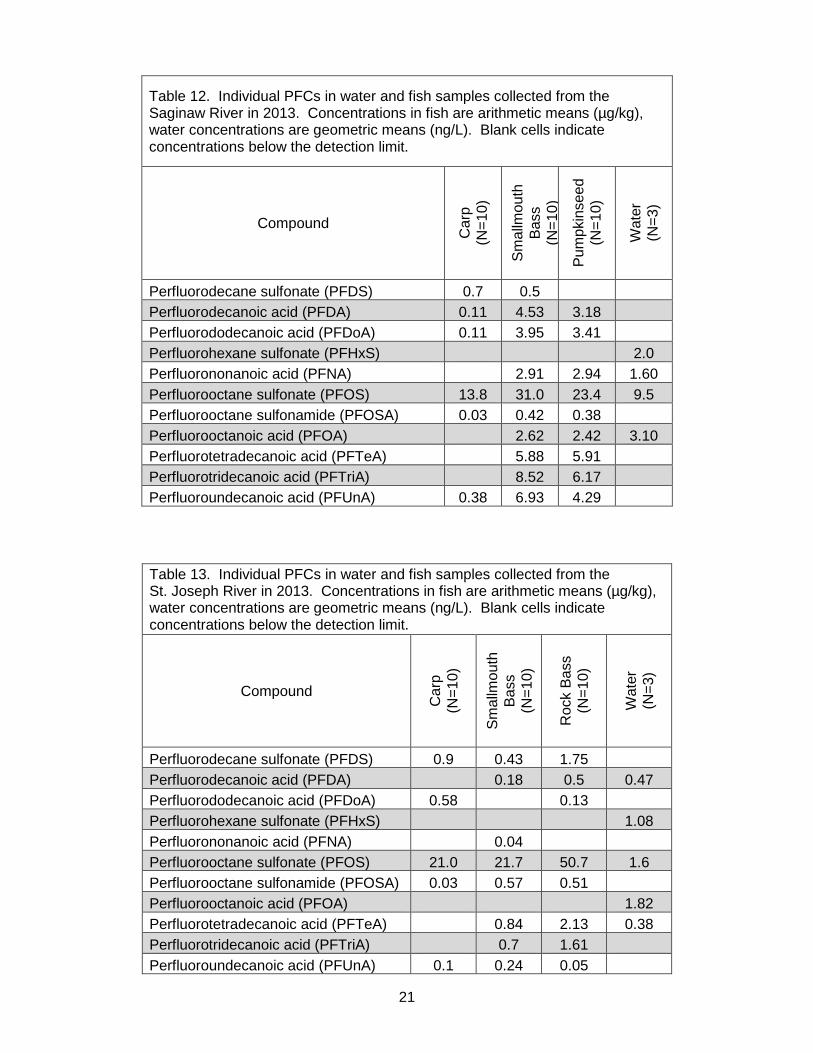
Table 12. Individual PFCs in water and fish samples collected from the
Saginaw River in 2013. Concentrations in fish are arithmetic means (µg/kg), water concentrations are geometric means (ng/L). Blank cells indicate concentrations below the detection limit.
Compound
Car
p (N
=10
)
Sm
allm
outh
B
ass
(N=
10)
Pum
pkin
seed
(N
=10
)
Wat
er
(N=
3)
Perfluorodecane sulfonate (PFDS) 0.7 0.5
Perfluorodecanoic acid (PFDA) 0.11 4.53 3.18 Perfluorododecanoic acid (PFDoA) 0.11 3.95 3.41
Perfluorohexane sulfonate (PFHxS) 2.0
Perfluorononanoic acid (PFNA) 2.91 2.94 1.60
Perfluorooctane sulfonate (PFOS) 13.8 31.0 23.4 9.5
Perfluorooctane sulfonamide (PFOSA) 0.03 0.42 0.38 Perfluorooctanoic acid (PFOA) 2.62 2.42 3.10
Perfluorotetradecanoic acid (PFTeA) 5.88 5.91
Perfluorotridecanoic acid (PFTriA) 8.52 6.17 Perfluoroundecanoic acid (PFUnA) 0.38 6.93 4.29
Table 13. Individual PFCs in water and fish samples collected from the St. Joseph River in 2013. Concentrations in fish are arithmetic means (µg/kg), water concentrations are geometric means (ng/L). Blank cells indicate concentrations below the detection limit.
Compound
Car
p (N
=10
)
Sm
allm
outh
B
ass
(N=
10)
Roc
k B
ass
(N=
10)
Wat
er
(N=
3)
Perfluorodecane sulfonate (PFDS) 0.9 0.43 1.75
Perfluorodecanoic acid (PFDA) 0.18 0.5 0.47
Perfluorododecanoic acid (PFDoA) 0.58 0.13
Perfluorohexane sulfonate (PFHxS) 1.08
Perfluorononanoic acid (PFNA) 0.04
Perfluorooctane sulfonate (PFOS) 21.0 21.7 50.7 1.6
Perfluorooctane sulfonamide (PFOSA) 0.03 0.57 0.51 Perfluorooctanoic acid (PFOA) 1.82
Perfluorotetradecanoic acid (PFTeA) 0.84 2.13 0.38
Perfluorotridecanoic acid (PFTriA) 0.7 1.61 Perfluoroundecanoic acid (PFUnA) 0.1 0.24 0.05
22
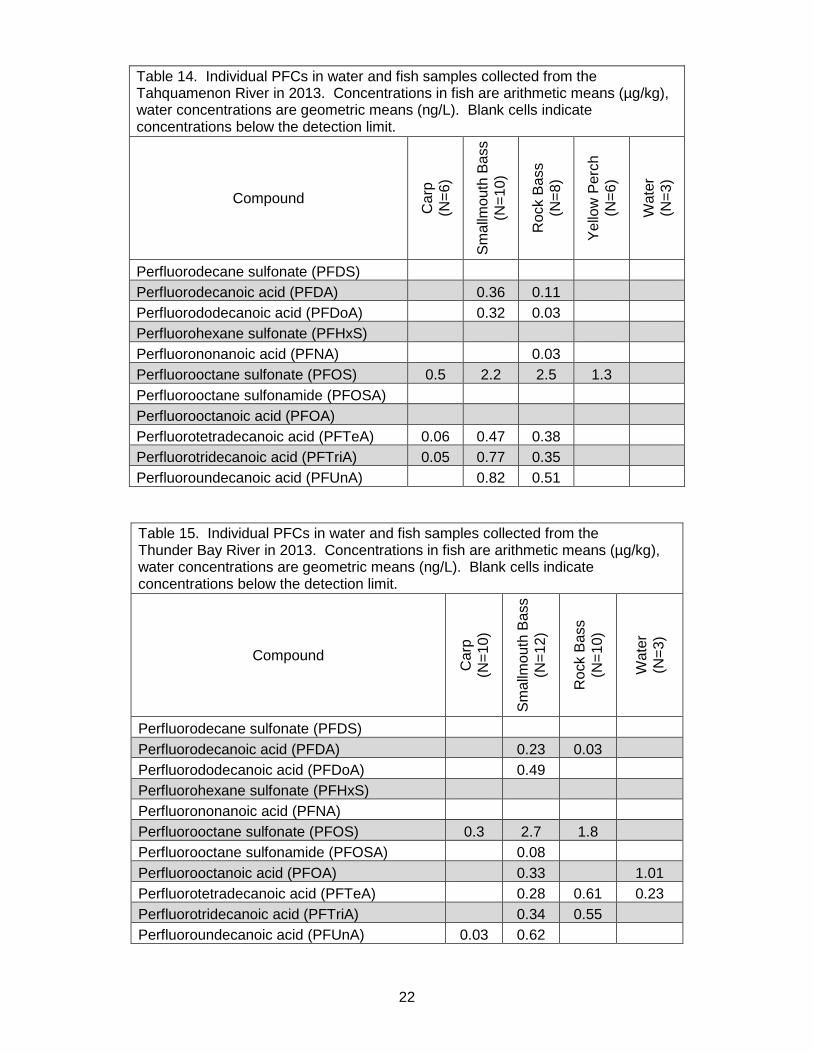
Table 14. Individual PFCs in water and fish samples collected from the Tahquamenon River in 2013. Concentrations in fish are arithmetic means (µg/kg), water concentrations are geometric means (ng/L). Blank cells indicate concentrations below the detection limit.
Compound
Car
p (N
=6)
Sm
allm
outh
Bas
s (N
=10
)
Roc
k B
ass
(N=
8)
Yel
low
Per
ch
(N=
6)
Wat
er
(N=
3)
Perfluorodecane sulfonate (PFDS)
Perfluorodecanoic acid (PFDA) 0.36 0.11
Perfluorododecanoic acid (PFDoA) 0.32 0.03
Perfluorohexane sulfonate (PFHxS)
Perfluorononanoic acid (PFNA) 0.03
Perfluorooctane sulfonate (PFOS) 0.5 2.2 2.5 1.3
Perfluorooctane sulfonamide (PFOSA)
Perfluorooctanoic acid (PFOA)
Perfluorotetradecanoic acid (PFTeA) 0.06 0.47 0.38
Perfluorotridecanoic acid (PFTriA) 0.05 0.77 0.35
Perfluoroundecanoic acid (PFUnA) 0.82 0.51
Table 15. Individual PFCs in water and fish samples collected from the Thunder Bay River in 2013. Concentrations in fish are arithmetic means (µg/kg), water concentrations are geometric means (ng/L). Blank cells indicate concentrations below the detection limit.
Compound
Car
p (N
=10
)
Sm
allm
outh
Bas
s (N
=12
)
Roc
k B
ass
(N=
10)
Wat
er
(N=
3)
Perfluorodecane sulfonate (PFDS)
Perfluorodecanoic acid (PFDA) 0.23 0.03 Perfluorododecanoic acid (PFDoA) 0.49
Perfluorohexane sulfonate (PFHxS) Perfluorononanoic acid (PFNA)
Perfluorooctane sulfonate (PFOS) 0.3 2.7 1.8 Perfluorooctane sulfonamide (PFOSA) 0.08 Perfluorooctanoic acid (PFOA) 0.33 1.01
Perfluorotetradecanoic acid (PFTeA) 0.28 0.61 0.23
Perfluorotridecanoic acid (PFTriA) 0.34 0.55 Perfluoroundecanoic acid (PFUnA) 0.03 0.62
23
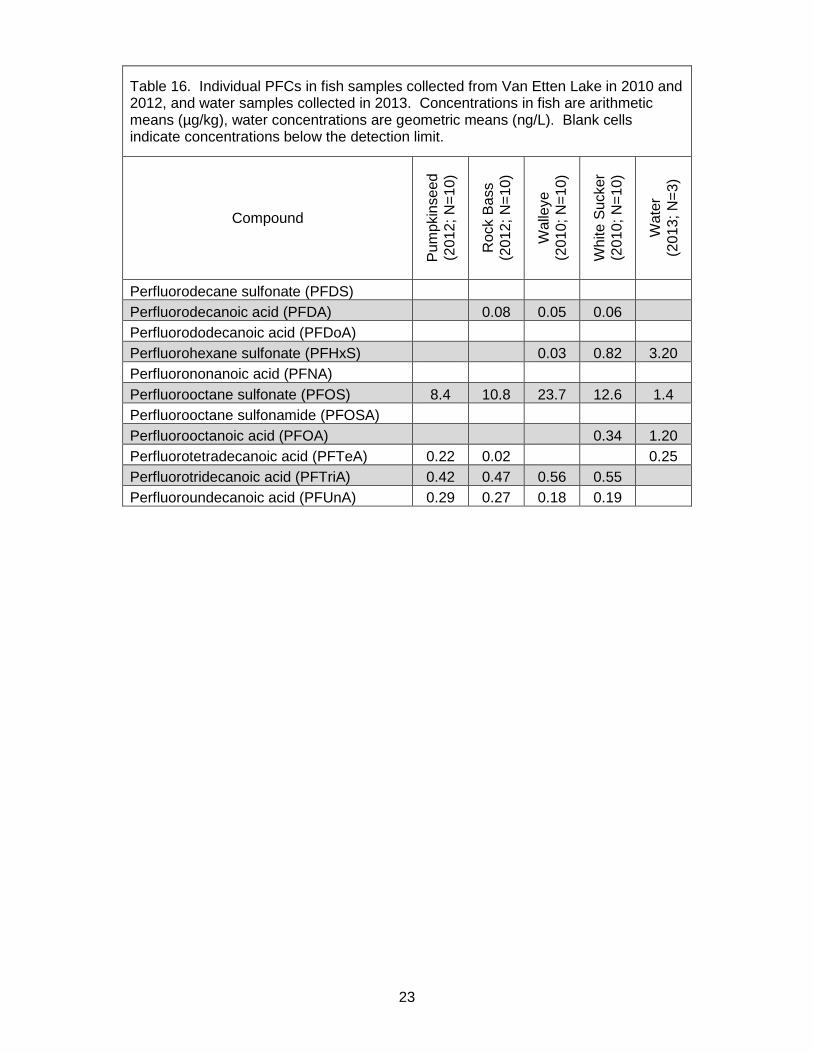
Table 16. Individual PFCs in fish samples collected from Van Etten Lake in 2010 and
2012, and water samples collected in 2013. Concentrations in fish are arithmetic means (µg/kg), water concentrations are geometric means (ng/L). Blank cells indicate concentrations below the detection limit.
Compound
Pum
pkin
seed
(2
012;
N=
10)
Roc
k B
ass
(201
2; N
=10
)
Wal
leye
(2
010;
N=
10)
Whi
te S
ucke
r (2
010;
N=
10)
Wat
er
(201
3; N
=3)
Perfluorodecane sulfonate (PFDS) Perfluorodecanoic acid (PFDA) 0.08 0.05 0.06 Perfluorododecanoic acid (PFDoA) Perfluorohexane sulfonate (PFHxS) 0.03 0.82 3.20 Perfluorononanoic acid (PFNA) Perfluorooctane sulfonate (PFOS) 8.4 10.8 23.7 12.6 1.4 Perfluorooctane sulfonamide (PFOSA) Perfluorooctanoic acid (PFOA) 0.34 1.20 Perfluorotetradecanoic acid (PFTeA) 0.22 0.02 0.25 Perfluorotridecanoic acid (PFTriA) 0.42 0.47 0.56 0.55 Perfluoroundecanoic acid (PFUnA) 0.29 0.27 0.18 0.19

24
Table 17. The 95% UCL on the mean PFOS concentration (µg/kg) in fish fillets sampled in 2010-2013.
C
arp
Sm
allm
outh
/Lar
gem
outh
Bas
s
Roc
k B
ass
Blu
egill
/Pum
pkin
seed
Yel
low
Per
ch
Ste
elhe
ad
Wal
leye
Whi
te S
ucke
r
Au Sable River 157 37.2 26 62
Clark's Marsh 5619
Flint River 64 154 120
Hoist Basin 1.0
Kalamazoo River (New Richmond) 38 329 56
Lake Allegan 43 93 52
Lake Erie 26
Lake Huron 19
Lake St. Helen 2.5
Little Bay de Noc 12
Muskegon River 1.6 1.8 4
Otter Lake 7
Rogue River 52 26
Saginaw River 18 43 31
St. Joseph River 25 28 79
St. Marys River 8
Tahquamenon River 0.9 2.6 3.3 1.6
Thunder Bay River 0.4 3.5 2.2
Van Etten Lake 14 10 33 18 Blank cells indicate no sample taken

25
Table 18. Maximum number of meals per month recommended by the MDHHS based solely on PFOS concentrations in fish fillets sampled in Michigan waters between 2010 and 2013. (Actual advisories may be based on other chemicals. Check the Eat Safe Fish Guides for the current recommendations).
Car
p
Sm
allm
outh
/ La
rgem
outh
B
ass
Roc
k B
ass
Blu
egill
/Pum
pkin
seed
Yel
low
Per
ch
Ste
elhe
ad
Wal
leye
Whi
te S
ucke
r
Au Sable River 0.5 4 4 2
Clark's Marsh DNE Flint River 2 0.5 1 Hoist Basin 16 Kalamazoo (New Richmond) 2 DNE 2 Lake Allegan 2 1 2 Lake Erie 4 Lake Huron 4 Lake St. Helen 16 Little Bay De Noc 12 Muskegon River 16 16 16 Otter Lake 16 Rogue River 2 4
Saginaw River 8 2 4 St. Joseph River 4 4 1 St. Marys River 16 Tahquamenon River 16 16 16 16 Thunder Bay River 16 16 16 Van Etten Lake 8 12 8
Blank cells indicate no data for the species in the water body DNE – Do Not Eat
26
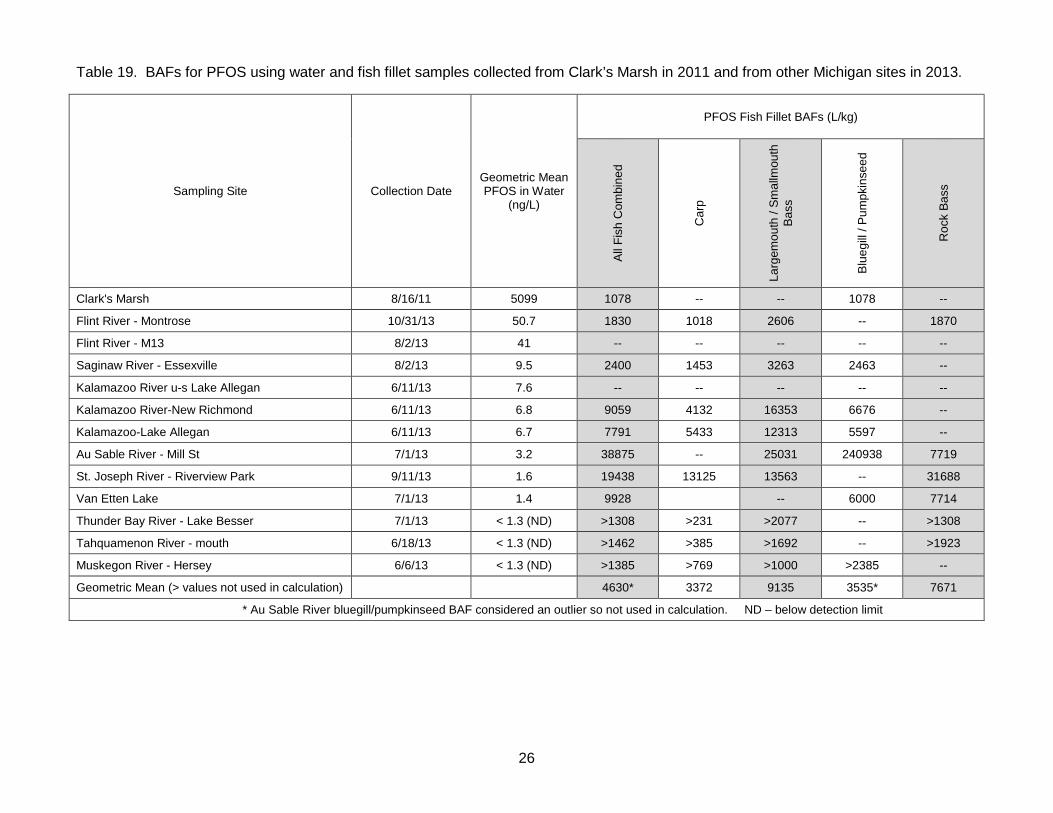
Table 19. BAFs for PFOS using water and fish fillet samples collected from Clark’s Marsh in 2011 and from other Michigan sites in 2013.
Sampling Site Collection Date Geometric Mean PFOS in Water
(ng/L)
PFOS Fish Fillet BAFs (L/kg)
All
Fis
h C
ombi
ned
Car
p
Larg
emou
th /
Sm
allm
outh
B
ass
Blu
egill
/ P
umpk
inse
ed
Roc
k B
ass
Clark's Marsh 8/16/11 5099 1078 -- -- 1078 --
Flint River - Montrose 10/31/13 50.7 1830 1018 2606 -- 1870
Flint River - M13 8/2/13 41 -- -- -- -- --
Saginaw River - Essexville 8/2/13 9.5 2400 1453 3263 2463 --
Kalamazoo River u-s Lake Allegan 6/11/13 7.6 -- -- -- -- --
Kalamazoo River-New Richmond 6/11/13 6.8 9059 4132 16353 6676 --
Kalamazoo-Lake Allegan 6/11/13 6.7 7791 5433 12313 5597 --
Au Sable River - Mill St 7/1/13 3.2 38875 -- 25031 240938 7719
St. Joseph River - Riverview Park 9/11/13 1.6 19438 13125 13563 -- 31688
Van Etten Lake 7/1/13 1.4 9928 -- 6000 7714
Thunder Bay River - Lake Besser 7/1/13 < 1.3 (ND) >1308 >231 >2077 -- >1308
Tahquamenon River - mouth 6/18/13 < 1.3 (ND) >1462 >385 >1692 -- >1923
Muskegon River - Hersey 6/6/13 < 1.3 (ND) >1385 >769 >1000 >2385 --
Geometric Mean (> values not used in calculation) 4630* 3372 9135 3535* 7671
* Au Sable River bluegill/pumpkinseed BAF considered an outlier so not used in calculation. ND – below detection limit

27
Table 20. BAFs for PFOS using water and fish fillet samples collected from the Oscoda area of Michigan from 2011 to 2013.
Sampling Site Water Sampling
Date(s)
Geometric Mean PFOS
in Water (ng/L)
PFOS Fish Fillet BAFs (L/kg)
Pum
pkin
seed
Larg
emou
th
Bas
s
Sm
allm
outh
B
ass
Roc
k B
ass
Upper Clark’s Marsh 8/16/11; 11/2/12 3179 1502 1442 -- --
Middle Clark’s Marsh 10/29/12; 11/2/12 1887 1883 -- -- --
Lower Clark’s Marsh 8/16/11; 10/29/12 99 4465 9141 -- --
Au Sable River 7/1/13 3.2 -- -- 7500 6563
Geometric Mean PFOS BAF (L/kg) 2329 3631 7500 6563
Table 21. BAFs for PFOS using water and whole fish samples collected from Clark’s Marsh (Michigan), Lake Calhoun (Minnesota), and a Mississippi River Pool (Minnesota).
Sampling Site Water Sampling
Date(s)
Geometric Mean
PFOS in Water (ng/L)
PFOS Whole Fish BAFs (L/kg) Y
ello
w P
erch
Gol
den
Shi
ner
Blu
egill
Sun
fish
Whi
te B
ass
Upper Clark’s Marsh 8/16/11; 11/2/12 3179 922; 865 1519 -- --
Middle Clark’s Marsh 10/29/12; 11/2/12 1887 938 -- -- --
Lake Calhoun 2006 110 -- -- 4113 --
Mississippi River Pool 2006 25.5 -- -- -- 5529
Geometric Mean PFOS BAF (L/kg) 908 1519 4113 5529

28
Figure 1. PFC water and fish tissue sample locations, 2010-2014.
29
Figure 2. Individual PFCs in water samples as a percentage of the sum of all PFCs measured.
0%
10%
20%
30%
40%
50%
60%
70%
80%
90%
100%
Perfluorotetradecanoic acid (PFTeA)
Perfluoropentanoic acid (PFPeA)
Perfluorooctanoic acid (PFOA)
Perfluorooctane sulfonamide (PFOSA)
Perfluorononanoic acid (PFNA)
Perfluoro-n-hexadecanoic acid (PFHxDA)
Perfluorohexanoic acid (PFHxA)
Perfluorohexane sulfonate (PFHxS)
Perfluoroheptanoic acid (PFHpA)
Perfluorodecanoic acid (PFDA)
Perfluorobutanoic acid (PFBA)
Perfluorobutane sulfonate (PFBS)
Perfluoro-1-heptanesulfonate (PFHpS)
Perfluorooctane sulfonate (PFOS)

30
Figure 3. A comparison of PFOS and PFOA concentrations in water samples collected at selected sites in 2001 and 2013. ND indicates concentrations are below the detection limit.
0
5
10
15
20
25
30
35
40
45
PFO
S (
ng
/L)
PFOS in Water
2001
2013
0
5
10
15
20
25
30
35
40
PFO
A (
ng
/L)
PFOA in Water
2001
2013
ND ND ND
ND
31
Figure 4. Individual PFCs in water and fish samples collected from the Au Sable River between 2011 and 2013, as a percentage of the 11 PFCs measured in both fish and water.
Figure 5. Individual PFCs in water and fish samples collected from the Clark’s Marsh in 2011, as a percentage of the 11 PFCs measured in both fish and water.
0%
10%
20%
30%
40%
50%
60%
70%
80%
90%
100%
Smallmouth Bass Rock Bass Pumpkinseed Water
Perfluoroundecanoic acid (PFUnA)
Perfluorotridecanoic acid (PFTriA)
Perfluorotetradecanoic acid (PFTeA)
Perfluorooctanoic acid (PFOA)
Perfluorooctane sulfonamide (PFOSA)
Perfluorononanoic acid (PFNA)
Perfluorohexane sulfonate (PFHxS)
Perfluorododecanoic acid (PFDoA)
Perfluorodecanoic acid (PFDA)
Perfluorodecane sulfonate (PFDS)
Perfluorooctane sulfonate (PFOS)
0%
10%
20%
30%
40%
50%
60%
70%
80%
90%
100%
Pumpkinseed Water
Perfluoroundecanoic acid (PFUnA)
Perfluorotridecanoic acid (PFTriA)
Perfluorotetradecanoic acid (PFTeA)
Perfluorooctanoic acid (PFOA)
Perfluorooctane sulfonamide (PFOSA)
Perfluorononanoic acid (PFNA)
Perfluorohexane sulfonate (PFHxS)
Perfluorododecanoic acid (PFDoA)
Perfluorodecanoic acid (PFDA)
Perfluorodecane sulfonate (PFDS)
Perfluorooctane sulfonate (PFOS)
32
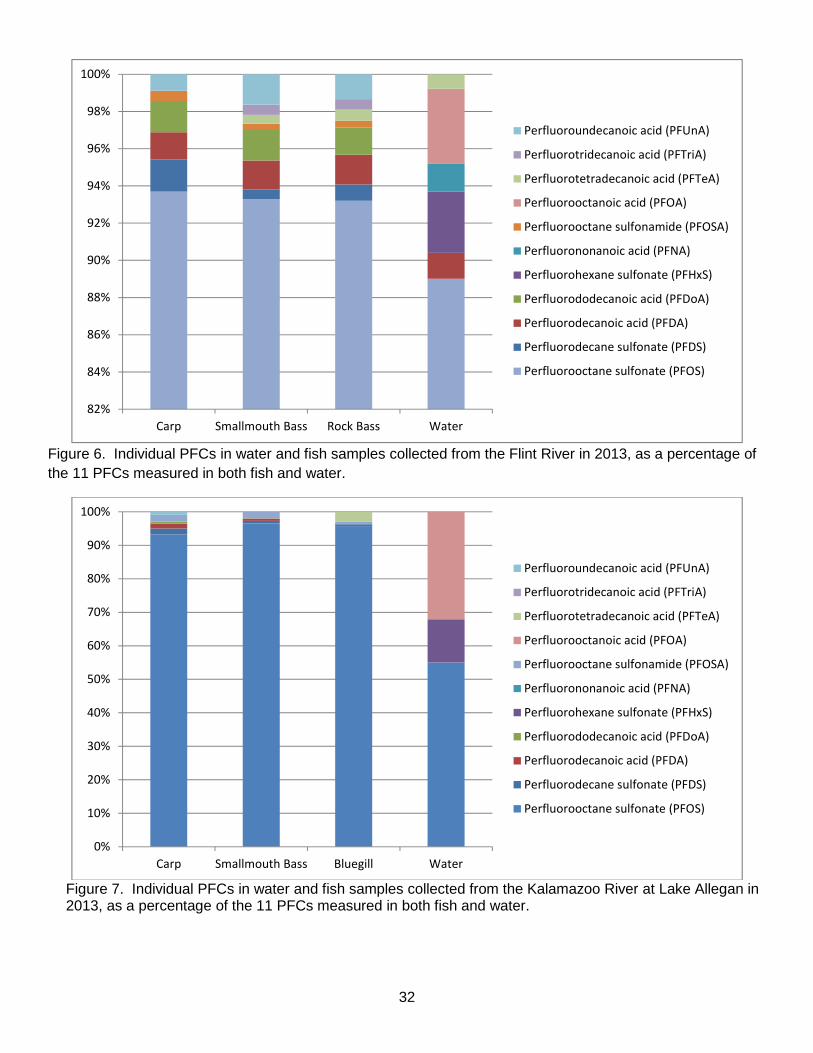
Figure 6. Individual PFCs in water and fish samples collected from the Flint River in 2013, as a percentage of the 11 PFCs measured in both fish and water.
Figure 7. Individual PFCs in water and fish samples collected from the Kalamazoo River at Lake Allegan in 2013, as a percentage of the 11 PFCs measured in both fish and water.
82%
84%
86%
88%
90%
92%
94%
96%
98%
100%
Carp Smallmouth Bass Rock Bass Water
Perfluoroundecanoic acid (PFUnA)
Perfluorotridecanoic acid (PFTriA)
Perfluorotetradecanoic acid (PFTeA)
Perfluorooctanoic acid (PFOA)
Perfluorooctane sulfonamide (PFOSA)
Perfluorononanoic acid (PFNA)
Perfluorohexane sulfonate (PFHxS)
Perfluorododecanoic acid (PFDoA)
Perfluorodecanoic acid (PFDA)
Perfluorodecane sulfonate (PFDS)
Perfluorooctane sulfonate (PFOS)
0%
10%
20%
30%
40%
50%
60%
70%
80%
90%
100%
Carp Smallmouth Bass Bluegill Water
Perfluoroundecanoic acid (PFUnA)
Perfluorotridecanoic acid (PFTriA)
Perfluorotetradecanoic acid (PFTeA)
Perfluorooctanoic acid (PFOA)
Perfluorooctane sulfonamide (PFOSA)
Perfluorononanoic acid (PFNA)
Perfluorohexane sulfonate (PFHxS)
Perfluorododecanoic acid (PFDoA)
Perfluorodecanoic acid (PFDA)
Perfluorodecane sulfonate (PFDS)
Perfluorooctane sulfonate (PFOS)
33
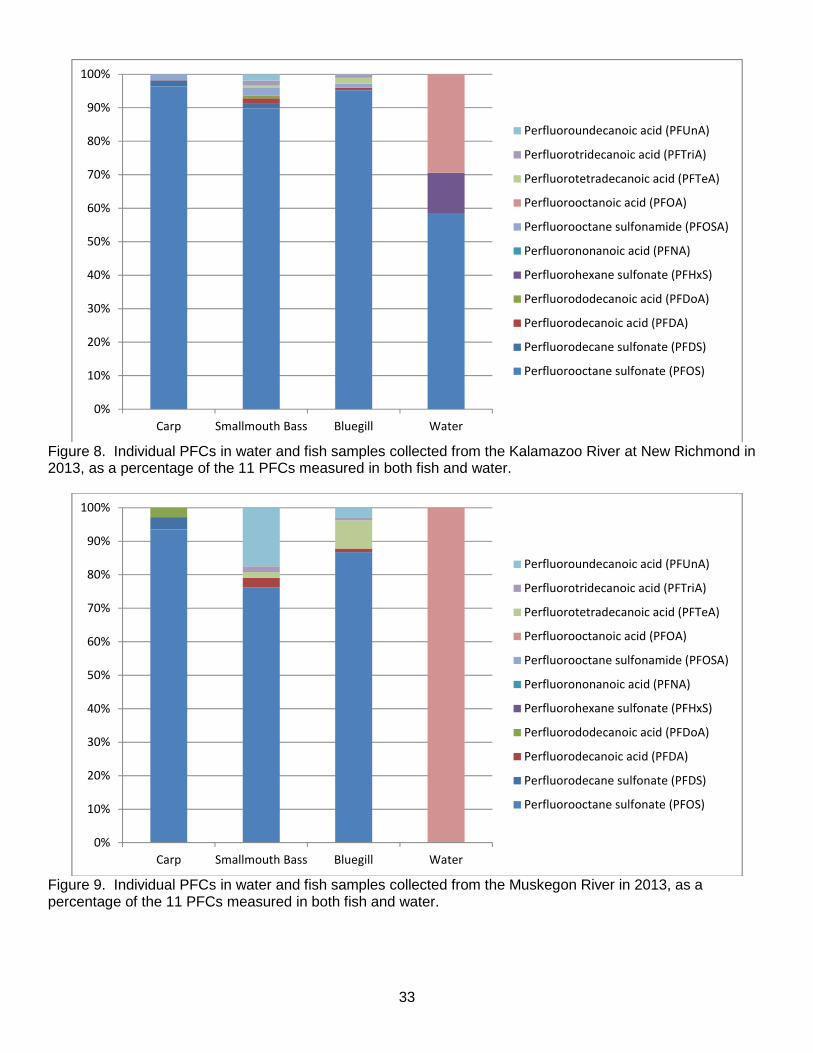
Figure 8. Individual PFCs in water and fish samples collected from the Kalamazoo River at New Richmond in 2013, as a percentage of the 11 PFCs measured in both fish and water.
Figure 9. Individual PFCs in water and fish samples collected from the Muskegon River in 2013, as a percentage of the 11 PFCs measured in both fish and water.
0%
10%
20%
30%
40%
50%
60%
70%
80%
90%
100%
Carp Smallmouth Bass Bluegill Water
Perfluoroundecanoic acid (PFUnA)
Perfluorotridecanoic acid (PFTriA)
Perfluorotetradecanoic acid (PFTeA)
Perfluorooctanoic acid (PFOA)
Perfluorooctane sulfonamide (PFOSA)
Perfluorononanoic acid (PFNA)
Perfluorohexane sulfonate (PFHxS)
Perfluorododecanoic acid (PFDoA)
Perfluorodecanoic acid (PFDA)
Perfluorodecane sulfonate (PFDS)
Perfluorooctane sulfonate (PFOS)

34
Figure 10. Individual PFCs in water and fish samples collected from the Saginaw River in 2013, as a percentage of the 11 PFCs measured in both fish and water.
Figure 11. Individual PFCs in water and fish samples collected from the St. Joseph River in 2013, as a percentage of the 11 PFCs measured in both fish and water.
0%
10%
20%
30%
40%
50%
60%
70%
80%
90%
100%
Carp Smallmouth Bass Pumpkinseed Water
Perfluoroundecanoic acid (PFUnA)
Perfluorotridecanoic acid (PFTriA)
Perfluorotetradecanoic acid (PFTeA)
Perfluorooctanoic acid (PFOA)
Perfluorooctane sulfonamide (PFOSA)
Perfluorononanoic acid (PFNA)
Perfluorohexane sulfonate (PFHxS)
Perfluorododecanoic acid (PFDoA)
Perfluorodecanoic acid (PFDA)
Perfluorodecane sulfonate (PFDS)
Perfluorooctane sulfonate (PFOS)
0%
10%
20%
30%
40%
50%
60%
70%
80%
90%
100%
Carp Smallmouth Bass Rock Bass Water
Perfluoroundecanoic acid (PFUnA)
Perfluorotridecanoic acid (PFTriA)
Perfluorotetradecanoic acid (PFTeA)
Perfluorooctanoic acid (PFOA)
Perfluorooctane sulfonamide (PFOSA)
Perfluorononanoic acid (PFNA)
Perfluorohexane sulfonate (PFHxS)
Perfluorododecanoic acid (PFDoA)
Perfluorodecanoic acid (PFDA)
Perfluorodecane sulfonate (PFDS)
Perfluorooctane sulfonate (PFOS)
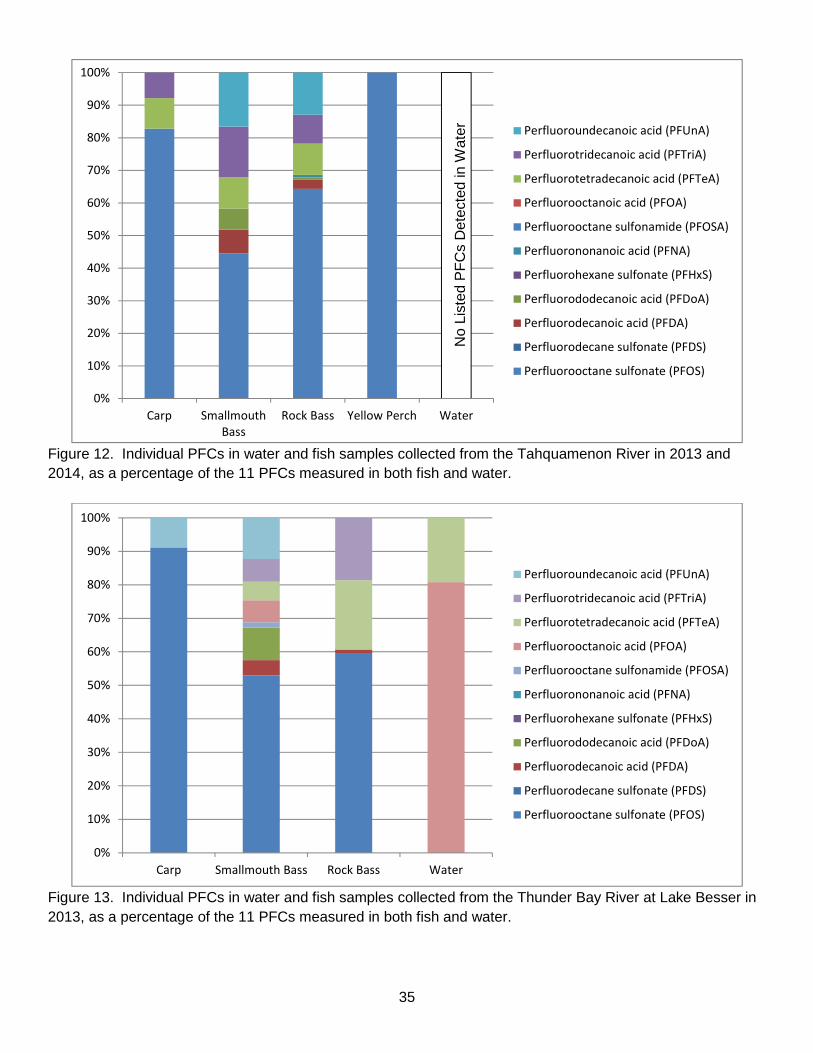
35
Figure 12. Individual PFCs in water and fish samples collected from the Tahquamenon River in 2013 and 2014, as a percentage of the 11 PFCs measured in both fish and water.
Figure 13. Individual PFCs in water and fish samples collected from the Thunder Bay River at Lake Besser in 2013, as a percentage of the 11 PFCs measured in both fish and water.
0%
10%
20%
30%
40%
50%
60%
70%
80%
90%
100%
Carp Smallmouth
Bass
Rock Bass Yellow Perch Water
Perfluoroundecanoic acid (PFUnA)
Perfluorotridecanoic acid (PFTriA)
Perfluorotetradecanoic acid (PFTeA)
Perfluorooctanoic acid (PFOA)
Perfluorooctane sulfonamide (PFOSA)
Perfluorononanoic acid (PFNA)
Perfluorohexane sulfonate (PFHxS)
Perfluorododecanoic acid (PFDoA)
Perfluorodecanoic acid (PFDA)
Perfluorodecane sulfonate (PFDS)
Perfluorooctane sulfonate (PFOS)
No
List
ed P
FC
s D
etec
ted
in W
ater
0%
10%
20%
30%
40%
50%
60%
70%
80%
90%
100%
Carp Smallmouth Bass Rock Bass Water
Perfluoroundecanoic acid (PFUnA)
Perfluorotridecanoic acid (PFTriA)
Perfluorotetradecanoic acid (PFTeA)
Perfluorooctanoic acid (PFOA)
Perfluorooctane sulfonamide (PFOSA)
Perfluorononanoic acid (PFNA)
Perfluorohexane sulfonate (PFHxS)
Perfluorododecanoic acid (PFDoA)
Perfluorodecanoic acid (PFDA)
Perfluorodecane sulfonate (PFDS)
Perfluorooctane sulfonate (PFOS)

36
Figure 14. Individual PFCs in water and fish samples collected from Van Etten Lake between 2010 and 2013, as a percentage of the 11 PFCs measured in both fish and water.
0%
10%
20%
30%
40%
50%
60%
70%
80%
90%
100%
Pumpkinseed Rock Bass Walleye White Sucker Water
Perfluoroundecanoic acid (PFUnA)
Perfluorotridecanoic acid (PFTriA)
Perfluorotetradecanoic acid (PFTeA)
Perfluorooctanoic acid (PFOA)
Perfluorooctane sulfonamide (PFOSA)
Perfluorononanoic acid (PFNA)
Perfluorohexane sulfonate (PFHxS)
Perfluorododecanoic acid (PFDoA)
Perfluorodecanoic acid (PFDA)
Perfluorodecane sulfonate (PFDS)
Perfluorooctane sulfonate (PFOS)
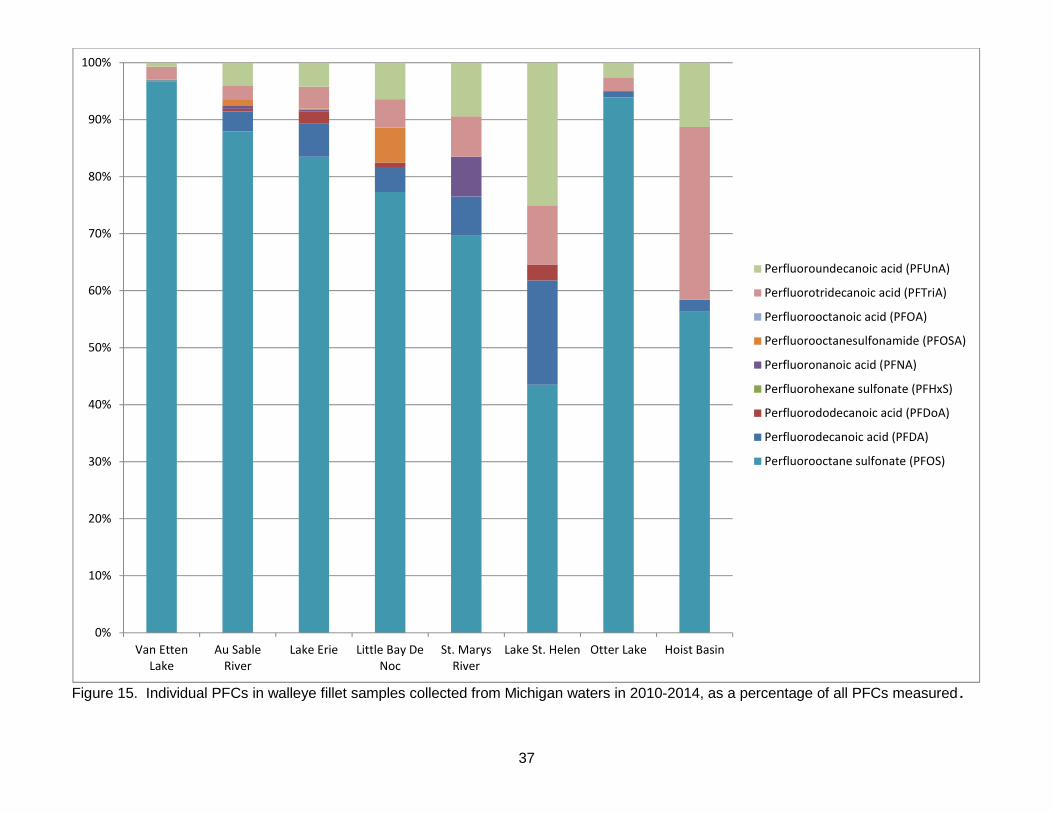
37
Figure 15. Individual PFCs in walleye fillet samples collected from Michigan waters in 2010-2014, as a percentage of all PFCs measured.
0%
10%
20%
30%
40%
50%
60%
70%
80%
90%
100%
Van Etten
Lake
Au Sable
River
Lake Erie Little Bay De
Noc
St. Marys
River
Lake St. Helen Otter Lake Hoist Basin
Perfluoroundecanoic acid (PFUnA)
Perfluorotridecanoic acid (PFTriA)
Perfluorooctanoic acid (PFOA)
Perfluorooctanesulfonamide (PFOSA)
Perfluoronanoic acid (PFNA)
Perfluorohexane sulfonate (PFHxS)
Perfluorododecanoic acid (PFDoA)
Perfluorodecanoic acid (PFDA)
Perfluorooctane sulfonate (PFOS)

38
Figure 16. Mean concentrations of total PFCs in fillets of fish from 9 sites sampled in 2013.
Carp
Smallmouth Bass
Rock Bass
Bluegill/Pumpkinseed
0
20
40
60
80
100
120
140
160M
ea
n T
ota
l P
FC
s (µ
g/k
g)
Total PFCs
in Fish
*
* - extreme value of one sample omitted

39
Figure 17. Mean concentrations of PFOS in fillets of fish from 9 sites sampled in 2013.
Carp
Smallmouth Bass
Rock Bass
Bluegill/Pumpkinseed
0
20
40
60
80
100
120
140
Me
an
PF
OS
Co
nce
ntr
ati
on
(µ
g/k
g)
PFOS
in Fish
*
* - extreme value of one sample omitted

40
Thunder
Bay R
iver
Tahquam
enon R
iver
St. Jo
seph
Rive
r
Saginaw R
iver
Muskeg
on Rive
r
Kalamazo
o Rive
r
Flint R
iver
Au Sable R
iver
250
200
150
100
50
0
Waterbody
PFO
S (
ug
/kg
)
PFOS in Smallmouth Bass
Figure 18. Boxplot of PFOS concentrations in fillets of smallmouth bass collected in 2013. (* denotes a value beyond 1.5 times the inter-quartile range).
Van E
tten
Lake
St. M
arys
Rive
r
Otter L
ake
Lake
St.
Helen
Lake
Erie
L. B
ay D
e Noc
Hoist B
asin (D
ead
River
)
Au Sa
ble
River/Osc
oda
50
40
30
20
10
0
Waterbody
PFO
S (
ug
/kg
)
PFOS in Walleye
Figure 19. Boxplot of PFOS concentrations in fillets of walleye collected at selected sites in Michigan waters. (* denotes a value beyond 1.5 times the inter-quartile range).

Appendix A

Appendix A cont.
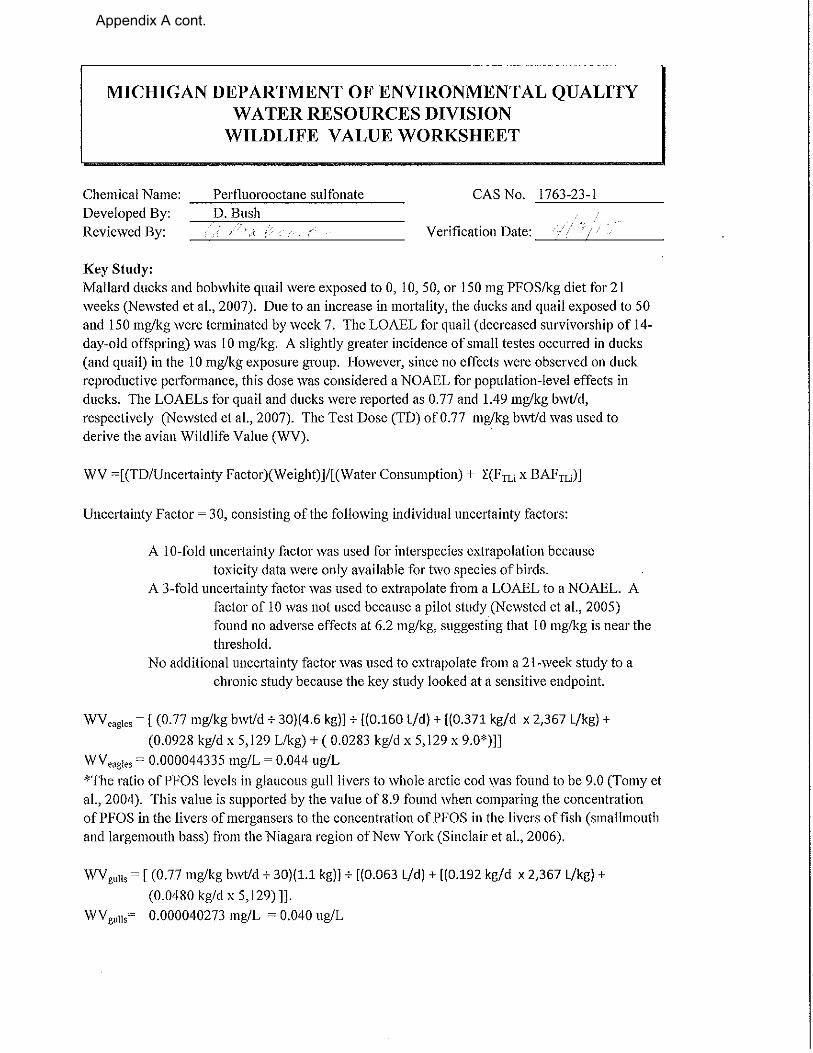
Appendix A cont.
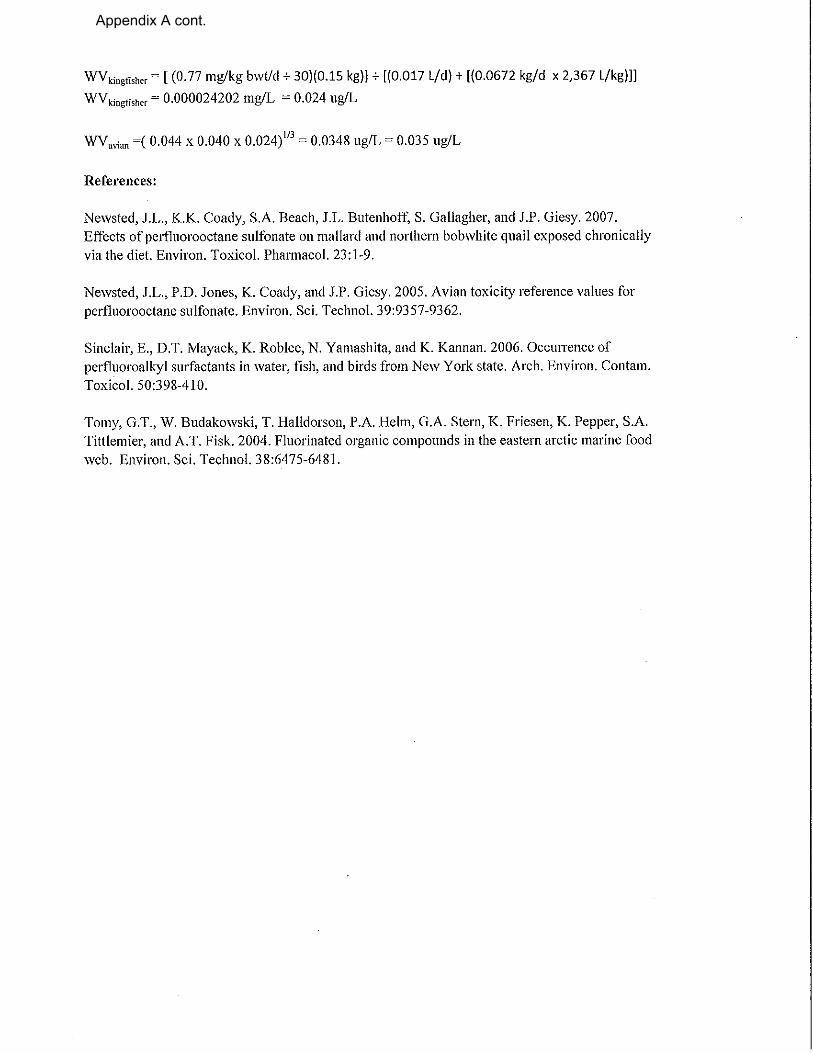
Appendix A cont.

Appendix A cont.

Attachment B. Michigan Department of Community Health, Technical Support Document for Assessment of Perfluorinated Chemicals and Selection of a Perfluorooctane Sulfonate (PFOS) Reference Dose as the basis for Michigan Fish Consumption Screening Values (FCSVs).
Attachment C. Perfluorooctane Sulfonate (PFOS) Fish Consumption Screening Value Worksheet
See page A-19 in the Michigan Fish Consumption Advisory Program Guidance Document.
Attachment D. Fish Consumption Guidelines for PFCs, Iosco County, Michigan
See Iosco County in the Northeast Michigan Eat Safe Fish Guide.