Analysis of poly- and perfluorinated compounds (PFCs) in - HZG
90
ISSN 0344-9629 GKSS 2009/11 Author: J. Busch Analysis of poly- and perfluorinated compounds (PFCs) in landfill effluent using HPLC-MS/MS (Von der Fakultät III Umwelt und Technik der Leuphana Universität Lüneburg als Diplomarbeit angenommen)
Transcript of Analysis of poly- and perfluorinated compounds (PFCs) in - HZG
ISSN
034
4-9
629
GKSS 2009/11
Author:
J. Busch
Analysis of poly- and perfluorinated compounds (PFCs) in landfill effluent using HPLC-MS/MS(Von der Fakultät III Umwelt und Technik der Leuphana Universität Lüneburgals Diplomarbeit angenommen)


Analysis of poly- and perfluorinated compounds (PFCs) in landfill effluent using HPLC-MS/MS
(Von der Fakultät III Umwelt und Technik der Leuphana Universität Lüneburg
als Diplomarbeit angenommen)
GKSS-Forschungszentrum Geesthacht GmbH • Geesthacht • 2009
Author:
J. Busch(Institute for Coastal Research)
GKSS 2009/11

Die Berichte der GKSS werden kostenlos abgegeben.The delivery of the GKSS reports is free of charge.
Anforderungen/Requests:
GKSS-Forschungszentrum Geesthacht GmbHBibliothek/LibraryPostfach 11 6021494 GeesthachtGermanyFax.: +49 4152 87-1717
Als Manuskript vervielfältigt.Für diesen Bericht behalten wir uns alle Rechte vor.
ISSN 0344-9629
GKSS-Forschungszentrum Geesthacht GmbH · Telefon (04152) 87-0Max-Planck-Straße 1 · 21502 Geesthacht / Postfach 11 60 · 21494 Geesthacht

GKSS 2009/11
Analysis of poly- and perfluorinated compounds (PFCs) in landfill effluent usingHPLC-MS/MS
(Von der Fakultät III Umwelt und Technik der Leuphana Universität Lüneburg als Diplomarbeit angenommen)
Jan Busch
85 pages with 12 figures and 25 tables
Abstract
Polyfluoroalkyl compounds (PFCs), such as perfluorooctane sulfonate (PFOS) or perfluorooctanoicacid (PFOA), are widely used in industry and consumer products. During the productionprocesses or use of the products, PFCs can be released into the environment, but little is knownabout their fate in municipal and industrial landfills. Used consumer products are deposited inlandfills. It is possible that landfills act as sources for PFCs in the environment. In this study severallandfill leachates are investigated at different sites in Northern Germany. This is the first studywhich shows the widespread occurrence of PFCs in treated and untreated leachates of 22 landfillsites. In total 38 PFCs are detected with a concentration range between a few ng/L to 8,060 ng/Lin treated leachate and 30.5 ng/L to 13,000 ng/L in untreated leachate. Dominating compoundsare the shorter-chained PFCs, Perfluorobutane sulfonate (PFBS) and Perfluorohexane sulfonate(PFHxS), which show higher concentrations than longer-chained PFCs like PFOS and PFOA, intreated as well as untreated leachate. Discharges of landfills are estimated to be between <1 g/yearand 350 g/year, depending on the treatment system. The large variability of the discharges indicatesthat some landfill sites could be a point source for PFCs. However, wastewater treatment plant(WWTP) discharges are approximately 50 times higher in comparison to landfill effluents. Never-theless age of the landfill body is a determining factor for concentrations in untreated leachate,whereas in treated leachate the treatment system is the dominating factor of the PFC contamination.Wet air oxidation and biological treatment seem to be not effective for removal of PFCs from theleachate (mean concentration = 3300 ng/L and 6000 ng/L ∑ PFCs), while reverse osmosis andactivated carbon have a significant effect on reduction of the PFC contamination in the effluent(mean = 42 ng/L and 723 ng/L ∑ PFCs).
Analyse von poly- und perfluorierten Verbindungen (PFCs) in Deponiesickerwassermittels HPLC-MS/M
Zusammenfassung
Polyfluoralkylverbindungen (PFCs) wie Perfluoroktansulfonansulfonat (PFOS) oder Perfluoroktan-säure (PFOA), werden in vielen Industrie- und Konsumprodukten eingesetzt. Während desProduktionsprozesses oder in der Nutzungsphase der Produkte können PFCs freigesetzt werden.

Genutzte Produkte werden in der Regel Verwertet oder auf Abfalldeponien entsorgt. Das Wissenüber PFCs in Abfalldeponien ist sehr begrenzt und möglicherweise sind Deponien eine Quellefür PFC Belastungen in der Umwelt. In der vorliegenden Arbeit wird untersucht, wie sich derPFC-Austrag von Deponien in Sickerwasser verhält. Hier wird Sickerwasser von 22 verschiedenenDeponien in Norddeutschland untersucht.
Insgesamt werden 38 PFCs in Konzentrationen zwischen wenigen ng/L und 8.060 ng/L inbehandeltem und 30,5 ng/L bis 13.000 ng/L in unbehandeltem Sickerwasser gefunden. KurzkettigePFCs wie Perfluorbutansulfonat (PFBS) und Perfluorhexansulfonat (PFHxS) können in höherenKonzentrationen gefunden werden als längerkettige Verbindungen wie PFOS und PFOA. Diegeschätzten Jahresfrachten von 0,03 g/Jahr bis maximal 350 g/Jahr zeigen, dass Deponien imVergleich zu Kläranlagen als Quelle nur eine untergeordnete Rolle spielen. Bei Frachten vonPFOS und PFOA können einzelne industrielle Kläranlagen signifikant mehr emittieren als alledeutschen Deponien gemeinsam.
In unbehandeltem Sickerwasser ist ein Zusammenhang zwischen Alter der Deponie und Kon-zentration in Sickerwasser fest zu stellen, während Emissionen in behandeltem Sickerwasserüberwiegend durch das Reinigungsverfahren bestimmt werden. Während nach Umkehrosmose-anlagen durchgehend sehr geringe Konzentrationen im Sickerwasser verbleiben (Mittelwert: 42 ng/L ∑ PFCs), haben Nassoxidation (3300 ng/L) und biologische Verfahren (6000 ng/L)nahezu keinen Einfluss auf die Konzentration. Aktivkohle (723 ng/L) kann PFCs effizient zurück-halten; dies scheint aber vom Grad der Beladung abhängig zu sein.
Manuscript received / Manuskripteingang in TFP: 29. September 2009

5
Index
List of abbreviations................................................................................................................8
List of figures..........................................................................................................................12
List of tables............................................................................................................................13
1�Introduction.........................................................................................................................15
2 Basic information on PFCs.................................................................................................17
2.1 Analysed compounds ................................................................................................. 17
2.2 Chemical properties .................................................................................................... 18
2.3 Production and legislation ......................................................................................... 20
2.4 Usage............................................................................................................................. 21
2.5 Environmental sources ............................................................................................... 21
2.6 Environmental occurrence ......................................................................................... 22
2.7 Toxicology and ecotoxicology ................................................................................... 24
3 Basic information on landfills............................................................................................27
3.1 Aim and regulation of landfills ................................................................................. 27
3.2 Design of landfills ....................................................................................................... 27
3.3 Emissions from landfills ............................................................................................. 30
3.3.1 Gaseous emissions................................................................................................30
3.3.2 Leachate..................................................................................................................30
3.4 Treatment of leachate.................................................................................................. 31
3.4.1 Mechanical pre-treatment....................................................................................31
3.4.2 Biological treatment..............................................................................................31
3.4.3 Chemical treatment – wet air oxidation.............................................................32
3.4.4 Membrane treatment............................................................................................32
3.4.5 Adsorption.............................................................................................................33
3.5 Knowledge about PFCs in landfills .......................................................................... 33
4 Materials and Methods.......................................................................................................35
4.1 Chemicals ..................................................................................................................... 35
4.2 Sample collection and sampling sites....................................................................... 35

6
4.3 Sample preparation..................................................................................................... 37
4.4 Instrumental analysis.................................................................................................. 38
4.5 Quantification .............................................................................................................. 39
4.6 Quality control ............................................................................................................. 40
5 Results...................................................................................................................................43
5.1 PFCs in untreated leachates....................................................................................... 43
5.2 PFCs in treated leachates............................................................................................ 44
5.3 PFC concentration after different treatment steps.................................................. 47
5.4 Changes of concentrations in short times ................................................................ 48
6 Discussion............................................................................................................................ 49
6.1 Patterns of PFCs........................................................................................................... 49
6.1.1 Patterns in treated and untreated leachate........................................................49
6.1.2 Patterns in leachates after different treatment systems...................................49
6.1.3 Comparison of treated and untreated leachate from four landfills...............50
6.1.4 Concentrations compared to surface water and effluents of WWTPs..........51
6.2 Short time temporal variations.................................................................................. 52
6.3 Influence of the age of leachate to concentrations.................................................. 53
6.4 The influence of the cleaning treatment on the concentrations in leachate........ 56
6.5 Cleaning efficiency...................................................................................................... 58
6.6 Cleaning behavior of two three-step activated carbon cleaning treatments ...... 59
6.7 Correlations of adsorption from PFCAs and PFSAs depending on the chain
length and functional group ............................................................................................ 60
6.8 Toxic effects of concentrations from landfills.......................................................... 62
6.9 Concentrations compared to surface water and effluents of WWTPs................. 63
6.10 Mass flows .................................................................................................................. 65
6.11 Comparison to other data ........................................................................................ 67
6.11.1 Comparison to data from other landfills.........................................................67
6.11.2 Comparison to data on the same sites.............................................................67
6.11.3 Comparison to data on untreated leachate.....................................................68

7
7 Conclusions and Outlook...................................................................................................69
Literature.................................................................................................................................71
Appendixes.............................................................................................................................79

8
List of abbreviations
10:2 FTUCA 10:2 fluorotelomer carboxylic acid
13C-PFBA Perfluoro-n-[1,2,3,4-13C4]butanoic acid
13C-PFDA Perfluoro-n-[1,2-13C2]decanoic acid
13C-PFDoA Perfluoro-n-[1,2-13C2]dodecanoic acid
13C-PFHxA Perfluoro-n-[1,2-13C2]hexanoic acid
13C-PFNA Perfluoro-n-[1,2,3,4,5-13C5]nonanoic acid
13C-PFOA Perfluoro-n-[1,2,3,4-13C4]octanoic acid
13C-PFOS Perfluoro-1-[1,2,3,4-13C4]octanesulfonate
13C-PFOSi Perfluoro-1-[1,2,3,4-13C4]perfluorooctanesulfinate
18O2-PFHxS Perfluoro-1-hexane[18O2]sulfonate
13C-PFUDA Perfluoro-n-[1,2-13C2]undecanoic acid
6:2 FTCA 2-perfluorohexylethanoic acid
6:2 FTUCA 2H-perfluoro-2-octenoic acid
6:2 FTS 6:2 fluorotemomer sulfonate
8:2 FTCA 2-perfluorohexylethanoic acid
8:2 FTUCA 2H-perfluoro-2-decenoic acid
AbfAblV Abfallablagerungsverordnung
AbwV Abwasserverordnung
BAF Bioaccumulation factor
BCF Bioconcentration factor
BOD5 Biological oxygen demand
COD Chemical oxygen demand
D3-MeFOSA N-methyl-d3-perfluoro-1-octanesulfonamide
D5-EtFOSA N-ethyl-d5-perfluoro-1-octanesulfonamide
D7-MeFOSE 2-(n-deuteriomethylperfluoro-1-octanesulfonamido)-1,1,2,2-
tetradeuterioethanol
D9-EtFOSE 2-(n-deuterioethylperfluoro-1-octanesulfonamido)-1,1,2,2-
tetradeuterioethanol

9
DepV Deponieverordnung
ECF Electrochemical fluorination
FASAs Perfluoroalkyl sulfonamides
FASEs Perfluoroalkyl sulfonamidoethanols
FTCAs Fluorotelomercarboxylic acids
FTOHs Fluorotelomer alcohols
FTUCAs Unsaturated fluorotelomer carboxylic acids
GFF Glass fiber filter
HPLC High performance liquid chromatography
HPLC-MS/MS High performance liquid chromatography double coupled mass
spectrometry
KrW/AbfG Kreislaufwirtschafts-/Abfallgesetz
LC50 Lethal concentration, 50 %
LD50 Lethal dose, 50 %
LOEC Lowest observed effect concentration
LOEL Lowest observed effect level
Me2PFOA Perfluoro-3,7-bis(trifluoromethyl)-octanoic acid
MeFBSA N-methylperfluorobutane sulfonamide
MeFBSE N-methylperfluorobutane-sulfonamidoethanol
MRM Multi response monitoring
NEtFOSA N-methylperfluorooctane sulfonamide
NEtFOSE N-methylperfluorooctane-sulfonamidoethanol
NMeFOSA N-methylperfluorooctane-sulfonamide
NMeFOSE N-methylperfluorooctane-sulfonamidoethanol
NOAL No observed adverse effect level
NOEC No observed effect concentration
NOEL No observed effect level
PBT persistent, bioaccumulative, toxic
PFAS Perfluoroalkylated substances

10
PFBA Perfluorobutanoic acid
PFBS Perfluorobutanoic sulfonate
PFCs Poly- and perfluorinated alkyl compounds
PFCA Perfluorocarboxylic acids
PFDA Perfluorodecanoic acid
PFDoDA Perfluorododecanoic acid
PFDPA perfluorodecylphosphonic acid
PFDS Perfluorodecane sulfonate
PFDSi Perfluorodecane sulfinate
PFHpA Perfluoroheptanoic acid
PFHpDA Perfluoroheptadecanoic acid
PFHpS Perfluoroheptane sulfonate
PFHxA Perfluorohexanoic acid
PFHxDA Perfluorohexadecanoic acid
PFHxPA Perfluorohexaphosphonic acid
PFHxS Perfluorohexane sulfonate
PFHxSi Perfluorohexane sulfinate
PFNA Perfluorononane acid
PFNS Perfluorononane sulfonate
PFOA Perfluorooctanoic acid
PFOcDA Perfluorooctadecanoic acid
PFOPA Perfluorooctylphosphoric acid
PFOS Perfluorooctanoic sulfonate
PFOSA Perfluorooctane sulfonamide
PFOSi Perfluorooctane sulfinate
PFPA Perfluoropentanoic acid
PFPeDA Perfluoropentadecanoic acid
PFPS Perfluoropentane sulfonate
PFSAs Perfluoroalkyl sulfonates
11
PFSiAs Perfluoroalkyl sulfinates
PFTeDA Perfluorotetradecanoic acid
PFTriDA Perfluorotridecanoic acid
PFUnDA Perfluoroundecanoic acid
POP persistent organic pollutant
POSF Perfluorooctanesulfonyl fluoride
PTFE Polytetrafluorethylen
SPE Solid phase extraction
TA Abfall Technische Anleitung Abfall
TASi Technische Anleitung Siedlungsabfall
Ww wet weight
WWTP Wastewater treatment plant

12
List of figures
Graph 1: Standard assembly for base sealing from 'class II' landfills. (Own
illustration based on [72])..................................................................................................... 29
Graph 2: Standard assembly for surface sealing of 'class II' landfills. (Own
illustration based on [72])..................................................................................................... 29
Graph 3: Geographical position of the tested landfill sites (Graph designed with [89]). 37
Graph 4: PFC-Concentrations in untreated leachate........................................................ 43
Graph 5: Mass fractions of individual PFCs in untreated leachate................................ 44
Graph 6: PFC-Concentration in treated leachate of all tested sites. ............................... 45
Graph 7: Mass fraction of compounds in treated leachate of all tested sites................ 46
Graph 8: Mass flows of PFCs in treated leachate of all tested sites. Results are
� PFCs in g/year. ................................................................................................................... 46
Graph 9: Correlation between the year of closing of landfills and � PFC
concentrations in ng/L found in untreated leachate. ....................................................... 54
Graph 10: Correlation between the year of closing of landfills and � PFC
concentrations in ng/L found in treated leachate. ............................................................ 55
Graph 11: Concentrations of PFCs in leachate of all sites, sorted to treatment and
status. (Abbreviations: bio = biological treatment, osmosis = reverse osmosis,
WAO = Wet air oxidation) ................................................................................................... 56
Graph 12: Correlation between chain length of the carbon chain in PFCAs and the
leftover between effluent from activated carbon treatment container I and activated
carbon treatment container III……………………………………………………………..61

13
List of tables
Table 1: Structures of the analyzed compounds............................................................... 18
Table 2: Different treatment systems and their adequacy for different pollutants
(Reduced from [78]). Abbreviations: + = applicable, - = inapplicable, o = applicable on
limited extend ........................................................................................................................ 31
Table 3: Averages, median and standard deviations for PFCs in landfill leachate in
ng/L, based on literature data ([56, 86–88]). NQ = not quantifiable............................... 34
Table 4: Overview on tested landfills with estimated annual amount of leachate in
m³/year, treatment process, status, landfill class, and sample........................................ 36
Table 5: Recovery rates and standard deviation of Internal Standards in leachate
samples in percent................................................................................................................. 41
Table 6: Mass detection limits (MDL) and mass quantification limits (MQL) in ng/L
for all compounds in leachate. n.d.= not detected ............. ..............................................42
Table 7: Contribution of individual PFCs in untreated leachate in percent of � PFC.
Only compounds with mass fraction of >1 % are shown. ............................................... 44
Table 8: Mass fractions of PFCs in treated leachate in percent for all compounds with
>1 % mass fraction. ................................................................................................................ 45
Table 9: Monitoring the different treatment steps on landfill 9 over a period of three
months with sampling rates of 2–4 weeks. Results are given in � PFCs.
Concentrations in empty fields were measured, but are not taken into consideration
due to low recovery rates. .................................................................................................... 47
Table 10: Concentrations of indicidual PFCs in leachate from site 18 after each
container of activated carbon (AC) treatment. All concentrations are in ng/L. ........... 48
Table 11: � PFCs Samples of samples were taken three or four times with a sampling
rate of 2–4 weeks from six landfills. All concentrations are given in ng/L. .................. 48
Table 12: Comparison of the patterns of PFCs in treated and in untreated leachate.
Shown is every compound with an average mass fraction of more than 1 %.............. 49
Table 13: Comparison of the patterns of PFCs after different treatment processes.
Shown are percentages of selected compounds. .............................................................. 50

14
Table 14: Comparison of patterns of selected compounds before and after the
treatment process in percentage.......................................................................................... 51
Table 15: Concentrations of � PFCs in different aqueous environmental matrices in
ng/L.......................................................................................................................................... 52
Table 16: Comparison of PFC concentrations in three and four time sampled sites.
Shown are mean values in ng/L, deviation and a factor for the difference between the
highest and the lowest observed concentration................................................................ 53
Table 17: Comparison of � PFC concentrations and median concentrations in ng/L
and the mean annual mass flow in g/year in active and inactive landfill effluent...... 56
Table 18: Mean concentrations, median concentrations and the highest concentration
of sum � PFCs in ng/L after different cleaning treatment systems. .............................. 57
Table 19: Comparison of concentrations in treated and corresponding untreated
leachate from four landfill sites in ng/L, including a calculation of concentration
changes as remaining percentage after treatment and corresponding treatment. ...... 59
Table 20: Sum concentrations of PFCs in ng/L after every treatment step of two
activated carbon treatment steps with three carbon containers. For site 9 mean values
of four samples are shown. .................................................................................................. 59
Table 21: Concentrations in leachate after each of three activated carbon treatment
containers on site 18 for selected compounds in ng/L. .................................................... 60
Table 22: Comparison of remaining percentages of concentrations of selected
compounds after the treatment system in comparison to the concentrations before the
treatment system. All values are given in percent. .......................................................... 62
Table 23: Concentrations of � PFCs in different aqueous environmental matrices in
ng/L.......................................................................................................................................... 65
Table 24: Mass flows of � PFCs per year from selected point sources and rivers. If no
other unit is given, all values are in g/year........................................................................ 67
Table 25: Concentrations of PFCs in treated landfill effluent of three landfills (i.e., 19,
21 and 22) compared to corresponding data from the federal state of North-Rhine
Westphalia (LANUV) [99] on the same sites. All concentrations are in ng/L. ............. 68

15
1 Introduction
The group ‘emerging contaminants’ consists of pollutants which are subject to
growing scientific interest within the last two decades (e.g. persistent organic
pollutants or pharmaceuticals). The occurrence and fate of emerging contaminants in
the environment is under investigation and leads frequently to results which show a
widespread distribution of these compounds and potential ecotoxicological effects.
One group of these substances are poly- and perfluoroalkyl compounds (PFCs)
which are under examination in this thesis. PFCs, such as perfluorooctane sulfonate
(PFOS) or perfluorooctanoic acid (PFOA), are widely used in industry and consumer
products, due to their unique chemical properties for instance as surfactants and
coatings [1]. During the production processes and use of the products, PFCs can be
released into the environment. PFCs can be found ubiquitous in the environment, in
industrial as well as in remote locations without direct anthropogenic influence [2].
PFCs are persistent, soluble and can be transported in water. Volatile precursor
compounds can be degraded to PFCs and can be transported via atmospheric
transport to remote places [3]. Subsequently PFOS belongs to the group of PBTs
(persistent, bioaccumulative and toxic) [4]. They fulfill the criteria of POPs (persistent
organic pollutants) [5]. Even though PFOS and derivates are banned by the European
Union [6], environmental concentrations do not decrease of all PFCs. Perfluorobutan
sulfonate (PFBS) concentrations were observed to be rising [7], since they act as
substitute for other PFCs.
This study focuses on landfills which are possibly a source of PFCs [8]. Production
waste as well as consumer products used end up in landfills, where they are subject
to different chemical reactions and degradation processes. It is possible that PFCs can
be set free and attain in leachates, which rinse out of landfills for a long period of
time.
To investigate on PFCs in landfills samples of leachate from 22 landfill sites in
Germany were taken. Samples of 20 treated leachates and samples of untreated
leachate from 6 sites were examined. Additionally, on six sites samples were taken

16
three or four times in a period of three to four months. On two sites leachates could
be taken within three carbon containers of an activated carbon treatment.
At first patterns of PFCs in leachate are investigated in order to determine which
compounds are compounds of concern. Afterwards influences of time are
investigated in treated and untreated leachate. The impact of age on the leachate is
examined, and then short term changes in concentrations in treated leachates are
investigated. Further, the effectiveness of treatment systems is discussed. Five types
of treatment systems are compared with regard out flowing concentrations. Treated
and untreated leachate of four sites is compared and treatment steps of two sites are
examined. Adsorption behavior of PFCs on activated carbon is analysed. Since the
chain length plays a major role in accumulation in biota and sediments, behavior in
other matrices, it might be the same in activated carbon treatment. Afterwards
concentrations will be compared to other aqueous environmental media and mass
flows for landfills will be estimated as well. It is investigated if concentrations of
PFCs in treated leachates can lead to ecotoxicological effects. A comparison to
concentrations in other aqueous media will show if landfills are a source of PFCs into
the environment. At last, a comparison with published literature data from Scandinavia
and USA, as well as unpublished data from Germany is drawn.

17
2 Basic information on PFCs
2.1 Analysed compounds
The PFCs that are surveyed in this study are a wide group of different substances
which are all based on a fluorinated alkyl carbon chain with different functional groups
and different environmental behavior. The analysed compounds are perfluoroalkyl
carboxylic acids (PFCAs), perfluoroalkyl sulfonates (PFSAs), perfluoroalkyl sulfinates
(PFSiAs), perfluoroalkyl phosphonic acids (PFPAs), perfluoroalkyl sulfonamides
(FASAs), perfluoroalkyl sulfonamidoethanols (FASEs), fluorotelomer carboxylic acids
(FTCAs), fluorotelomer unsaturated carboxylic acids (FTUCAs) and 6:2 fluorotelomer
sulfonate (6:2 FTS). All substances except the FTCAs, FTUCAs and 6:2 FTS consist of a
fully fluorinated carbon chain with the corresponding functional group. The structures
of the compounds are shown in table 1. A complete list of analytes, acronym, formula
and corresponding internal standards is given in appendix 1.

18
Table 1: Structures of the analyzed compounds.
Structure Compound
C C C
O
OHF
F
F
F
F
n
Perfluoroalkyl carboxylic acids (PFCAs) n = 1-12, 14, 16 (additional Me2-PFOA)
C C S O-
O
O
F
F
F
F
F
n
Perfluorinated sulfonates (PFSAs) n = 3-9 (additional 6:2 FTS)
C C S
O-
O
F
FF
F
Fn
Perfluoroalkyl sulfinates (PFSiA) n = 5, 7, 9
Perfluoroalkyl phosphonic acids (PFPAs) n =6, 8, 10
C C SF
F
F
F
F
NH
R
O
On
Perfluoroalkyl sulphonamides (FASAs) n = 3, R = CH3 n = 7, R = H, CH3, C2C5
nC C S N
RO
O
F
F
F
F
F
CH2CH2
OH Perfluoroalkyl suphonamidoethanols (FASEs) n = 3, R = CH3 n = 7, R = CH3, C2H5
C CH2CF
F
F
F
F
CO
OH
n
Fluorotelomer carboxylic acids (FTCA) n = 5, 7, 9
C C C
CH C
F
F
F
F
F
F
OH
On
Fluorotelomer unsaturated carboxylic acids (FTUCA) n = 4, 6, 8
2.2 Chemical properties
PFCs are chemicals with anthropogenic origin. Substances with more than one fluor
atom, except trifluoroacetic acid, cannot be produced by natural sources [9]. The
fluor-carbon bond is the most important characteristic to explain the chemical
properties of PFCs. Fluor possesses the highest electronegativity with 4.0 of all
C C PF
F
F
F
F
OH
OH
On

19
atoms, which leads to a strong covalent bond with carbons. The energy of this bond
is 460 KJ/mol or 110 kcal/mol, which is one of the strongest covalent bonds known [1]
and leads to the persistence in the environment. Except volatile precursor compounds,
like FTOHs, which can be degraded to PFCAs [10], PFCs are persistent in the
environment and resist to hydrolysis, photolysis, biodegradation, and metabolism [1].
They are resistant to thermal degradation [11]. Fluorotelomer-based polymer products
can be destroyed by incineration at temperatures higher than 1000 °C. [12].
Most of the objected PFCs, except the FASAs and FASEs, dissociate in water to an
anion with a hydrophilic head and a hydrophobic and lipophphilic carbon chain
with a high ionization potential, which leads to marginal intermolecular actions and
a repellence of oil and water [1].
The potassium salt of PFOS is a white powder with a boiling point higher than
400 °C and a density of approximately 0.6 g/cm³. The other salts of PFOS, lithium-,
ammonium- and diethanolamidesalt have densities of approximately 1.1 g/cm³. The
pKa value is -3.27 [13]. The vapour pressure is stated to be between 1.9x10⁻⁹ and
3.3x10⁻⁹ PA and the water solubility is in average 600 mg/L. The shorter chained PFBS
has higher water solubility of 51 g/L [13]. An indirectly estimated n-octanol-water
coefficient by 3M lies at -1.08 log Kow, an other measurement states a value 4.13 log
Kow for the potassium salt of PFOS and 6.28 log Kow for the acid. The Henry’s Law
constant is less than 2.0x10⁻⁵ and therefore PFOS is not volatile. The melting point of
PFOA is determined to be at 45–50 °C, the pKa value is 2.5, and the vapour pressure
is 13.3 PA. The water solubility is 3.4 g/L [4, 14].
FTOHs are volatile precursor compounds for PFCs, which have a higher vapor
pressure than the investigated PFCs [15]. The atmospheric half-life is 20 to 164 days
[11, 16–18]. These compounds are transportable to remote places via atmosphere.
Neutral precursor compounds were observed to biodegrade in biota [18], sludge [19,
20], and in the atmosphere [21, 22].

20
2.3 Production and legislation
The industrial production of perfluorochemicals started in 1947 by the 3M Company
(Minnesota Mining and Manufacturing Company, St. Paul, Minnesota, USA) [23].
There are two major ways in producing perfluorochemicals: The electrochemical
fluorination (ECF) and the telomerisation.
The ECF was invented by Simons in the 1940’s. An organic compound is dissolved or
dispended in anhydrous hydrogen fluoride. An electric current, usually between five
and seven Volt (V) is set between two nickel-electrodes. The hydrogen from the
carbon chain gets replaced by the fluorine, while the functional group of the educts
remains. This reaction leads to 30 % impurities due to fragmentation of the alkyl
chain and appearance of non-linear isomers [1, 24, 25].
The other possible production process is the telomerisation, which was invented in
1949 by Haszeldine and adapted by the Du Pont Company. Here tetrafluorethene
reacts with iodpentafluoroethane to perfluorooctyl iodide and ethylene. The iodide
group can be changed to a functional group of choice in another production step.
This reaction yields important precursors like FTOHs, that have linear chains, but are
not fully fluorinated. This process leads to a higher purity of the compound but is
more expensive than the ECF [1, 25].
The total production of perfluorooctane sulfonyl fluoride (POSF), which is the
industrial feedstock for the production of PFCs, is estimated to be 96,000 t for
industrial processes and 122,500 t including unusable production waste. The annual
production of POSF is estimated to have grown to 4650 t/year in the year 2000
whereof 3665 t were produced by 3M [8]. The production of PFOS and PFOA in the
USA was voluntarily phased-out by 3M in 2000 and 2002, respectively, [26] in order
to avoid legal activities by the United States Environmental Protection Agency (USEPA)
that classified PFOS as a PBT-chemical [5, 25]. After this agreement the annual
production of PFCs decreased to 74–175 t in 2005 [27].

21
In the European Union the production of PFOS was decided to be stopped by the end
of 2007 [6]. Therefore the production of other PFCs will increase, due to the lack of
unfluorinated chemicals that can replace PFCs [28]. This compound will especially be
PFBS, which might be less harmful to the environment [29]. In May 2009 PFOS was
voted to be a POP under annex B of the Stockholm Convention [30]. The Stockholm
Convention is an internationally binding agreement based on the United Nations
Environmental Programme (UNEP) that forces the member states of the agreement
to take legal action on the application and production of these compounds.
2.4 Usage
PFCs offer special chemical properties, which cannot be offered by other chemicals;
for this reason PFCs are ingredients in a variety of applications. Due to their property
to repel oil and water they are used for coatings of carpets, clothes, paper and
packaging, as performance chemical in hydraulic fluids and aqueous fire fighting
foams, polishes and shampoos [8]. Polytetrafluorthylene (PFTE)-based membranes
are used widely because of their ability to ‘breathe’; to let steam out, but no water in
[31]. The allocation of PFCs from American production to the different usages is
estimated to be 41 % as coatings on paper and packaging, 37 % for impregnation in
fabric, leather and carpet goods, 10 % as ingredient in industrial surfactants, additives
and coatings and 3 % was used in aqueous fire fighting foams [32].
2.5 Environmental sources
Masses up to 7,300 t have been estimated to be discharged to the environment by
direct and indirect sources. Direct sources are the production sites, fluorotelomer
manufacturing and processing, fluortelomer dispersions, aqueous fire fighting foams
and consumer and industrial products. Indirect sources are POSF-based products,
fluorotelomer-based products, which can degrade to PFCAs [23]. The production
took place only in a few large sites, but the use of the products was widespread,
therefore the potential for dispersal is given. It is assumed that a POSF adjusted

22
treatment of production waste was not given; therefore the disposal is probably in
normal waste streams into WWTPs [8]. Industrial point sources are described to be
metal working industry, especially galvanizing industry, and paper working
industry with high concentrations in WWTPs [33]. Indirect sources are assumed to
show other patterns of emission. The releases are depending on the lifespan, use and
disposal of the products. While secondary sources like carpets have a long lifespan in
apartments, others, like paper and packaging, have a short lifespan and are carried
out to waste disposal [8]. The disposal of treated products may lead to new point
sources in form of landfill sites [25, 32, 34], even though used precursor substances
might have to be degraded in situ before they attain in leachate [35].
2.6 Environmental occurrence
Not only in industrialized areas, even at remote places, PFCs can be found in wildlife
[2], and water [36]. Tissue samples from animals [2], and water samples from Oceans
[37] in remote areas are less polluted than in highly industrialized zones. This
indicates a specific global distribution of PFCs. The scientific discussion examines
ways of transport in remote areas: The first theory says that volatile precursors like
FTOHs are supposed to be the main source for long chained PFAS in the arctic. The
second transport way is aquatic transport via currents. The third and fourth
possibility is the transport bound to particulate matter on are marine aerosols, like
sea spray, respectively [23]. Since most PFCs are not biodegradable or get degraded
to a stable PFC, the final sinks of PFC are assumed to be deep ocean water and
sediment burial [23].
Temporal trends in animal tissue show rising concentrations in general [38, 39], but
changing patterns: After 2002 the concentration of PFOS in harbour seals (phoca
vitulina) from the German Bight has declined, which might be result of the ban of
PFOS, but perfluorodecane sulfonate (PFDS) is still rising [40]. Studies from other
authors show similar results in other animal tissues [41–43].
23
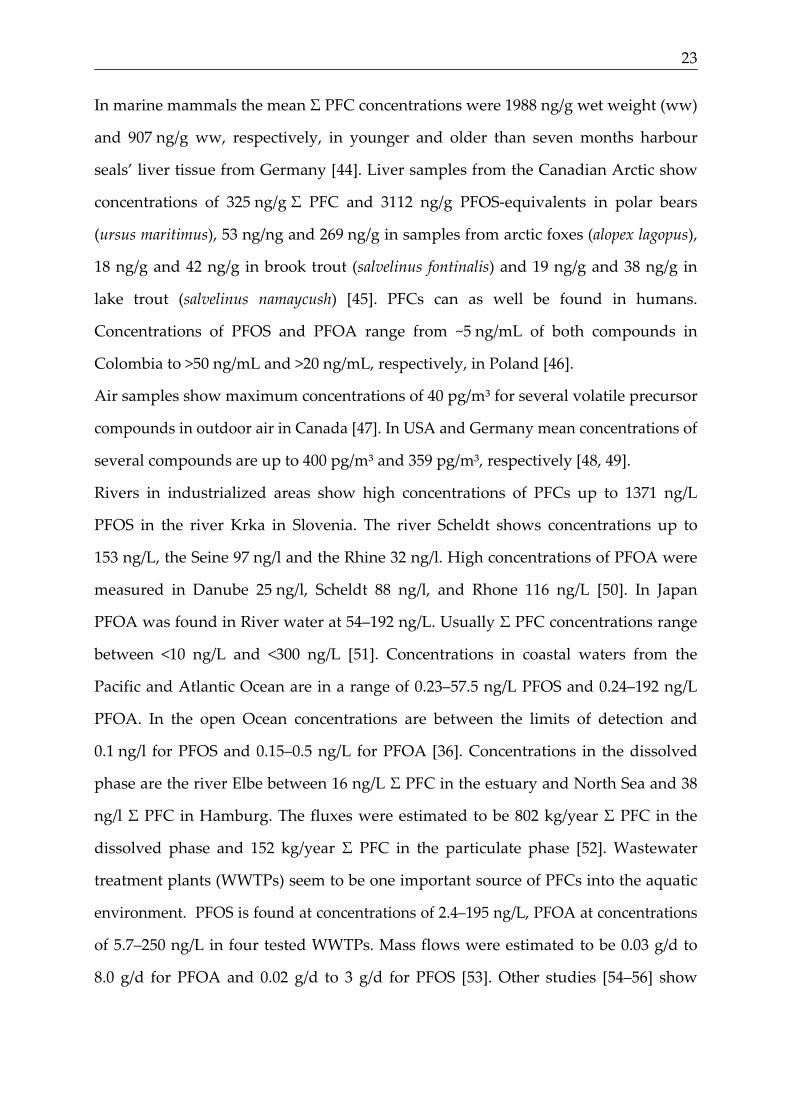
In marine mammals the mean � PFC concentrations were 1988 ng/g wet weight (ww)
and 907 ng/g ww, respectively, in younger and older than seven months harbour
seals’ liver tissue from Germany [44]. Liver samples from the Canadian Arctic show
concentrations of 325 ng/g � PFC and 3112 ng/g PFOS-equivalents in polar bears
(ursus maritimus), 53 ng/ng and 269 ng/g in samples from arctic foxes (alopex lagopus),
18 ng/g and 42 ng/g in brook trout (salvelinus fontinalis) and 19 ng/g and 38 ng/g in
lake trout (salvelinus namaycush) [45]. PFCs can as well be found in humans.
Concentrations of PFOS and PFOA range from ~5 ng/mL of both compounds in
Colombia to >50 ng/mL and >20 ng/mL, respectively, in Poland [46].
Air samples show maximum concentrations of 40 pg/m³ for several volatile precursor
compounds in outdoor air in Canada [47]. In USA and Germany mean concentrations of
several compounds are up to 400 pg/m³ and 359 pg/m³, respectively [48, 49].
Rivers in industrialized areas show high concentrations of PFCs up to 1371 ng/L
PFOS in the river Krka in Slovenia. The river Scheldt shows concentrations up to
153 ng/L, the Seine 97 ng/l and the Rhine 32 ng/l. High concentrations of PFOA were
measured in Danube 25 ng/l, Scheldt 88 ng/l, and Rhone 116 ng/L [50]. In Japan
PFOA was found in River water at 54–192 ng/L. Usually � PFC concentrations range
between <10 ng/L and <300 ng/L [51]. Concentrations in coastal waters from the
Pacific and Atlantic Ocean are in a range of 0.23–57.5 ng/L PFOS and 0.24–192 ng/L
PFOA. In the open Ocean concentrations are between the limits of detection and
0.1 ng/l for PFOS and 0.15–0.5 ng/L for PFOA [36]. Concentrations in the dissolved
phase are the river Elbe between 16 ng/L � PFC in the estuary and North Sea and 38
ng/l � PFC in Hamburg. The fluxes were estimated to be 802 kg/year � PFC in the
dissolved phase and 152 kg/year � PFC in the particulate phase [52]. Wastewater
treatment plants (WWTPs) seem to be one important source of PFCs into the aquatic
environment. PFOS is found at concentrations of 2.4–195 ng/L, PFOA at concentrations
of 5.7–250 ng/L in four tested WWTPs. Mass flows were estimated to be 0.03 g/d to
8.0 g/d for PFOA and 0.02 g/d to 3 g/d for PFOS [53]. Other studies [54–56] show

24
similar results. Lakes contain concentrations at 21–70 ng/L for PFOS and at 27–
50 ng/L for PFOA [34]. Concentrations in landfill leachate are shown later.
2.7 Toxicology and ecotoxicology
Fluorinated compounds have toxicological effects on animals and human beings. The
toxicity of PFCA is amongst other things based on peroxisome proliferation [25, 57].
For other PFCs it is suspected to have similar toxicology effects [58]. Subchronic
effects manifest in significant weight loss, hepatoxicology, reduction of cholesterol in
serum and decrease of thyroid hormones [59], as well as gastrointestinal effects,
haematological abnormalities and convulsions [25]. Maternal effects, like reduction
of foetal weight, cleft palate, delayed ossification of bones, and cardiac abnormalities,
could be observed trough a wide range of species [59]. Additionally higher tumour-
rates were found [60].
The lethal dosis for 50 of the tested animals (LD50) was investigated for rats and
resulted in >250 mg/kg for PFOA and 251 mg/kg for PFOS. Chronic effects can occur
in fatheaded minnow below concentrations of 1 mg/L [25]. ‘No observed effect levels’
(NOEL) and ‘lowest observed effect levels’ (LOEL) are for PFOS 0.1 mg/kg and
0.4 mg/kg, respectively [61]. A calculated ‘no observed adverse effect level’ (NOAL)
for Rhesus monkeys (macaca mulatta) is 0.15 mg/kg/day. A toxicological test with
4.5 mg/kg/day ended lethal for the whole group [57]. In Fish the fatheaded minnow
(Pimephales promelas) was the most sensitive species with a LC50 of 9.1 mg PFOS/L in
96 hours. The ranges in this study were from 7.2 mg/L in 28 days for fatheaded minnow
to 22 mg/L in 96 hours for rainbow trout (Oncorhynchus mykiss). NOEC ranges between
0.29 mg/L for fatheaded minnow and 6.3 mg/l in rainbow trout. ‘Lowest observed effect
concentrations’ (LOEC) were 0.58 mg/L and 13.0 mg/l, respectively [14]. In summary
it is assumed that PFOS is moderately toxic to fish and slightly toxic to invertebrates,
but non-toxic for algae [25]. PFBS, which is the designated substitute for PFOS,
shows in general a LD50 >2000 mg/kg and a NOEL of >1000 mg/kg/day [29].

25
The bioaccumulation factor (BAF) of PFOS ranges between 6,300 and 125,000 in fish
in field-based data; and 8 to 30,000 in lab-based data [62]. In rainbow trout the
bioconcentration factors (BCFs) increases from 4.0 to 23,000 for PFOA to PFTDA. The
BCF increased by the factor of eight for each carbon atom in the fluorinated chain
between C = 8 and C = 12 chain length. PFCAs and PFSAs with carbon chains of
seven and less are considered not to bioaccumulate [63]. PFSAs have greater BAFs,
half-lives and uptake-rates than PFCAs [64]. The Biomagnification factor (BMF) was
18 for PFOS in Minks (Neovison vison) [65]. The half-lives are estimated to be 3.9–28 days
in rainbow trout for several PFCs [63]; PFOS is estimated to have a half live in rats of
>90 days and 100 to 200 days in cynomolgus monkeys (Macaca fascicularis). PFOA is
estimated to have half-lives from 1.9 hours (females) to 9 days (males) in rats (Rattus
spec.), with a large gender-based difference. For Beagle dogs (Canis lupus familiaris) half-
lives were estimated to be 202 and 473 hours, respectively [59]. In humans the half-lives
were estimated to be 8.7 years for PFOS and 1–3.5 years for PFOA [25].

26

27
3 Basic information on landfills
3.1 Aim and regulation of landfills
Landfills are man-made to construct “environmentally friendly” sinks for neither
avoidable nor utilisable wastes. Therefore harmful substances have to be locked out
of the cycle of materials [66]. Landfills are built to provide a civil work in which
treated wastes can be deposited under conditions where remaining pollution are
acceptable for environment and location over a long period of time [67]. To assure
environmental safety, landfills have to satisfy legal rules.
The German legislation is based on the law for recycling and waste (Kreislauf-
wirtschafts-/Abfallgesetz) [68], the enhancement for waste depositioning (Abfall-
ablagerungsverordnung) [69], the enhancement for landfills (Deponieverordnung)
[70], as well as the technical instruction for waste (Technische Anleitung Abfall) [71],
and the technical instruction for municipal waste (Technische Anleitung Siedlungs-
abfall) [72]. Another relevant rule is the Water Management Act (Wasserhaushalts-
gesetz) [73] which sets rules, how clean wastewater must be to be in order allowed to
freight in receiving waters.
The most important rule is the technical instruction for municipal waste (Technische
Anleitung Siedlungsabfall) [72], which describes the design of landfills. Furthermore
it states that leachate has to be collected, monitored and treated wherever possible.
The waste depositing enactment (Abfallablagerungsverordnung) [69] states additional
rules, for example that wastes containing organic matter have to be pre-treated by
incineration or biological treatment in order to reduce organic pollutants and
chemical activity.
3.2 Design of landfills
To assure environmental safety of landfills, the planning, constructing and operating
has to search for geological and hydrogeological adequate places, useful sealing,
proper installations of fillings, and achieving of assignment criteria of the given laws,
which construct different independent barriers for the disposal of pollutants [74]. The

28
multibarrier-concept is based on six different points: geology, sealings, landfarming,
operating, monitoring and aftercare [75].
There are five different classes of landfills in Germany: ‘Class 0’ is for excavated soil,
like sand or flint, and underlies no further regulation and leachate treatment relevant
here. ‘Class I’ to ‘class III’ are aboveground landfills, which are allowed for waste
with different properties. ‘Class I’ is for construction waste and excavated soil, ‘class
II’ is for municipal waste and ‘class III’ for waste with a higher amount of pollution
and other characteristics than ‘class II’. ‘Class IV’ landfills are underground depots
for special wastes [76]. Additionally there are landfills installed before laws were
established. They are referred here ‘old type’ landfills. ‘Class I’ landfills can have
sections with a ‘class II’ allowance, depending on the concession.
Since municipal landfills are the mostly sampled subject in this study, a closer look at
the construction of landfill ‘class II’ is taken: The TaSi gives specifications for a
standard assembly, which contains a base seal and a surface sealing. The base seal
(graph 1), has to be build on adequate ground with a mineral sealing of 75 cm thickness
composed out of three layers, a synthetic layer of more than 2.3 mm thickness and a
drainage layer which contains pipes for the collecting of leachate. Other classes of
landfills have to fulfill analogous rules with layer formations [72]. The main function
of base seals is to keep groundwater out of the landfill body, in order to keep the
solid waste dry and to avoid the solution of contaminants in fluid. Leachate has to be
kept inside the landfill, in order not to pollute the surrounding soil. The reasons for
collecting leachate are minimizing the backwater at the base and to get water out of
the landfill to treat it properly [77].

29
Landfills have to have a surface sealing wherever possible. Active construction
sections do not need a sealing until they are filled; chemically active sections get a
provisory sealing due to settlings [71]. The surface sealing is constructed of an
equalizing layer with a height of 50 cm, which can be pervaded by gas collecting pipes,
and a mineral layer of 50 cm thickness. On top of that a drainage layer for rainwater
discharge and a vegetation layer with plant cover are installed [72]. See graph 2 for a
sketch.
Graph 1: Standard assembly for base sealing from
'class II' landfills. (Own illustration based on [72])
Graph 2: Standard assembly for surface sealing of
'class II' landfills. (Own illustration based on [72])

30
3.3 Emissions from landfills
3.3.1 Gaseous emissions
Landfill gas is one kind of emissions from landfills. Biological degradable substances
like carbohydrates, fat and proteins are decomposed to 30 to 60 % methane, 30 to 50 %
carbon dioxide and around 2 % trace amounts of hydrogen sulphide, carbon monoxide,
nitrogen, quicksilver, and trace gases like fluorochlorocarbons [75]. Due to a heating
value of 10 kWh/m³ landfill gas is burned to win energy [74]. One million tones waste
can replace 1,000 m³ fuel oil.
3.3.2 Leachate
The water which comes out of landfills is referred to as ‘leachate’. Leachate originates
in humidity of waste, rain [78] or in infiltrating groundwater, if the landfill has no
base sealing. The amount of leachate depends on rain, evaporation, run off [75], and
adsorption in the landfill body [74]. The amount of leachate is quantified to be
4–10 m³/ha/year in open areas, 1–4 m³/ha/year in vegetated areas and less than
1 m³/ha/year in sealed areas [78]. Leachate contains various organic and inorganic
contaminants [79].
It is not permitted to discharge leachate uncleaned into downstream receiving waters
if certain limit values are not reached. The limits are given in appendix 51 of the
wastewater ordinance (Abwasserverordnung) [80]. Selected parameters from the
ordinance are a chemical oxygen demand (COD) below 200 mg/L, biological oxygen
demand in five days (BOD %) BSB5 below 20 mg/L, Nitrogen below 70 ng/L, and
hydrocarbons below 10 mg/l. Estimations state these values can be reached after
65–320 years for COD and after 120–450 years for Nitrogen without a cleaning
treatment. A typical value for an active landfill is COD of 1,500–2,500, and NH4-N of
600–1,000 mg/l [78], which causes adverse effects in aqueous environments; therefore
leachates usually have to be treated.

31
3.4 Treatment of leachate
The treatment of wastewater has generally the aim to clean water from pollution,
chemical stabilizing of remaining substances, and disinfection, if the water should be
used for drinking water purposes [81]. There are different ways to treat leachate. The
law does not specify one way to treat leachate, but advises to treat with ‘state of
technology’ (‘Stand der Technik’) [71]; therefore a proper way of treatment for any
leachate in particular has to be searched. An overview on the different treatment
ways is given in table 2. The different treatments are usually combined in order to
combine amenities regarding cleaning different groups of pollutants.
Table 2: Different treatment systems and their adequacy for different pollutants (Reduced from [78]).
Abbreviations: + = applicable, - = inapplicable, o = applicable on limited extend.
Nitrogen BSB CSB AOX hydrocarbons Biological treatment
+ + o o o
Reverse osmosis o o o + + Adsorption - o o + + Chemical oxidation + o o o o
3.4.1 Mechanical pre-treatment
The first cleaning step for landfill effluent is a mechanical pre-treatment. Sand or pea
gravel prevents solid matter from floating into the downstream treatment systems.
This is not necessarily prerequisite for all biological treatments, but useful for most
other treatments [82]. Single- or multilayer systems can be considered, depending on
the composition of leachate [81]. The treatment system can be cleaned by refluxing
into the landfill body.
3.4.2 Biological treatment
Almost every biological treatment with activated sludge and
nitrification/denitrification is possible as treatment for leachate. Usually biological
treatments are a first cleaning step with a downstream filtration step [82]. Biological
treatments are technical implementations of natural purifications as it is happening

32
in natural water bodies [83]. The most important aim of biological treatments is to
take out Nitrogen, due to high oxygen demand in microbiological oxidation of
nitrification, and toxicological effects of NH4+ ions on fishes [83]. The denitrification
step, which is not necessarily following the nitrification step, converts nitrogen in the
gaseous form and sets it free into the atmosphere [83]. As residue of the cleaning
treatment activated sludge is generated. This sludge was taken out on landfills, but
has to be pre-treated since 2005 [69].
3.4.3 Chemical treatment – wet air oxidation
Wet air oxidation is a treatment system for organic substances. The main aim is to
reduce AOX to water, carbon dioxide and inorganic chlorine [82]. Therefore Ozone is
given in combination with different other treatments to the leachate. The most
common combinations are O3/H2O2, O3/UV and H2O2/UV [84]. Ozone can directly
react with a compound or produces hydroxyl radicals that react with the compound.
The aim is to provide unselective and rapid OH-radical to oxidise pollutants, natural
organic and inorganic compounds, disinfection, and the removal of color and taste
[84]. Ozone mostly affects carbon double bindings [85]. Leachate is recommended to
be piped into municipal WWTP [82].
3.4.4 Membrane treatment
Membrane treatment is an umbrella term for physical treatments that separate
leachate into a cleaner permeate and a dirtier residue via a membrane. Therefore
leachate is send trough a membrane using pressure. The used treatments are micro
filtration, ultra filtration, nano filtration and reverse osmosis. The main difference is
the range of sizes of pollution that is separated. Micro filtration works in a range of
10-4–10-7 m size of pores, ultra filtration works in a range of 10-5–10-8 m, nano filtration
at 10-7–10-9 m and reverse osmosis at 10-8–10-9 m [82]. Reverse osmosis is operated at
pressures up to 100 bars. Micro filtration and nano filtration are suitable as a first
cleaning step or for the separation of activated sludge after a biological treatment,
while reverse osmosis is more suitable as a secondary cleaning step. The resulting

33
concentrate has to be treated adequately, due to high chemical charges [82]. The
treatment is depending on filtration at the membrane and therefore the leachate of
reverse osmosis has constant concentrations in permeate unlike activated carbon, where
changing concentration in leachate can result in changing concentrations in effluent.
3.4.5 Adsorption
Organic contaminants can adsorb to surfaces of carrier material like activated carbon,
resin or smectite. Therefore organically polluted leachates are often send trough an
adsorption system as a last cleaning step [82]. Activated carbon is the most common
adsorbent in the treatment of leachate; in deed, in this study no other adsorbent was
used. Activated carbon, which can be used in different form as powder, granulate
material, or for gaseous emissions pressed in forms, is the optimal treatment for
unpolar and low polar organic compounds, whereas resin is suitable for more polar
components [85]. Activated carbon for the use in cleaning treatments shows surface
areas from 600–1,300 m²/g and therefore provides a big surface to adsorb [85]. The
adsorption is based on van-der-Waals-forces. After a certain time the activated
carbon is charged by compounds. To avoid breakthroughs the carbon has to be
changed or regenerated regularly [85].
3.5 Knowledge about PFCs in landfills
The recent knowledge about PFCs in landfills in peer-reviewed literature is quite
small, even though local authorities are collecting data, which are either not sorted,
like in Lower Saxonia, where a few districts (Regierungsbezirke) have data for single
landfills, or like the federal state North Rhine Westphalia (Landesamt für Natur
Umwelt und Verbraucherschutz, LANUV) that owns a pool of not evaluated and
published data. Nevertheless some published data is available: A total of 15 landfill
sites is covered by four surveys [56, 86–88], whereof one survey was conducted by a
major fluorochemical producer [86]. Fifteen treated and one untreated leachates were
tested. The �PFC concentration ranged between below the limits of quantification

34
(0.0025 μg/L) for three tested compounds in Columbus, Georgia, USA [86] to
5227 ng/L for twelve compounds in Högbytorp, Sweden [87]. The average of � PFC is
1456 ng/L for all observed landfill sites. The averages and standard deviations for the
single compounds are listed in table 3. One tested untreated landfill leachate showed
concentrations of several thousand ng/L for PFHxS (8,900 ng/L), PFOS (9,600 ng/L),
and PFOA (4,200 ng/L), whereas nine other compounds were not quantifiable, due to
limits of detection (LOD) at levels between 11 ng/L for PFDS and 1,300 ng/L for
PFBA. High LODs might have been resulted from not specially optimised methods
for leachate. No study was on the matter of landfill leachates, therefore methods
were not adjusted, which might have led to high detection limits.
Table 3: Averages, median and standard deviations for PFCs in landfill leachate in ng/L, based on
literature data ([56, 86–88]). NQ = not quantifiable
[86](n =3) [87](n =4) [88](n =6) [56](n =2) Average concentrations from all sites
PFBS
PFHxS
PFOS
PFDS
PFBA
PFHxA
PFHpA
PFOA
PFNA
PFDA
PFUnA
PFOSA
-
-
<25-52.7 (17.7)
-
-
-
-
NQ-48.1 (16.9)
-
-
-
-
<0.5-110 (37.25)
12-1800 (518)
32-1500 (555)
<1-0.28 (0.07)
<12-30 (7.5)
<7-310 (77.5)
<20-260 (197.5)
38-1000 (537)
<18-100 (43.5)
<20-220 (82.5)
<59
<2-7 (2.75)
5.64-112 (51.5)
12.4-143 (77.0)
32.8-187 (82.5)
-
-
26.4-697 (228)
-
92.4-516 (293)
4.7-61.5 (34.8)
-
-
NQ-3.28 (1.17)
-
<0.2-3.1 (0.8)
<1.5-3.8 (1.1)
-
-
-
-
<2-5.8 (2.9)
<0.8
<1.6
<2.2
<0.3
57±42
231±499
213±388
0.3
30
238±215
146±104
331±301
43±28
165±55
NQ
1.20±1.06
However, besides the available data, different authors [8, 23, 25, 32, 34] suggest landfills
as potential source of PFCs to the environment. Direct emissions of existing PFCs are
as well suggested as decomposition of precursors like fluorotelomer acrylate polymers
[35] and gaseous emissions of FTOHs [48].

35
4 Materials and Methods
4.1 Chemicals
In this study 43 poly- and perfluorinated compounds were analysed, including
16 PFCAs, 7 PFSAs, 3 PFSiAs, 3 PFPAs, 4 FASAs, 3 FASEs, 3 FTCAs, 3 FTUCAs and
6:2 FTS. All chemicals have purity equal or greater 95 % and were purchased by 3M,
ABCR, Alpha Aesar, Fluka, Lancaster Sythesis and Wellington Laboratories. For a
complete list of chemicals, formula, acronyms, corresponding Internal Standard,
suppliers and mass transitions see table 1 in the appendix. Internal Standards have a
purity of >98 % and purchased by Wellington Laboratories. For a complete list
containing, formula, acronyms, and mass transitions see the appendix. Methanol
(Suprasolv), acetonitrile (LiChrosolv), ammonium hydroxide (25 % p.a.) and ammonium
acetate were purchased from Merck (Darmstadt, Germany). Pure water was produced
by a MilliQ Plus 185 system by Millipore (Zug, Germany).
4.2 Sample collection and sampling sites
On 22 landfill sites samples were taken. An overview on the geographical position of
the landfill sites can be obtained in figure 3. Twenty treated and six untreated
leachates were taken. On four sites (sites 7, 8, 14 and 17) leachates before and after
treatment were taken. Five sites were monitored for three and four months,
respectively, with sampling rates between two and four weeks. On two sites samples
were taken during different steps of the treatment process. Samples were taken at
installed sampling points before, in between, and after the treatment process. Overall
58 samples were analyzed. Samples were taken in 250 ml polypropylene (PP)-bottles,
cleaned in a dishwasher with clean water post-purge and dried at 60 °C in an oven.
Samples were sonicated, due to bacterial growth in some samples in pre-tests, and
stored at 4 °C until further preparation.
From the 21 sites, 20 sites had a treatment before discharging into wastewater or
downstream rivers. On 11 sites only one treatment procedure was used, the other ten
had a combination of two or more treatments (i.e., biological treatment and activated

36
carbon). A complete list with landfill sites, cleaning treatments and annual amounts
of effluent is given in table 4.
Table 4: Overview on tested landfills with estimated annual amount of leachate in m³/year,
treatment process, status, landfill class, and sample.
Landfill Amount of leachate (m³/year)
Treatment process Status Landfill class Sample of leachate
1 Unknown external Inactive closed 2005
I Untreated
2 46,000 Biological Active II Treated 3 26280 Biological, reverse
osmosis Active II Treated
4 7000 Biological, reverse osmosis
Inactive closed 1999
3 sites: 2xII and 1xIII Treated
5 8000 Nitrification Active II Treated 6 175200 Wet air oxidation Active I, partial II Treated &
untreated 7 28700 Activated carbon Inactive
closed 1979 Old Type partial unknown waste
treated
8 9000 Activated carbon Inactive closed 1979
Old Type partial unknown waste
Treated & untreated
9 8000 Activated carbon Inactive closed 2004
II Treated & within treatment Steps
10 200 Nanofiltration Inactive closed 1999
II Treated
11 20000 external Inactive closed 1986
II Untreated
12 55000 Nanofiltration Active II Treated 13 10000 Reverse osmosis Active II Treated 14 20000 Flotation, biol,
activated carbon Active II Treated &
untreated 15 8000 Reverse osmosis Active II Treated 16 16500 Biological, activated
carbon Active II Treated
17 19500 Flotation, biological, activated carbon
Active II Treated & untreated
18 131400 Activated carbon Active II Treated & within treatment steps
19 27500 Biological, reverse osmosis
Inactive closed 1999
II Treated
20 26500 Flotation, biological, activated carbon
Active II Treated
21 29000 WWTP/external Active II, only filter-cake from a WWTP
Treated
22 41100 Reverse osmosis Active II Treated

37
Graph 3: Geographical position of the tested landfill sites (Graph designed with [89]).
4.3 Sample preparation
The sample preparation followed a procedure described before by Ahrens [37] with
small modifications. The samples were prepared within four weeks after sampling.
They were filtered by glass fiber filters (GFF, GC/C, Whatman, Ø 47 mm, 1.2 μm),
which were baked out at 450 °C prior to use. An aliquot of 50 mL of treated leachate
and 5 mL of untreated leachate, respectively, was adjusted to a pH-value of 7–8 using
ammonia. Most samples had a pH lower than 7, since acids are added in preparation
for membrane treatments. At pH 7–8 the mean recoveries were best. Short chained
compounds had higher recovery rates at low pH-values, but longer chained PFCs
(C>6) had low recovery rates. This was already mentioned by Skutlarek [90]. The
aliquots were spiked with 100 μL of a mass-labeled internal standard mix (IS) with a
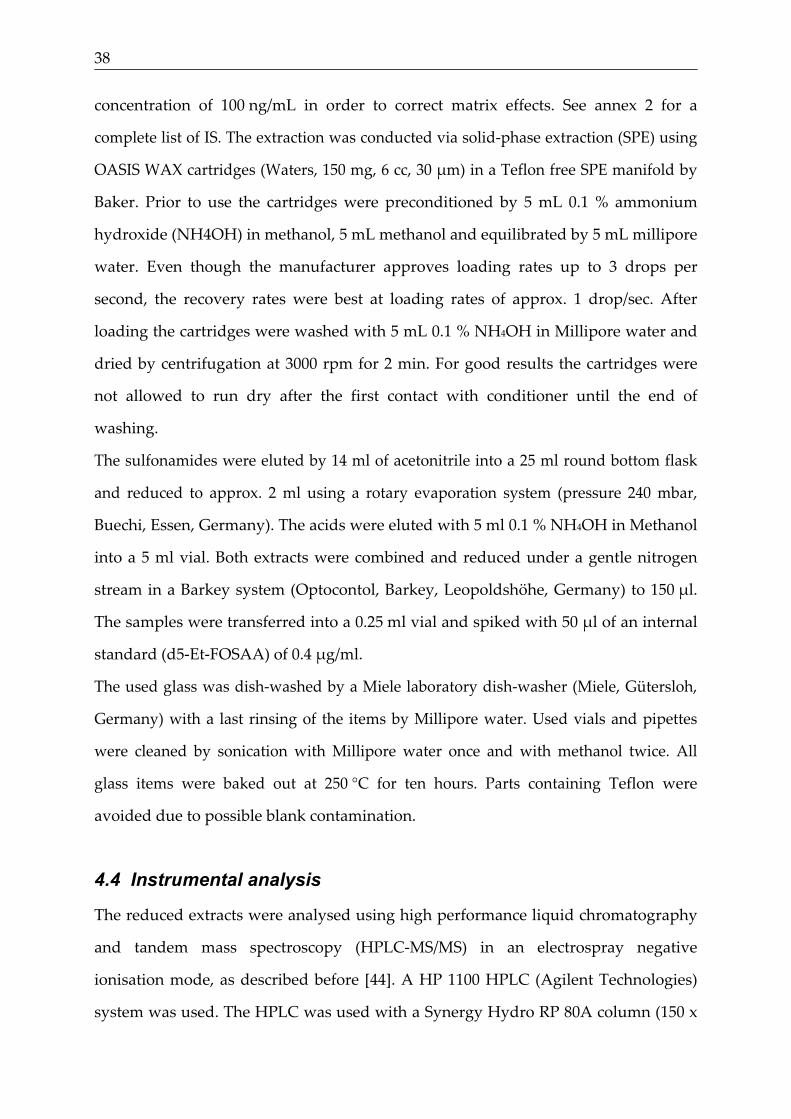
38
concentration of 100 ng/mL in order to correct matrix effects. See annex 2 for a
complete list of IS. The extraction was conducted via solid-phase extraction (SPE) using
OASIS WAX cartridges (Waters, 150 mg, 6 cc, 30 μm) in a Teflon free SPE manifold by
Baker. Prior to use the cartridges were preconditioned by 5 mL 0.1 % ammonium
hydroxide (NH4OH) in methanol, 5 mL methanol and equilibrated by 5 mL millipore
water. Even though the manufacturer approves loading rates up to 3 drops per
second, the recovery rates were best at loading rates of approx. 1 drop/sec. After
loading the cartridges were washed with 5 mL 0.1 % NH4OH in Millipore water and
dried by centrifugation at 3000 rpm for 2 min. For good results the cartridges were
not allowed to run dry after the first contact with conditioner until the end of
washing.
The sulfonamides were eluted by 14 ml of acetonitrile into a 25 ml round bottom flask
and reduced to approx. 2 ml using a rotary evaporation system (pressure 240 mbar,
Buechi, Essen, Germany). The acids were eluted with 5 ml 0.1 % NH4OH in Methanol
into a 5 ml vial. Both extracts were combined and reduced under a gentle nitrogen
stream in a Barkey system (Optocontol, Barkey, Leopoldshöhe, Germany) to 150 μl.
The samples were transferred into a 0.25 ml vial and spiked with 50 μl of an internal
standard (d5-Et-FOSAA) of 0.4 μg/ml.
The used glass was dish-washed by a Miele laboratory dish-washer (Miele, Gütersloh,
Germany) with a last rinsing of the items by Millipore water. Used vials and pipettes
were cleaned by sonication with Millipore water once and with methanol twice. All
glass items were baked out at 250 °C for ten hours. Parts containing Teflon were
avoided due to possible blank contamination.
4.4 Instrumental analysis
The reduced extracts were analysed using high performance liquid chromatography
and tandem mass spectroscopy (HPLC-MS/MS) in an electrospray negative
ionisation mode, as described before [44]. A HP 1100 HPLC (Agilent Technologies)
system was used. The HPLC was used with a Synergy Hydro RP 80A column (150 x

39
2 mm, 4 μm) at constant 30 °C in combination with a Synergy 2 μ Hydro RP Mercury
column (20 x 2 mm, 2 μm) by Phenomenex. In order to avoid blank contamination
from Teflon parts the degasser system was disconnected and as far as possible all
Teflon tubes were exchanged with PP tubes. The degassing of the mobile phases was
accomplished by sonication prior to use. The mobile phases were 10 mM
ammoniumacetate as ionisation aid in Millipore water and methanol, respectively.
The operating flow was 200 μL/min in gradient mode, starting with 70 % of
ammoniumacetate in water as mobile phase, decreasing to 30 % within three minutes,
decreasing to 0 % over 28 minutes and being kept constant for the next seven
minutes. A pre-run for equilibration of the column before all injections lasted seven
minutes with pure methanol. The injection was 10 μL and the needle was rinsed in
pure methanol before each use.
The detection was done with a triple-quadrupol mass spectrometer (API 3000, Applied
Biosystems/MDS Sciex) in a multiple reaction monitoring mode (MRM) with Analyst
1.5.1 (Applied Biosystem/MDS Sciex) as operating software. The source block was set
to 300 °C and ionisation voltage was -4500 Volt. Nebuliser, curtain and collision gas
was set to 14, 8 and 6 L/min, respectively.
4.5 Quantification
Quantification was made using a calibration from 0.1 ng/mL to 300 ng/mL of the
compounds. The calibration points were 0.1, 0.5, 1.0, 2.5, 5.0, 10.0, 50.0, 100.0, 200.0
and 300.0 ng/mL. For quantification response factors (analyte peak area/IS peak area)
were taken. See table 1 in the annex for analytes and corresponding internal
standard. The calibration curves had usually correlation coefficients of >0.99. In some
samples some compounds (i.e., PFBS) were out of the calibration range, therefore the
compounds were analysed again with the same method but with an extraction
volume of 5 mL. For some compounds, e.g. PFOS, more than one peak could be
identified. These peaks occur due to the detection of isomers [58] and are not
quantified due to the lack of standards. For four compounds, PFPS, PFNS, PFPeDA

40
and PFHpA no standards were available. These compounds were quantified by
parameters of the shorter and longer chained compounds and are therefore only
estimations.
4.6 Quality control
The quality control and assurance was made by using internal standards and
recovery rates, method blanks, mass detection limits, mass quantification limits,
control standards, repeating tests and the calculation of the matrix effect.
Blanks were prepared of Millipore water at least every eight samples together with
the samples. They were calculated as concentrations in corresponding volume and
subtracted from the measured values. Blanks were found in the samples processed
with 50 ml for nine substances (PFHxS, PFOS, PFOSi, PFBA, PFPA, PFOA, PFDA,
PFUnDA and PFOSA) at pg/L levels. PFOA and PFOS reached a blank value of over
1 ng/L three times for PFOA and 1 time for PFOS, respectively. Samples processed
with 5 ml had higher blanks, up to levels of 39 ng/L for PFOA and 36 ng/L for PFBS,
due to the low sample volume. The other blanks for samples of untreated leachate
were less than 10 ng/L for each substance. All samples were corrected by the blank
concentration.
Recovery rates were calculated as percentage of 100 μl added mass labelled standard
with a concentration of 100 ng/L. They were in average 59±16 %. The lowest recovery
rate was 49±15 % for D5-EtFOSA, the highest 70±21 % for 13C-PFOSi. An overview is
given in table 5; a complete list is shown in the annex. Samples with mean recovery
rates lower than 50 % have not been taken into further consideration, but were prepared
again with lower extraction volumes to reach recoveries over 50 %.

41
Table 5: Recovery rates and standard deviation of Internal Standards
in leachate samples in percent.
Substance Recovery rate 18O2-PFHXS 13C-PFOS 13C-PFOSI 13C-PFBA 13C-PFHXa 13C-PFOA 13C-PFNA 13C-PFDA 13C-PFUDA 13C-PFDoA D3-MeFOSA D5-EtFOSA D7-MeFOSE D9-EtFOSE 13C-6:2 FTCA 13C-FOEA 13C-FDEA 13C-FHUEA 13C-FOUEA 13C-FDUEA mean
59±25 60±22 70±21 43±24 58±26 59±23 62±23 64±18 68±15 64±12 50±14 49±15 58±13 57±15 57±19 60±25 58±18 57±27 64±22 69±14 59±16
The mass detection limits and mass quantification limits were calculated as signal to
noise ratio of three and ten, respectively, in samples. The calculation was made as
average of multiple calculations in samples with a signal to noise ratio close to ten, if
possible. Table 6 shows the detection and quantification limits. The lowest level was
0.01 ng/L and 0.05 ng/L, respectively, for PFHxSi. The highest levels were 6.8 ng/L
and 22.8 ng/L for PFDPA.

42
Substance MDL MQL PFBA PFPS PFHxS PFHpS PFOS PFNS PFDS 6:2 FTS PFHxSi PFOSi PFDSi PFBA PFPA PFHxA PFHpA PFOA PFNA PFDA PFUnDA PFDoDA PFTriDA PFTeDA PFPeDA PFHxDA PFHpDA PFOcDA ME2PFOA PFOSA NMeFOSA NEtFOSA NMeFOSE NEtFOSE MeFBSA MeFBSE 6:2 FTCA 8:2 FTCA 10:2 FTCA 6:2 FTUCA 8:2 FTUCA 10:2 FTUCA PFHpPA PFOPA PFDPA
0.12 0.10 0.7 0.49 0.03 1.85 n.d. 1.93 0.01 0.02 n.d. 3.36 2.02 0.11 0.04 0.12 1.09 0.06 0.03 0.04 0.10 0.06 n.d. 0.39 0.81 0.50 0.46 0.04 0.16 2.00 0.24 0.83 2.40 4.75 1.58 n.d. n.d. 0.32 0.05 0.09 3.58 3.69 6.83
0.39 0.33 0.24 1.63 0.11 6.17 n.d. 6.44 0.05 0.06 n.d. 11.20 6.72 0.37 0.12 0.40 3.63 0.21 0.11 0.14 0.32 0.21 n.d. 1.30 2.68 1.65 1.54 0.15 0.52 6.67 0.81 2.77 7.99 15.82 5.27 n.d. n.d. 1.07 0.17 0.29 11.93 12.30 22.78
Reference standards of c = 50 ng/mL of each compound were measured regularly and
showed the expected concentrations. Repeating tests of leachate from site 6 were
measured and showed a deviation of <10 % in five samples. The matrix effect, an
unspecific effect of the matrix that changes detection behavior, was calculated to be
in average 0.89 for all compounds in leachate of site 9.
Table 6: Mass detection limits (MDL) and mass quantification
limits (MQL) in ng/L for all compounds in leachate.
n.d.= not detected
43
5 Results
5.1 PFCs in untreated leachates
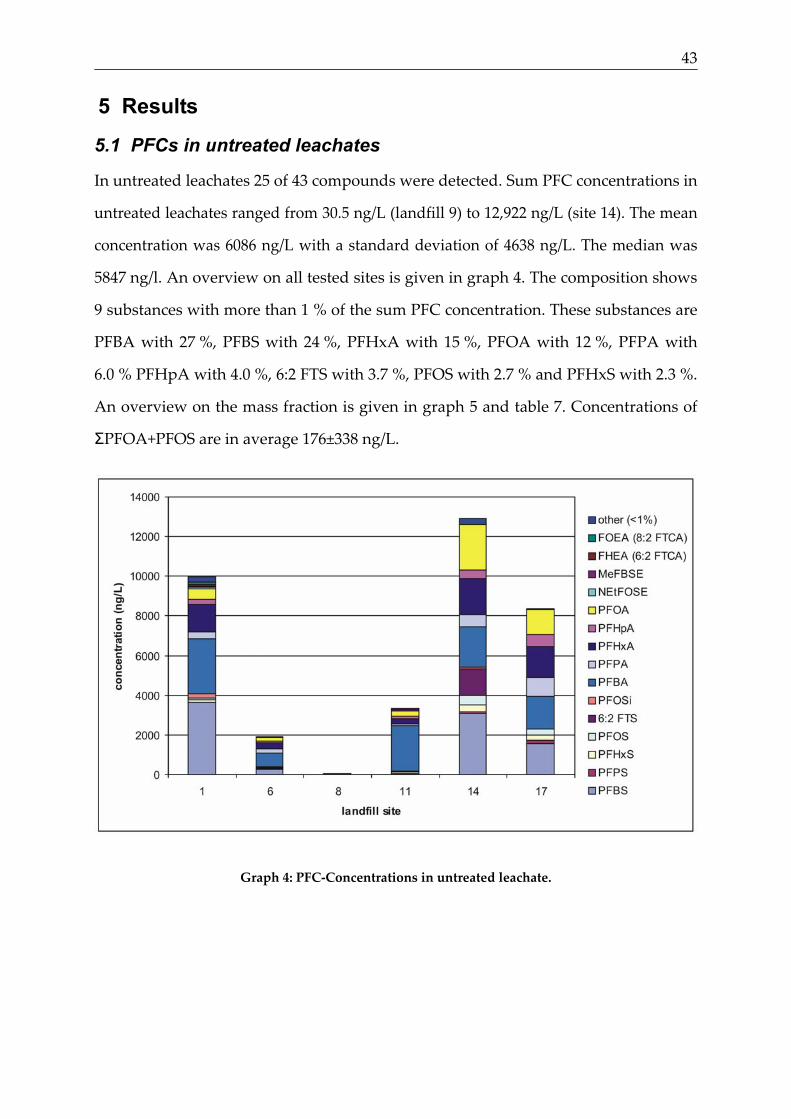
In untreated leachates 25 of 43 compounds were detected. Sum PFC concentrations in
untreated leachates ranged from 30.5 ng/L (landfill 9) to 12,922 ng/L (site 14). The mean
concentration was 6086 ng/L with a standard deviation of 4638 ng/L. The median was
5847 ng/l. An overview on all tested sites is given in graph 4. The composition shows
9 substances with more than 1 % of the sum PFC concentration. These substances are
PFBA with 27 %, PFBS with 24 %, PFHxA with 15 %, PFOA with 12 %, PFPA with
6.0 % PFHpA with 4.0 %, 6:2 FTS with 3.7 %, PFOS with 2.7 % and PFHxS with 2.3 %.
An overview on the mass fraction is given in graph 5 and table 7. Concentrations of
�PFOA+PFOS are in average 176±338 ng/L.
Graph 4: PFC-Concentrations in untreated leachate.

44
Graph 5: Mass fractions of individual PFCs in untreated leachate.
Table 7: Contribution of individual PFCs in untreated leachate in percent of � PFC.
Only compounds with mass fraction of >1 % are shown.
Compound Mass fraction
PFBA PFBS PFHxA PFOA PFPa PFHpA 6:2 FTS PFOS PFHxS
26 24 15 12 6.0 4.0 3.7 2.7 2.3
5.2 PFCs in treated leachates
In the treated leachate 39 of 43 compounds are found in concentrations above the
MQL. NEtFOSA, 8:2 FTCA and 10:2 FTCA could not be found at all. The sum
concentrations of all compounds range between 3.97 ng/L in landfill 9 and 8060 ng/L
in landfill 5. The mean �PFC concentration is 1336 ng/L with a standard deviation of
2139 ng/L; the median is 139 ng/L. A complete overview is given in graph 6. The mass
fraction of compounds is shown in graph 7 and table 8. Nine compounds have a
contribution of >1 % of the �PFCs (i.e., 34 % for PFBA, 18 % for PFHxA, 17 % for PFBS,

45
11 % for PFOA, 9.2 % for PFPA, 3.6 % for PFHpA, 2.3 % for PFOS and 1.7 % for PFHxS).
This corresponds to 96 % of the �PFCs.
The mass flows are estimated to be between 0.03 g/year in landfill 9 and 349 g/year in
landfill 6. The mean mass flow is 49.4±89.4 g/year and a median of 2.31 g/year. Mass
flows are rough estimations, since temporal trends and short time changes in
concentrations are unknown and only estimated by maximum four samples. The
mass flows for each landfill is shown in graph 8.
Graph 6: PFC-Concentration in treated leachate of all tested sites.
Table 8: Mass fractions of PFCs in treated leachate in percent for all compounds
with >1 % mass fraction.
Compound Mass fraction PFBA PFHxA PFBS PFOA PFPA PFHpA PFOS PFHxS 6:2 FTS
34 18 17 11 9.2 3.6 2.3 1.7 1.0

46
Graph 7: Mass fraction of compounds in treated leachate of all tested sites.
Graph 8: Mass flows of PFCs in treated leachate of all tested sites. Results are � PFCs in g/year.

47
5.3 PFC concentration after different treatment steps
On two landfills samples were taken within the Steps of the activated carbon
treatment. Both sites had a treatment consisting of three containers that are
consecutively arranged and filled with activated carbon. Landfill site 9 additionally
has a lagoon after the cleaning treatment, which was sampled two times. The site
was sampled altogether five times after each carbon container and two times after the
lagoon; results are shown in table 9. The mean concentration is decreasing after every
carbon container, but higher again in the outflow from the lagoon, due to PFOSA,
which was not found before. See annex for the detailed results of container III and
the lagoon.
Table 9: Monitoring the different treatment steps on landfill 9 over a period of three months with
sampling rates of 2–4 weeks. Results are given in � PFCs. Concentrations in empty fields were
measured, but are not taken into consideration due to low recovery rates.
Sampling period Container 1 Container 2 Container 3 lagoon 1st time 0.93 2nd time 10.77 2,77 1,68 3rd time 17,3 10,9 10, 9 4th time 6,92 8,95 11,0 5th time 14.0 16,4 1,95 7.28 � PFC mean 12.2±3.84 7.75±6.25 6.39±4.56 9.15±1.87
In the leachate from site 18 the concentration is 4384 ng/L after container I, 3908 after
container II and 1442 ng/L after container III. Except the substances PFOSi and
PFOSA, where concentrations increase during the treatment, concentrations of all
substances are decreasing. See table 10 for results of individual compounds.

48
Table 10: Concentrations of indicidual PFCs in leachate from site 18 after each container
of activated carbon (AC) treatment. All concentrations are in ng/L.
Effluent of AC container 1
Effluent of AC container 2
Effluent of AC container 3
PFBS 2127 2108 136 PFPS 3.85 4.37 0.37 PFHxS 16.8 5.70 0.03 PFOS 9.70 2.75 1.60 PFHxSi 0.78 0.56 n.d. PFOSi n.d. 2.09 2.65 PFBA 830 819 945 PFPA 412 324 331 PFHxA 678 515 11.1 PFHpA 91.3 56.7 1.30 PFOA 210 62.3 2.99 PFNA 3.94 n.d. n.d. PFOSA n.d. 7.03 9.87
5.4 Changes of concentrations in short times
Six landfill effluents were tested three and four times, respectively. The mean values
are given above. Standard deviations within the time series are between 9.1 % and
88.4 % from the mean value. The results are shown in detail in table 11.
Table 11: � PFCs Samples of samples were taken three or four times with a sampling rate
of 2–4 weeks from six landfills. All concentrations are given in ng/L.
Sampling site Sampling period Mean 1 2 3 4 7 166 206 198 - 190±17.3 8 1.8 12.2 7.8 - 9.3±2.1 9 1.3 6.8 5.9 1.8 4.0±2.4 12 1858 622 1298 - 1257±505 14 3635 4181 2246 5156 4079±690 16 0.9 4.3 12.5 25.7 10.8±9.6

49
6 Discussion
6.1 Patterns of PFCs
6.1.1 Patterns in treated and untreated leachate
The pattern of PFCs in untreated leachate shows a share of almost 50 % for the short
chained compounds PFBA and PFBS. There are two other compounds with more
than 10 % share of concentration; PFHxA and PFOA. In treated leachate the patterns
show a share of 34 % for PFBA and between 10 % and 20 % for PFHxA, PFBS and PFOS,
respectively. The three most present substances show shares in both leachates
around 65 %. The composition in treated and untreated leachate is very similar. See
table 19 for detailed information on shares in concentrations.
Table 12: Comparison of the patterns of PFCs in treated and in untreated leachate.
Shown is every compound with an average mass fraction of more than 1 %.
Treated leachate Untreated leachate PFBA 34,3 PFBA 26,1 PFHxA 17,5 PFHxA 14.8 PFBS 16,5 PFBS 23,5 PFOA 10,8 PFOA 12.3 PFPA 9,2 PFPA 6.0 PFHpA 3,6 PFHpA 4.0 PFOS 2,3 PFOS 2.7 6:2 FTS 3.7 PFHxS 2.3
6.1.2 Patterns in leachates after different treatment systems
Nevertheless the mass fractions in treated leachates show different patterns in
leachates from different treatment systems. See table 20 for detailed information.
Reverse osmosis lets predominantly pass short chained compounds. PFBA and PFBS
share more than 70 % of the load. PFOA shows a high rate as well and PFOS is
negligible. Activated carbon treatment lets out mostly carboxylic acids: More than
90 % of the load is determined by PFPA, PFHxA, and PFHpA, whereas sulfonic acids
are almost not present. The other treatment processes, nano filtration, wet air
oxidation and biological treatment let out more PFCAs than PFSAs. Except PFPS

50
with shares between 18.3 % and 29.8 % PFSAs are almost inexistent. In sediments,
PFCAs show lower accumulation rates than PFSAs [91], which is seen here, too.
PFPA and PFHpA are the major compounds with shares up to 30 %, each. Compared
to untreated leachate PFBS is less present, while PFPS shares more. In other matrices,
like biota [45], longer chained compounds show better adsorption capacity than
shorter chained compounds. In leachate the share of compounds shorter than C = 8
chained compounds should rise. This is not observable since mainly shorter chained
compounds are found in treated and untreated leachate and the three most abundant
compounds share the same sum of percentages before and after the treatment.
Table 13: Comparison of the patterns of PFCs after different treatment processes.
Shown are percentages of selected compounds.
Reverse osmosis
Activated carbon
Nano filtration
Wet air oxidation
Biological treatment
PFBS PFPS PFBA PFPA PFHxA PFHpa PFOA PFNA Rest to 100 %
60 0.2 10 2.0 3.8 1.6 15 0.0 7.4
1.9 3.7 0.0 70 18 5.6 0.0 0.1 0.7
1.2 30 0.0 21 5.8 21 3.8 11 6.2
0.2 20 0.0 29 5.5 7.5 6.2 19 30.6
0.1 18 0.0 23 8.0 29 4.0 12 34.9
6.1.3 Comparison of treated and untreated leachate from four landfills
Leachate was taken before and after treatment on four sites. Changes in the pattern
could be observed: In the samples from site 6 the share of PFBA decreased from 37 %
to 28 %. Other compounds showed smaller differences in the comparison. In the
activated carbon treatment bigger changes were observable. In site 8 PFBA decreased
from 93 % to 40 %, while PFOA and PFOSA increased from 2 % and 0 % to 15 % and
30 %, respectively. In site 14 PFBA and PFPA increased from 16 % and 5 % to 73 %
and 17 %, respectively. PFHxA and in particular PFOA decreased from 14 % and
18 % to 8 % and 0 %. In site 17 only smaller changes in the patterns were observable.
In table 14 an overview is given. Overall every leachate shows a specific pattern before
and after treatment. Coherences regarding the chain length are discussed later.

51
Table 14: Comparison of patterns of selected compounds before and
after the treatment process in percentage.
Site Treatment
6 Wet air oxidation
8 Activated carbon
14 Flotation + biological activated carbon
17 Flotation + biological activated carbon
before treatment
after treatment
before treatment
after treatment
before treatment
after treatment
before treatment
after treatment
PFBS 6:2 FTS PFBA PFPA PFHxA PFOA PFOSA
13 0 37 11 16 9 0
12 1 28 8 17 14 0
1 0 93 4 0 2 0
10 0 40 0 0 15 30
24 10 16 5 14 18 0
2 0 73 17 8 0 0
19 0 20 11 19 15 0
11 0 32 3 6 24 1
6.1.4 Concentrations compared to surface water and effluents of WWTPs
In aqueous environmental matrices a wide range of concentrations for PFCs can be
found. In comparison the concentrations of landfill leachate are in a higher group.
The smallest sum concentration found in this study is 4 ng/L, which is in the same
field as the lowest concentrations in river water [92], sea water [40] or municipal
WWTPs [54, 56]. The median concentration found in this study is 139 ng/L. This
concentration is comparable to concentrations found in various WWTPs [54]. The
mean concentration found in this study is 1336 ng/L. These concentrations can be
found as well in few rivers in Europe [50] and industrial WWTPs [33, 56]. The
highest amount found in this study is outbid by an industrial WWTP from a site used
industrially, where metals are processed [33]. Actually the mean value of untreated
leachate is smaller than the concentration from that particular WWTP. See table 13
for an overview. The concentrations of treated landfill leachate are, in the higher area
of concentrations found. Nevertheless the mean concentrations are in the same range
as industrial sources, and therefore not unusual to find.

52
Table 15: Concentrations of � PFCs in different aqueous environmental matrices in ng/L.
Aqueous sample type
Number of tested sites
Number of tested Substances
Min Max Mean or singular measurement
Source
Treated landfill leachate
20 43 �PFOS+PFOA
4 0.48
8,060 1117
1,335 176
This study
Treated landfill leachate
15 3-13 n.d. 5,227 1,456 [56, 86, 87]
Untreated landfill leachate
6 43 31 12,922 6,080 This study
Untreated landfill leachate
1 13 22,200 [87]
Rhine 43 4 268 [92, 93]
Rivers in Europe PFOA PFOS
174 1371
12 39
[50]
WWTP NY-State 6 PFOA PFOS
58 3
1050 68
[54]
Industrial WWTP Municipal WWTP
4 6
7 6
12.7 n.d.
796.8 34.6
24.0
[56]
north Sea 41 9.4 31.2 [40] WWTP Printing industry
1 11 10.1 [33]
WWTP Textile industry
2 11 2.8 664 [33]
WWTP Laundry and cleaning
2 11 31.9 296.2 [33]
WWTP Paper industry
1 11 478 [33]
WWTP Electric industry
1 11 12.2 [33]
WWTP Metal industry
2 11 133.4 8472.0 [33]
6.2 Short time temporal variations
Six sites provided samples for three and four times with a sampling rate of 2–4
weeks. The results of the multi sampled sites should give an idea whether big
variations are occurring over short time and to determine if a one time sampling can
be enough to estimate mass flows or not. As seen before landfills discharge ten to one
hundred times less PFCs than WWTPs it is enough to assure a certain quality of that
estimation if concentrations do change less than one order of magnitude. See table 16
for complete data.

53
Table 16: Comparison of PFC concentrations in three and four time sampled sites.
Shown are mean values in ng/L, deviation and a factor for the difference between the highest and
the lowest observed concentration.
Site Mean Factor between highest and lowest concentration
7 8 9 12 14 16
190.1±17.3 9.3±2.1 6.39±4.6 1257.3±505 4070.2±690 10.8±9.6
1.2 1.6 6.5 3.0 1.5 28.6
Five of six tested sites show a variance of concentrations by a factor less than ten
within three or four months. That means the criterion for acceptable quality is met.
Only one site shows a factor of more than ten, but this is a site that shows very little
concentrations. Higher polluted leachates show smaller variations. Therefore the
variation in the concentrations and the estimation of mass flows is not compulsively
correct or at least nearby correct in a few cases. Nevertheless, since three out of six
sites show a factor of less than two for the range of concentrations found, it can be
assumed that altogether no wrong conclusions are drawn from the concentrations
found. The changes in concentrations are too small to change the order of magnitude
of the annual mass flows.
6.3 Influence of the age of leachate to concentrations
Correlations between the age of the landfill and the concentrations in leachate were
calculated. The landfills where samples from untreated leachate were taken, were
closed in 1979 (site 8), 1986 (site 11), 2005 (site 1) and three are still active (sites 6, 14
and 17). For mathematical reasons active sites were set as 2009 for closing year. If the
year of closing of the landfill is mapped to the measured concentration in leachate a
correlation can be found.

54
Graph 9: Correlation between the year of closing of landfills and � PFC concentrations in ng/L
found in untreated leachate.
In treated leachate the line coefficient of R² = 0.67 shows that age is a factor for the
concentrations of � PFCs that can be found in leachate, even though there are other
factors that influence the composition of leachate. The correlation can get rise to
R² = 0.95 if sites 1 and 6, which are ‘class I’ landfills are taken out of consideration.
Admittedly, the database would be four sites and hence too small to conclude that
correlation.
For treated leachate the mapping can be stated as well:

55
Graph 10: Correlation between the year of closing of landfills and � PFC concentrations in ng/L
found in treated leachate.
Here R² is 0.03 and age of the landfill is not the main explanation factor for the
concentrations of landfills. Anticipating the next chapter, correlations within the
different cleaning treatments could be stated, due to the size of the database, only for
activated carbon treatment at R² = 0.21. The correlation is almost ten times higher, but
still too small for making age a relevant factor for PFC emissions. Since for all years
of closing, the lowest concentrations are in a very low area, but the highest
concentrations of � PFCs rise, the variance of concentrations is higher in treated
leachates from active sites, than from closed sites.
If a simpler model of comparison is chosen, the differentiation between the status
active and inactive and not the date of closing, a connection of the age is observable.
This can be seen in table 15. The mean concentrations differ a factor of nine and the
mean mass flows differ a factor of 29, although the median concentration is
comparable. In this case age can show an observable difference in the amount of
PFCs in leachate. The mean mass flows are about 29 times higher as in inactive sites.
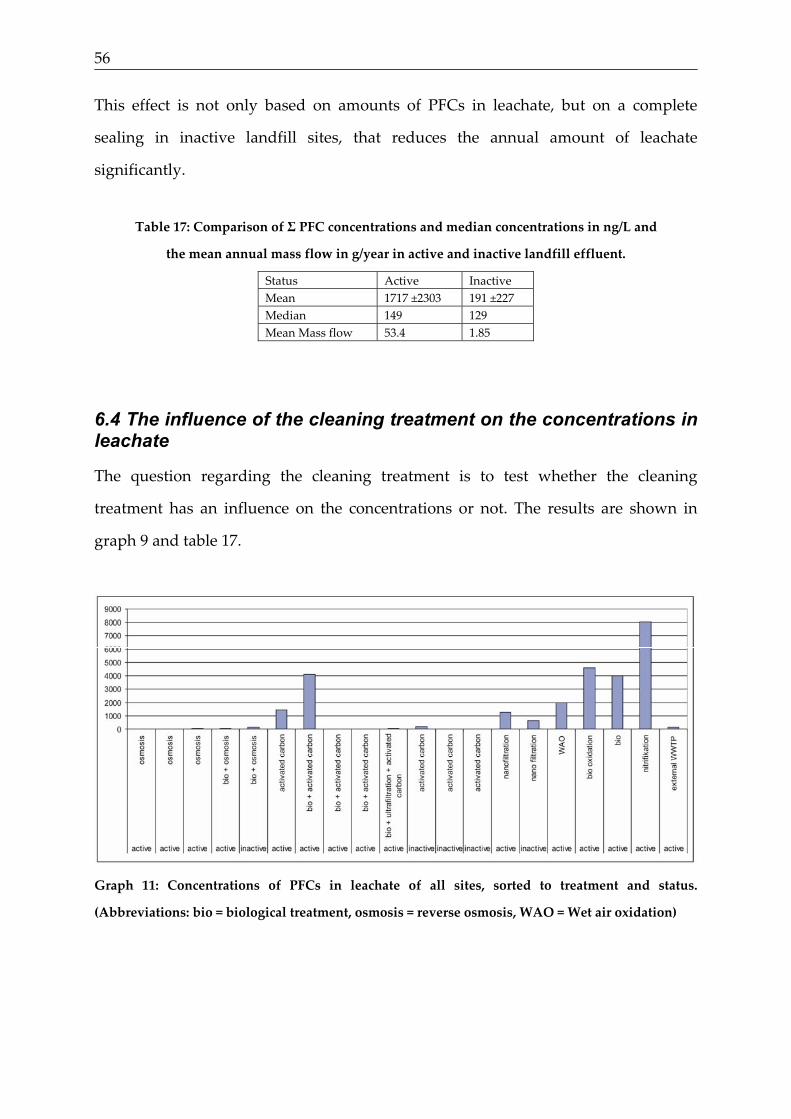
56
This effect is not only based on amounts of PFCs in leachate, but on a complete
sealing in inactive landfill sites, that reduces the annual amount of leachate
significantly.
Table 17: Comparison of � PFC concentrations and median concentrations in ng/L and
the mean annual mass flow in g/year in active and inactive landfill effluent.
Status Active Inactive Mean 1717 ±2303 191 ±227 Median 149 129 Mean Mass flow 53.4 1.85
6.4 The influence of the cleaning treatment on the concentrations in leachate
The question regarding the cleaning treatment is to test whether the cleaning
treatment has an influence on the concentrations or not. The results are shown in
graph 9 and table 17.
Graph 11: Concentrations of PFCs in leachate of all sites, sorted to treatment and status.
(Abbreviations: bio = biological treatment, osmosis = reverse osmosis, WAO = Wet air oxidation)

57
Table 18: Mean concentrations, median concentrations and the highest concentration of sum
� PFCs in ng/L after different cleaning treatment systems.
Treatment Number (n) Average Median Highest concentration
Reverse osmosis 5 42 24 129 Activated carbon 8 723 22 4079 Nano-filtration 2 940 940 1257 Wet air oxidation 2 3302 3302 4610 Biological treatment 2 6041 6041 8059
Reverse osmosis and especially activated carbon show big differences between
average and median. One and two, respectively, outliers cause the differences,
whereas the statistical database is too small to calculate sensuous data in
mathematical outlier tests. Nevertheless based on this data it seems reasonable, that
the cleaning treatments reverse osmosis and activated carbon can be the best for
cleaning PFCs out of landfill leachate. Additionally, activated carbon might have a
higher potential for the cleaning of PFCs than estimated here. The outlier
concentrations of activated carbon treatment might be caused by fully loaded
activated carbon in the samples with high concentrations. The next best treatment
seems to be nano filtration, then wet air oxidation and at last only biological
treatment. These results are reasonable: Nano-filtration cannot clean as well as
reverse osmosis, since the membrane has not that small pores [82] and therefore
molecules can pass more easily through the membrane. Wet air oxidation might not
even have a chance to reduce the concentration of PFCs, since that treatment works
on carbon double bounds [85], which are not existent in the tested compounds.
Therefore, precursor compounds might be degraded during the wet air oxidation
process. The same effect has to be taken into account for biological treatments, where
precursor compounds might be degraded, too [54].
Based on the median values of 24 ng/L and 22 ng/L reverse osmosis and activated
carbon treatment are the only processes which can reduce the concentrations in
leachate to levels where drinking water quality as � PFCs � 300 ng/L is reached. Based
on the average and the highest concentration measured, only reverse osmosis can reach
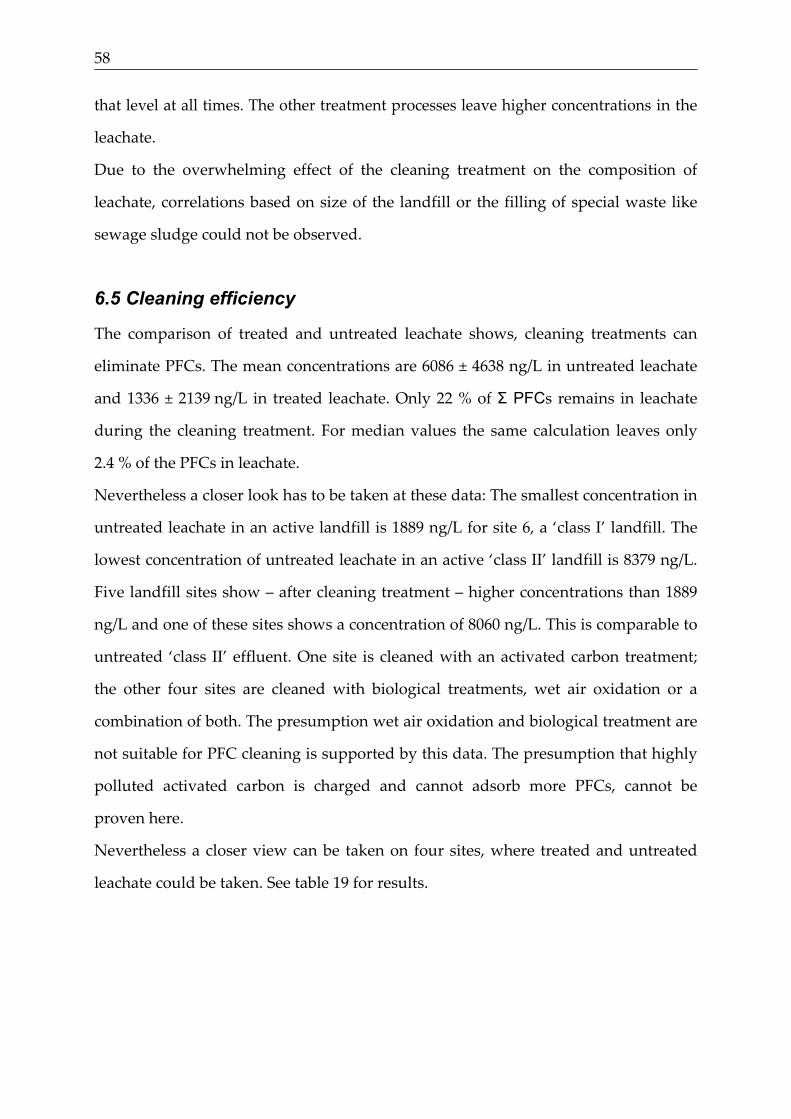
58
that level at all times. The other treatment processes leave higher concentrations in the
leachate.
Due to the overwhelming effect of the cleaning treatment on the composition of
leachate, correlations based on size of the landfill or the filling of special waste like
sewage sludge could not be observed.
6.5 Cleaning efficiency
The comparison of treated and untreated leachate shows, cleaning treatments can
eliminate PFCs. The mean concentrations are 6086 ± 4638 ng/L in untreated leachate
and 1336 ± 2139 ng/L in treated leachate. Only 22 % of � PFCs remains in leachate
during the cleaning treatment. For median values the same calculation leaves only
2.4 % of the PFCs in leachate.
Nevertheless a closer look has to be taken at these data: The smallest concentration in
untreated leachate in an active landfill is 1889 ng/L for site 6, a ‘class I’ landfill. The
lowest concentration of untreated leachate in an active ‘class II’ landfill is 8379 ng/L.
Five landfill sites show – after cleaning treatment – higher concentrations than 1889
ng/L and one of these sites shows a concentration of 8060 ng/L. This is comparable to
untreated ‘class II’ effluent. One site is cleaned with an activated carbon treatment;
the other four sites are cleaned with biological treatments, wet air oxidation or a
combination of both. The presumption wet air oxidation and biological treatment are
not suitable for PFC cleaning is supported by this data. The presumption that highly
polluted activated carbon is charged and cannot adsorb more PFCs, cannot be
proven here.
Nevertheless a closer view can be taken on four sites, where treated and untreated
leachate could be taken. See table 19 for results.
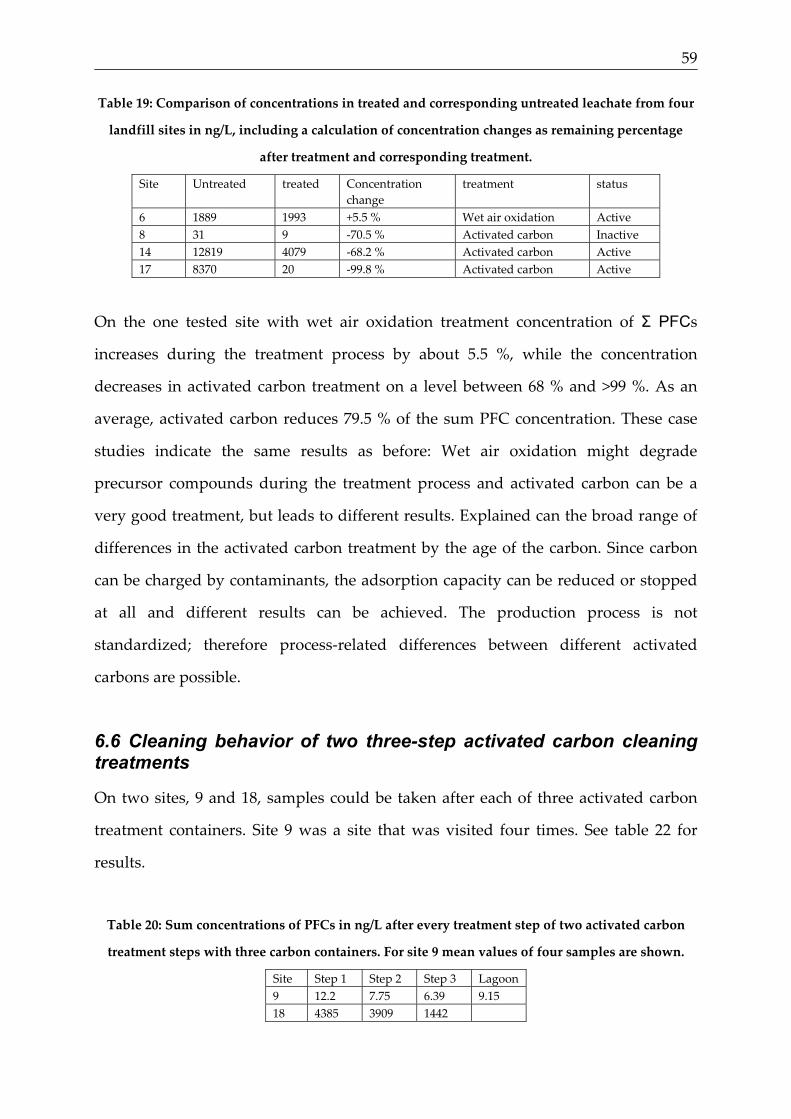
59
Table 19: Comparison of concentrations in treated and corresponding untreated leachate from four
landfill sites in ng/L, including a calculation of concentration changes as remaining percentage
after treatment and corresponding treatment.
Site Untreated treated Concentration change
treatment status
6 1889 1993 +5.5 % Wet air oxidation Active 8 31 9 -70.5 % Activated carbon Inactive 14 12819 4079 -68.2 % Activated carbon Active 17 8370 20 -99.8 % Activated carbon Active
On the one tested site with wet air oxidation treatment concentration of � PFCs
increases during the treatment process by about 5.5 %, while the concentration
decreases in activated carbon treatment on a level between 68 % and >99 %. As an
average, activated carbon reduces 79.5 % of the sum PFC concentration. These case
studies indicate the same results as before: Wet air oxidation might degrade
precursor compounds during the treatment process and activated carbon can be a
very good treatment, but leads to different results. Explained can the broad range of
differences in the activated carbon treatment by the age of the carbon. Since carbon
can be charged by contaminants, the adsorption capacity can be reduced or stopped
at all and different results can be achieved. The production process is not
standardized; therefore process-related differences between different activated
carbons are possible.
6.6 Cleaning behavior of two three-step activated carbon cleaning treatments
On two sites, 9 and 18, samples could be taken after each of three activated carbon
treatment containers. Site 9 was a site that was visited four times. See table 22 for
results.
Table 20: Sum concentrations of PFCs in ng/L after every treatment step of two activated carbon
treatment steps with three carbon containers. For site 9 mean values of four samples are shown.
Site Step 1 Step 2 Step 3 Lagoon 9 12.2 7.75 6.39 9.15 18 4385 3909 1442

60
In both sites the concentrations decrease during the cleaning treatment. On a low
contamination level at site 9 the cleaning treatment of the container II and III leaves
82.5 % and 57.6 % from the inflowing concentrations, respectively. On site 18 the
outgoing amounts are 89.1 % and 36.9 % of the incoming. Especially in the treatment
of site 18 the three treatment steps can reduce the concentrations even after the first
carbon treatment container on a significant level, since treatment steps II and III leave
32.9 of the concentration after treatment step I. On site 9 47.5 % of the outflow from
step I is left after step III.
A higher concentration in the outflow of the lagoon origins in PFOSA, which is a
typical run-off substance [92], that likely caused the growing concentration. The
concentrations of PFOSA are raising within the treatment steps of site 18, too.
Degradation processes of precursor compounds must occur in the carbon container.
See annex V and VI for information on the composition of these leachates.
6.7 Correlations of adsorption from PFCAs and PFSAs depending on the chain length and functional group
The change of concentrations in site 18, as shown in table 23, gives an idea if the
cleaning of activated carbon depends on the chain length.
Table 21: Concentrations in leachate after each of three activated carbon treatment containers
on site 18 for selected compounds in ng/L.
Compound Step I Step II Step III PFBS PFPS PFHxS PFOS PFBA PFPA PFHxA PFHpA PFOA PFNA
2127 3.9 17 9.8 831 412 678 91 210 4.0
2108 4.4 5.7 2.8 820 324 515 56 62 0.0
136 0.4 0.0 1.6 945 331 11 1.3 3.0 0.0
The data suggest activated carbon treatment works better for longer chained
compounds than for shorter chained compounds. For PFCAs coherences between the

61
chain length and the remaining percentage for the influent and effluent of the
containers seem to be existent. PFBA and PFPA are not affected by the carbon
treatment on the whole; actually the concentration for PFBA is higher than the
influent in two of three comparisons. The concentrations of carboxylic acids with
more than five carbons in the chain are decreasing strongly. For PFSAs this behavior
here is not observable. FOR PFCAs the results are comparable to results found in
biota [63], where longer chained PFCs are adsorbing better.
A mathematical correlation between chain length and carryover from effluent of
container I to effluent of container III for PFCAs leads to a correlation with R² = 0.72:
Graph 12: Correlation between chain length of the carbon chain in PFCAs and the leftover between
effluent from activated carbon treatment container I and activated carbon treatment container III.
On sites 14 and 17 samples before and after the treatment could be taken, as
described above. The remaining percentage of concentrations of selected compounds
after the treatment system in comparison to the concentrations before the treatment
system is shown in table 24.

62
Table 22: Comparison of remaining percentages of concentrations of selected compounds
after the treatment system in comparison to the concentrations before the treatment system.
All values are given in percent.
Compound Site 14 Site 17 PFBS PFPS PFHxS PFHpS PFOS PFBA PFPA PFHxA PFHpA PFOA
2.4 0.5 0.0 0.0 0.1 144 113 18 2.2 0.1
0.1 0.4 0.4 0 0.9 0.4 0.1 0.1 0.1 0.4
Here the correlations are for PFSAs in site 14 R² = 0.71 and in site 17 R² = 0.27. For
PFCAs the correlations are R² = 0.86 and R² = 0.00. All together the correlations
indicate, there might be a correlation between adsorption and chain length, but due
to the small number of tested sites and the objecting results from site 17, the results
cannot be proven.
6.8 Toxic effects of concentrations from landfills
Despite the lack of data on toxicities of all PFCs, there are only few data available on
compounds with a chain length of C = 8, and even less for C = 4. However, due to the
lack of better information, toxicity data for PFOS and PFOA are taken in the
following discussion as mean toxicity values for all PFCs, to be able to discuss sum
concentrations.
Effects in marine environments are reported to be acute toxic at levels beginning at
low mg/L concentrations, at LD50 dose in 96 hours, the concentration in water where
the dosage shows lethal effects on 50 % of the tested animals, of 3.3 mg/L for PFOS [97]
and 9.1 mg/L for PFOA for fatheaded minnow (Pimephales promelas) [14]. The LD50
sinks to 7.2 ng/L in 28 days for PFOA [14]. These concentrations are not reached by
the concentrations found in this study. The maximum value found is 0.08 ng/L and is
therefore a factor of 100 away from a LD50-dose.

63
Nevertheless NOEC, the lowest concentration where no effect was found on a group
of animals compared to a control group, is 0.3 mg/L of PFOS for juvenile fatheaded
minnow and 6.3 mg/L of PFOS for rainbow trout (Oncorhynchus mykiss). The LOEC,
the lowest concentration observed where effects were noticeable, is 3.0 mg/L of PFOS
for fatheaded minnow and 13.0 mg/L for rainbow trout, respectively [14]. Here the
maximum value found in this study is only a factor of 3.6 lower the most sensitive
NOEC. The average is about 22 times lower than the NOEC. Therefore it is safe to
say, concentrations in treated leachate are close to affecting concentrations for
sensitive species, since NOEC and LOEC are based on a test of 96h. Due to the lack of
long term data and multi generation studies in aquatic environments these
concentrations are too high to be neglected. Especially in combination with other
compounds like pharmaceuticals local effects might occur.
Precautionary levels for drinking water, as stated by the commission for drinking
water from the federal ministry of health (Trinkwasserkomission des Gesundheits-
ministeriums) [98], stated levels of 0.1 μg/L as aim for drinking water, 0.3 μg/L as
guiding value and 0.5 μg/L and 5.0 μg/L as precautionary action value for infants and
adults, respectively, as � PFOA + PFOS. If the sum concentrations are not weighted for
different toxicities, 8 μg/L (8060 ng/L) was the highest � PFC concentration found in
this study. The highest concentration of � PFOA+PFOS was 3.1 μg/L. Treated leachate is
unsuitable as drinking water, since the precautionary action value is exceeded.
Anyhow, it has to be taken into account, concentrations are only reached in outflows
of the cleaning treatments and about half of the landfills are indirect dischargers;
concentrations are diluted in WWTP and rivers. Normally undiluted leachates are
not accessible for wildlife or human beings.
6.9 Concentrations compared to surface water and effluents of WWTPs
In aqueous environmental matrices a wide range of concentrations for PFCs can be
found. In comparison the concentrations of landfill leachate are in a higher group.
The smallest sum concentration found in this study is 4 ng/L, which is in the same

64
field as the lowest concentrations in river water [93], sea water [40] or municipal
WWTPs [54, 56]. The median concentration found in this study is 139 ng/L. This
concentration is comparable to concentrations found in various WWTPs [54]. The
mean concentration found in this study is 1336 ng/L. These concentrations can be
found as well in few rivers in Europe [50] and industrial WWTPs [33, 56]. The
highest amount found in this study is outbid by an industrial WWTP from a site used
industrially, where metals are processed [33]. Actually the mean value of untreated
leachate is smaller than the concentration from that particular WWTP. See table 13
for an overview. The concentrations of treated landfill leachate are, in the higher area
of concentrations found. Nevertheless the mean concentrations are in the same range
as industrial sources, and therefore not unusual to find.

65
Table 23: Concentrations of � PFCs in different aqueous environmental matrices in ng/L.
Aqueous sample type
Number of tested sites
Number of tested Substances
Min Max Mean or singular measurement
Source
Treated landfill leachate
20 43 �PFOS+PFOA
4 0.48
8,060 1117
1,335 176
This study
Treated landfill leachate
15 3–13 n.d. 5,227 1,456 [56, 86, 87]
Untreated landfill leachate
6 43 31 12,922 6,080 This study
Untreated landfill leachate
1 13 - - 22,200 [87]
Rhine 43 4 268 [93, 100] Rivers in Europe PFOA
PFOS 174
1371 12 39
[50]
WWTP NY-State 6 PFOA PFOS
58 3
1050 68
[54]
Industrial WWTP Municipal WWTP
4 6
7 6
12.7 n.d.
796.8 34.6
24.0
[56]
north Sea 41 9.4 31.2 [40] WWTP Printing industry
1 11 10.1 [33]
WWTP Textile industry
2 11 2.8 664 [33]
WWTP Laundry and cleaning
2 11 31.9 296.2 [33]
WWTP Paper industry
1 11 478 [33]
WWTP Electric industry
1 11 12.2 [33]
WWTP Metal industry
2 11 133.4 8472.0 [33]
6.10 Mass flows
Concentrations in landfill effluent are in a higher range, but not more than in other
media, annual mass flows are a criterion to determine whether landfills are an
important or minor source to the environment. The mass flows found in this study
are between 0.03 g/year and 349 g/year. The mean mass flow is 49.4 g/year. The mass
flows of � PFOS + PFOA is 0.06 g/year in mean.
Compared to the big German rivers Rhine and Elbe with estimated mass flows of
8500 kg/year [93] and 802 kg/year [52], respectively, the mean value of 49.4 g/year is
in a per mille area of big rivers.
Bossi [56] found mass flows in industrial WWTPs between 10 and 147 g/year with an
average of 96 g/year, and mass flows in municipal WWTPs <0.45 g/year. Becker

66
found annual mass flows from WWTPs between 18 and 1825 g/year with an average
of 551 g/year. Clara [33] found a mass flow up to 4.1 kg/year in one industrial WWTP
for � PFOS + PFOA. The concentrations are comparable, even though a different
number of compounds were tested, since the most abundant compounds are covered
in all studies.
The number of landfills in Germany was 1725 in 1998 [94] and the number of ‘class II’
landfills was 162 in 2005 [95]. The numbers of landfills multiplied with the average
concentration implies the annual mass flow is between 8 and 85 kg/year as a rough
estimation. The annual mass flow for � PFOS + PFOA is between 0.9 and
10.35 g/year. The actual emission should be in a lower area of the calculated range,
since ‘class 0’ and ‘class I’ landfills should have in average less polluted wastes and
‘class III’ and ‘class IV’ landfills should not emit at all to the environment, due to
constructional reasons.
The number of WWTPs in Germany was 9,994 in 2004 [96]. The data by Bossi [56]
suggest based on WWTP-concentrations from Denmark, emissions between
4.5 kg/year and 963 kg/year. The same calculation for data by Becker suggests
emissions of 5507 kg/year �PFOS+PFOA from WWTPs. The Data by Becker seems
more reasonable as estimation for Germany, since it would cover the data by Clara
[33]. Therefore emissions from landfills are 0.14–1.5 % of the emissions from WWTPs.
Compared to the one industrial WWTP in Germany that emits 4.1 kg/year
�PFOS+PFOA [33] the summated concentration of 0.9–10.35 g/year � PFOS + PFOA
from landfills is 0.02–0.25 % and therefore negligible. One industrial WWTP emits
more than 400 times the amount PFOA + PFOS of all German landfills. Landfills
therefore are no major source of PFCs to the environment.

67
Table 24: Mass flows of � PFCs per year from selected point sources and rivers.
If no other unit is given, all values are in g/year.
Matrix and compound Quantity of tested Substances
Min Max Average or singular measurement
Source
Landfill effluent
43 �PFOS+PFOA
0,03 <<0.001
349 0.07
49.4 0.006
This study
Rhine 43 8500 kg/year [93] Elbe 40 802 kg/year [52] WWTP (n=4) PFOA+PFOS 18.25 1825 551 [53] Industrial WWTP Municipal WWTP
7 6
10.6 n.d.
147 1.8
96.4 0.45
[56]
6.11 Comparison to other data
6.11.1 Comparison to data from other landfills
The � PFC concentrations found in treated leachate in this study show a range of
concentrations between a few ng/L and above 8,000 ng/L. Even though the highest
concentration found in this study is larger than the highest amount found in other
studies (i.e. 5,227 ng/L [87]), the mean concentration in this study is 1.3 ng/L and 1.5
ng/L in other studies, respectively, and therefore in the same range. See chapter 3.5
for a detailed overview.
6.11.2 Comparison to data on the same sites
A comparison of the values found in this study compared to non-published data by
the federal state of North-Rhine Westphalia [99] shows good compliance, even
though there is one of twenty-one values that varies more than one order of
magnitude, another one varies by a factor of eight. These compounds are the short
chain compounds PFBS and PFHxS, which are reported not to perform optimal
under current methods [90]. Leachate can have changing concentrations of
contaminants in short times, as shown later. For this reason, concentrations do not
necessarily have the same concentrations in different measurements. A comparison is
given in table 12. Anyhow the concentrations found in this study show similar
results compared to other studies, both in peer reviewed literature on other sites, and
in existing data on the same landfills.

68
Table 25: Concentrations of PFCs in treated landfill effluent of three landfills (i.e., 19, 21 and 22)
compared to corresponding data from the federal state of North-Rhine Westphalia (LANUV) [99]
on the same sites. All concentrations are in ng/L.
Landfill site Substance This study LANUV 19 PFBS
PFHxS PFOA PFBA PFDA PFHpA PFHxA PFNA PFPA PFOS
99.0 0.9 8.6 8.5 0.7 3.1 2.7 0 3.1 2.5
45–200 <25–30 <25 <25 <25 <25 <25 <25 <25 <25
21 PFBS PFHxS PFOS PFBA PFPA PFHxA PFOA PFNA PFDA
15.3 3.5 8.2 53.0 18.3 19.0 22.7 0 0.5
120 110 <10 63 16 20 16 <100 <100
22 PFOA PFOS
14.6 2.8
16–60.2 2.3–<50
6.11.3 Comparison to data on untreated leachate
Woldegiorgis reports a PFC concentration of 22,200 ng/L in untreated leachate at one
tested site in Sweden. The number of compounds tested in that study is smaller, but
covers the most abundant compounds of this study. In this study the maximum
concentration found is 12,922 ng/L and the mean 6,080 ng/L. Since no data on the tested
landfill site is available, there are three options to explain the difference: Either the
high value is an outlier and coincidentally a non-representative landfill was sampled,
or the high values result in different pre treatments of waste in different countries. In
Germany pre treatment of waste is compulsory in order to get a chemical inactive
material to deposit. The tested Swedish landfill site by Woldegiorgis [87] has not
necessarily provided any treatment to waste before deposition and might therefore
provide PFC into the leachate. On the other hand it doesn’t seem impossible to find a
landfill in Germany that shows concentrations higher than 20,000 ng/L, therefore the
value found by Woldegiorgis [87] is higher, but likewise reasonable in Germany.

69
7 Conclusions and Outlook
This study was one of the first studies dealing with PFCs in landfills. Samples of
leachate from 22 landfills were taken and analyzed for 43 different fluorinated
compounds. The samples were prepared by solid phase extraction and analyzed by
HPLC-MS/MS.
The main focus of this thesis was to determine if landfills are a source of PFCs into
the environment. This question could be answered: Landfills are a minor source.
Concentrations in untreated leachate are between 30.5 ng/L and 13,000 ng/L. Sum
concentrations of PFCs in treated leachate are between 4 ng/L and 8060 ng/L and
therefore in the same range as in other aqueous sources like WWTPs, but PFC mass
flows are smaller compared to effluent of WWTPs. Mean annual mass flows from
individual landfills are 49.4 g/year in average, and thus 50 % of the mean mass flows
from individual municipal WWTPs. Due to the high Number of municipal WWTPs,
total mass of landfills in Germany are estimated to be ~1 % of the total mass flows of
municipal WWTPs in a conservative estimation. Individual industrial WWTPs show
emissions up to 4 kg/year of � PFOA + PFOS. The emissions of � PFOA + PFOS are
estimated to be between 0.9 g/year to 10.35 g/year for all landfills. Here all German
landfills emit together maximum 0.25 % of that particular site and are therefore
insignificant as source.
The concentration in effluents from landfills is depending on the cleaning treatment.
Reverse osmosis showed lowest concentrations in treated effluent, followed by
activated carbon and nano filtration. Wet air oxidation and biological treatment do
not have effects on concentrations as a comparison to untreated leachate showed.
PFC concentrations of leachates from closed sites show lower concentrations, in
treated as well as in untreated leachate. Short chained compounds with a carbon
chain length of C < 8 show higher shares than longer chained compounds with a
carbon chain of C � 8 in treated and in untreated leachate. In activated carbon
treatment a correlation between the adsorption and chain length could be observed
for PFCA and PFSA in some cases.

70
For the characterization of landfill effluent it is inadequate if only the actual lead
compounds, PFOA and PFOS are measured, since they show only small shares.
Nevertheless open questions remain. Some sites were sampled up to four times and
concentrations were observed to vary in treated leachate. Knowledge on changes in
short- and long term perspective could improve the estimations on mass flows, since
they were made mostly by single measurements. One of the treatments, activated
carbon treatment, showed a wide variation of results. Therefore more knowledge
about adsorption behavior on activated carbon treatments should be gathered to
explain the variation. Furthermore behavior of accumulation and breakthrough in
activated carbon should be collected as well.
Gaseous emissions of volatile fluorinated compounds from landfills were no object in
this study. Since it is suggested that landfills might emit precursor compounds, a
study on this topic should be conducted as well.
Monitoring on a regular base seems to be more interesting for scientific reasons than
for governmental or environmental protection reasons, since only knowledge on
behavior can be gained and the database enhanced, but environmental concentrations
concerning PFCs are occurring from other sources. Since individual industrial
WWTP are shown to have higher mass flows of PFOA and PFOS than all German
landfills together, more efforts should be taken on upgrading technologies in
WWTPs. The beginning of reducing concentrations in aqueous environmental media
starts by reducing mass flows from industrial WWTPs and not from landfills.

71
Literature
1. Kissa, E., Fluorinated Surfactants and Repellents. Marcel Dekker, 2001. 97. 2. Giesy, J.P. and K. Kannan, Global distribution of Perfluorooctane Sulfonate in
wildlife. Environ. Sci. Technol., 2001. 35(7): p. 1339. 3. Shoeib, M., T. Harner, B.H. Wilford, K. Jones, and J. Zhu, Perfluorinated
Sulfonamides in Indoor and Outdoor Air and Indoor Dust: Occurrence, partitioning, and human exposure. Environ. Sci. Technol., 2005. 39(17): p. 6599.
4. Brooke, D., A. Footitt, and T.A. Nwaogu, Environmental Risk Evaluation Report: Perfluorooctanesulphonate (pfos). Environmental Agency, 2004: p. 1.
5. KemI, Proposal for listing Perfluoroctane Sulfonate (PFOS) in Annex A of the Stockholm Convention on Persistant Organic Pollutants. 2005, Swedish Chemicals Inspectorate (KemI).
6. ERC, Directive 2006/122/eg (Richtlinie 2006/122/eg des Europäischen Parlaments und Rats vom 12. Dezember 2006 zur dreißigsten Änderung der Richtlinie 76/769/ewg des Rates zur Angleichung der Rechts- und Verwaltungsvorschriften der Mitgliedstaaten für Beschränkungen des Inverkehrbringens und der Verwen-dung gewisser gefährlicher Stoffe und Zubereitungen (Perfluoroctansulfonate), E.P.a. Council, Editor. 2006.
7. Lange, F.T., C.K. Schmidt, and H.-J. Brauch, Perfluorierte Tenside: Der PFOS (Oerfluoroctansulfonat) - Ersatzstoff PFBS (Perfluorbutansulfonat) beeinflusst zunehmend die Rohwasserqualität von Rheinwasserwerken. GWF Wasser Abwasser, 2007. 148: p. 510.
8. Paul, A.G., K.C. Jones, and A.J. Sweetman, A first global Production, Emission, and Environmental Inventory for Perfluorooctane Sulfonate. Environmental Science and Technology, 2009. 43: p. 386.
9. de Voogt, P., U. Berger, W. de Coen, W. de Wolf, E. Heimstad, M. McLachlan, S. van Leeuwen, and A. van Roon, Perforce - perfluorinated organic compounds in the European Environment. 2006, Univesiteit Amsterdam: Amsterdam.
10. Wang, N., B. Szostek, R.C. Buck, P.W. Folsom, L.M. Sulecki, V. Capka, W.R. Berti, and J.T. Gannon, Fluorotelomer alcohol biodegradations - direct evidence that perfluorinated carbon chains breakdown. Environ. Sci. Technol., 2005. 39(39): p. 7516.
11. Ellis, D.A., T.M. Cahill, S.A. Mabury, I. Cousins, and D. Mackay, Organofluorines, in Handbook of Environmental Chemistry, A.H. Neilson, Editor. 2002, Springer-Verlag: Berlin Heidelberg. p. 63.
12. Yamada, T., P.H. Taylor, R.C. Buck, M.A. Kaiser, and R.J. Giraud, Termal degradation of fluortelomer treated articles and related materials. Chemosphere, 2005(61): p. 974.
13. USEPA, Preliminary Risk Assessment of the developmental toxicity associated with the exposure to Perfluorooctanoic Acid and its Salts. U.S. EPA, Office of Pollution Prevention and Toxics, Risk Assessment Division, 2003.
14. Beach, S.A., J.L. Newsted, K. Coady, and J.P. Giesy, Ecotoxicological evaluation of Perfluorooctanesulfonate (PFOS). Rev. Environ. Contam. Toxicol., 2006. 186: p. 133.

72
15. Ellis, D.A., J.W. Martin, S.A. Mabury, A.O. De Silva, M.D. Hurley, M.D. Sulbaek Anderson, and T.J. Wallington, Degradation of fluorotelomer alcohols: A likely atmospheric source of Perfluorinated Carboxylic Acids. Environ. Sci. Technol., 2004. 38(12): p. 3316.
16. Lei, Y.D., F. Wania, D. Mathers, and M.S. A., Determination of vapor pressures, octanol-air, and water-air partition coefficients for Polyfluorinated Sulfonamide, Sulfonamidoethanols, and Telomer Alcohols. J. Chem. Eng. Data, 2004. 49(4): p. 1013.
17. Hurley, M.D., T.J. Wallington, M.P. Sulbaek Andersen, D.A. Ellis, J.W. Martin, and S.A. Mabury, Atmospheric Chemistry of fluorinated Alcohols: Reaction with Cl atoms and OH radicals and atmospheric lifetimes. J. Phys. Chem. A, 2004. 108(11): p. 1973.
18. Tomy, G.T., S.A. Tittlemier, V.P. Palace, W.R. Budakowski, E. Braekevelt, L. Brinkworth, and K. Friesen, Biotransformation of n-ethyl perfluorooctane-sulfonamide by Rainbow Trout (oncorhynchus mykiss) liver microsomes. Environ. Sci. Technol., 2004. 38(3): p. 758.
19. Boulanger, B., J. Vargo , J.L. Schnoor, and K. Hornbuckle, Evaluation of Perfluorooctane Surfactants in a Wastewater Treatment System and in a Commercial Surface Protection Product. Environ. Sci. Technol., 2005. 39(15): p. 5524.
20. Rhoads, K.R., E.M.-L. Janssen, R.G. Luthy, and C.S. Criddle, Aerobic biotrans-formation and fate of n-ethyl perfluorooctane sulfonamidoethanol (n-etfose) in activated sludge. Environ. Sci. Technol., 2008. 42(8): p. 2673.
21. D'Eon, J.C., M.D. Hurley, T.J. Wallington, and S.A. Mabury, Atmospheric chemistry of n-methyl Perfluorobutane Sulfonamidoethanol, c4f9so2n(ch3)ch2ch2oh: Kinetics and mechanism of reaction with OH. Environ. Sci. Technol., 2006. 40: p. 1862.
22. Martin, J.W., D.A. Ellis, S.A. Mabury, M.D. Hurley, and T.J. Wallington, Atmospheric chemistry of Perfluoroalkanesulfonamides: Kinetic and Product Studies of the OH radical and Cl atom initiated oxidation of n-ethyl perfluorobutanesulfonamide. Environ. Sci. Technol., 2006. 40(3): p. 864.
23. Prevedouros, K., I.T. Cousins, R.C. Buck, and S.H. Korzeniowski, Sources, fate and transport of Perfluorocarboxylates. Environ. Sci. Technol., 2006. 40(1): p. 32.
24. 3M, The science of Fluorochemistry. 3M Environmental Laborities, 1999. 25. Hekster, F.M., P. De Voogt, A. Pijnenburg, and R.W.P.M. Laane, Perfluoralkylated
substances - aquatic environment assessment, RIKZ, Editor. 2002, RIKZ. 26. 3M, 3m phasing out some of its specialty materials. 3M News, May 16, 2000: p. 2. 27. OECD, ed. Results of the 2006 survey on Production and Use of PFOS, PFAS,
PFOA, PFCA, and their related Substances and Product/Mixtures containing these Substances. Series on risk management, ed. O.f.E.C.a. Development. Vol. 22. 2006.
28. de Voogt, P. and M. Sáez, Analytical chemistry of Perfluoroalkylated Substances. Trends Anal. Chem., 2006. 25: p. 326.
29. 3M (2002) Technical data bulletin: Environmental, health, safety, and regulatory (ehsr) profile of Perfluorobutane Sulfonate (PFBS).
30. Stockholm Comission. Press release: Governments unite to step-up reduction on global ddt reliance and add nine new chemicals under international treaty. 2009;

73
Available from: http://www.unep.org/Documents.Multilingual/Default.asp?DocumentID=585&ArticleID=6158&l=en&t=long. [2009/07/11]
31. Herzke, D., M. Schlabach, E. Mariussen, H. Uggerud, and E. Heimstad, A literature Survey on Selected Chemical Compounds. 2007, Norwegian Pollution Control Authority (sft): Oslo.
32. Schultz, M.M., D.F. Barofsky, and J.A. Field, Fluorinated Alkyl Surfactants. Environ. Eng. Sci., 2003. 20(5): p. 487.
33. Clara, M., C. Scheffknecht, S. Scharf, S. Weiss, and O. Gans, Emissions of Perfluorinated Substances (PFAS) from Point Sources - Identificatin of relevant branches. Water Science and Technology, 2008. 58(1).
34. Boulanger, B., A.M. Peck, J.L. Schnoor, and K.C. Hornbuckle, Mass budget of Perfluorooctane Surfactants in Lake Ontario. Environ. Sci. Technol., 2005. 39(1): p. 74.
35. van Zelm, R., M.A.J. Huiberts, M.H. Russel, T. Jager, and D.v.d. Meent, Modelling the environmental fate of Perfluoroctanoate and its Precursors from global Fluorotelmomer Acrylate Polymer use. Environ. Tox. Chem., 2008. 27(11): p. 2216.
36. Yamashita, N., K. Kannan, S. Taniyasu, Y. Horii, G. Petrick, and T. Gamo, A global Survey of Perfluorinated Acids in Oceans. Marine Poll. Bull., 2005. 51: p. 658.
37. Ahrens, L., J.L. Barber, Z. Xie, and R. Ebinghaus, Longitudal and latitudal distribution of Perfluoroalkyl Compounds in the Surface Water of the Atlantic Ocean. Environmental Science and Technology, 2009.
38. Bossi, R., F.F. Riget, and R. Dietz, Temporal and spatial trends of Perfluorinated Sompounds in Ringed Seal (phoca hispida) from Greenland. Environ. Sci. Technol., 2005. 39(19): p. 7416.
39. Smithwick, M., R.J. Norstrom, S. Mabury, K. Solomon, T.J. Evans, I. Stirling, M.K. Taylor, and D.C.G. Muir, Temporal trends of Perfluoroalkyl Contaminants in Polar Bears (ursus maritimus) from two locations in the North American Arctic, 1972-2002. Environ. Sci. Technol., 2006. 40(4): p. 1139.
40. Ahrens, L., S. Felizeter, and R. Ebinghaus, Spatial distribution of Polyfluoroalkyl Compounds in Seawater of the German Bight. Chemosphere, 2009.
41. Butt, C., S.A. Mabury, D.C. Muir, and B.M. Braune, Prevalence of long-chained Perfluorinated Carboxylates in Seabirds from the Canadian Arctic between 1975 and 2004. Environ. Sci. Technol., 2007. 41: p. 3521.
42. Furdui, V.I., P.A. Helm, P. Croizer, C. Lucaciu, and E.J. Reiner, Temoporal trends of Perfluoroalkyl Compounds with Isomer Analysis in Lake Ontario (1979-2004). Environ. Sci. Technol., 2008. 42: p. 4739.
43. Hart, K., K. Kannan, T. Isobe, S. Takashani, T. Yamada, A. Miyazaki, and S. Tanabe, Time trends and Transplacental Transfer of Perfluorinated Compounds in Melon-headed Whales strandes along the Japanese Coast in 1982, 2001/2002, and 2006. 2008.
44. Ahrens, L., U. Siebert, and R. Ebinghaus, Total Body Burden and Tissue Distribution of Polyfluorinated Pompounds in Harbor Seals (phoca vitulina) from the german bight. Marine Pollution Bulletin, 2008.

74
45. Martin, J.W., D.M. Whittle, D.C.G. Muir, and S.A. Mabury, Perfluoroalkyl Contaminants in a Food Web from Lake Ontario. Environ. Sci. Technol., 2004. 38(20): p. 5379.
46. Kannan, K., S. Corsolini, J. Falandysz, G. Fillmann, K.S. Kumar, B.G. Loganathan, M. Ali Mohd, J. Olivero, N. Van Wouwe, J. Ho Yang, and K.M. Aldous, Perfluorooctanesulfonate and related Fluorochemicals in Human Blood from several Countries. Environ. Sci. Technol., 2004. 38(17): p. 4489.
47. Shoeib, M., T. Harner, M. Ikonomou, and K. Kannan, Indoor and Outdoor Air Concentrations and Phase Partitioning of Perfluoroalkyl Sulfonamides and Polybrominated Diphenyl Ethers. Environ. Sci. Technol., 2004. 38(5): p. 1313.
48. Stock, N.L., F.K. Lau, D.A. Ellis, J.W. Martin, D.C.G. Muir, and S.A. Mabury, Polyfluorinated Telomer Tlcohols and Sulfonamides in the North American troposphere. Environ. Sci. Technol., 2004. 38(4): p. 991.
49. Jahnke, A., L. Ahrens, R. Ebinghaus, and C. Temme, Urban versus Remote Air Concentrations of Fluorotelomer Alcohols and other Polyfluorinated Alkyl Substances in Germany. Environ. Sci. Technol., 2007. 41(3): p. 745.
50. Loos, R., B.M. Gawlick, G. Locoro, E. Rimaviciute, S. Contini, and G. Bidoglio, Eu-wide survey of Polar Organic Persistent Pollutants in European River Waters. Environmental Pollution, 2009. 157: p. 561.
51. Murakami, M., E. Imamura, H. Shinohara, K. Kiri, Y. Muramatsu, A. Harada, and H. Takada, Occurence and Sources of Perfluorinated Surfactants in Rivers in Japan. Environ. Sci. Technol., 2008.
52. Ahrens, L., M. Plassmann, Z. Xie, and R. Ebinghaus, Determination of Polyfluoroalkyl Compounds in Water and Suspended Matter in the River Elbe and North Sea, Germany. Front. Environ. Sci. Engin. China, 2009.
53. Becker, A.M., S. Gerstmann, and H. Frank, Perfluorooctane Surfactants in Waste Waters, the major Source of River Pollution. Chemosphere, 2008. 72: p. 115.
54. Sinclair, E. and K. Kannan, Mass loading and fate of Perfluoroalkyl Surfactants in Wastewater Treatment Plants. Environ. Sci. Technol., 2006. 40: p. 1408.
55. Loganathan, B.G., K.S. Sajwan, E. Sinclair, K.S. Kumar, and K. Kannan, Perfluoroalkyl Sulfonates and Perfluorocarboxylates in two Wastewater Treatment Facilities in Kentucky and Georgia. Water Research, 2007. 41: p. 4611.
56. Bossi, R., J. Strand, O. Sortkjaer, and M.M. Larson, Perfluorinated Compounds in Danish Wastewater Treatment Plants and Aquatic Environments. environ. intern., 2008. 34: p. 443.
57. Seacat, A.M., P.J. Thomford, K.J. Hansen, L.A. Clemen, S.R. Eldridge, C.R. Elcombe, and J.L. Butenhoff, Sub-chronic Dietary Toxicity of Potassium Perfluorooctanesulfonate in Rats. Toxicol., 2003. 183: p. 117.
58. Giesy, J.P. and K. Kannan, Perfluorochemical Surfactants in the Environment. These bioaccumulative Compounds occur globally, warranting further study. Environ. Sci. Technol., 2002. 36(7): p. 146A.
59. Lau, C., J.L. Butenhoff, and J.M. Rogersa, The Developmental Toxicity of Perfluoroalkyl Acids and their Derivatives. Toxicol. Appl. Pharmacol., 2004. 198: p. 231.

75
60. Biegel, L.B., M.E. Hurtt, S.R. Frame, J.C. O'Connor, and J.C. Cook, Mechanisms of Extrahepatic Tumor Induction by Peroxisome Proliferators in Male CD Rats. Toxicol. Sci., 2001. 60: p. 44.
61. USEPA, Perfluoroalkyl sulfonates. Proposed significant new rule. March 11, Fed. Reg. OPPTS-50639C, 2002. 67(47): p. 11014.
62. Moody, C.A., J.W. Martin, W.C. Kwan, D.C.G. Muir, and S.A. Mabury, Monitoring Perfluorinated Surfactants in Biota and Surface Water Samples following an accidental release of Fire-fighting Foam into Etobicoke Creek. Environ. Sci. Technol., 2002. 36(4): p. 545.
63. Martin, J.W., S.A. Mabury, K.R. Solomon, and D.C.G. Muir, Bioconcentration and Tissue Distribution of Perfluorinated Acids in Rainbow Trout (oncorhynchus mykiss). Environ. Toxicol. Chem., 2003. 22(1): p. 196.
64. Martin, J.W., S.A. Mabury, K.R. Solomon, and D.C.G. Muir, Dietary Accumulation of Perfluorinated Acids in Juvenile Rainbow Trout (oncorhynchus mykiss). Environ. Toxicol. Chem., 2003. 22(1): p. 189.
65. Kannan, K., J. Newsted, R.S. Halbrook, and J.P. Giesy, Perfluorooctanesulfonate and related Fluorinated Hydrocarbons in Mink and River Otters from the United States. Environ. Sci. Technol., 2002. 36(12): p. 2566.
66. Dihlmann, P., Entwicklung des Deponierechts aus der sicht des Landes Baden-Würtembergs, in Zeitgemäße Deponietechnik 2007 - Stillegung und Nachnutzung, M. Kranert, Editor. 2007, Institut für Siedlungswasserbau, Wassergüte- und Abfallwirtschaft der Universität Stuttgart: Stuttgart. p. 7.
67. Rettenberger, G., Die Deponie als Bauwerk im Rahmen der TA Abfall, in Bau- und Betriebstechnik bei Abfalldeponien, G. Rettenberger and H. Beitzel, Editors. 1992, Economica Verlag: Bonn.
68. KrW-/AbfG, Kreislaufwirtschafts- und Abfallgesetz vom 27. September 1994 (bgbl. I s. 2705), das zuletzt durch Artikel 5 des Gesetzes vom 22. Dezember 2008 (bgbl. I s. 2986) geändert worden ist. 2008.
69. AbfAblV, Verordnung über die Umweltverträgliche Ablagerung von Siedlungsabfällen (Afallablagerungsverordnung - AbfAblV). 2001.
70. DepV, Verordnung über Deponien und Langzeitlager (Deponieverordnung - DepV). 2002.
71. TA Abfall, Zweite allgemeine verwaltungsvorschrift zum abfallgesetz (ta abfall). 1986.
72. TaSi, Technische Anleitung zur Verwertung, Behandlung und sonstigen Entsorgung von Siedlungsabfällen (Dritte allgemeine Verwaltungsvorschrift zum Abfallgesetz) vom 14. Mai 1993. 1993.
73. WHG, Wasserhaushaltsgesetz in der Fassung der Bekanntmachung vom 19. August 2002 (bgbl. I s. 3245), das zuletzt durch Artikel 8 des Gesetzes vom 22. Dezember 2008 (bgbl. I s. 2986) geändert worden ist. 2008.
74. Görner, K. and K. Hübner, Umweltschutztechnik. 1999, Berlin: Springer. 75. Förstner, U., Umweltschutztechnik. 1995, Berlin: Springer. 76. Born and Ermel, Vortrag: Deponietechnik. o.J.

76
77. Flohr, W., Stillegung und Nachsorge von Deponien. 2008, Saarbrücken: VDM Verlag.
78. Koß, K.-D. and M. Trapp, Entwicklung und Tendenzen der Sickerwasser-behandlung in NRW, in Tagungsband in der Reihe Forum Siedlungswirtschaft und Abfallwirtschaft Universität Essen. 2003, Shaker Verlag: Essen.
79. Slack, R.J., J.R. Gronow, and N. Voulvoulis, Household Hazardous Waste in Municipal Landfills: Contaminants and Leachate. Sci. Total Environ., 2005. 337: p. 119.
80. AbwV, Verordnung über Anforderungen an das Einleiten von Abwasser in Gewässer (Abwasserverordnung). 1997.
81. Hancke, K. and S. Wilhelm, Wasseraufbereitung. Chemie und chemische Verfahrenstechnik. 6. Auflage ed. 2003, Berlin, Heidelberg: Springer-Verlag.
82. LfU BW, Deponiesickerwasser, Behandlungsverfahren und deren Bewertung. Handbuch Wasser, ed. L.f.U. Baden-Württemberg. Vol. 5. 1993, Karlsruhe: Landesanstalt für Umweltschutz Baden-Württemberg.
83. Bever, J., A. Stein, and H. Teichmann, Weitergehende Abwasserreinigung. 4. Edition ed. 2002, München: Oldenbourg Industrieverlag.
84. Gottschalk, C., J.A. Libra, and A. Saupe, Ozonization of Water and Waste Water - a practical guide to understanding Ozone and its Application. 2002, Weinheimm New York, Chichester, Brisbane, Singapore, Toronto: Wiley-VCH.
85. Gulyas, H., Organische Problemstoffe in Abwässern: Wirkungen und Behandlungs-verfahren. Hamburger berichte zur Siedlungswasserwirtschaft, ed. R. Otterpohl. 2003, Hamburg: GFEU e.V.
86. 3M, Environmental Monitoring - multi-city-study Water, Sluge, Sediment, POTW Effluent and Landfill Leachate Samples. 3M Environmental Laboratory, 2001.
87. Woldegiorgis, A., J. Anderson, and M. Remberger, Results from the National Swedish Screening Programme. 2008, IVL Swedish Environmental Research Institute: Stockholm.
88. Kallenborn, R., U. Berger, and U. Järnberg, Perfluorinated Alkylated Substanzes (PFAS) in the Nordic Environment. TEMA Nord, 2004: p. 1.
89. GMT. GMT - Generic Mapping Tool. 2009; Available from: http://www.aquarius.geomar.de/omc/de/.
90. Skutlarek, D., M. Exner, and H. Färber, Perfluorierte Tenside (PFT) in der aquatischen Umwelt und im Trinkwasser. Fortschritte in Umweltchemie und Ökotoxikologie, 2006. 18(3): p. 151.
91. Becker, A.M., S. Gerstmann, and H. Frank, Perfluorooctanioic Acid and Perfluorooctane Sulfonate in the Sediment of the Roter Main River, Bayreuth, Germany. Environmental Pollution, 2008. 156: p. 818.
92. Murakami, M., H. Shinohara, and H. Takada, Evalutaion of Wastewater and Street Runoff as Sources of Perfluorinated Surfactants (PFCs). Chemosphere, 2009. 74: p. 487.
93. Möller, A., Analysis of Poly- and Perfluorinated Compounds (PFCs) in Surface Waters of the River Rhine using HPLC-MS/MS, in Fachbereich Angewandte Naturwissenschaften. 2009, Universitiy of Applied Sciences Lübeck: Lübeck.

77
94. Destatis, Müllablagerung auf Deponien stark rückläufig. 2008, Statistisches Bundesamt Deutschland.
95. BMU, Verwertung mineralischer Abfälle auf Deponien, Umweltbundesamt, Editor. 2006.
96. BMU. Internetseite. 2008 [2009.06.10]; Available from: http://www.bmu.de/gewaesserschutz/fb/abwasser_klaeranlage/doc/2833.php.
97. Fricke, M. and U. Lahl, Risikobewertung von Perfluortensiden als Beitrag zur aktuellen Diskussion zum Reach-Dossier der EU-Kommission. Z Umweltchem Ökotox, 2005. 17(1): p. 36.
98. TWK, Ergebnisprotokoll 2. Sitzung 2008, Trinkwasserkomission (TWK) des Bundesministeriums für Gesundheit beim Umweltbundesamt. 2008: Berlin.
99. LANUV NRW, Messdaten PFT in Deponiesickerwasser, personal communication, Editor. 2009, Landesamt für Natur, Umwelt und Verbraucherschutz NRW: Recklinghausen.
100. Möller, A., L. Ahrens, R. Sturm, and R. Ebinghaus, Poly- and Perfluorinated Compounds (PFCs) in Surface Water along the River Rhine, in SETAC 2009. 2009: Gothenburg.

78

79
Appendixes
Appendix I: Analytes, Acronymes, formula, supplier, purity, precursor and product ion
and corresponding IS.
Substance Acronym Formula Supplier and purity ( %)
Precursor/ Product ion
Corresponding IS
Perfluorobutane sulfonate PFBS C4F9SO2O- Fluka (97) 298.877/79.8 [18O2]-PFHxS Perfluoropentane sulfonate PFPS C5F11SO2O- n.a. 348.939/79.8 [18O2]-PFHxS Perfluorohexane sulfonate PFHxS C6F13SO2O- Fluka (98) 398.939/79.8 [18O2]-PFHxS Perfluorheptane sulfonate PFHpS C7F15SO2O- Well. Lab.
(>98) 449.034/79.3 [13C4]-PFOS
Perfluororcotane sulfonate PFOS C8F17SO2O- Well. Lab. (>98)
498.971/97.7 [13C4]-PFOS
Perfluorononane sulfonate PFNS C9F19SO2O- n.a. 548.926/79.8 [13C4]-PFOS Perfluorodecane sulfonate PFDS C10F21SO2O- Well. Lab.
(>98) 598.896/79.5 [13C4]-PFOS
6:2 fluorotemomer sulfonate
6:2 FTS C6F13C2H4SO3 ABCR (98) 426.925/406.7 [13C4]-PFOS
Perfluoro-1-hexane sulfinate
PFHxSI C6F13SO2- Well. Lab. (>98)
382.865/319.0 [13C4]-PFOSI
Perfluoro-1- octane sulfinate
PFOSI C8F15SO2- Well. Lab. (>98)
482.824/418.9 [13C4]-PFOSI
Perfluoro-1-decane sulfinate
PFDSI C9F17SO2- Well. Lab. (>98)
582.824/518.9 [13C4]-PFOSI
Perfluorobutanoic acid PFBA C3F7COOH ABCR (98) 112.900/168.7 [13C4]-PFOSI Perfluoropentanoic acid PFPeA C4F9COOH Alfa Aesar (98) 262.825/218.9 [13C4]-PFBA Perfluorohexanoic acis PFHxA C5F11COOH Fluka (97) 312.934/268.8 [13C2]-PFHxA Perfluoroheptanoic acid PFHpA C6F13COOH Lanc. Syn. (98) 362.950/318.9 [13C2]-PFHxA Perfluorooctanoic acid PFOA C7F14COOH Lanc. Syn. (95) 412.987/368.9 [13C4]-PFOA Perfluorononaoic acid PFNA C8F15COOH Lanc. Syn. (97) 462.908/418.9 [13C4]-PFOA Perfluorodecanoic acid PFDA C9F17COOH Lanc. Syn. (97) 512.876/469.0 [13C5]-PFNA Perfluoroundecanoic acid PFUnDA C10F19COOH ABCR (96) 562.865/519.0 [13C2]-PFDA Perfluorododecanoic acid PFDoDA C11F21COOH Alfa Aesar (96) 612.991/568.9 [13C2]-PFUnDA Perfluorortridecanoic acid PFTriDA C12F23COOH Well. Lab.
(>98) 663.094/618.9 [13C2]PFDoDA
Perfluorotetradecanoic acid PFTeDA C13F25COOH Alfa Aesar (96) 713.036/669.0 [13C2]-PFDoDA Perfluorotridecanoic acid PFPDA C14F27COOH n.a. 762.980/718.9 [13C2]-PFDoDA Perfluorohexadecanoic acid
PFHxDA C15F29COOH Alfa Aesar (96) 812.840/769.1 [13C2]-PFDoDA
Perfluoroheptadecanoic acid
PFHpDA C16F31COOH n.a 862.980/818.9 [13C2]-PFDoDA
Perfluorooctadecanoic acid PFOcDA C17F33COOH Alfa Aesar (96) 912.870/869.0 [13C2]-PFDoDA Perfluoro-3,7-bis(trifluoromethyl)-octanoic acid
3,7m2-PFOA
C6F19COOH Alfa Aesar (97) 512.885/468.9 [13C4]-PFOA
Perfluorohexlyphosphonic acid
PFHxA C6F13PO(OH)2 Well. Lab. (>98)
399.000/78.8 [13C4]-PFOS
Perfluorooctylphosphonic acid
PFOPA C8F17PO(OH)2 Well. Lab. (>98)
499.000/78.8 [13C4]-PFOS
Perfluorodecylphosphonic acid
PFDPA C10F21PO(OH)2 Well. Lab. (>98)
599.100/78.8 [13C4]-PFOS
Perfluorooctane sulfonamid
PFOSA C8F17SO2NH2 ABCR (97) 497.896/77.9 [13C4]-PFOS

80
Substance Acronym Formula Supplier and purity ( %)
Precursor/ Product ion
Corresponding IS
N-methylperfluorooctane-sulfonamide
N-MeFOSA C8F17SO2NH(CH3 3M (n.a.) 511.849/168.9 D3-N-MeFOSA
N-methylperfluorooctane sulphonamide
N-EtFOSA C8F17SO2NH(C2H5) ABCR (95) 526.008/169.0 D5-N-EtFOSA
N-methylperfluorooctane-sulfonamidoethanol
N-MeFOSE C8F17SO2N(CH3)C2H4OH
3M (n.a.) 616.004/58.9 D7-N-MeFOSE
N-ethylperfluoroctane sulfonamidedoethanol
N-EtFOSE C8F17SO2N(C2H5)C2H4OH
3M (n.a.) 630.109/58.8 D9-N-EtFOSE
N-methylperfluorobutane sulfonamide
MeFBSA C4F9SO2NH(CH3) 3M (n.a.) 311.914/218.8 D3-N-MeFOSA
N-methylperfluorobutane sulfonamidoethanol
MEFBSE C4F9SO2N(CH3)C2H4OH 3M (n.a.) 416.047/59.0 D7-N-MeFOSE
2-perfluorohexylethanoic acid
FHEA C6F13CH2COOF Well. Lab. (>98)
376.945/292.8 [13C]-CFHEA
2-perfluorooctylethanoic acid
FOEA C8F17CH2COOH Well. Lab. (>98)
476.909/392.9 [13C]-FOEA
2-perfluorodecylethanoic acid
FDEA C10F21CH2COOH Well. Lab. (>98)
577.011/493.0 [13C]-FDEA
2H-perfluoro-2-octenoic acid
FHUEA C6F12CHCOOH Well. Lab. (>98)
356.885/293.0 [13C]-FHUEA
2H-perfluoro-2-decenoic acid
FOUEA C8F16CHCOOH Well. Lab. (>98)
456.803/292.8 [13C]-FOUEA
2H-perfluoro-2-dodecenoic acid
FDUEA C10F20CHCOOH Well. Lab. (>98 556.973/493.1 [13C)-FDUEA

81
Appendix II: Internal Standards, Acronymes, formula, supplier, purity, precursor
and product ion.
Internal Standard Acronym Formula Supplier and purity ( %)
Precursor/ Product ion
Perfluoro-1-hexane[18O2]sulfonate
[18O2]-PFHxS C6F13S[18O2]O- Well. Lab. (>98)
402.981/83.9
Perfluoro-1-[1,2,3,4-13C4]octanesulfonate
[13C4]-PFOS C4F9[1,2,3,4-13C4]-F8SO2O- Well. Lab. (>98)
502.899/79.5
Perfluoro-1-[1,2,3,4-13C]perfluoro-octanesulfinate
[13C4]-PFOSi C4F9[1,2,3,4-13C4]-F8SO2- Well. Lab. (>98)
486.859/422.9
Perfluoro-n-[1,2,3,4-13C4]butanoic acid
[13C4]-PFBA 2,3,4-13C3]F713COOH Well. Lab. (>98)
216.823/171.8
Perfluoro-n-[1,2-13C2]hexanoic acid
[13C2]-PFHxA C4F9[2-13C]F213COOH Well. Lab. (>98)
314.891/269.9
Perfluoro-n-[1,2,3,4-13C4]octanoic acid
[13C4]-PFOA C4F9[2,3,4-13C3]F613COOH Well. Lab. (>98)
416.978/371.8
Perfluoro-n-[1,2,3,4,5-13C5]nonanoic acid
[13C5]-PFNA C4F9[2,3,4,5-13C5]F813COOH Well. Lab. (>98)
467.907/423.0
Perfluoro-n-[1,2-13C2]decanoic acid
[13C2]-PFDA C8F1713CF213COOH Well. Lab. (>98)
514.944/469.8
Perfluoro-n-[1,2-13C2]undecanoic acid
[13C2]-PFUnDA C9F1913CF213COOH Well. Lab. (>98)
564.959/519.8
Perfluoro-n-[1,2-13C]dodecanoin acid
[13C2]-PFDoDA C10F21CF213COOH Well. Lab. (>98)
614.913/569.9
N-methyl-d3-perfluoro-1-octanesulfonamide
D3-N-MeFOSA C9D3HF17NO2S Well. Lab. (>98)
514.920/168.8
N-ethyl-d5-perfluoro-1-octanesulfonamide
D5-N-EtFOSA C10D5HF17NO2S Well. Lab. (>98)
530.984/168.8
2-(n-deuteriomethylperfluoro-1-octanesulfonamido)-1,1,2,2-tetradeuterioethanol
D7-N-MeFOSE C8F17SO2N(CD3)C2D4OH Well. Lab. (>98)
623.058/58.9
2-(n-deuterioethylperfluoro-1-octanesulfonamido)-1,1,2,2-tetradeuterioethanol
D9-N-EtFOSE C8F17SO2(C2D5)C2D4OH Well. Lab. (>98)
639.054/58.9
2-perfluorohexyl-[1,2-13C2]ethanoic acid
[13C2]-FHEA C6F13CH213COOH Well. Lab. (>98)
378.912/294.0
2-perfluorooctyl-[1,2-13C2]ethanoic acid
[13C2]-FHOEA C8F1713CH213COOH Well. Lab. (>98)
478.911/393.8
2-perfluorodecyl-[1,2-13C2]-FDEA
[13C2]-FDEA C10F2113CH213COOH Well. Lab. (>98)
579.017/494.1
2H-perfluoro-[1,2-13C2]- 2-octenoic acid
[13C2]-FHUEA C6F12 13CH13COOH Well. Lab. (>98)
358.907/294.0
2H-perfluoro-[1,2-13C2]-2-decenoic acid
[13C2]-FOUEA C8F1613CH13COOH Well. Lab. (>98)
458.903/393.8
2H-perfluoro-[1,2-13C2]-2-dodecanoic acid
[13C2]-FDUEA C10F2013CH13COOH Well. Lab. (>98)
558.955/494.0
N-deuterioethylperfluoro-1-octanesulfonamidoacetic acid
D5-EtFOSAA C8F17SO2N(C2D2C2D3)C2H2CO2H Well. Lab. (>98)
589.015/418.7

82
Appendix III: Concentrations of each Compound in treated leachate.
2 3 4 5 6 7 8 9 10 12 PFBS 827,82 12,46 1056,78 1355,62 244,43 0,47 0,86 0,41 251,58 305,76 PFPS n.d. 0,50 76,41 61,07 54,73 n.d. n.d. n.d. 7,34 12,99 PFHxS 36,43 0,44 177,50 82,41 84,78 n.d. n.d. 0.07 12,35 43,34 PFHpS 1,90 n.d. 7,62 7,81 5,00 n.d. n.d. n.d. n.d. 1,00 PFOS 45,01 0,66 192,06 234,99 88,55 0,29 0,29 0,01 7,99 27,69 PFNS 24,94 n.d. n.d. 1,67 n.d. n.d. n.d. n.d. 8,23 n.d. 6:2 FTS 74,76 n.d. 56,19 82,08 17,44 n.d. n.d. n.d. 20,96 9,40 PFHxSi 8,05 n.d. 0,51 1,80 0,59 n.d. n.d. n.d. 0,46 0,11 PFOSi 12,63 n.d. 0,46 9,33 n.d. 0,03 n.d. n.d. 2,38 n.d. PFDSi n.d. n.d. n.d. n.d. n.d. n.d. n.d. n.d. n.d. n.d. PFBA 990,12 6,88 1302,77 1720,23 558,78 173,84 3,59 1.64 n.d. 392,32 PFPA 123,81 n.d. 201,84 828,74 154,54 2,06 n.d. 0,77 14,73 94,04 PFHxA 935,00 1,28 154,31 2508,66 334,30 0,83 n.d. n.d. 185,45 198,39 PFHpA 201,03 n.d. 253,83 280,29 147,14 0,14 0,08 n.d. 32,20 39,40 PFOA 708,05 1,16 925,59 720,50 284,60 1,19 1,37 0,68 76,24 119,95 PFNA 13,14 n.d. 80,06 45,05 6,33 n.d. n.d. n.d. n.d. 1,26 PFDA 6,59 n.d. 51,33 55,09 1,93 0,30 0,11 0,07 n.d. 1,61 PFUnDA 0,58 n.d. 2,82 2,98 0,36 n.d. 0,06 0,08 n.d. 0,21 PFDoDA 1,05 n.d. 1,29 2,45 0,63 n.d. 0,20 0,21 n.d. 0,51 PFTriDA n.d. n.d. 0,34 0,62 n.d. n.d. n.d. n.d. n.d. n.d. PFTeDA n.d. n.d. n.d. 0,39 n.d. 0,41 n.d. n.d. n.d. n.d. PFPeDA n.d. n.d. 0,10 0,42 n.d. n.d. n.d. n.d. n.d. n.d. PFHxDA 1,51 n.d. n.d. 1,91 n.d. n.d. n.d. n.d. n.d. 0,60 PFHpDA n.d. n.d. n.d. 1,04 n.d. n.d. n.d. n.d. n.d. n.d. PFOcDA 2,92 n.d. n.d. 2,96 2,56 n.d. n.d. n.d. n.d. 0,90 Me2PFOA n.d. n.d. n.d. 27,06 n.d. n.d. n.d. n.d. n.d. n.d. PFOSA 5,22 0,35 8,22 13,99 5,82 0,62 2,70 0,78 1,86 1,18 NMeFOSA n.d. n.d. n.d. 1,04 n.d. n.d. n.d. n.d. n.d. n.d. NMeFOSE n.d. n.d. n.d. n.d. n.d. n.d. n.d. n.d. n.d. n.d. MeFBSA n.d. n.d. n.d. 9,72 n.d. n.d. n.d. n.d. n.d. n.d. MeFBSE n.d. n.d. n.d. n.d. n.d. n.d. n.d. n.d. n.d. n.d. FHEA (6:2 FTCA) n.d. n.d. n.d. n.d. n.d. n.d. n.d. n.d. n.d. 6,57 FHUEA (6:2 FTUCA) 2,56 n.d. 1,66 n.d. n.d. n.d. n.d. n.d. n.d. n.d. FOUEA (8:2 FTUCA) n.d. n.d. n.d. n.d. n.d. n.d. n.d. n.d. n.d. n.d. PFHxPA n.d. n.d. 39,72 n.d. n.d. n.d. n.d. n.d. n.d. n.d. PFOPA n.d. n.d. 19,47 n.d. n.d. n.d. n.d. n.d. n.d. n.d. PFDPA n.d. n.d. n.d. n.d. n.d. 9,93 n.d. n.d. n.d. n.d. summation 4023 23,7 4611 8060 1993 190 9,26 3,97 622 1257 leachate in m³/year 46000 26280 7000 8000 175200 28700 9000 8000 200 55000

83
Appendix III: Continuation.
13 14 15 16 17 18 19 20 21 22 PFBS 8,83 75,00 2,53 0,86 2,26 135,76 99,89 n.d. 15,30 4,10 PFPS n.d. 0,33 n.d. n.d. 0,62 0,37 0,08 n.d. 0,96 n.d. PFHxS 0,25 0,03 n.d. 0,03 1,08 0,03 0,87 n.d. 3,46 0,43 PFHpS n.d. n.d. n.d. n.d. n.d. n.d. n.d. n.d. n.d. n.d. PFOS 0,22 0,27 1,07 0,76 2,54 1,60 2,52 0,49 8,23 2,78 PFNS n.d. n.d. n.d. n.d. n.d. n.d. n.d. n.d. n.d. n.d. 6:2 FTS n.d. n.d. n.d. n.d. n.d. n.d. n.d. n.d. n.d. n.d. PFHxSi n.d. n.d. n.d. n.d. n.d. n.d. n.d. n.d. n.d. n.d. PFOSi 0,26 0,01 0,16 0,70 0,10 2,65 0,20 n.d. 0,59 0,66 PFDSi n.d. n.d. 0,04 n.d. n.d. n.d. n.d. n.d. n.d. n.d. PFBA n.d. 2967,82 4,86 1,12 6,50 945,10 8,50 22,99 52,97 1,04 PFPA n.d. 688,71 0,57 0,62 0,63 331,53 3,12 n.d. 18,36 0,66 PFHxA 1,43 327,33 2,75 0,56 1,23 11,08 2,66 n.d. 19,07 n.d. PFHpA 0,22 9,31 1,45 0,35 0,32 1,30 1,67 n.d. 5,57 n.d. PFOA 2,96 1,88 5,17 1,18 4,80 2,99 8,55 n.d. 22,68 14,55 PFNA n.d. n.d. n.d. n.d. n.d. n.d. n.d. n.d. n.d. n.d. PFDA 0,26 0,13 n.d. 0,27 0,22 n.d. 0,63 n.d. 0,46 0,65 PFUnDA n.d. 0,06 n.d. 0,06 n.d. n.d. n.d. n.d. n.d. n.d. PFDoDA n.d. 0,01 n.d. n.d. n.d. n.d. n.d. n.d. n.d. n.d. PFTriDA n.d. n.d. n.d. n.d. n.d. n.d. n.d. n.d. n.d. n.d. PFTeDA n.d. 0,27 n.d. 0,02 n.d. n.d. n.d. n.d. n.d. n.d. PFPeDA n.d. n.d. n.d. n.d. n.d. n.d. n.d. n.d. n.d. n.d. PFHxDA n.d. 0,48 n.d. 0,09 n.d. n.d. n.d. n.d. n.d. n.d. PFHpDA n.d. n.d. n.d. n.d. n.d. n.d. n.d. n.d. n.d. n.d. PFOcDA n.d. 0,54 n.d. 0,02 n.d. n.d. n.d. n.d. n.d. n.d. Me2PFOA n.d. n.d. n.d. n.d. n.d. n.d. n.d. n.d. 0,04 n.d. PFOSA 0,83 0,24 n.d. 1,52 0,16 9,87 n.d. n.d. 0,90 1,09 NMeFOSA n.d. n.d. n.d. n.d. n.d. n.d. n.d. n.d. n.d. n.d. NMeFOSE n.d. 0,04 n.d. 0,02 n.d. n.d. n.d. n.d. n.d. n.d. MeFBSA n.d. n.d. n.d. n.d. n.d. n.d. n.d. n.d. n.d. n.d. MeFBSE n.d. 0,08 n.d. n.d. n.d. n.d. n.d. n.d. n.d. n.d. FHEA (6:2 FTCA) n.d. 0,60 n.d. 1,19 n.d. n.d. n.d. n.d. n.d. n.d. FHUEA (6:2 FTUCA) n.d. 0,09 n.d. 0,11 n.d. n.d. n.d. n.d. n.d. 0,16 FOUEA (8:2 FTUCA) n.d. n.d. n.d. 0,06 n.d. n.d. n.d. n.d. n.d. n.d. PFHxPA n.d. 6,03 n.d. n.d. n.d. n.d. n.d. n.d. n.d. n.d. PFOPA n.d. n.d. n.d. 0,46 n.d. n.d. n.d. n.d. n.d. n.d. PFDPA n.d. n.d. n.d. 0,82 n.d. n.d. n.d. n.d. n.d. n.d. summation 15,25 4079,24 18,60 10,83 20,47 1442,27 128,70 23,48 148,58 26,13 leachate in m³/year 10000 20000 8000 16500 19500 131400 27500 26500 29000 41100

84
Appendix IV: Concentrations of each compound in untreated leachate in ng/L.
1 6 8 11 14 17 PFBS 3657,14 247,00 0,41 37,04 3081,49 1572,85PFPS 0 35,80 n.d. 19,95 63,58 175,35 PFHxS 123,71 66,26 n.d. 59,81 348,68 244,11 PFHpS n.d. 10,02 n.d. n.d. 35,49 18,95 PFOS 98,38 47,91 n.d. 63,81 473,06 298,63 PFNS n.d. n.d. n.d. 2,16 n.d. n.d. TH-PFOS n.d. n.d. n.d. n.d. 1343,48 n.d. PFOSi 184,14 n.d. n.d. n.d. 96,66 n.d. PFBA 2787,61 695,49 28,25 2276,91 2058,33 1673,78PFPA 339,48 214,21 1,33 95,96 608,82 940,62 PFHxA 1407,37 311,62 n.d. 283,64 1829,27 1565,47PFHpA 230,84 92,21 n.d. 117,75 433,80 591,32 PFOA 512,12 162,43 0,55 273,37 2269,41 1280,28PFNA 35,40 n.d. n.d. n.d. 39,65 4,00 PFDA 56,24 n.d. n.d. n.d. 42,66 3,34 PFUnDA 2,30 n.d. n.d. n.d. 6,06 n.d. PFDoDA n.d. n.d. n.d. n.d. 3,27 n.d. PFOSA 29,52 5,96 n.d. 4,84 36,00 1,75 NMeFOSE 44,44 n.d. n.d. n.d. 56,15 n.d. NEtFOSE 87,79 n.d. n.d. n.d. 96,11 n.d. MeFBSE 82,44 n.d. n.d. 62,40 n.d. n.d. FHEA (6:2 FTCA) 86,32 n.d. n.d. 23,36 n.d. n.d. FOEA (8:2 FTCA) 117,80 n.d. n.d. n.d. n.d. n.d. FHUEA (6:2 FTUCA) 64,47 n.d. n.d. n.d. n.d. n.d. FDUEA (10:2 FTUCA) 33,64 n.d. n.d. n.d. n.d. n.d. Summation 9948,50 1894,90 38,53 3332,00 12935,96 8387,45

85
Appendix V: Detailed results of four samples from the 3rd activated carbon treatment
container and from two samples from the outflow of the lagoon of site 9. All
concentrations are in ng/L. Not shown compounds were not detected.
AC3-1 AC3-2 AC3-3 AC3-4 Lagoon-1 Lagoon-2 PFBS PFHxS PFOS PFBA PFPA PFHpA PFOA PFNA PFDA PFUnDA PFDoDA PFHxDA FOSA
0.48 n.d. n.d. n.d. n.d. n.d. n.d. 0.36 n.d. 0.18 0.43 n.d. 0.23
0.43 n.d. 0.02 1.94 2.32 n.d. 0.74 n.d. 0.20 n.d. n.d. n.d. 0.67
n.d. n.d. n.d. 3.91 n.d. n.d. 1.96 n.d. n.d. n.d. n.d. n.d. 1.69
0.72 0.14 n.d. n.d. n.d. n.d. n.d. n.d. n.d. 0.15 0.40 n.d. 0.54
n.d. n.d. n.d. 3.91 n.d. n.d. 1.96 n.d. n.d. n.d. n.d. n.d. 1.69
0.88 0.18 n.d. n.d. n.d. n.d. n.d. n.d. n.d. 0.17 0.44 0.72 4.89
Appendix VI: Detailed results of samples from three activated carbon containers
from site 18. All concentrations are in ng/L. Not shown compounds were not
detected.
Ac-1 Ac-2 Ac-3 PFBS PFPS PFHxS PFOS PFHxSi PFOSI PFBA PFPA PFHxA PFHpA PFOA PFNA PFOSA
2126 3.85 16.9 9.70 0.78 n.d. 831 412 678 91.3 210 3.94 n.d.
2108 4.37 5.70 2.75 0.56 2.09 819 324 515 56.27 62.34 n.d. 7.03
136 0.37 0.03 1.60 n.d. 2.65 945 332 11.1 1.30 2.99 n.d. 9.87