Miami-Dade County Lean Six Sigma (LSS) County Lean Six Sigma (LSS) ... Demonstrated by several Green...
47
Miami-Dade County Lean Six Sigma (LSS) Yellow Belt Training
Transcript of Miami-Dade County Lean Six Sigma (LSS) County Lean Six Sigma (LSS) ... Demonstrated by several Green...
Miami-Dade County
Lean Six Sigma (LSS)
Yellow Belt Training
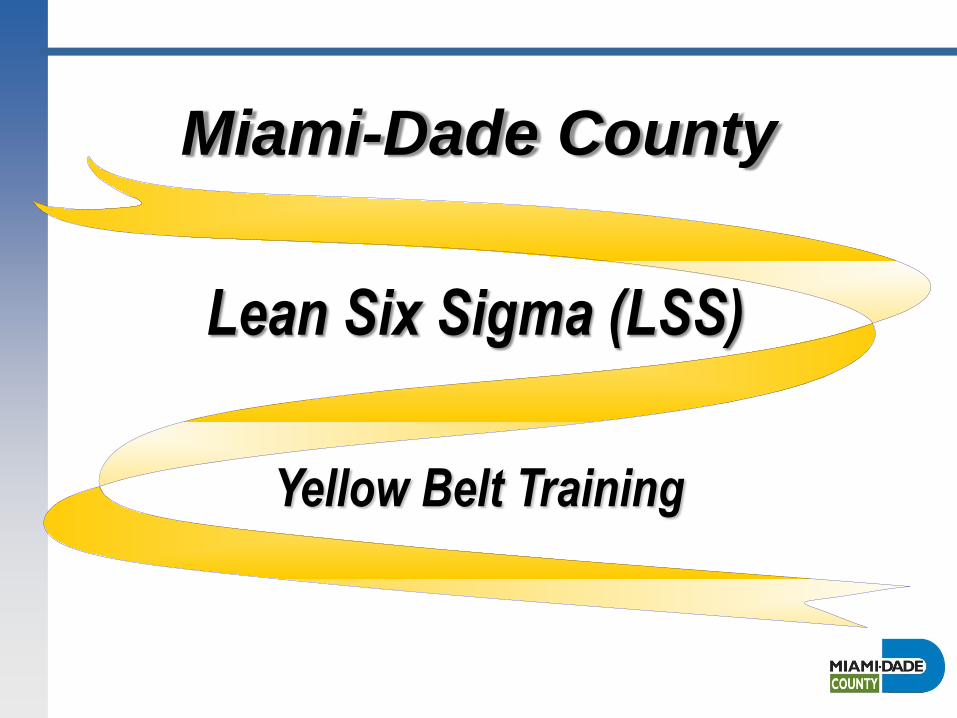
9:00 am - Introductions/ Kick-off / Training Objectives - Yellow Belt and Lean Six Sigma Overview - DMAIC Problem Solving Process - Tools: Line graphs and spreadsheet 10:15 Break 10:30 - Technique: Flowchart - Tool: Histogram - Tool: Pareto (exercises) Noon Lunch 1:15 pm - Tools: Single Case Bore and Fishbone - Technique: Brainstorming - Technique: Countermeasures (exercise) 2:30 pm Break 2:45 pm - Case Study (Green Belt Team) - Lessons Learned/Certificates/Survey 4 pm - Adjourn
Yellow Belt Training Agenda
2
3. To understand key Lean Six Sigma (LSS)
analytical tools and techniques used in
performance improvement
Yellow Belt Training Objectives
2. To understand how Lean Six Sigma (LSS) will be
used to facilitate operational improvements.
4. To review a Green Belt Improvement Team’s
project addressing a significant problem
1. To understand Lean Six Sigma (LSS) principles,
components and “Belt” expertise levels for staff.
3
Mission and Vision Statements
Miami-Dade County Mission Statement
Delivering excellent public services that address
our communities needs and enhance our quality
of life
Your Departmental Mission and
Vision Statements……
Miami-Dade County Vision Statement
Delivering Excellence Every Day
4
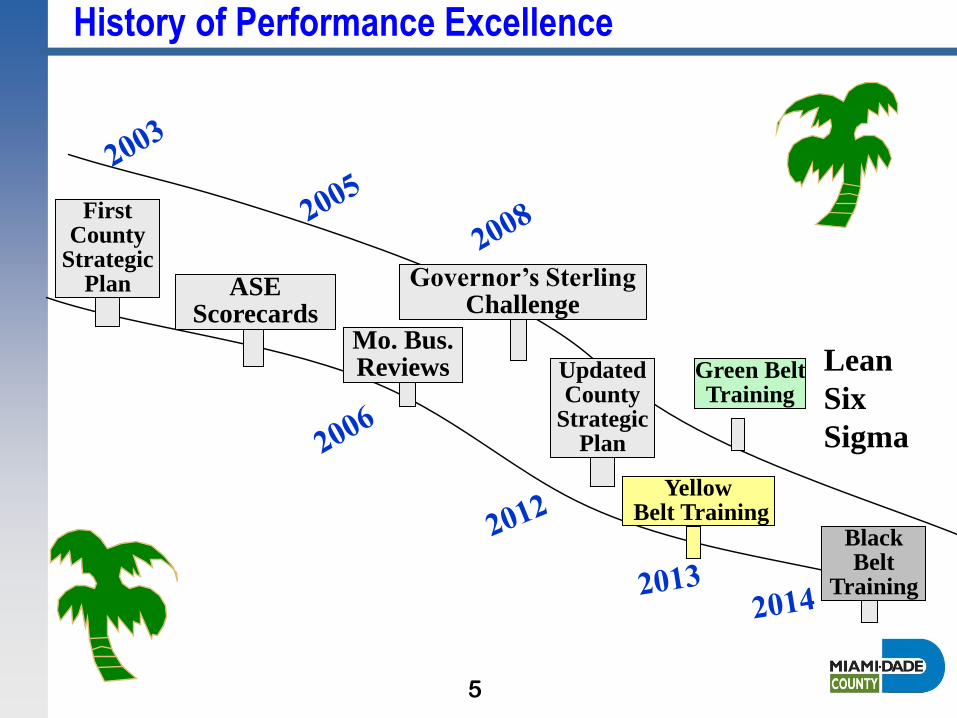
First County
Strategic Plan
Green Belt Training
Yellow Belt Training
Black Belt
Training
History of Performance Excellence
Lean
Six
Sigma
Mo. Bus. Reviews
Governor’s Sterling Challenge
ASE Scorecards
Updated County
Strategic Plan
5
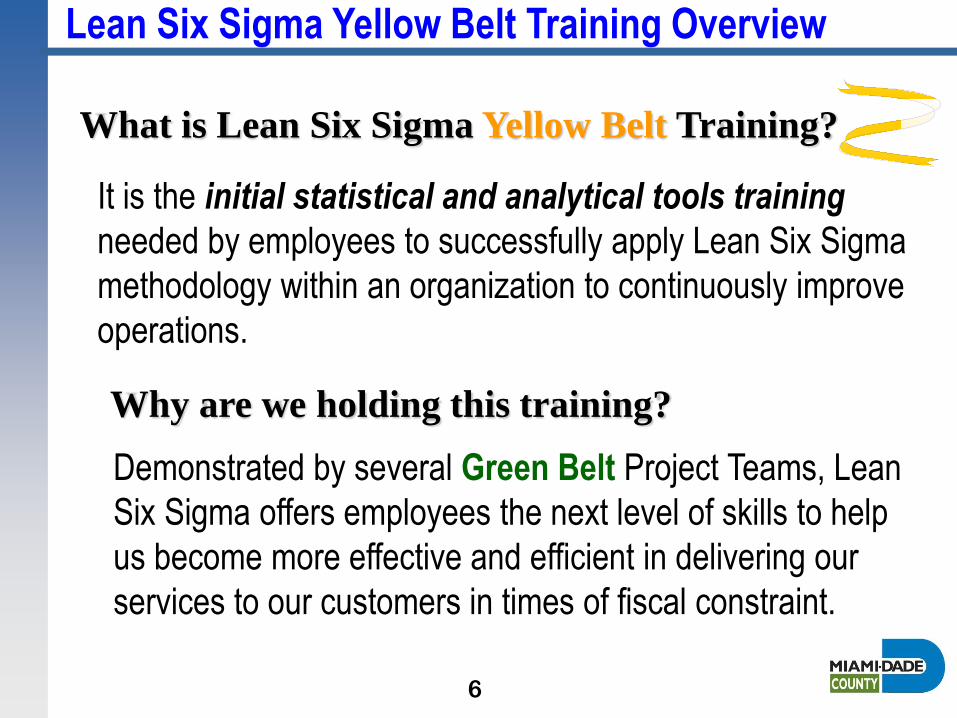
What is Lean Six Sigma Yellow Belt Training?
It is the initial statistical and analytical tools training
needed by employees to successfully apply Lean Six Sigma
methodology within an organization to continuously improve
operations.
Why are we holding this training?
Demonstrated by several Green Belt Project Teams, Lean
Six Sigma offers employees the next level of skills to help
us become more effective and efficient in delivering our
services to our customers in times of fiscal constraint.
Lean Six Sigma Yellow Belt Training Overview
6
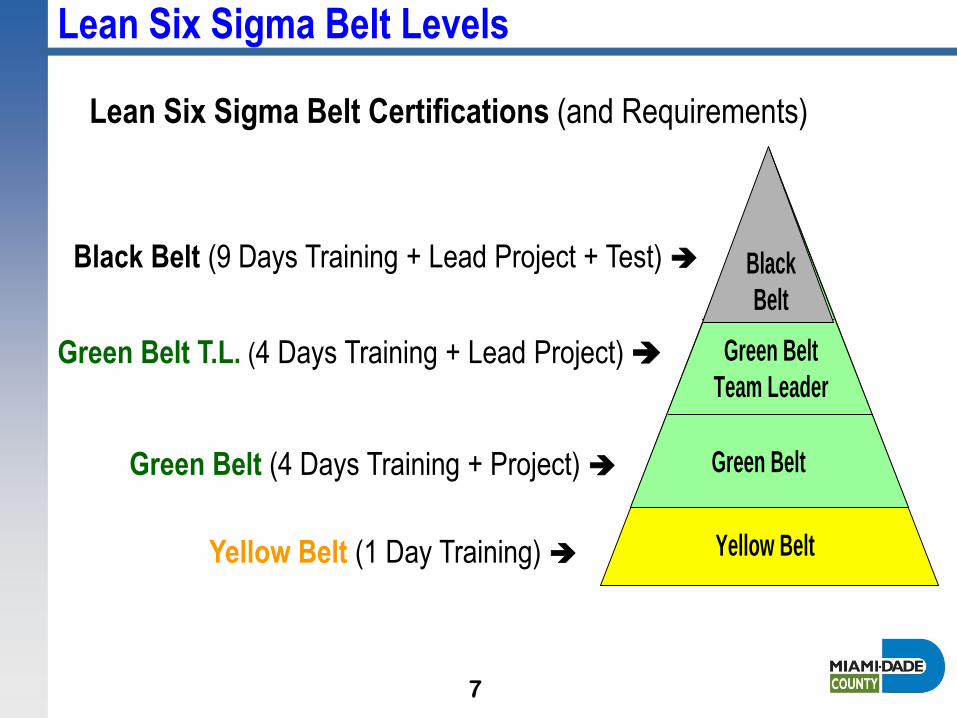
Lean Six Sigma Belt Levels
Lean Six Sigma Belt Certifications (and Requirements)
Yellow Belt (1 Day Training)
Green Belt (4 Days Training + Project)
Green Belt T.L. (4 Days Training + Lead Project)
Black Belt (9 Days Training + Lead Project + Test)
Yellow Belt
Green Belt
Black
Belt
Green Belt
Team Leader
7
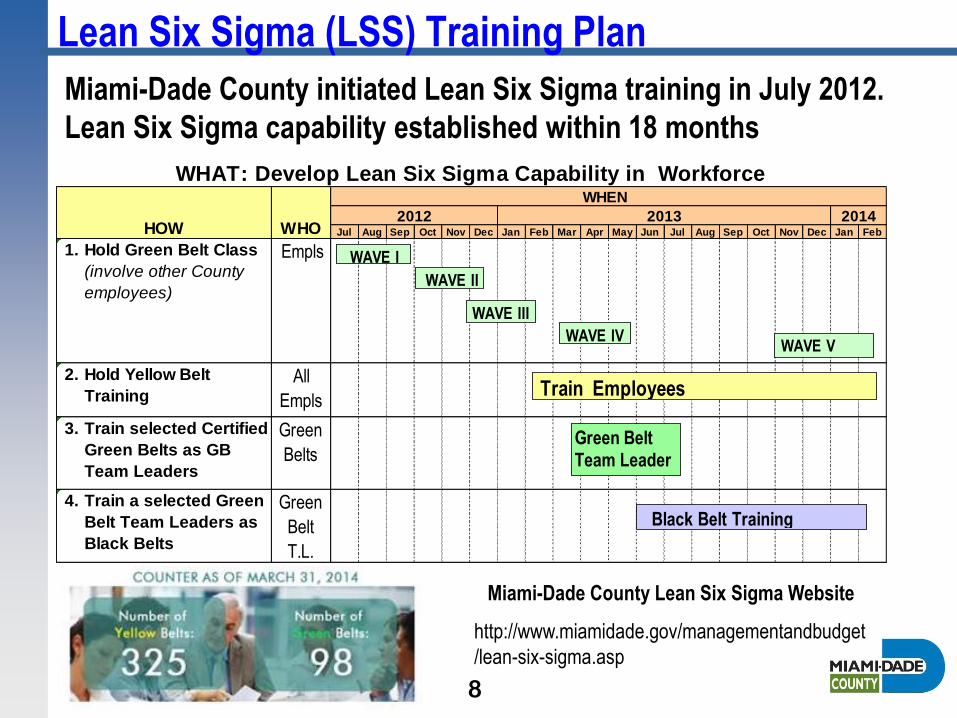
Lean Six Sigma (LSS) Training Plan
Miami-Dade County initiated Lean Six Sigma training in July 2012.
Lean Six Sigma capability established within 18 months
Jul Aug Sep Oct Nov Dec Jan Feb Mar Apr May Jun Jul Aug Sep Oct Nov Dec Jan Feb
1. Hold Green Belt Class
(involve other County
employees)
Empls
2. Hold Yellow Belt
TrainingAll
Empls
3. Train selected Certified
Green Belts as GB
Team Leaders
Green
Belts
4. Train a selected Green
Belt Team Leaders as
Black Belts
Green
Belt
T.L.
2014
WHEN
WHAT: Develop Lean Six Sigma Capability in Workforce
HOW WHO2012 2013
WAVE I
WAVE II
WAVE III
Green Belt Team Leader
Train Employees
Black Belt Training
WAVE IV WAVE V
8
Miami-Dade County Lean Six Sigma Website
http://www.miamidade.gov/managementandbudget
/lean-six-sigma.asp
Lean Six Sigma is a proven methodology that will
help us improve our work in order to consistently
ensure…
Our products and services meet (or exceed) customers’ needs
Our processes are cost-effective
Employees are well-trained and motivated
Government regulations are met
Why do we need Lean Six Sigma?
Lean Six Sigma Overview
9
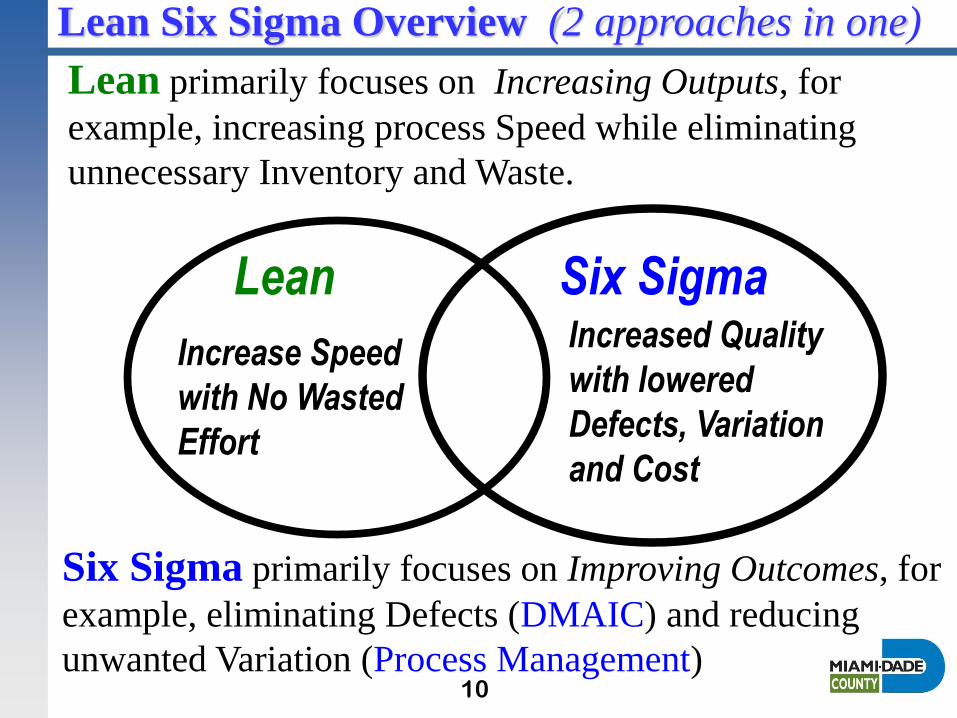
Six Sigma Increased Quality
with lowered
Defects, Variation
and Cost
Lean
Increase Speed
with No Wasted
Effort
Lean Six Sigma Overview (2 approaches in one)
Lean primarily focuses on Increasing Outputs, for
example, increasing process Speed while eliminating
unnecessary Inventory and Waste.
Six Sigma primarily focuses on Improving Outcomes, for
example, eliminating Defects (DMAIC) and reducing
unwanted Variation (Process Management) 10
Sigma Level …Is a measure of performance. It measures how
much of the process output falls within the customers’ requirements.
The higher the sigma level, the more of the process outputs meet
customers’ requirements ( i.e. fewer defects in process outputs).
Sigma …is a Greek letter that represents a measure
of process output variation (also known as standard
deviation)
What is Sigma?
Six Sigma Level … refers to near perfection representing only
3.4 process output defects per 1 million opportunities.
Lean Six Sigma Overview
11
Lean Six Sigma Overview
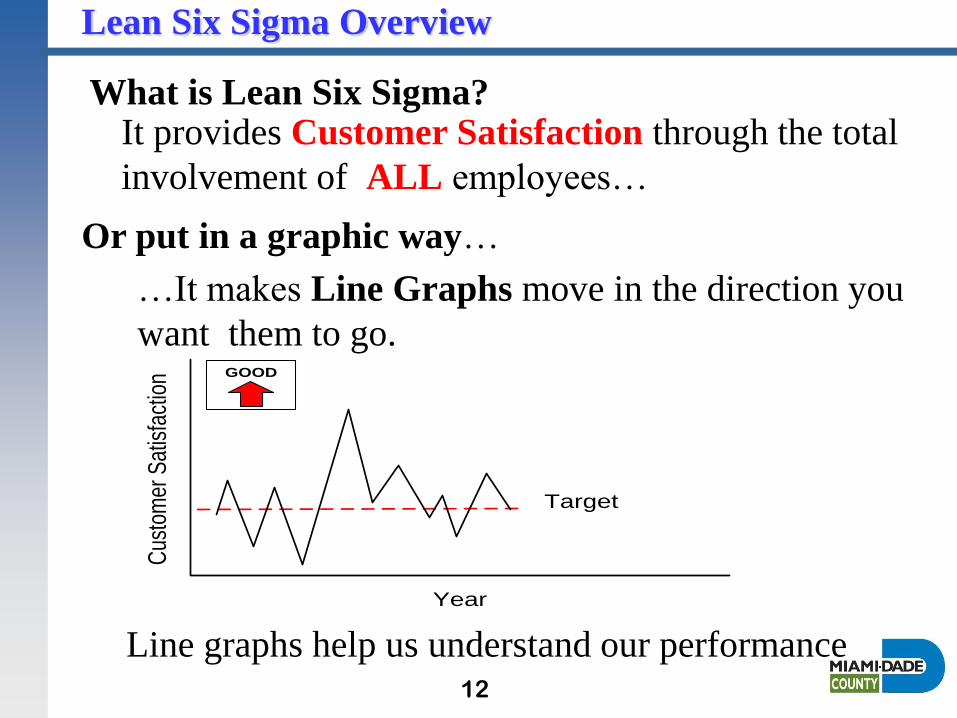
It provides Customer Satisfaction through the total
involvement of ALL employees…
…It makes Line Graphs move in the direction you
want them to go.
Target
GOOD
Cus
tom
er S
atis
fact
ion
Year
What is Lean Six Sigma?
Or put in a graphic way…
Line graphs help us understand our performance 12
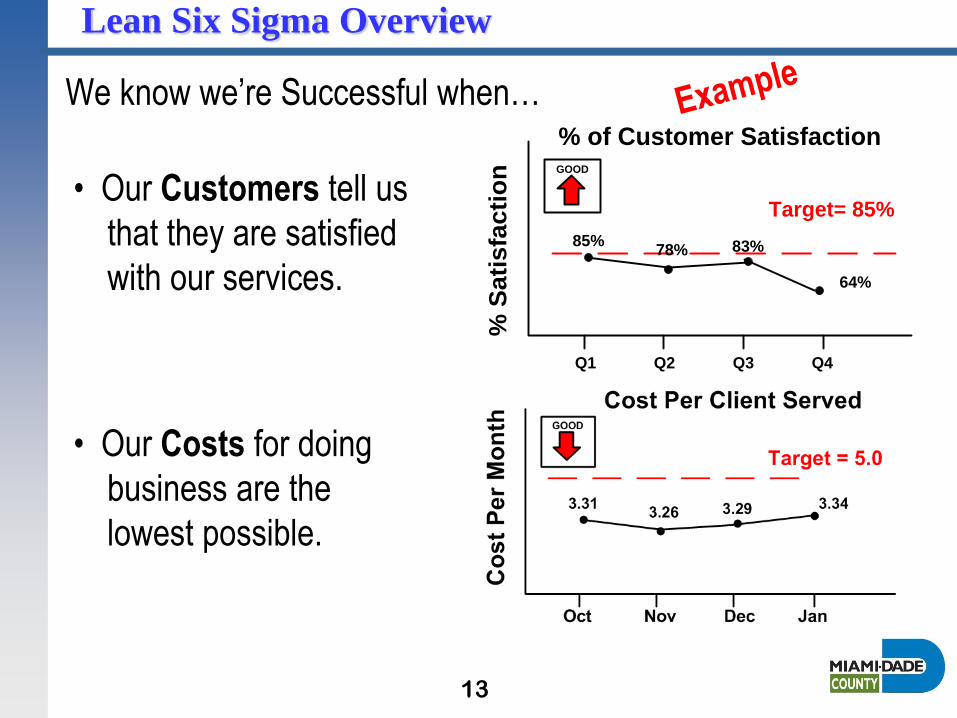
We know we’re Successful when…
• Our Costs for doing
business are the
lowest possible.
Lean Six Sigma Overview
• Our Customers tell us
that they are satisfied
with our services.
GOOD
Target= 85%
% of Customer Satisfaction
64%
83%78%85%
Q1 Q2 Q3 Q4
% S
ati
sfa
cti
on
13
Lean Six Sigma Overview
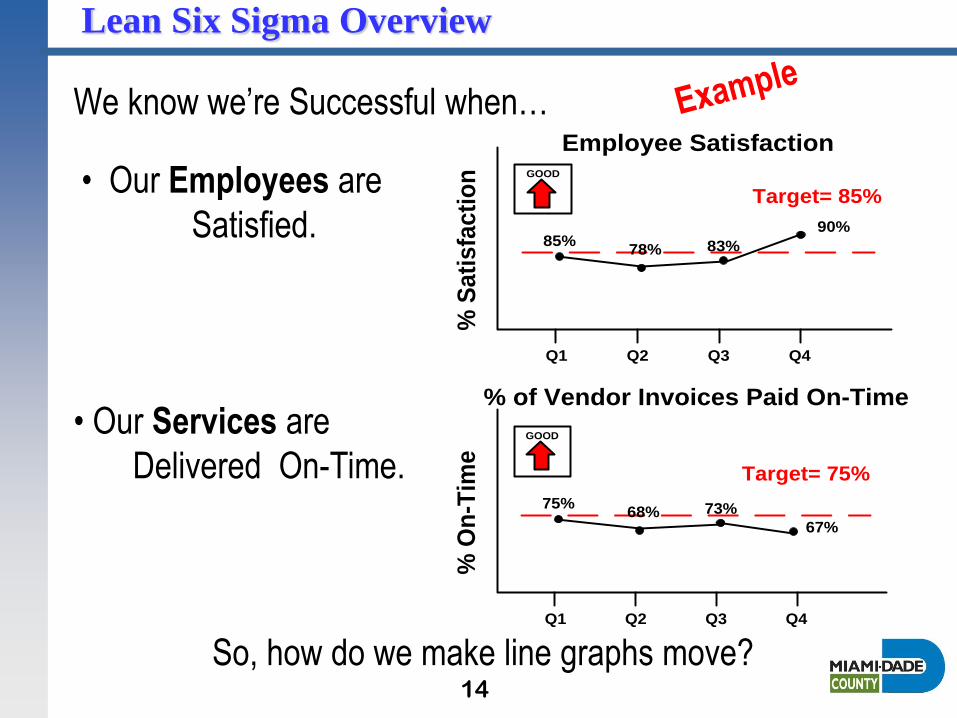
We know we’re Successful when…
• Our Employees are
Satisfied.
• Our Services are
Delivered On-Time.
So, how do we make line graphs move?
GOOD
Target= 85%
Employee Satisfaction
90%
83%78%85%
Q1 Q2 Q3 Q4
% S
ati
sfa
cti
on
GOOD
Target= 75%
% of Vendor Invoices Paid On-Time
67%
73%68%75%
Q1 Q2 Q3 Q4
% O
n-T
ime
14
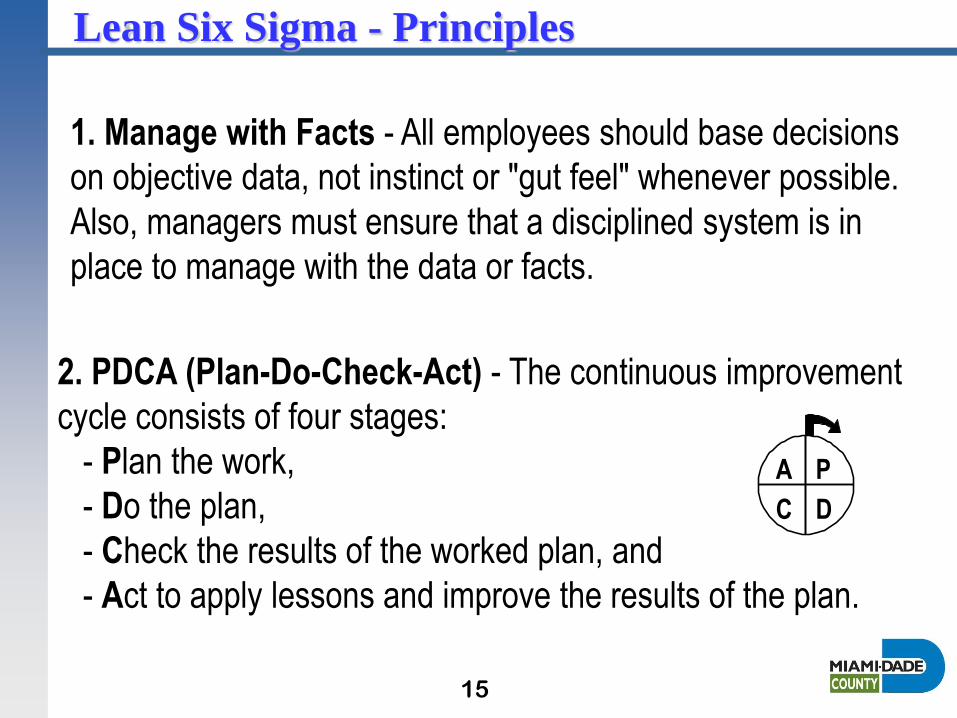
2. PDCA (Plan-Do-Check-Act) - The continuous improvement
cycle consists of four stages:
- Plan the work,
- Do the plan,
- Check the results of the worked plan, and
- Act to apply lessons and improve the results of the plan.
Lean Six Sigma - Principles
1. Manage with Facts - All employees should base decisions
on objective data, not instinct or "gut feel" whenever possible.
Also, managers must ensure that a disciplined system is in
place to manage with the data or facts.
A P
C D
15
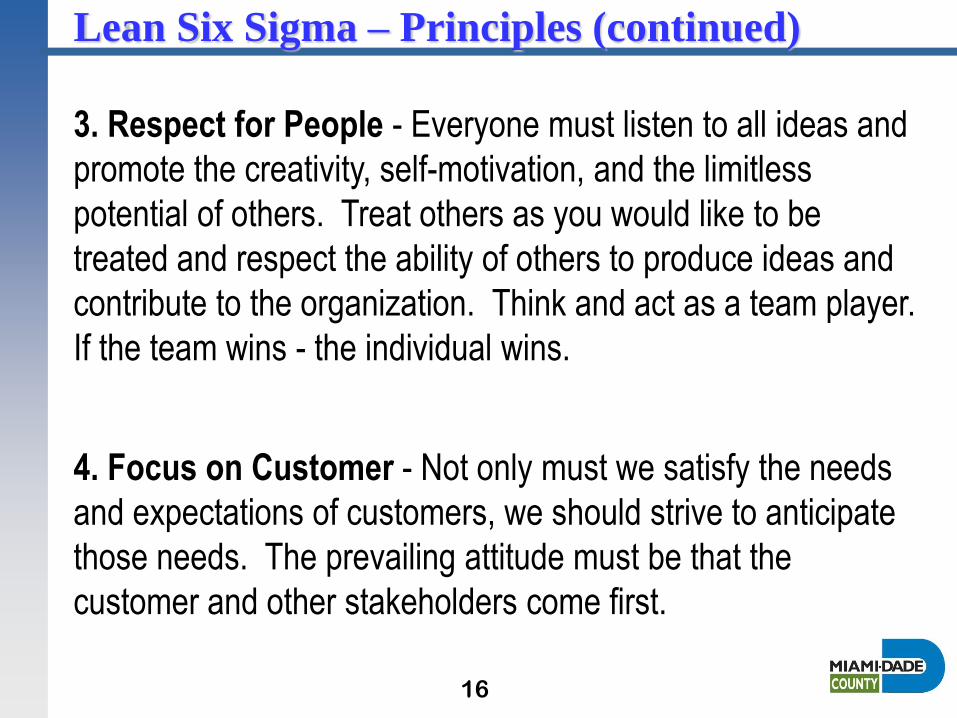
Lean Six Sigma – Principles (continued)
3. Respect for People - Everyone must listen to all ideas and
promote the creativity, self-motivation, and the limitless
potential of others. Treat others as you would like to be
treated and respect the ability of others to produce ideas and
contribute to the organization. Think and act as a team player.
If the team wins - the individual wins.
4. Focus on Customer - Not only must we satisfy the needs
and expectations of customers, we should strive to anticipate
those needs. The prevailing attitude must be that the
customer and other stakeholders come first.
16
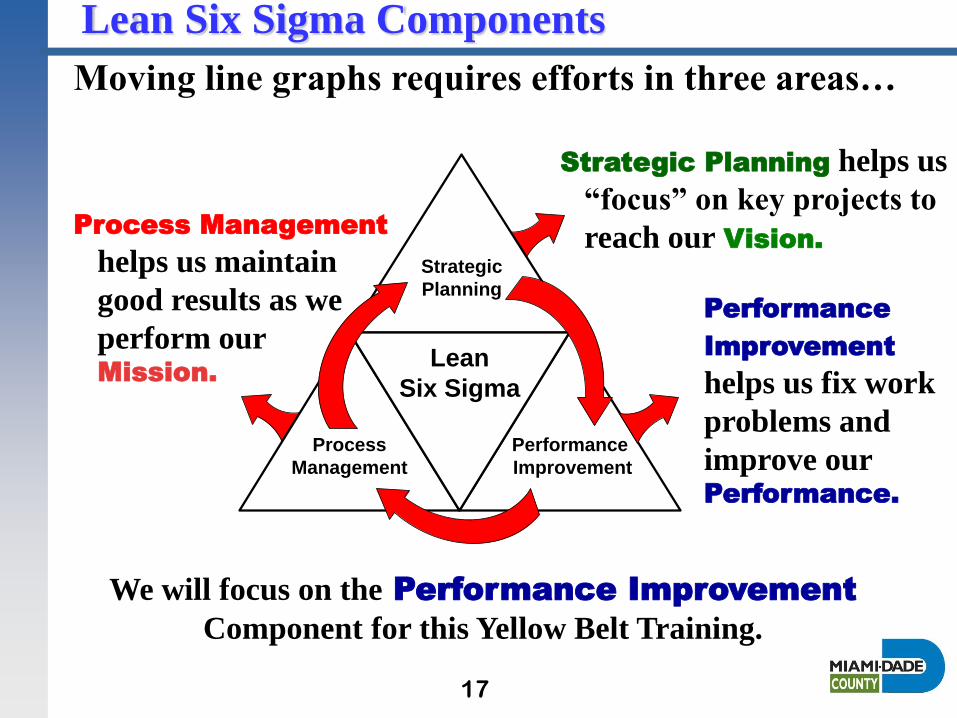
Lean Six Sigma Components
Moving line graphs requires efforts in three areas…
Process Management
helps us maintain
good results as we
perform our Mission.
Strategic Planning helps us
“focus” on key projects to
reach our Vision.
Performance
Improvement
helps us fix work
problems and
improve our Performance.
We will focus on the Performance Improvement
Component for this Yellow Belt Training.
Strategic
Planning
Performance
Improvement
Process
Management
Lean
Six Sigma
17
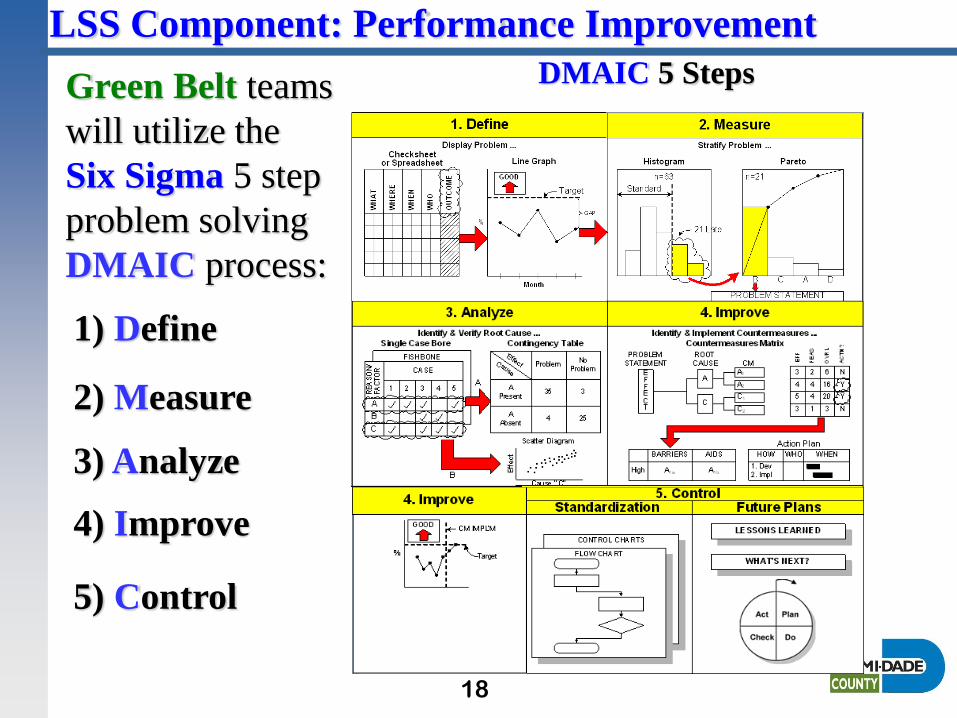
Green Belt teams
will utilize the
Six Sigma 5 step
problem solving
DMAIC process:
2) Measure
5) Control
4) Improve
1) Define
3) Analyze
DMAIC 5 Steps
LSS Component: Performance Improvement
18
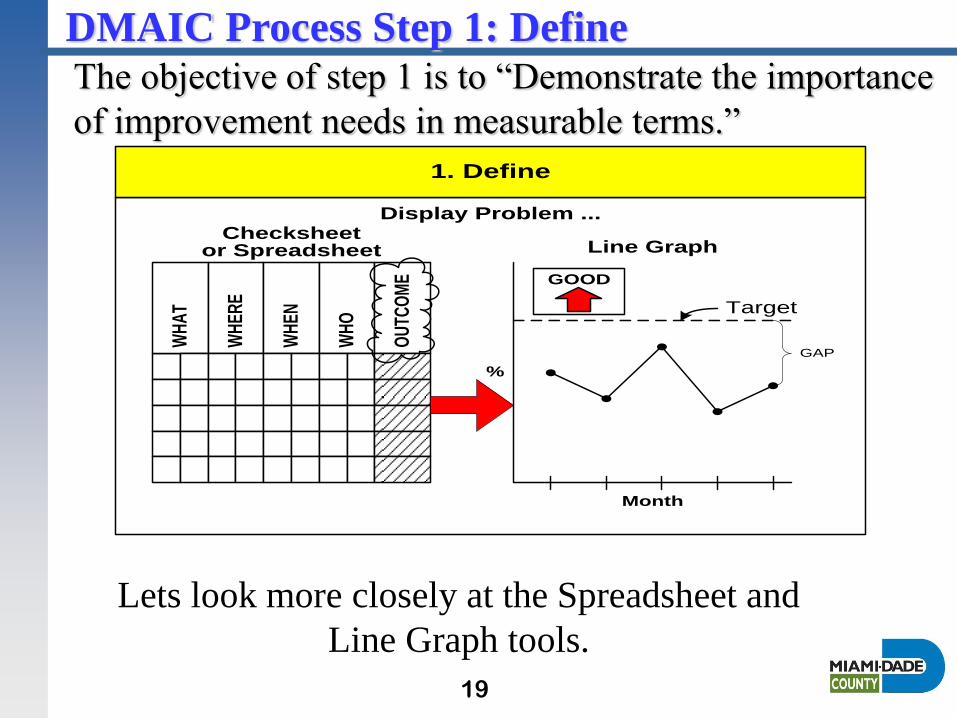
DMAIC Process Step 1: Define
Lets look more closely at the Spreadsheet and
Line Graph tools.
The objective of step 1 is to “Demonstrate the importance
of improvement needs in measurable terms.”
Display Problem ...
WH
AT
WH
ERE
WH
EN
WH
O
OU
TCO
ME
1. Define
Checksheetor Spreadsheet Line Graph
Month
GOOD
Target
GAP
%
19
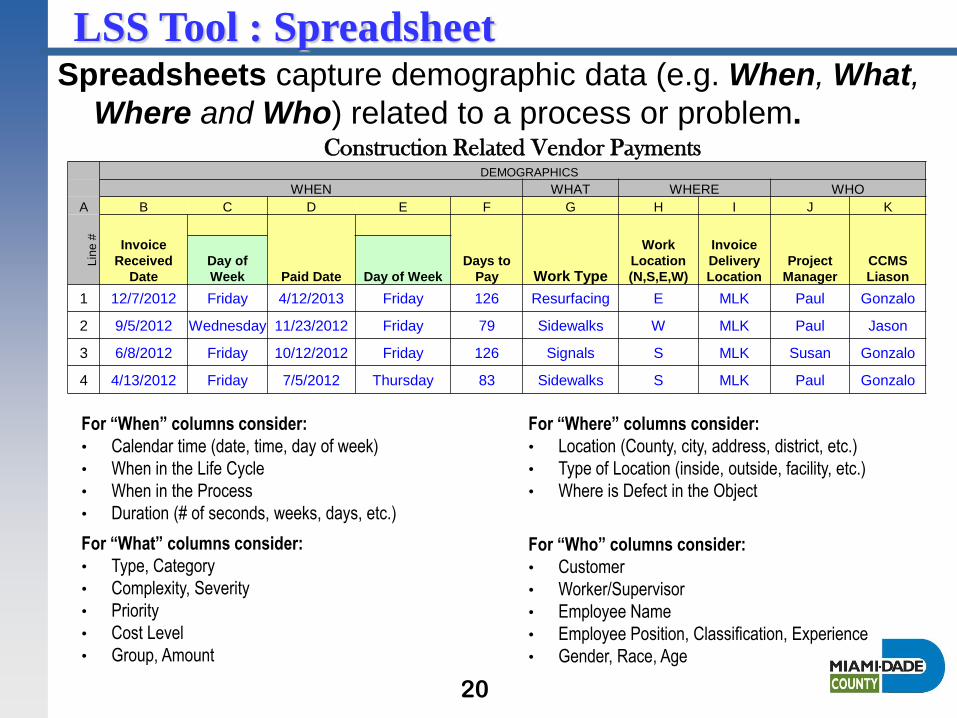
Spreadsheets capture demographic data (e.g. When, What,
Where and Who) related to a process or problem.
LSS Tool : Spreadsheet
20
Construction Related Vendor Payments DEMOGRAPHICS
WHEN WHAT WHERE WHO
A B C D E F G H I J K
Lin
e #
Invoice
Received
Date
Paid Date
Days to
Pay Work Type
Work
Location
(N,S,E,W)
Invoice
Delivery
Location
Project
Manager
CCMS
Liason
Day of
Week Day of Week
1 12/7/2012 Friday 4/12/2013 Friday 126 Resurfacing E MLK Paul Gonzalo
2 9/5/2012 Wednesday 11/23/2012 Friday 79 Sidewalks W MLK Paul Jason
3 6/8/2012 Friday 10/12/2012 Friday 126 Signals S MLK Susan Gonzalo
4 4/13/2012 Friday 7/5/2012 Thursday 83 Sidewalks S MLK Paul Gonzalo
For “When” columns consider:
• Calendar time (date, time, day of week)
• When in the Life Cycle
• When in the Process
• Duration (# of seconds, weeks, days, etc.)
For “What” columns consider:
• Type, Category
• Complexity, Severity
• Priority
• Cost Level
• Group, Amount
For “Where” columns consider:
• Location (County, city, address, district, etc.)
• Type of Location (inside, outside, facility, etc.)
• Where is Defect in the Object
For “Who” columns consider:
• Customer
• Worker/Supervisor
• Employee Name
• Employee Position, Classification, Experience
• Gender, Race, Age
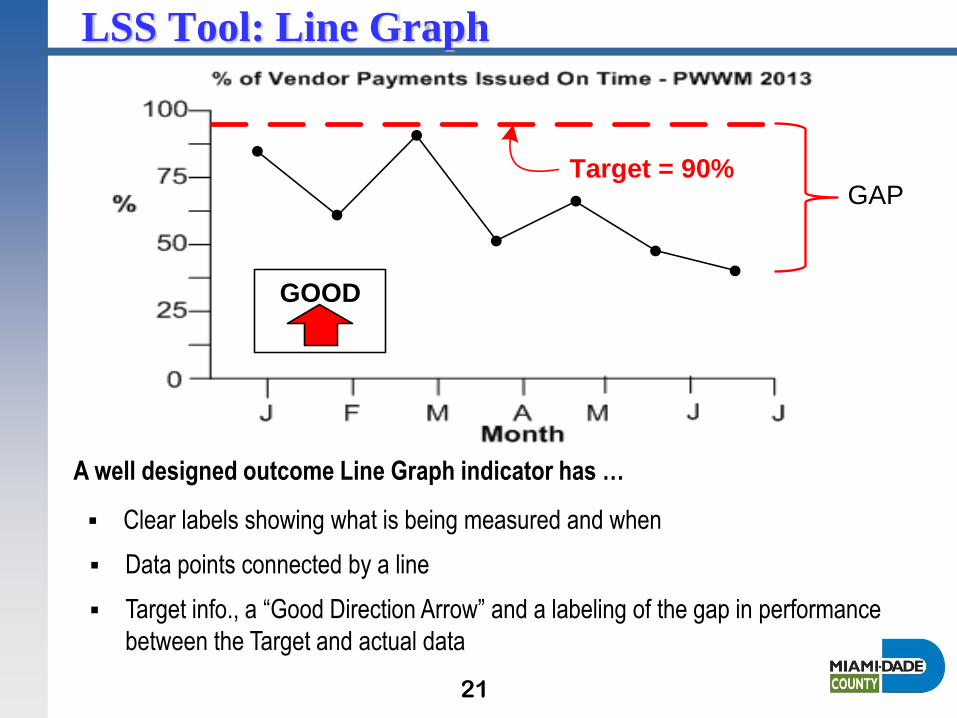
LSS Tool: Line Graph
Clear labels showing what is being measured and when
A well designed outcome Line Graph indicator has …
GOOD
Target = 90%GAP
Data points connected by a line
Target info., a “Good Direction Arrow” and a labeling of the gap in performance
between the Target and actual data
21
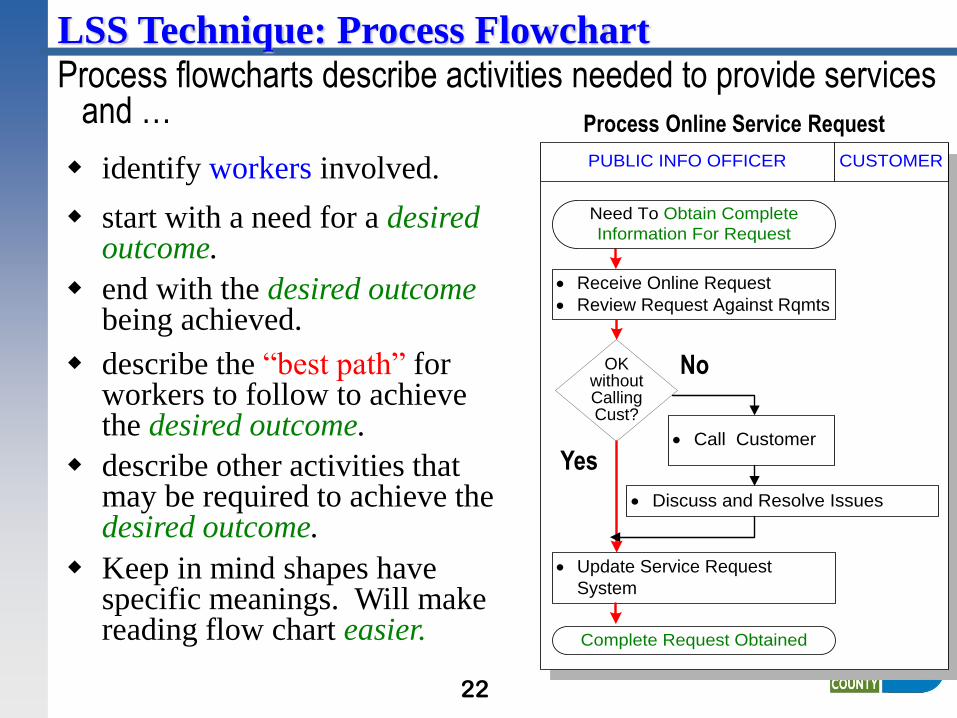
· Receive Online Request
· Review Request Against Rqmts
OK without Calling Cust?
· Update Service Request
System
LSS Technique: Process Flowchart Process flowcharts describe activities needed to provide services
and …
describe the “best path” for workers to follow to achieve the desired outcome.
Process Online Service Request
identify workers involved. PUBLIC INFO OFFICER CUSTOMER
start with a need for a desired outcome.
Need To Obtain Complete
Information For Request
end with the desired outcome being achieved.
Complete Request Obtained
describe other activities that may be required to achieve the desired outcome.
· Call Customer
· Discuss and Resolve Issues
No
Yes
Keep in mind shapes have specific meanings. Will make reading flow chart easier.
22
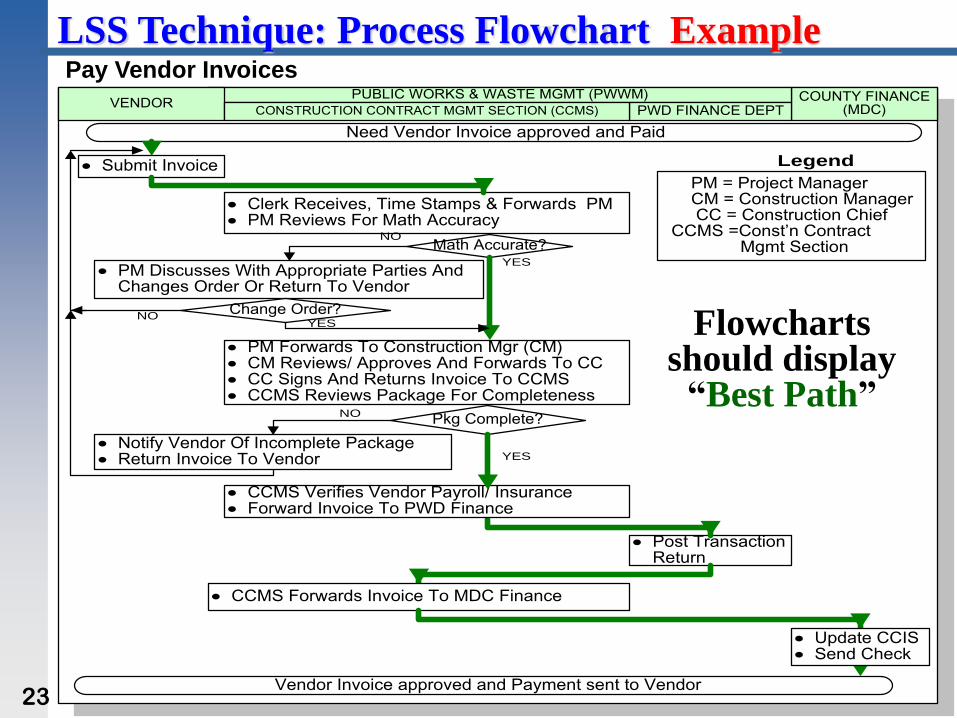
Need Vendor Invoice approved and Paid
Vendor Invoice approved and Payment sent to Vendor
COUNTY FINANCE (MDC)
· Clerk Receives, Time Stamps & Forwards PM· PM Reviews For Math Accuracy
PUBLIC WORKS & WASTE MGMT (PWWM)
· PM Discusses With Appropriate Parties And Changes Order Or Return To Vendor
Math Accurate?
PWD FINANCE DEPT
· Submit Invoice
· PM Forwards To Construction Mgr (CM)· CM Reviews/ Approves And Forwards To CC· CC Signs And Returns Invoice To CCMS· CCMS Reviews Package For Completeness
VENDOR
NO
YES
Pkg Complete?
· Post Transaction Return
CONSTRUCTION CONTRACT MGMT SECTION (CCMS)
Change Order?YES
NO
YES
NO
· Notify Vendor Of Incomplete Package· Return Invoice To Vendor
· CCMS Verifies Vendor Payroll/ Insurance · Forward Invoice To PWD Finance
· CCMS Forwards Invoice To MDC Finance
PM = Project Manager CM = Construction Manager CC = Construction Chief CCMS =Const’n Contract Mgmt Section
Legend
· Update CCIS· Send Check
LSS Technique: Process Flowchart Example Pay Vendor Invoices
Flowcharts should display
“Best Path”
23
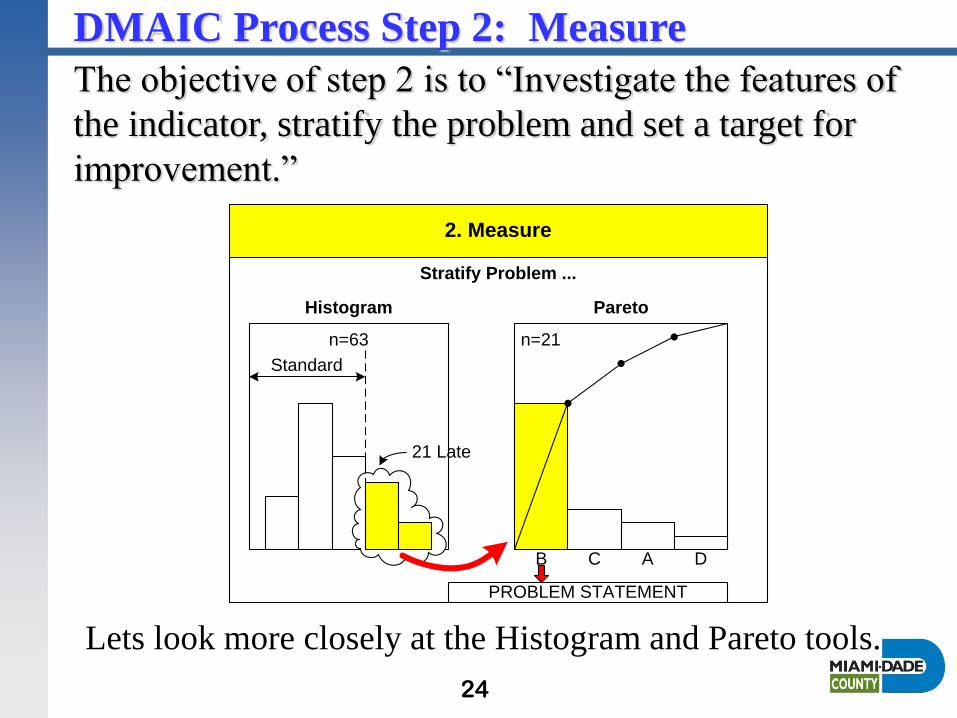
DMAIC Process Step 2: Measure
Lets look more closely at the Histogram and Pareto tools.
The objective of step 2 is to “Investigate the features of
the indicator, stratify the problem and set a target for
improvement.”
Stratify Problem ...
2. Measure
Histogram
n=63
21 Late
n=21
Pareto
B C A D
PROBLEM STATEMENT
Standard
24
0
1
2
3
4
5
6
7
8
9
10
20 30 40 50 60 70 80 90
3
5
8
4
3
_
xn = 23
mean = 54
std dev = 11.6
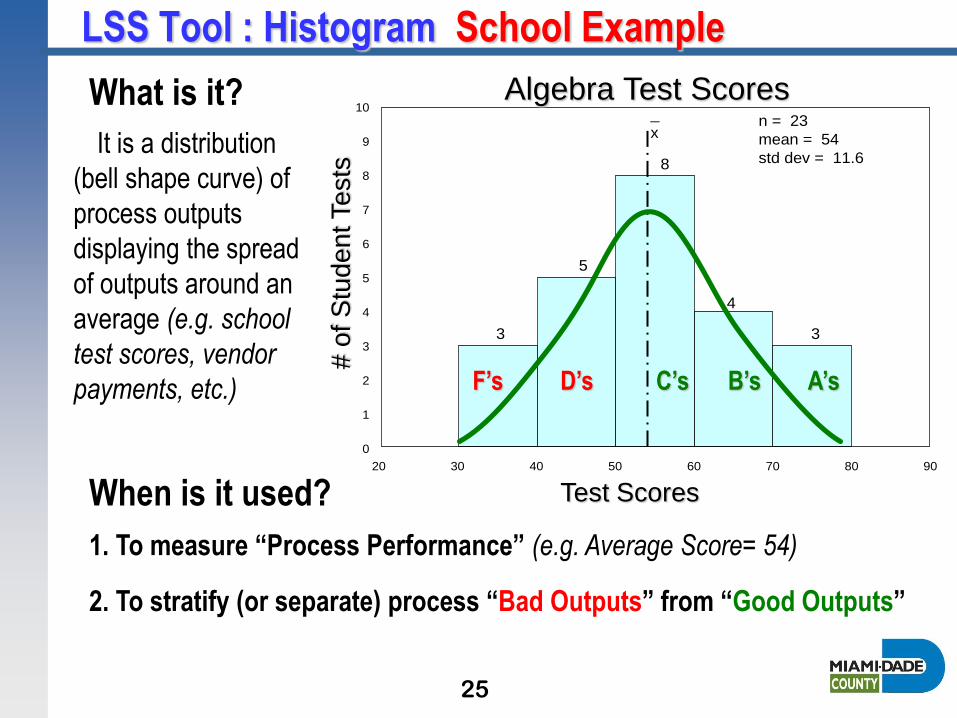
LSS Tool : Histogram School Example
It is a distribution
(bell shape curve) of
process outputs
displaying the spread
of outputs around an
average (e.g. school
test scores, vendor
payments, etc.)
Algebra Test Scores What is it?
1. To measure “Process Performance” (e.g. Average Score= 54)
When is it used?
#
of S
tud
en
t Te
sts
Test Scores
A’s B’s C’s D’s F’s
2. To stratify (or separate) process “Bad Outputs” from “Good Outputs”
25
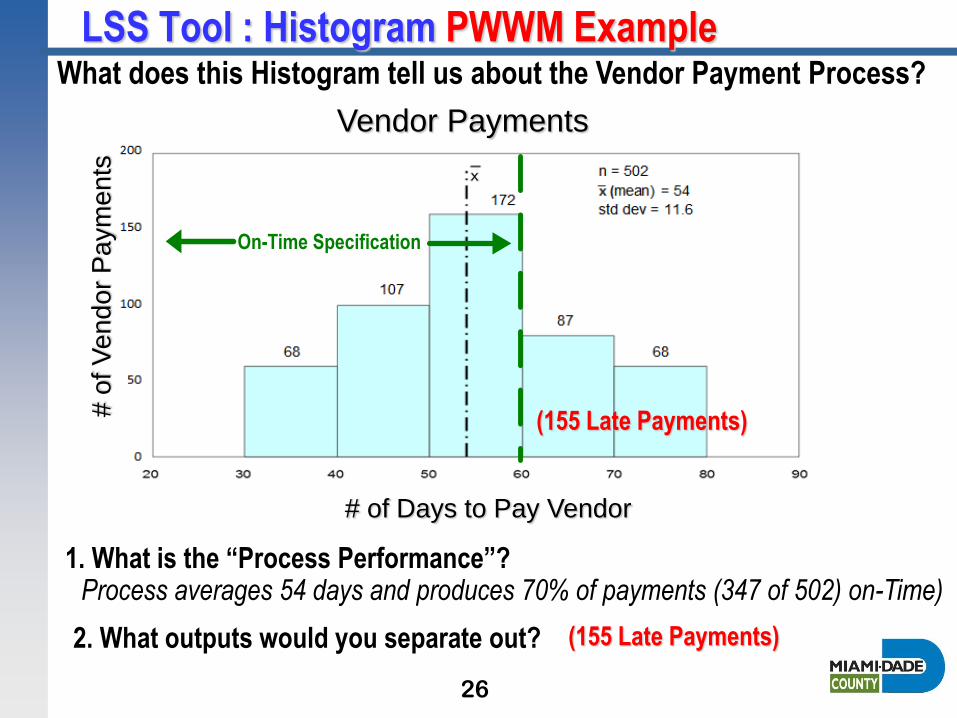
LSS Tool : Histogram PWWM Example
Vendor Payments
What does this Histogram tell us about the Vendor Payment Process?
1. What is the “Process Performance”?
# o
f V
end
or
Paym
ents
# of Days to Pay Vendor
2. What outputs would you separate out?
On-Time Specification
Process averages 54 days and produces 70% of payments (347 of 502) on-Time)
(155 Late Payments)
(155 Late Payments)
26
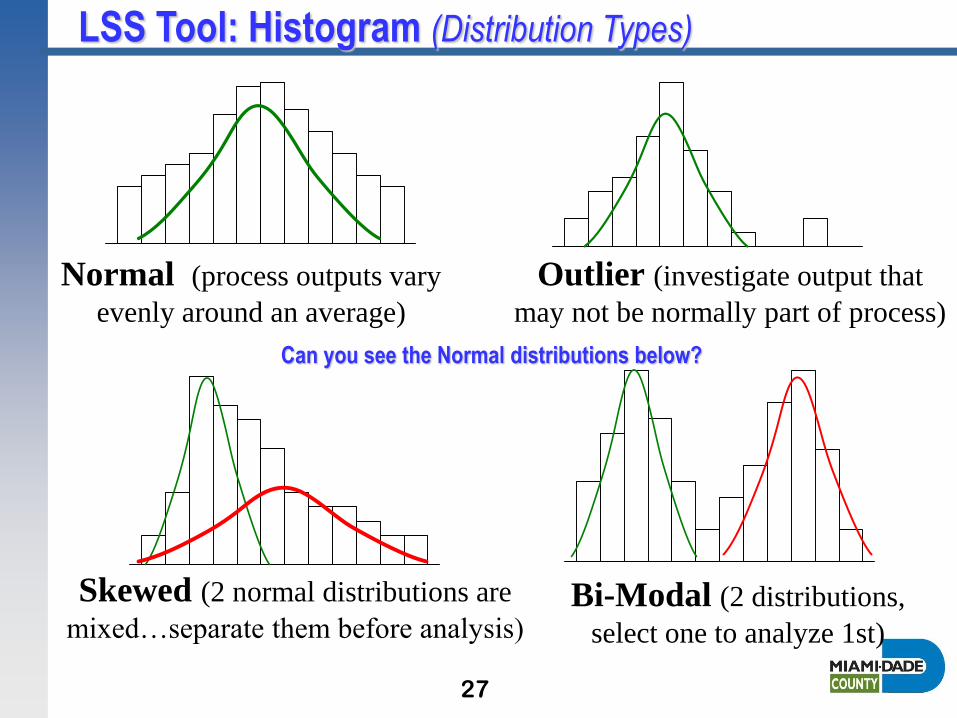
LSS Tool: Histogram (Distribution Types)
Normal (process outputs vary
evenly around an average)
Outlier (investigate output that
may not be normally part of process)
Skewed (2 normal distributions are
mixed…separate them before analysis)
Bi-Modal (2 distributions,
select one to analyze 1st)
Can you see the Normal distributions below?
27
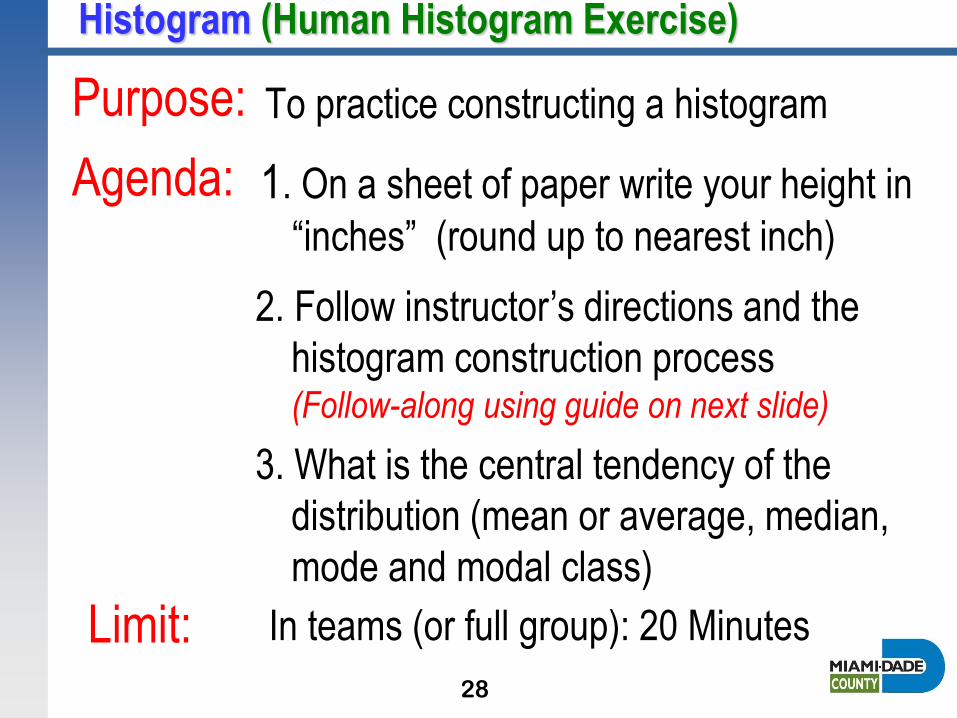
To practice constructing a histogram
1. On a sheet of paper write your height in
“inches” (round up to nearest inch)
3. What is the central tendency of the
distribution (mean or average, median,
mode and modal class)
In teams (or full group): 20 Minutes
2. Follow instructor’s directions and the
histogram construction process (Follow-along using guide on next slide)
Purpose:
Limit:
Agenda:
Histogram (Human Histogram Exercise)
28
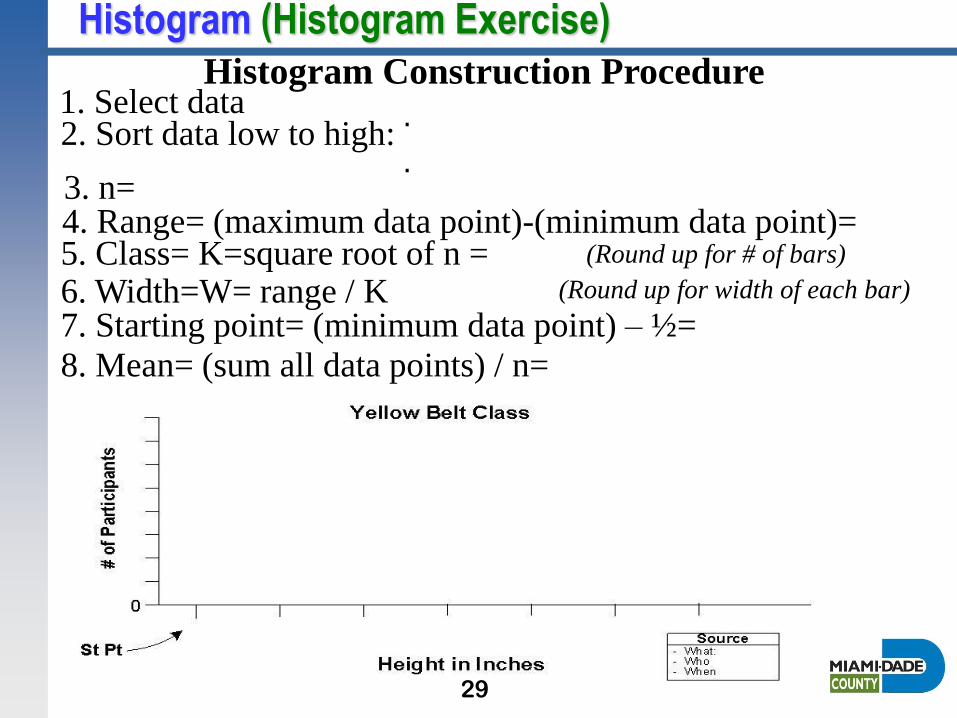
Histogram Construction Procedure
Histogram (Histogram Exercise)
8. Mean= (sum all data points) / n=
1. Select data 2. Sort data low to high:
3. n= 4. Range= (maximum data point)-(minimum data point)= 5. Class= K=square root of n =
7. Starting point= (minimum data point) – ½= 6. Width=W= range / K
(Round up for # of bars)
(Round up for width of each bar)
.
.
29
LSS Tool: Pareto
1897 . . . Italian Economist, Vilfredo Pareto, presented
a formula showing that the distribution of income is
uneven (i.e., the largest share of the world's income is
held by small number of people).
1907 . . . U.S. Economist, M. C. Lorenz, expressed a
similar theory in a diagram.
Later . . . Quality Control expert, Dr. J. M. Juran,
applied Lorenz's diagram method to classify problems of
quality into "vital few” versus the “trivial many”.
How the Pareto Diagram was Born
30
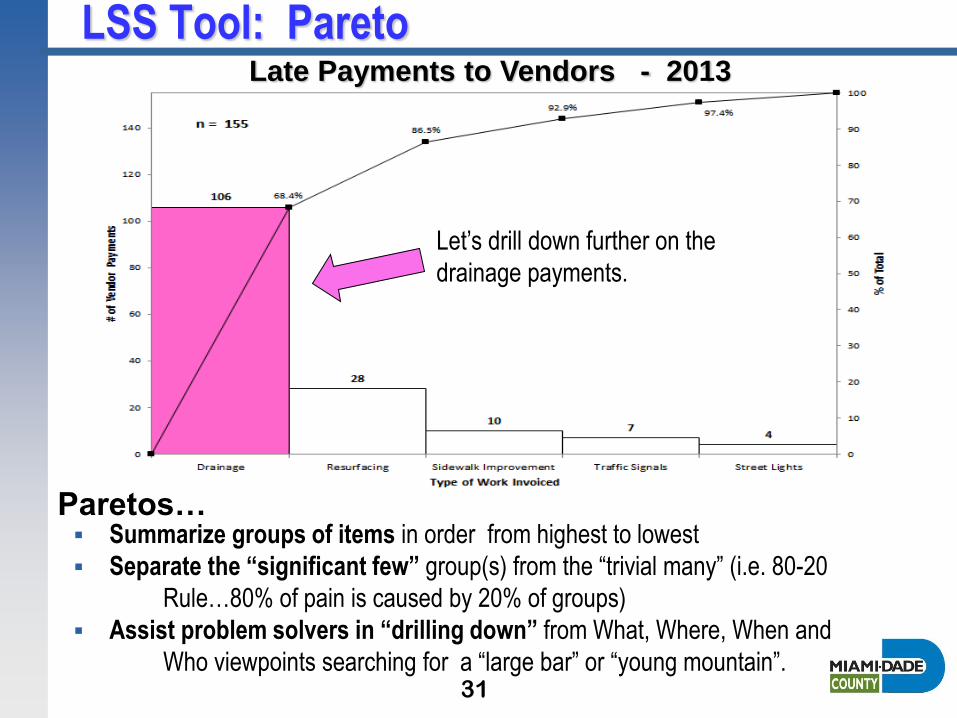
LSS Tool: Pareto
Summarize groups of items in order from highest to lowest
Separate the “significant few” group(s) from the “trivial many” (i.e. 80-20
Rule…80% of pain is caused by 20% of groups)
Assist problem solvers in “drilling down” from What, Where, When and
Who viewpoints searching for a “large bar” or “young mountain”.
Late Payments to Vendors - 2013
Paretos…
31
Let’s drill down further on the
drainage payments.
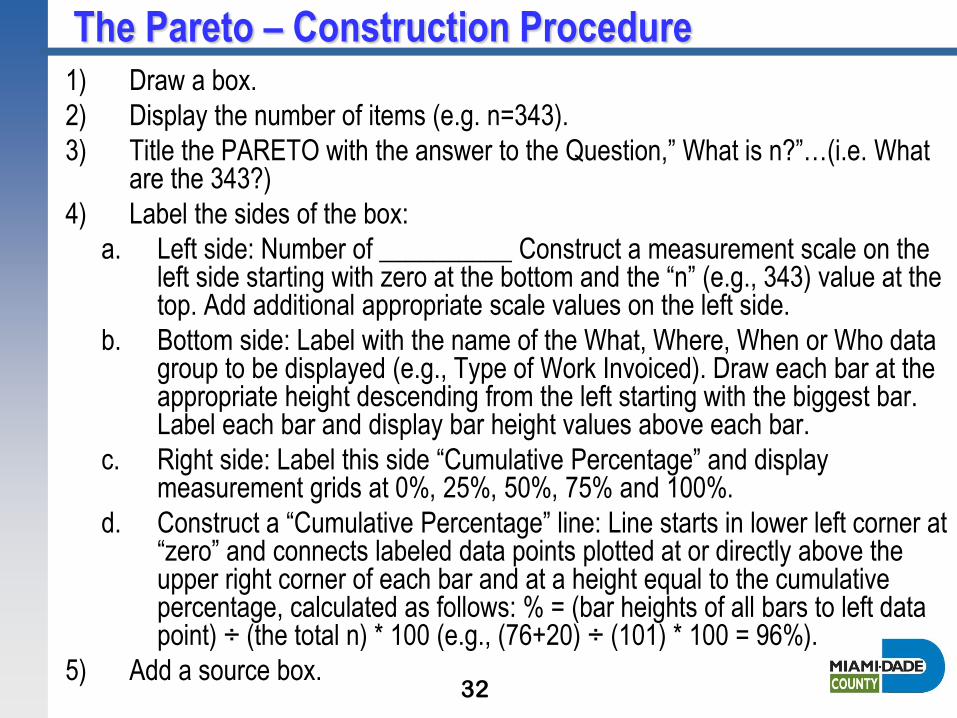
1) Draw a box.
2) Display the number of items (e.g. n=343).
3) Title the PARETO with the answer to the Question,” What is n?”…(i.e. What are the 343?)
4) Label the sides of the box:
a. Left side: Number of __________ Construct a measurement scale on the left side starting with zero at the bottom and the “n” (e.g., 343) value at the top. Add additional appropriate scale values on the left side.
b. Bottom side: Label with the name of the What, Where, When or Who data group to be displayed (e.g., Type of Work Invoiced). Draw each bar at the appropriate height descending from the left starting with the biggest bar. Label each bar and display bar height values above each bar.
c. Right side: Label this side “Cumulative Percentage” and display measurement grids at 0%, 25%, 50%, 75% and 100%.
d. Construct a “Cumulative Percentage” line: Line starts in lower left corner at “zero” and connects labeled data points plotted at or directly above the upper right corner of each bar and at a height equal to the cumulative percentage, calculated as follows: % = (bar heights of all bars to left data point) ÷ (the total n) * 100 (e.g., (76+20) ÷ (101) * 100 = 96%).
5) Add a source box.
The Pareto – Construction Procedure
32
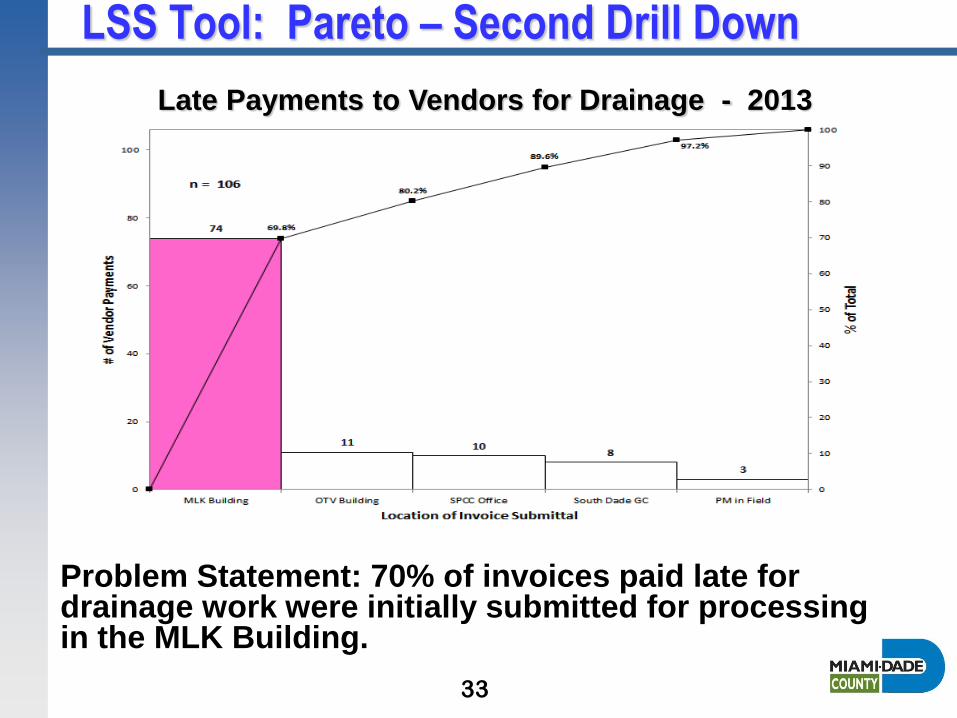
LSS Tool: Pareto – Second Drill Down
Late Payments to Vendors for Drainage - 2013
Problem Statement: 70% of invoices paid late for drainage work were initially submitted for processing in the MLK Building.
33
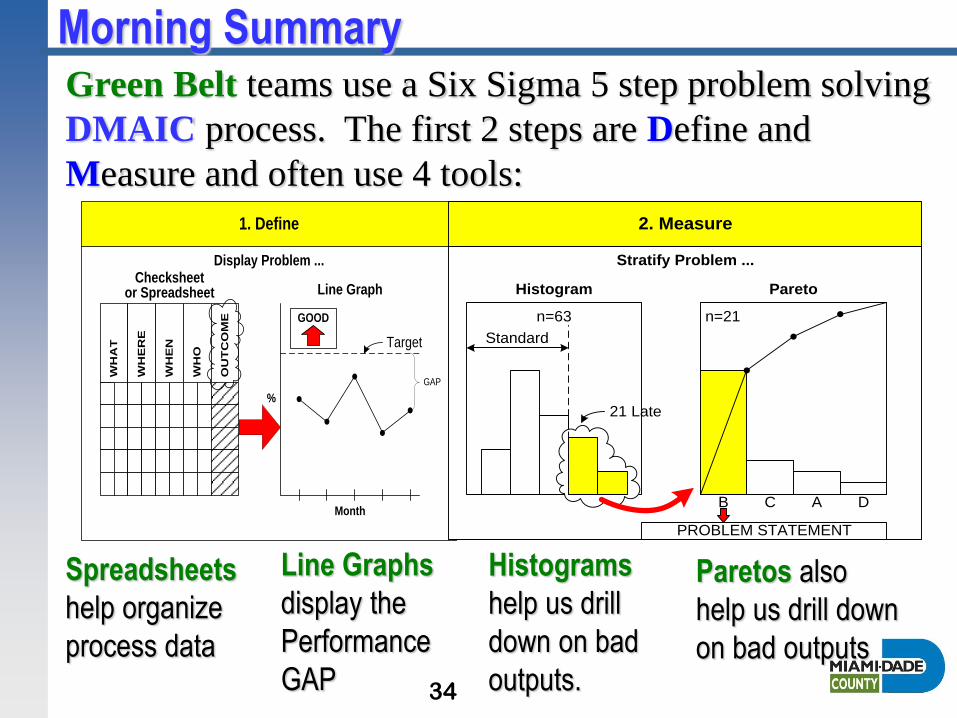
Morning Summary
Display Problem ...
WH
AT
WH
ER
E
WH
EN
WH
O
OU
TC
OM
E1. Define
Checksheetor Spreadsheet Line Graph
Month
GOOD
Target
GAP
%
Stratify Problem ...
2. Measure
Histogram
n=63
21 Late
n=21
Pareto
B C A D
PROBLEM STATEMENT
Standard
Green Belt teams use a Six Sigma 5 step problem solving
DMAIC process. The first 2 steps are Define and
Measure and often use 4 tools:
Spreadsheets
help organize
process data
Line Graphs
display the
Performance
GAP
Histograms
help us drill
down on bad
outputs.
Paretos also
help us drill down
on bad outputs
34
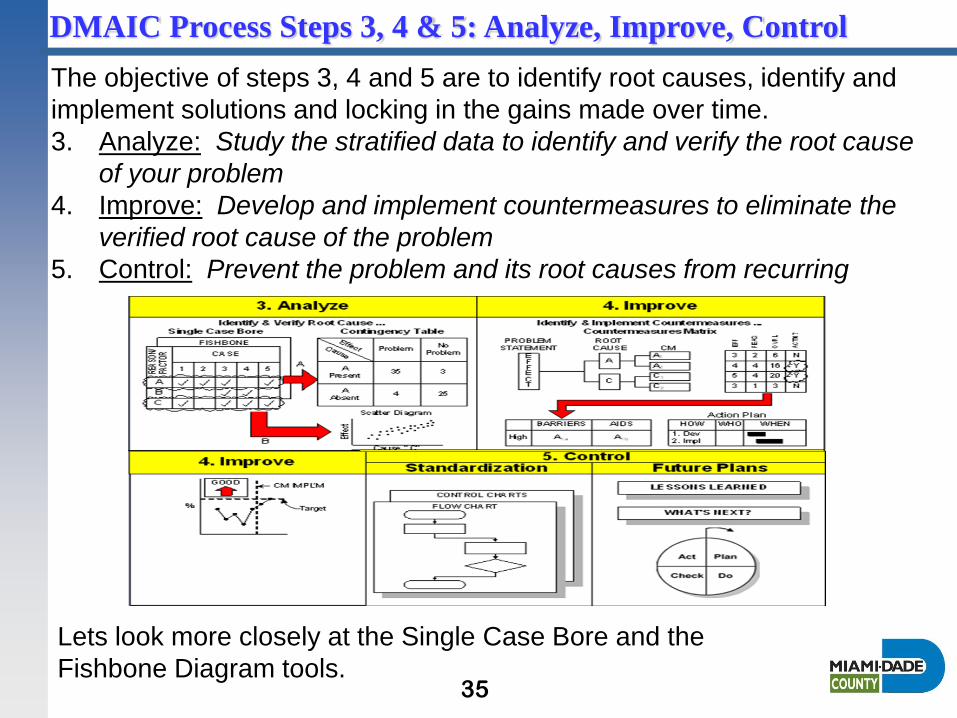
DMAIC Process Steps 3, 4 & 5: Analyze, Improve, Control
Lets look more closely at the Single Case Bore and the
Fishbone Diagram tools.
The objective of steps 3, 4 and 5 are to identify root causes, identify and
implement solutions and locking in the gains made over time.
3. Analyze: Study the stratified data to identify and verify the root cause
of your problem
4. Improve: Develop and implement countermeasures to eliminate the
verified root cause of the problem
5. Control: Prevent the problem and its root causes from recurring
35
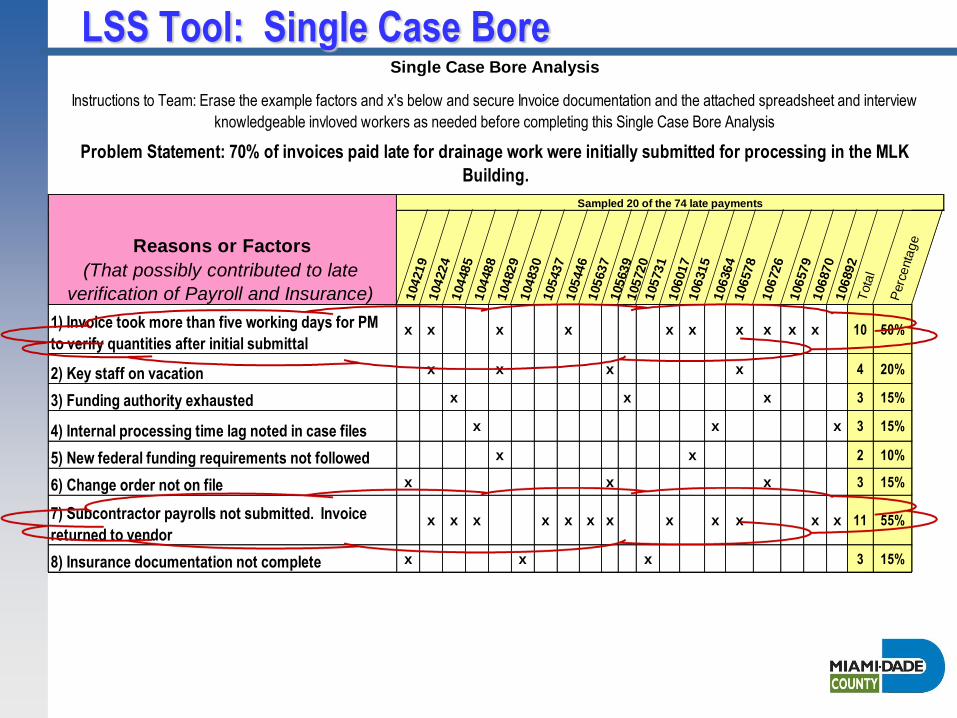
LSS Tool: Single Case Bore
Instructions to Team: Erase the example factors and x's below and secure Invoice documentation and the attached spreadsheet and interview
knowledgeable invloved workers as needed before completing this Single Case Bore Analysis
Problem Statement: 70% of invoices paid late for drainage work were initially submitted for processing in the MLK
Building.
Reasons or Factors
(That possibly contributed to late
verification of Payroll and Insurance)
Sampled 20 of the 74 late payments
Single Case Bore Analysis
104219
104224
104485
104488
104829
104830
105437
105446
105637
105639
105720
105731
106017
106315
106364
106578
106726
106579
106870
106892
Tota
l
Perc
enta
geReasons or Factors
(That possibly contributed to late
verification of Payroll and Insurance)
1) Invoice took more than five working days for PM
to verify quantities after initial submittalx x
2) Key staff on vacation x
3) Funding authority exhausted x
Reasons or Factors
(That possibly contributed to late
verification of Payroll and Insurance)
Sampled 20 of the 74 late payments
Problem Statement: 70% of invoices paid late for drainage work were initially submitted for processing in the MLK
Building.
Instructions to Team: Erase the example factors and x's below and secure Invoice documentation and the attached spreadsheet and interview
knowledgeable invloved workers as needed before completing this Single Case Bore Analysis
Single Case Bore Analysis
104219
104224
104485
104488
104829
104830
105437
105446
105637
105639
105720
105731
106017
106315
106364
106578
106726
106579
106870
106892
Tota
l
Perc
enta
geReasons or Factors
(That possibly contributed to late
verification of Payroll and Insurance)
1) Invoice took more than five working days for PM
to verify quantities after initial submittalx x x x x x x x x x 10 50%
2) Key staff on vacation x x x x 4 20%
3) Funding authority exhausted x x x 3 15%
4) Internal processing time lag noted in case files x x x 3 15%
5) New federal funding requirements not followed x x 2 10%
6) Change order not on file x x x 3 15%
7) Subcontractor payrolls not submitted. Invoice
returned to vendorx x x x x x x x x x x x 11 55%
8) Insurance documentation not complete x x x 3 15%
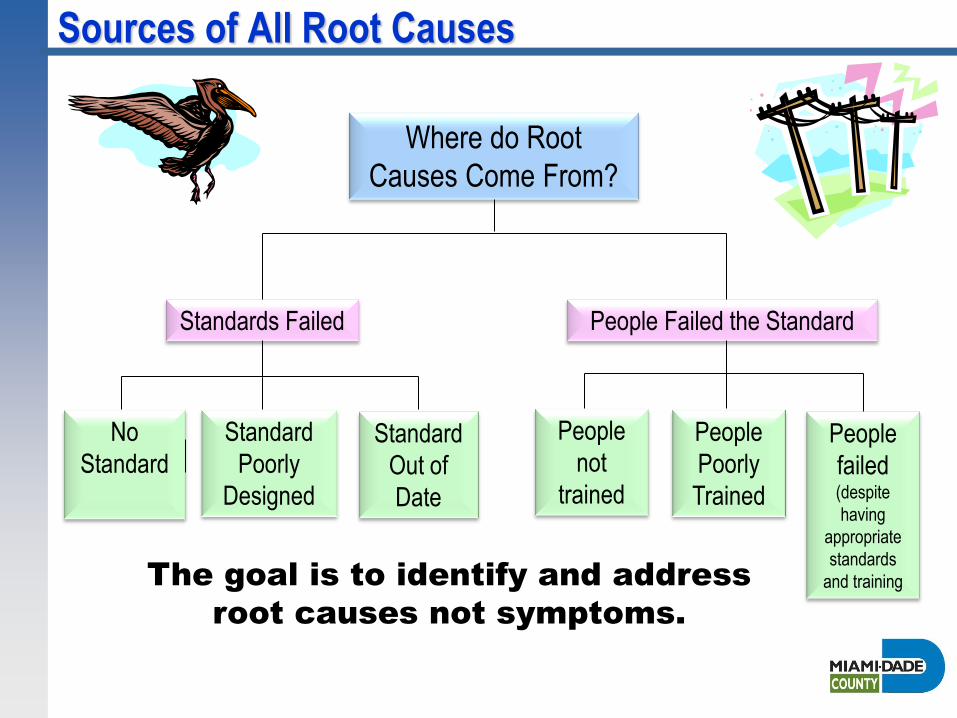
Sources of All Root Causes
Where do Root
Causes Come From?
Standards Failed People Failed the Standard
People
failed (despite
having
appropriate
standards
and training
People
Poorly
Trained
People
not
trained
Standard
Out of
Date
Standard
Poorly
Designed
No
Standard
The goal is to identify and address
root causes not symptoms.
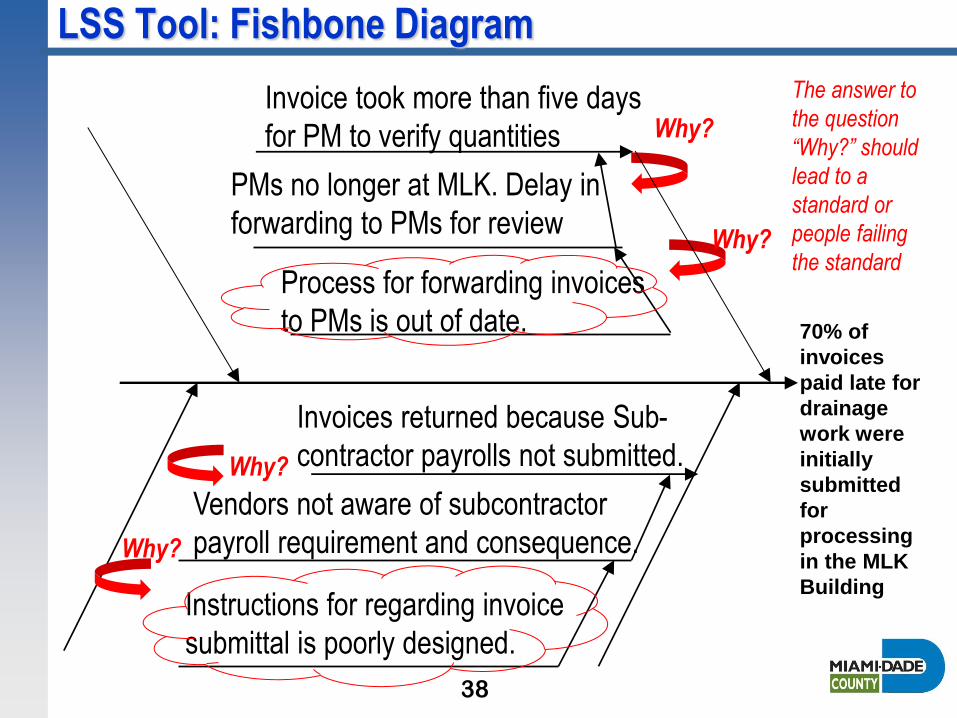
LSS Tool: Fishbone Diagram
38
70% of
invoices
paid late for
drainage
work were
initially
submitted
for
processing
in the MLK
Building
Invoice took more than five days
for PM to verify quantities
Invoices returned because Sub-
contractor payrolls not submitted.
Process for forwarding invoices
to PMs is out of date.
PMs no longer at MLK. Delay in
forwarding to PMs for review
Vendors not aware of subcontractor
payroll requirement and consequence.
Instructions for regarding invoice
submittal is poorly designed.
Why?
Why?
Why?
Why?
The answer to
the question
“Why?” should
lead to a
standard or
people failing
the standard
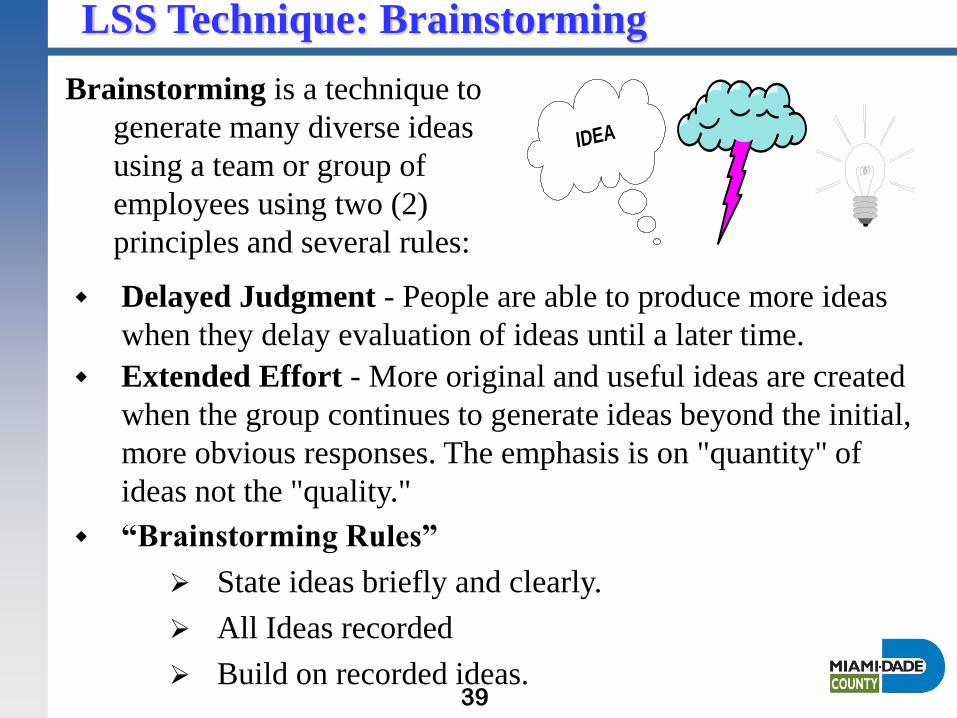
LSS Technique: Brainstorming
Brainstorming is a technique to
generate many diverse ideas
using a team or group of
employees using two (2)
principles and several rules:
Extended Effort - More original and useful ideas are created
when the group continues to generate ideas beyond the initial,
more obvious responses. The emphasis is on "quantity" of
ideas not the "quality."
Delayed Judgment - People are able to produce more ideas
when they delay evaluation of ideas until a later time.
IDEA
“Brainstorming Rules”
State ideas briefly and clearly.
All Ideas recorded
Build on recorded ideas. 39
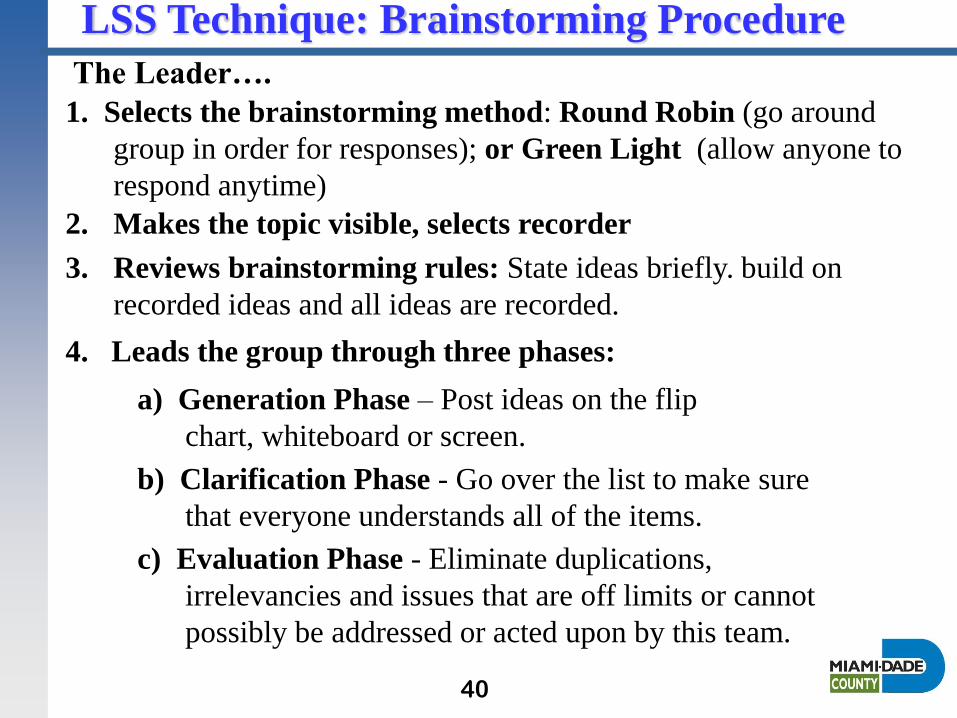
LSS Technique: Brainstorming Procedure
The Leader….
1. Selects the brainstorming method: Round Robin (go around
group in order for responses); or Green Light (allow anyone to
respond anytime)
4. Leads the group through three phases:
a) Generation Phase – Post ideas on the flip
chart, whiteboard or screen.
b) Clarification Phase - Go over the list to make sure
that everyone understands all of the items.
c) Evaluation Phase - Eliminate duplications,
irrelevancies and issues that are off limits or cannot
possibly be addressed or acted upon by this team.
2. Makes the topic visible, selects recorder
3. Reviews brainstorming rules: State ideas briefly. build on
recorded ideas and all ideas are recorded.
40
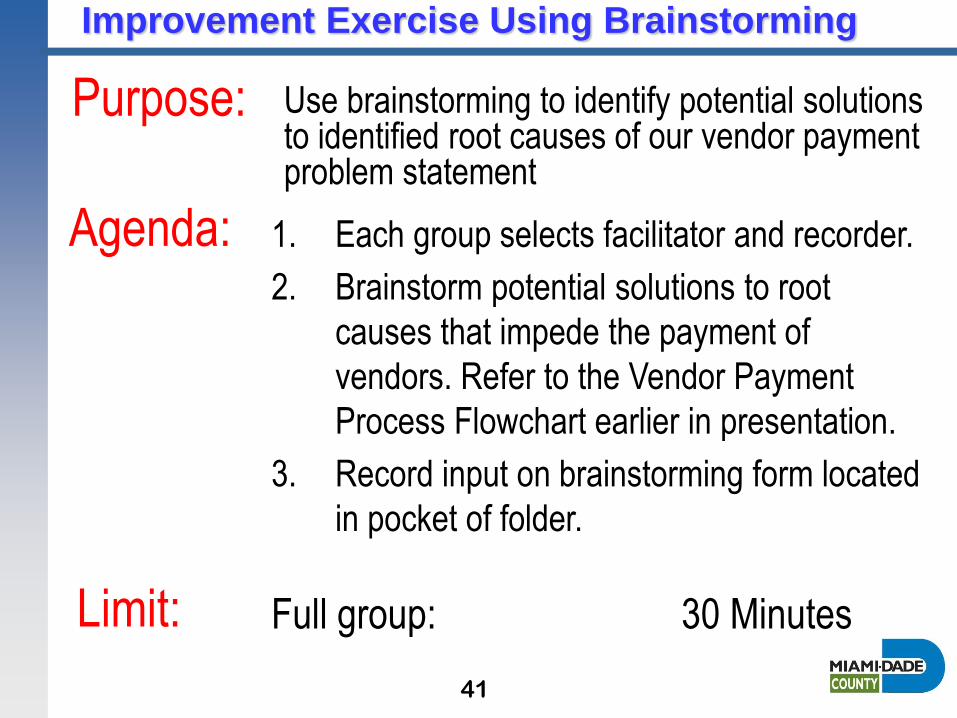
Improvement Exercise Using Brainstorming
Use brainstorming to identify potential solutions to identified root causes of our vendor payment problem statement
Full group: 30 Minutes
Purpose:
Limit:
Agenda: 1. Each group selects facilitator and recorder.
2. Brainstorm potential solutions to root
causes that impede the payment of
vendors. Refer to the Vendor Payment
Process Flowchart earlier in presentation.
3. Record input on brainstorming form located
in pocket of folder.
41
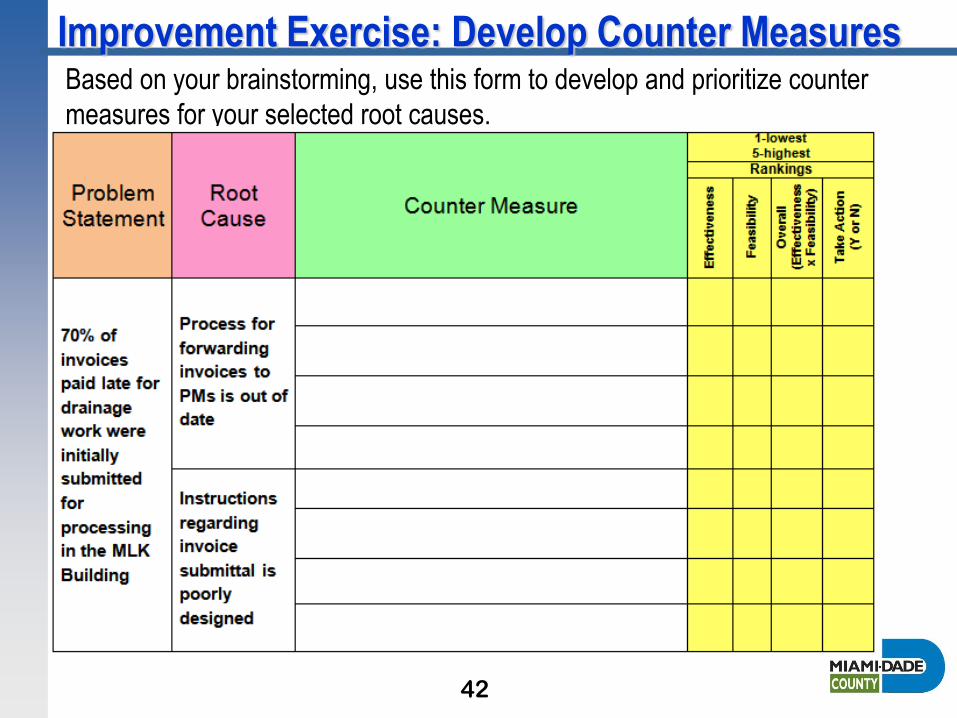
42
Improvement Exercise: Develop Counter Measures Based on your brainstorming, use this form to develop and prioritize counter
measures for your selected root causes.
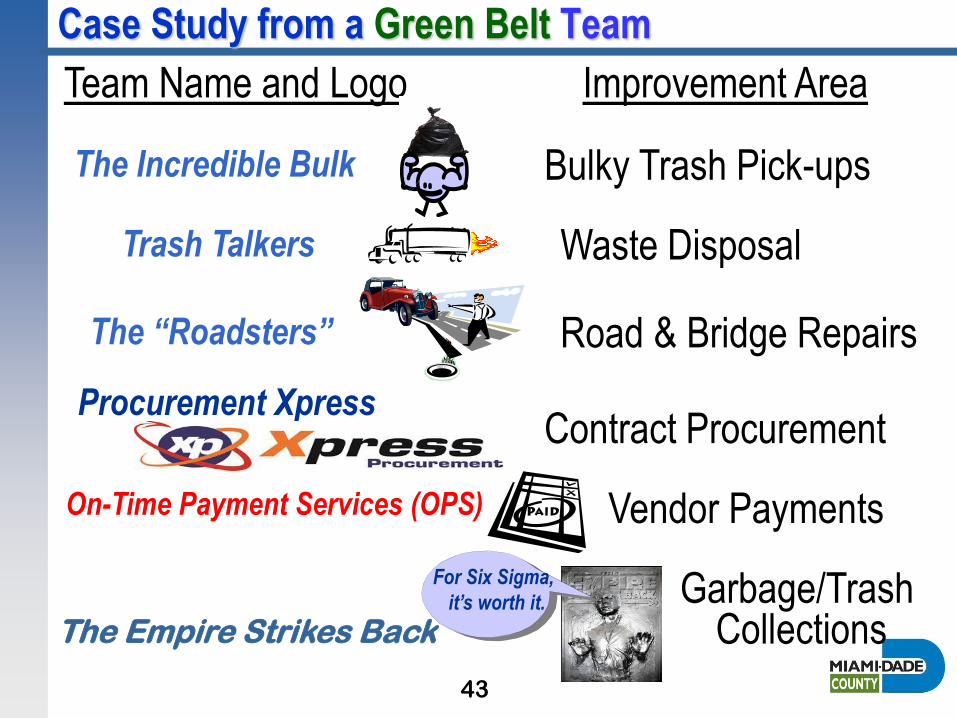
Case Study from a Green Belt Team
Team Name and Logo Improvement Area
The Incredible Bulk Bulky Trash Pick-ups
Waste Disposal
Road & Bridge Repairs
Contract Procurement
Vendor Payments
Garbage/Trash Collections
Trash Talkers
The “Roadsters”
On-Time Payment Services (OPS)
For Six Sigma,
it’s worth it.
The Empire Strikes Back
Procurement Xpress
43
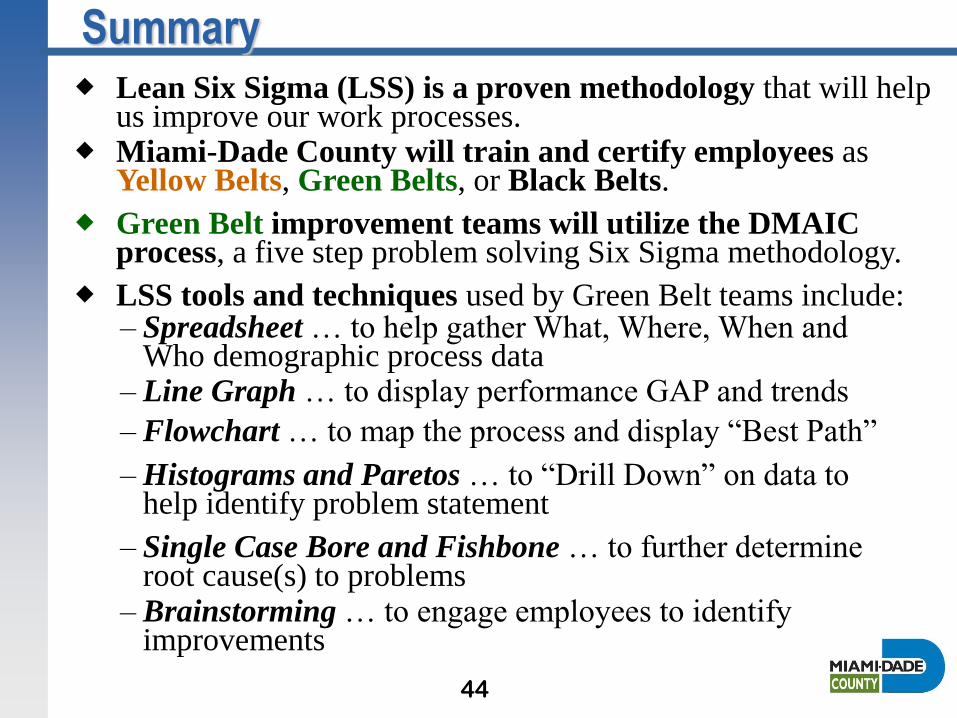
Miami-Dade County will train and certify employees as Yellow Belts, Green Belts, or Black Belts.
Green Belt improvement teams will utilize the DMAIC process, a five step problem solving Six Sigma methodology.
LSS tools and techniques used by Green Belt teams include: – Spreadsheet … to help gather What, Where, When and
Who demographic process data
Lean Six Sigma (LSS) is a proven methodology that will help us improve our work processes.
Summary
– Line Graph … to display performance GAP and trends
– Histograms and Paretos … to “Drill Down” on data to help identify problem statement
– Flowchart … to map the process and display “Best Path”
– Brainstorming … to engage employees to identify improvements
44
– Single Case Bore and Fishbone … to further determine root cause(s) to problems
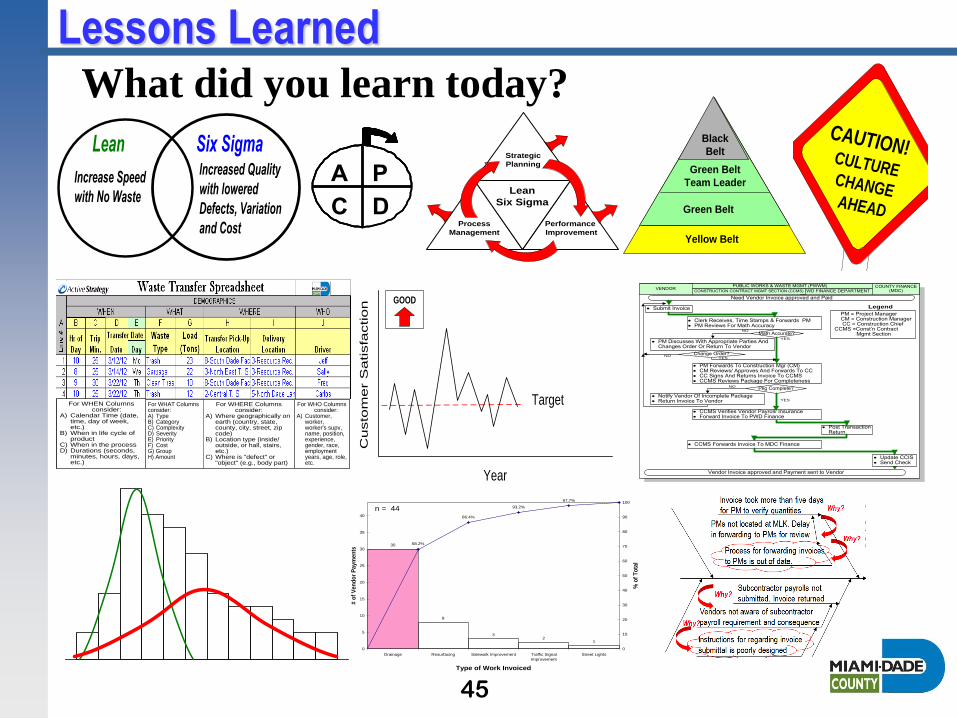
Lessons Learned
CAUTION!CULTURECHANGEAHEAD
Target
GOOD
Cu
sto
me
r S
atisfa
ctio
n
Year
Strategic
Planning
Performance
Improvement
Process
Management
Lean
Six Sigma
What did you learn today?
Yellow Belt
Green Belt
Black
Belt
Green Belt
Team Leader
Six SigmaIncreased Quality
with lowered
Defects, Variation
and Cost
Lean
Increase Speed
with No Waste
A P
C D
For WHO Columns consider:
A) Customer, worker, worker's supv, name, position, experience, gender, race, employment years, age, role, etc.
For WHERE Columnsconsider:
A) Where geographically on earth (country, state, county, city, street, zip code)
B) Location type (inside/outside, or hall, stairs, etc.)
C) Where is "defect" or "object" (e.g., body part)
For WHAT Columnsconsider:A) TypeB) CategoryC) ComplexityD) SeverityE) PriorityF) CostG) GroupH) Amount
For WHEN Columns consider:
A) Calendar Time (date, time, day of week, etc.)
B) When in life cycle of product
C) When in the processD) Durations (seconds,
minutes, hours, days, etc.)
30
8
32
1
97.7%
93.2%
86.4%
68.2%
0
5
10
15
20
25
30
35
40
Drainage Resurfacing Sidewalk Improvement Traffic Signal
Improvement
Street Lights
Type of Work Invoiced
# o
f V
en
do
r P
ay
me
nts
0
10
20
30
40
50
60
70
80
90
100
% o
f T
ota
l
n = 44
Need Vendor Invoice approved and Paid
Vendor Invoice approved and Payment sent to Vendor
COUNTY FINANCE (MDC)
· Clerk Receives, Time Stamps & Forwards PM· PM Reviews For Math Accuracy
PUBLIC WORKS & WASTE MGMT (PWWM)
· PM Discusses With Appropriate Parties And Changes Order Or Return To Vendor
Math Accurate?
PWD FINANCE DEPARTMENT
· Submit Invoice
· PM Forwards To Construction Mgr (CM)· CM Reviews/ Approves And Forwards To CC· CC Signs And Returns Invoice To CCMS· CCMS Reviews Package For Completeness
VENDOR
NO
YES
Pkg Complete?
· Post Transaction Return
CONSTRUCTION CONTRACT MGMT SECTION (CCMS)
Change Order?YES
NO
YES
NO
· Notify Vendor Of Incomplete Package· Return Invoice To Vendor
· CCMS Verifies Vendor Payroll/ Insurance · Forward Invoice To PWD Finance
· CCMS Forwards Invoice To MDC Finance
PM = Project Manager CM = Construction Manager CC = Construction Chief CCMS =Const’n Contract Mgmt Section
Legend
· Update CCIS· Send Check
45
Congratulations!
Lean Six Sigma Yellow Belt
This is to certify that
I. M. EmployeeIs a Yellow Belt and has completed
6 Hours of Analytical Tools And
Techniques Training
2013
_______________________________ _________________________________
Instructor Miami-Dade
H I S T O G R A M
P A R E T O
L I N E G R A P H GOOD
M A N A G E M E N T R E P O R T
DEMOGRAPHICS MILESTONESDURA-TION OUTCOMES
C e r t i f i e d
46
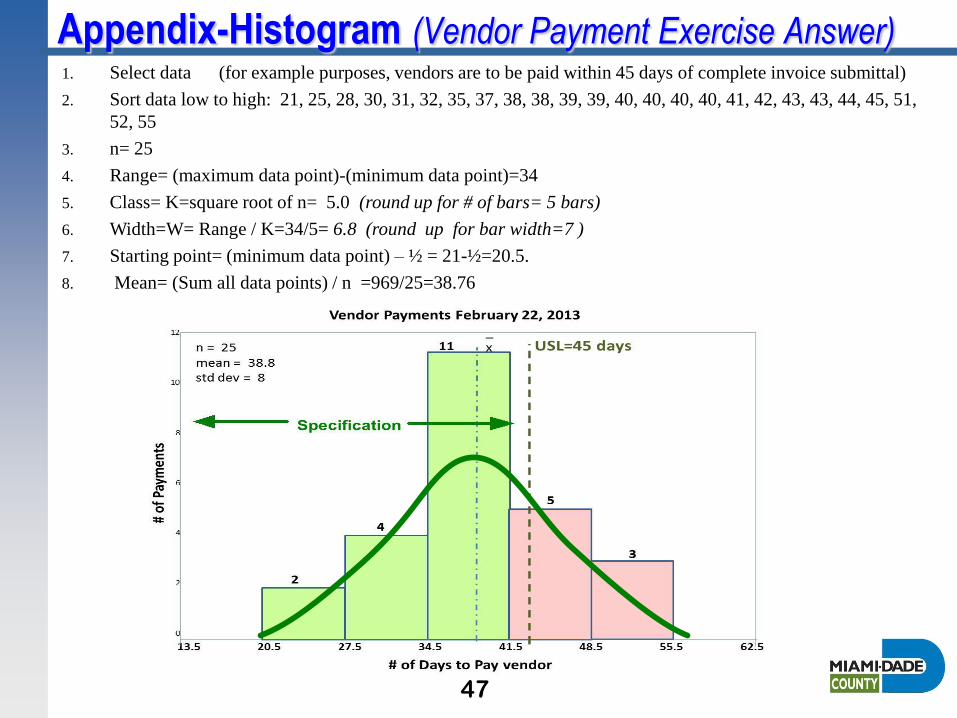
Appendix-Histogram (Vendor Payment Exercise Answer) 1. Select data (for example purposes, vendors are to be paid within 45 days of complete invoice submittal)
2. Sort data low to high: 21, 25, 28, 30, 31, 32, 35, 37, 38, 38, 39, 39, 40, 40, 40, 40, 41, 42, 43, 43, 44, 45, 51,
52, 55
3. n= 25
4. Range= (maximum data point)-(minimum data point)=34
5. Class= K=square root of n= 5.0 (round up for # of bars= 5 bars)
6. Width=W= Range / K=34/5= 6.8 (round up for bar width=7 )
7. Starting point= (minimum data point) – ½ = 21-½=20.5.
8. Mean= (Sum all data points) / n =969/25=38.76
47