
mhhdc.orgmhhdc.org/wp-content/themes/mhdc/reports/HDRSA 2003.pdf · Great Clarendon Street, Oxford...
216
Published for The Mahbub ul Haq Human Development Centre HUMAN DEVELOPMENT IN SOUTH ASIA 2003 THE EMPLOYMENT CHALLENGE
Transcript of mhhdc.orgmhhdc.org/wp-content/themes/mhdc/reports/HDRSA 2003.pdf · Great Clarendon Street, Oxford...
Published for
The Mahbub ul Haq Human Development Centre
HUMAN DEVELOPMENTIN SOUTH ASIA 2003THE EMPLOYMENT CHALLENGE
Great Clarendon Street, Oxford OX2 6DP
Oxford University Press is a department of the University of Oxford.It furthers the University’s objective of excellence in research, scholarship,
and education by publishing worldwide in
Oxford New YorkAuckland Bangkok Buenos Aires Cape Town Chennai
Dar es Salaam Delhi Hong Kong Istanbul Karachi KolkataKuala Lumpur Madrid Melbourne Mexico City Mumbai Nairobi
São Paulo Shanghai Taipei Tokyo Toronto
Oxford is a registered trade mark of Oxford University Pressin the UK and in certain other countries
© Oxford University Press 2004
The moral rights of the author have been asserted
First published 2004
All rights reserved. No part of this publication may be reproduced, translated,stored in a retrieval system, or transmitted, in any form or by any means,
without the prior permission in writing of Oxford University Press.Enquiries concerning reproduction should be sent to
Oxford University Press at the address below.This book is sold subject to the condition that it shall not, by way
of trade or otherwise, be lent, re-sold, hired out or otherwise circulatedwithout the publisher’s prior consent in any form of binding or cover
other than that in which it is published and without a similar conditionincluding this condition being imposed on the subsequent purchaser.
ISBN 0 19 597803 X
Desktop Composition: Jawaid Iqbal
Cover Design: Adeel Afsar Raja
Photographs by: UNICEF photographers (clockwise from top left):Asad Zaidi; Unknown; Shehzad Noorani; Mami Lama
Typeset in GaramondPrinted in Pakistan byMas Printers, Karachi.
Published byAmeena Saiyid, Oxford University Press
Plot No. 38, Sector 15, Korangi Industrial Area, PO Box 8214Karachi-74900, Pakistan.
ADB Asian Development Bank
AoA Agreement on Agriculture
APPNA Association of Pakistani Physicians in NorthAmerica
ATC Agreement on Textile and Clothing
BDS Business Development Services
BEPZA Bangladesh Export Processing Zones Authority
BGMEA Bangladesh Garments Manufacturer’s andExporter’s Association
BoI Board of Investment
BYST Bharatiya Yuva Shakti Trust
CAA Civil Aviation Authority
CCACR Conference Committee on the Application ofConventions and Recommendations
CEACR Committee of Experts on the Application ofConventions and Recommendation
CRC Convention on the Rights of the Child
CVD Countervailing Duties
DFI Development Finance Institute
DIP Double Income Project
DSB Dispute Settlement Body
EDI Entrepreneurship Development Institute
EPF Equity Participation Fund
EPZ Export Processing Zones
EPZA Export Processing Zone Authority
EPZAO Export Processing Zones Authority Ordinance
EPZR Export Processing Zones Rules
EU European Union
FDI Foreign Direct Investment
FTZ Free Trade Zones
GATS General Agreement on Trade and Services
GATT General Agreement on Tariff and Trade
GDI Gender Development Index
GEFONT General Federation of Nepalese Trade Union
GEM Gender Empowerment Measure
GER Gross Enrollment Ratio
HDR Human Development Report
ICFTU International Confederation of Free Trade Unions
ICT Information and Communication Technology
IDBP Industrial Development Bank of Pakistan
IIT Indian Institute of Technology
ILO International Labour Organization
IMF International Monetary Fund
IPA Indian Patent Act
IPEC International Program on the Elimination of ChildLabour
IRO Industrial Relations Ordinance
ISP Internet Service Provider
IT Information Technology
LFPR Labour Force Participation Rate
MFA Multi Fiber Agreement
MFN Most Favored Nation
ABBREVIATIONS
MNE Multinational Enterprises
MOU Memorandum of Understanding
M&A Mergers and Acquisitions
NAFTA North America Free Trade Area
NBIA National Business Incubators Association
NDFC National Development Finance Co-operation
NFE Non-formal Education
NGO Non Governmental Organization
NRF National Renewable Fund
NRSP National Rural Support Program
NSS National Sample Survey
NTB Non Tariff Barriers
ODA Official Development Assistance
OECD Organization for Economic Co operation andDevelopment
PCMEA Pakistan carpet Manufacturers and ExportersAssociation
PIA Pakistan International Airlines
PPP Purchasing Power Parity
QR Quantitative Restriction
RDFC Regional Development and FinanceCo-operation
RETTP Radio Education Teacher Training Program
RMG Ready Made Garments
SAARC South Asian Association for RegionalCo-operation
SBFC Small Business Finance Co-operation
SCCI Sialkot Chambers of Commerce and Industry
SCM Subsidies and Countervailing Measure
SEWA Self Employed Women Association
SEZ Special Economic Zones
SIMAP Surgical Instrument Manufacturers Association ofPakistan
SME Small and Medium Scale Enterprises
SNA System of National Accounts
SPS Sanitary and Phytosanitary Measure
T&C Textile and Clothing
TRIM Trade Related Investment Measures
TRIPS Trade Related Intellectual Property Rights
TSE Total Support Estimate
UN United Nations
UNCTAD United Nation Conference on Trade andDevelopment
UNDP United Nations Development Programme
UNICEF United Nations Children’s Fund
UR Uruguay Round
USAID United States Agency for International Development
WTO World Trade Organization
YIPS Youth Investment Promotion society
iv Human Development in South Asia 2003
Foreword v
This report is about the challenge oflivelihoods in South Asia. In this region,as in most developing countries, theissues of employment, unemployment,underemployment, and all forms offorced labour and child labour areconnected to the question of survival ofthe majority of population. The formal,organised sector that is concerned withemployment, unemployment, wages andlabour laws includes only about 10 percent of the labour force. The other90 per cent is engaged in the vast informalsector in rural, urban and peri-urbanareas. This is where South Asia’semployment challenge lies. And this iswhere the issue of poverty needs to beaddressed with adequate policy attention.This report argues that to date sufficientpolicy focus is not being given to thischallenge in South Asia.
Despite various initiatives taken bySouth Asian governments during the lastfew decades, including directed andmicro-credit, and specific employmentprogrammes to enhance job oppor-tunities, the employment situation has notimproved. The report argues that this ismostly the result of the economic reformprogrammes implemented in the 1990saimed at making the economies morecompetitive and open to the process ofglobalisation. While these reformprogrammes were needed to improve theproductivity of the economies, and whilethese have improved the exports of someproducts, the balance sheets of gains andlosses during the last few years have beenheavily tilted against the livelihoodchallenges of the majority of the SouthAsians. While the metropolitan cities haveexpanded and become the engine of manynew enterprises, the rural areas havesuffered and, as a result, the rural to
Foreword
urban migration has created a nightmarefor public services in urban areas. Thecrumbling infrastructure, inadequateprovision of health, education and waterin urban slums are leading to adeterioration in the human condition. Theproductivity of workers is criticallydependent on the provision of theseservices. Yet governments are unable tocater to these needs. Thus our majorconcern in this report has been to look atthe employment challenge from thevantage point of the majority of peoplewho are getting bypassed by theeconomic growth and sidelined bypolicies.
The central part of this report isdevoted to analysing where the greatestproblems lie and what needs to be doneto reorient economic policies towards ajob-led growth strategy that has been triedin East Asia with success. Our purposehas been to analyse the economic growththat has been associated with the recentreform programmes, and its impact onemployment and human development inSouth Asia. Our efforts, however, havebeen constrained by the lack ofavailability of data on employment andunemployment, particularly in theinformal sector. The methodological andconceptual issues regarding what isincluded in employment statisticspresented additional problems. Everysource of data gives different numbersbased on different methodology anddefinitions used.
The Report presents the experienceof the seven (depending on dataavailability) South Asian countries: India,Pakistan, Bangladesh, Nepal, Sri Lanka,Bhutan, and Maldives. The questions theReport raises and tries to answer are:What has been the experience of South
vi Human Development in South Asia 2003
Asian countries in raising economicgrowth with employment? Why have thereasonable levels of economic growthachieved during the 1990s failed toreduce unemployment and under-employment, improve humandevelopment, and reduce South Asia’spoverty? What is the appropriate role ofthe state in a labour-intensive growthstrategy? Can the South Asiangovernments play an efficient andequitable role in an employment-generating industrial and agriculturalstrategy as an engine of South Asia’seconomic growth? And, what should bethe role of the multilateral institutionssuch as WTO, and IMF and WorldBank, as well as the developed countries,to truly make the global trading regimemore equitable and sensitive to the needsof poor people and poor nations?
The Report consists of nine chapters,in addition to the Overview. Chapter 1introduces the theme of this year’s Reportby presenting a conceptual framework foremployment and human development.Chapter 2 provides a statistical profile ofSouth Asia’s employment. Chapter 3analyses the macroeconomic policies ofSouth Asian countries and their impacton employment and poverty reduction.Chapter 4 presents an in-depth overviewof the implementation of WTO rules inSouth Asia and its effect on employmentin three particular sectors—agriculture,textiles and clothing, and services.Chapter 5 profiles the gender picture inSouth Asia’s labour market. Chapter 6addresses the issues of education andtraining in the context of labour marketdemand. Chapter 7 analyses the rights ofworkers in South Asia. Chapter 8explores, in the context of demographicasymmetry between developing anddeveloped countries, a solution to SouthAsia’s employment problem by exportingits labour to developed countries. Andfinally, in Chapter 9, the report proposesan agenda that identifies some policyimperatives required at national,
international and multilateral institutionallevels to combine growth in South Asiawith employment and humandevelopment.
This Report would not have beencompleted without the active support oftwo members of the MHHDC Board:Shahid Javed Burki and Farid Rahman.Shahid Javed Burki wrote two chapters,and Farid Rahman, as Acting Presidentof the Centre during my absence fromIslamabad, looked after the day to dayrunning of the Centre and guided theresearch staff. I am deeply grateful toboth of them.
The Report has benefitedtremendously from the backgroundpapers prepared by Jayati Ghosh andParthapratim Pal, both from India.Rashed Amjad of ILO provided much-needed documents and advice. I amgrateful to them for their criticalcontributions.
I gratefully acknowledge thecontribution of Canadian InternationalDevelopment Agency (CIDA) for itsconsistent support of the Centre. CIDAhas been on the forefront in supportingand advocating for the cause of socialjustice in South Asia, as well as in otherdeveloping regions. I would also like toput on record my very grateful thanks toNorwegian Agency for InternationalDevelopment (NORAD) and UNDP fortheir continuing financial support for theCentre’s annual report. As always, thereport has benefited from the field officesof UNDP in South Asia. I am particularlygrateful to Önder Yücer, BrendaMcSweeney and Henning Karcher,UNDP Representatives in Pakistan, Indiaand Nepal.
The small research team at the Centreworked hard and for long hours tocomplete this Report. The teamconsisting of Feyza Arman Bhatti, UmaraAfsar, Muhammad Daud Munir andMohammad Ali Raja collected andcompiled data and prepared tables andcharts, besides preparing background
Foreword vii
IslamabadKhadija Haq15 November 2003 Khadija Haq
Team for the preparation of the 2003 Report
Coordinator and lead author: Khadija Haq
Acting President: Farid Rahman(during the preparation of this Report)
Panel of Consultants
Shahid Javed Burki (Pakistan)Jayati Ghosh (India)Pathapratim Pal (India)Mohammed Irfan (Pakistan)
With the assistance ofMalia Asim
HDC Research Team
Feyza Arman BhattiUmara AfsarMohammad Ali RajaMuhammad Daud MunirTaha Mustafa
papers. I must recognise in particular Dr.Mohammed Irfan for supervising theresearch staff at the early stage of thepreparation of the Report. My specialthanks go to Taha Mustafa for composing
and designing the report, and Malia Asimfor handling the administrative details.I am also grateful to Rana GhulamShabbir and Sibte Hasan for overseeingthe management of the Centre.
viii Human Development in South Asia 2003
The preparation of this Report owes agreat deal to many individuals andorganisations. The financial support forthe Report was provided by the CanadianInternational Development Agency(CIDA), Norwegian Agency forInternational Development (NORAD),and UNDP. Without the steady supportof CIDA, NORAD and UNDP it wouldhave been impossible to sustain thisimportant work. We are also grateful tothe field offices of UNDP in variousSouth Asian countries for their invaluablehelp in organising the launch of theCentre’s reports. All these financial,technical and moral support are gratefullyacknowledged.
Several national, regional andinternational institutions shared theirresearch materials and data with theMHHDC team. The Report benefitedfrom the data provided by the Pakistanoffices of UNESCO, International
Acknowledgements
Labour Organisation, United NationsChildren’s Fund, United NationsDevelopment Programme, UnitedNations Information Centre and TheWorld Bank. We are grateful to thefollowing Pakistani institutions: FederalBureau of Statistics and Pakistan Instituteof Development Economics (PIDE). Thekind assistance provided by the librariansof the World Bank (Pakistan), UNDP(Pakistan), UNICEF (Pakistan), andPIDE are also acknowledged. Theresearch team is grateful to AnilDeolalikar, Sabur Ghayur, Kyungjig Songand Armand Rousselot for their valuableadvice during the preparation of thisReport.
We are always thankful to the OxfordUniversity Press, Pakistan for theprofessional manner in which they handlethe publication of our report. We wish tothank particularly Ameena Saiyid for herown special commitment to this project.
Foreword ix
About the Mahbub ul Haq Human Development Centre
Mahbub ul Haq Human Development Centre was set up in November 1995 in Islamabad, Pakistan by the lateDr. Mahbub ul Haq, founder and chief architect of UNDP Human Development Reports. With a special focus onSouth Asia, the Centre is a policy research institute and think tank, committed to the promotion of the humandevelopment paradigm as a powerful tool for informing people-centered development policy nationally and regionally,in order to reduce human deprivation.
The Centre organises professional research, policy studies and seminars on issues of economic and social developmentas they affect people’s well being. Believing in the shared histories of the people of this region and in their shareddestinies, Dr. Haq was convinced of the need for cooperation among the seven countries of the region. His visionextended to a comparative analysis of the region with the outside world, providing a yardstick for the progress achievedby South Asia in terms of socio-economic development. The Centre’s research work is presented annually through aReport titled, Human Development in South Asia.
Continuing Mahbub ul Haq’s legacy, the Centre provides a unique perspective in three ways: first, by analysing theprocess of human development, the analytical work of the Centre puts people at the centre of economic, political andsocial policies; second, the South Asia regional focus of the Centre enables a rich examination of issues of regionalimportance; and third, the Centre’s comparative analysis provides a yardstick for the progress and setbacks of SouthAsia vis-à-vis the rest of the world.
The current activities of the Centre include: preparation of annual reports on Human Development in South Asia;preparation and publication of a journal, Mahbub ul Haq Human Development Review; preparation of policy papers andresearch reports on poverty reduction strategies; organisation of seminars and conferences on global and regionalhuman development issues, South Asian cooperation, peace in the region and women’s empowerment. The Centre alsoorganises an annual Mahbub ul Haq Memorial Seminar and a Mahbub ul Haq Lecture.
President Board of AdvisorsKhadija Haq Sartaj Aziz
Fateh ChaudhriBoard of Governors Meghnad DesaiShahid Javed Burki Parvez HasanSahabzada Yaqub Khan Enrique IglesiasAmir Mohammad Attiya InayatullahMoeen Qureshi Javed JabbarSaeed Qureshi Devaki JainFarid Rahman Lal JayawardenaNafis Sadik A. R. KemalQaiser Ahmad Shaikh Gustav Ranis
Wasim SajjadFrances StewartPaul StreetenMaurice Strong
Mahbub ul Haq Human Development Centre42 Embassy Road, G-6/3, Islamabad, Pakistan.
Tel: 92-51-2271228. Fax: 92-51-2822794.e-mail: [email protected] website: www.un.org.pk/hdc

x Human Development in South Asia 2003
Contents xi
Contents
Overview 1
Chapter 1Working out of Poverty: A Conceptual Framework 13
Chapter 2A Profile of Employment Challenges in South Asia 22The magnitude of employment challenges 22Characteristics of South Asia’s labour market 25Characteristics of South Asian economy 28
Chapter 3Economic Growth and Employment in South Asia 30Economic growth and employment: The conceptual issues 30Growth, employment and poverty in South Asia: Experiences of countries 32Economic policies and employment 46Policy implications 52
Chapter 4WTO Rules and Employment in South Asia 55Unfulfilled promises of WTO 56Trade liberalisation and employment in developing countries 57Agreement on Agriculture and its impact on employment 59WTO Agreement on Textiles and Clothing (ATC) 64Other manufacturing goods 68GATS and employment 71WTO and South Asia: Concluding remarks 78
Chapter 5Gender Discrimination in Employment 80Women in labour force 80Counting women’s work 82Gender discrimination in employment 83Policy implications 90
Chapter 6Education, Skill-training and Employment in South Asia 91The state of education in South Asia 91Technical and vocational education 95Developing entrepreneurship as a way to promote employment 100Potential of ICT for employment generation in South Asia 103Policies for promoting education and training for employment 106
xii Human Development in South Asia 2003
Chapter 7Rights of Workers in South Asia 108International regulatory system 108Core labour standards in South Asia 110Fundamental rights and their enforcement in South Asia 110Impact of globalization on workers’ rights 122
Chapter 8Population Growth, Employment and Emigration 127Emigration as a safety valve 127Demographic asymmetry 131Demographic decline and possible loss of economic dynamism indeveloped countries 136Migration from developing countries as a compensation for population declines indeveloped countries 138Developing countries: Turning large populations into economic assets 144Conclusion 146
Chapter 9Towards Growth with Employment and Human Development 148Employment-intensive growth pattern 150Improved programme of education and skill training 152Reduction of gender gaps in education, skill-training and employment 152Protection of workers’ rights 153Equitable trade policies 154
Notes 159References 163
Statistical Profile of Employment in South Asia 175Human Development Indicators for South Asia 183Key to Indicators 198
Contents xiii
Boxes2.1 Employment statistics: How reliable are they? 234.1 Phasing out of MFA 654.2 Impact of TRIPS on pharmaceutical industry in India 725.1 Home-based women workers and export earnings 876.1 A successful vocational and technical training system 976.2 Training systems of the world 976.3 Responsibility for TVE in South Asia: A fragmented scene 986.4 Distance education and training 986.5 Need for retraining after privatisation 996.6 Rise and fall of Development Finance Institutions (DFIs) in Pakistan 1016.7 Lessons from four successful programmes for increasing employment in rural
areas in South Asia 1016.8 Bharatiya Yuva Shakti Trust (BYST): An initiative to help new
entrepreneurs 1026.9 Entrepreneurial cities: Surat and Sialkot 1036.10 Poor people of South Asia and ICT 1047.1 UN instruments to protect rights of people 1087.2 Discrepancies between the national law and the Conventions 1127.3 EPZs and freedom of association in South Asia 1157.4 South Asian project against debt bondage 1167.5 Kamaiya system in Nepal 1177.6 SAARC initiative to combat child trafficking 1217.7 ILO-IPEC in Pakistan 123
Tables2.1 Population of South Asia 222.2 Population growth rates 222.3 Trends in labour force participation rates by regions 232.4 Labour force participation rates for the 15-64 age group 242.5 Unemployment rates by regions, 2001 242.6 Annual growth rates of employment, LFPR and GDP 242.7 Employment in South Asia by sectors 252.8 Key human development indicators 252.9 Unemployment rates, 1999-2001 262.10 Economic indicators in South Asia, 1980-2001 292.11 Annual average GDP growth in South Asia, 1980-2000 293.1 Average annual rates of growth of GDP (at factor cost) in India,
1980-2001 333.2 Sector average annual growth rates of GDP in India, 1971-2000 333.3 Growth rates of employment in India, 1983-2000 343.4 Annual growth rates of aggregate employment
in India, 1991-2001 343.5 Employment elasticity of output growth in India, 1983-2000 353.6 Growth rates of employment in organised and unorganised manufacturing
in India, 1993-94 and 1999-2000 363.7 Trends in poverty in India, 1977-2000 383.8 Growth rates of output, employment and productivity in Pakistan,
1970-1990s 403.9 Trends in poverty in Pakistan, 1969-99 413.10 Sector shares of GDP in Bangladesh, 1980-2000 423.11 Sector shares of employment in Bangladesh, 1980-2000 42
xiv Human Development in South Asia 2003
3.12 GDP and employment growth in Sri Lanka, 1971-99 433.13 Sector shares of GDP in Sri Lanka, 1980-1999 443.14 Poverty estimates in the 1990s in Sri Lanka 443.15 Labour force participation and employment structure in Nepal, 1995-96
and 1998-99 454.1 Trade in goods to GDP ratio, 1990 & 2001 554.2 Employment and output growth rate in agricultural sector in South Asia,
1990-2000 614.3 Total support estimates given to agriculture in OECD countries 624.4 Schedule of quota integration and growth uplift under the WTO
transition phase 654.5 Implementation of ATC (Pace of quota phase-out) 664.6 Post Uruguay Round average tariff by sectors 664.7 Employment in the pharmaceutical industry 724.8 Average annual growth of services and merchandise trade, 1990–99 744.9 Workers’ remittances as a percentage of GDP, 1999-2002 775.1 Some indicators of female participation in economic activity and employment
in South Asia and selected regions of the world, 1995-2001 805.2 Female labour force participation rate as a percentage of male in South Asia,
1980-2000 815.3 Female-male gaps in education in South Asia, 2000-01 815.4 Female and male unemployment rates in selected South Asian countries,
1990-2000 815.5 Unemployment by educational levels in Bangladesh, 1995-96 825.6 Unemployment rates by education levels in Pakistan, 1999-2000 825.7 Unemployment rates by education levels in Sri Lanka, 2002 825.8 Unemployment rates among the educated in India, 1999-2000 825.9 Labour force participation rate of women in Pakistan by old and new
definitions, 1999-2000 835.10 Labour force participation rate in Bangladesh by conventional and extended
definitions, 1996 835.11 Employment by sectors in South Asia (age 10+), 1980-99 845.12 Self employment as percentage of non-agricultural employment,
1980-2000 855.13 Percentage distribution of non-agricultural self-employment by sector in
South Asia, 1990/2000 865.14 Self-employment as a percentage of non-agricultural employment,
1980-2000 865.15 Percentage of regular and casual employees in total employment in India by
locality and sex 865.16 Percentage of casual labour in total employment in Bangladesh 865.17 Women in South Asian economy, 2001 875.18 Estimated wage differentials between women and men (PPP US $)
in 2001 885.19 Employment status of workers in South Asian countries, 1995-2000 886.1 Enrolment and literacy in selected regions of the world, 2000 926.2 Trend of literacy and enrolment in South Asia, 1990-2001 926.3 Gross enrolment ratios in South Asia, 1990-1 and 1999-2000 936.4 Pupil-Teacher ratios in selected regions of the world 936.5 Repetition rate by grade in primary education in selected Asian countries,
1999-2000 946.6 Public expenditure on education as % of GDP 94
Contents xv
6.7 Trends of public expenditure on education by levels 946.8 Unemployment rates by levels of education in Sri Lanka 956.9 Unemployment rates by levels of education in Pakistan 956.10 Unemployed youth (aged 15-25) by education level in India, 1997 956.11 Vocational education enrolment as per cent of total secondary enrolment
by regions 966.12 Population having electricity in selected regions of the world 1026.13 Electricity production and access to electricity 1026.14 National entrepreneurship framework conditions in India, 2001 1047.1 Ratification of the ILO Fundamental Conventions by date 1107.2 Economically active children (aged 5-14) by regions, 2000 1187.3 Children 10-14 in the South Asian labour force (% of age group)
in 1980 & 2000 1187.4 Number of strikes and lock-outs, 1992-2001 1237.5 Trends in days not worked 1247.6 Trends in workers involved 1248.1 Capital flows to developing countries 1308.2 Population projections from 2000 1348.3 World’s largest countries now and in 2050 1348.4 Percentage of population 65 and above (projected) 1358.5 Age profiles of populations of US and Pakistan 1368.6 Population change in selected developed countries, 2000-2050 1368.7 Changes in the proportion of population over 60 in selected
advanced countries 1378.8 Public pension expenditure in the different OECD countries 1388.9 Foreign or foreign-born population in selected OECD countries 1398.10 Countries of origin for the five largest migrant receiving nations,
1997-98 1408.11 Foreign and national adult populations classified by level of education in
selected OECD countries, 1995-98 1418.12 Immigration by eligibility category in selected OECD countries 145
Figures2.1 Distribution of population by age groups, 2001 232.2 Inequality in income distribution, 1995-2000 294.1 Trade in goods to GDP ratio for selected South Asian countries,
1990 & 2001 554.2 Trend in unemployment rates in selected South Asian countries 584.3 Employment in agriculture as a percentage of total employment in
South Asian countries, 1995-99 594.4 IMF’s index of non-fuel primary commodities (1995=100) 624.5 Share of exports of textiles and clothing in total exports in selected South
Asian countries, 2000 644.6 Composition of Pakistan’s exports, 1994 and 2000 694.7 Composition of Bangladesh’s exports, 1992 and 1998 694.8 Value added in services as a % of GDP in selected
South Asian countries, 2000 724.9 Employment in services as a % of total employment in South Asian
countries, 2000 734.10 Top 20 developing-country recipients of workers’ remittances, 2001 776.1 Share of South Asia in world population and adult illiteracy 916.2 Trends in literacy rates in South Asia, 1990-2001 92
xvi Human Development in South Asia 2003
6.3 Trends in primary gross enrolment 1980-2000 936.4 Average years of schooling for the selected countries of
South Asia, 2000 946.5 Male and female gaps in gross primary enrolment ratio, 1998-2001 94
Overview 1
Overview
Employment in South Asia, in fact inmost developing countries, is not aboutpaid jobs or even about the rate ofunemployment. These indicators are nottruly expressive of the way of life that isdominated by informal, casual and home-based work, mostly in agricultural or ruralsettings, and intricately woven into thedaily survival issues of the majority ofpopulation. Therefore, in the context ofSouth Asia, when we discuss employ-ment, we are really referring to challengesof livelihood—the challenges that formthe basic concern for human security. Infact, employment is one area where thethree components of a human-centredpolicy—human development, humansecurity and human rights—converge.Article 23 of the Universal Declarationof Human Rights states that, ‘everyonehas the right to free choice ofemployment, to just and favourableconditions of work, and to protectionagainst unemployment.’ Mahbub ul Haqinterpreted human security as ‘security ofall the people everywhere—in theirhomes, in their jobs, in their communities,in their environment’ (italics added).These ideals have provided the inspirationand courage for this report.
In keeping with the tradition of theCentre’s previous reports, we haveanalysed the issues of employment fromthe vantage point of people. Throughoutthe report concerns are raised about thepatterns of growth and trade, the systemsof education and training, the protectionof the rights of all workers, includingwomen and children, and theimplementation of the global trading rulesas they impact on poor nations and poorpeople. The overwhelming concern of thereport is the employment security of thepoor and an improvement in theircapability to move out of poverty. The
promotion of employment opportunityfor the youth of the region is animperative, as is the need to enhancewomen’s ability to get paid jobs withenforceable legal and social protectionagainst discrimination.
The main problem in analysing theissues of employment, unemploymentand the dynamics of the labour market inSouth Asia is the non-availability ofreliable and comparable statistics. As thelabour market is dominated by theinformal sector with casual and family-based workers, the collection andcompilation of data concerningemployment in these sectors becomes aformidable task. Added to these is thefact that the concepts and definitions ofemployment, unemployment andunderemployment vary among countriesand within a country over time. There is,therefore, a need for caution in drawingconclusions from the labour marketstatistics.
However, we have tried to be ascareful as possible in preparing the tablescontaining data on all facets ofemployment in South Asia. We have alsobeen very cautious in interpreting thesedata and deriving policy implications.Based on our analysis, the report comesup with the following messages:
The first message is that without aserious commitment to employmentgeneration and human development,economic growth is neither sustainablenor deliverable in a socially just manner.This strong imperative of growth withsocial justice has consistently beenstressed and highlighted in all ourprevious reports.
Secondly, South Asian workers,particularly those in the small-scaleindustrial and agricultural enterprises,have been adversely affected as a result
Without a seriouscommitment toemploymentgeneration andhuman development,economic growth isneither sustainablenor deliverable in asocially just manner
2 Human Development in South Asia 2003
of the opening up of the regionaleconomies to the global markets. Despitegains in employment in textiles andclothing, and in the high-technologysectors, the majority of workers in ruralareas and those in traditionalmanufacturing, have suffered as a resultof global competition, especially onaccount of the high subsidies which areprovided to agriculture in the developedcountries.
Thirdly, South Asian women bear theheaviest burden of work inside andoutside home. Yet they fail to get fullrecognition for their work whether inemployment statistics, or in parity withmen in wages, working conditions andoccupational status. Gender disparity anddiscrimination, which we have beendiscussing in all our previous reports, getsmagnified in the job market. Even wherewomen get increased employmentopportunities as in export-orientedindustries, the conditions of work remainpoor, and when there is any sign ofimprovement in women’s wages orworking conditions, there is a tendencyto replace women workers with men. Thesearch for equity and equality backfiresagainst women.
Fourthly, the systems of education andtraining in the region have failed toproduce a critical mass of qualifiedworkforce to compete in the globalmarket. The countries need to go beyondprimary education to stress on betteravailability of secondary education andtechnical training, as well as to enhancethe quality of education being currentlyoffered, particularly by the public sectorinstitutions.
Fifthly, despite being signatories tovarious international conventions andcovenants, the South Asian countrieshave failed to enforce even those fewfundamental labour standards which theyhave ratified. Each country is burdenedwith traditional practices of bondedlabour, child labour and the newlyemerging phenomenon of childtrafficking, all of which clearly speak ofthe lack of will on part of the
government, and the society at large, tochange their situation.
Sixthly, asymmetric demographybetween the developed and developingcountries, provides a window ofopportunity to the South Asian countriesto benefit from exporting its labour tothe developed countries, provided SouthAsia prepares its labour force with qualityeducation and training.
During the last two decades, the SouthAsian countries have gone throughseveral economic reform programs.However, their impact on employmentgeneration and human developmenthas been negligible, or even negative,in some cases.
South Asia is the fastest growing regionin the world with 22 per cent of theworld’s population. The bulk of thispopulation is in the 15-64 age group,which offers a demographic dividend tothe region provided economic growth islinked to employment growth and humandevelopment. The development strategiesfollowed in the region so far have notbeen successful in extending the benefitsof growth to the majority of population.This has had a negative impact ofincreasing poverty and income inequality.Employment growth lagged behind bothGDP and labour force growth rates.
In South Asia, there exists a largeinformal sector characterised by lowproductivity, low wage rates and longworking hours. One-third of South Asiais in absolute poverty, and there is a highconcentration of working poor. Althoughthe GDP share of agriculture has fallenfrom 38.6 per cent in 1980 to 24.9 percent in 2001, it still remains the primarysource of employment in the region.Contribution of industry to GDP hasremained stagnant along with a fallingshare in employment. The services sectorhas shown rapid growth and absorbsmost of the incremental labour force. Itsshare in the South Asian GDP increased
Employment growthlagged behind bothGDP and labourforce growth rates
Overview 3
from 36.4 per cent in 1980, to 48.7 percent in 2001.
Unemployment rate for South Asia isnot very high when compared to otherregions of the world. However, there is ahigh degree of underemployment in theregion. Due to a large population base, aprimary-activity based economy, and aneducation system geared towardsproviding formal employment, the SouthAsian labour markets have beenassociated with a high incidence ofunemployment among the youth and theeducated during the past decade. Theunderlying reasons include thediminishing role of the public sector inemployment generation, a mismatchbetween the education offered and theopportunities available, and the lack ofmarketable skills and training.
Children and women are among thehighly vulnerable groups in the SouthAsian labour market. Women are mostlyconcentrated in low paying, lowproductivity jobs. A startling number ofchild labourers work in all sectors of theeconomy. The current labour forceparticipation rates of children are over 12per cent for most countries of the regionwith the exception of Sri Lanka, where itis just 2 per cent.
The South Asian experience hasshown that despite growth inaggregate economic activity, overallemployment situation may suffer,pointing to the critical link betweenemployment generation and growth.
The economic experience of most SouthAsian countries has been remarkablysimilar, especially during the last twodecades. All countries (except Nepal)pursued a set of policies based on themarket-based economic paradigm. Themain features of these economic reformswere:
(a) reduction of direct state control inregulation of economic activity;
(b) privatisation of state assets;(c) attempts to reduce fiscal deficits (by
curbing public investment, reducingfarm subsidies and increasing usercharges for public utilities); and,
(d) trade and financial liberalisation.
The set of economic reforms pursued wasbased on certain premises that turned outto be over-optimistic. It was thought thatthe various measures taken would spureconomic growth because privateenterprise delivers more efficient anddynamic outcomes. This expectation wasmet successfully in particular exportsectors in each of the South Asiancountries (readymade garments inBangladesh; cotton cultivation inPakistan; IT-enabled services, softwareand clothing in India; and, miscellaneousexports in Sri Lanka). However, theincreased growth and employment inthese sectors was more thancounterbalanced by the decline inemployment in the traditional sectors.
The basic assumptions of economicreform policies were wrong on threecounts. Firstly, the conditions in theregion were not right for introducing suchreforms. The unequal asset and incomedistribution in the region, coupled withthe limited nature of the home marketwould lead private investment to comeup against a demand constraint fairlyquickly. Secondly, the link between publicand private investment was ignored whenSouth Asian governments cut back onpublic expenditure. This seems to be acrucial mistake on part of the region’sgovernments, since public expenditureworks towards easing infrastructure andother supply constraints—making privateproduction easier and cheaper. Thirdly,economic reform policies supported theuse of more capital-intensive technologiesthat was not in keeping with the perceivedcomparative advantage of labour-intensive production in South Asia. Theworst affected by the greater openness totrade were small producers, who are themost labour intensive, and cannot
The worst affectedby the greateropenness to tradewere smallproducers, who arethe most labourintensive
4 Human Development in South Asia 2003
compete with the quality and coststandards of multinational producers.
As a similar set of policies was adoptedby the countries of the region—quiteexpectedly—the outcomes were alsosimilar. On the whole, the policies wereunsuccessful in generating productiveemployment for the majority of peoplein the region. With respect toemployment generation, the reformsfailed to perform in at least five ways:
(1) There has been deceleration ofemployment generation.
(2) The reforms led to increasedinequalities in income.
(3) There was a stagnation or increase inthe levels of poverty.
(4) There was a relative decline in themanufacturing sector—especially inthe small-scale sector with the resultthat agriculture and services emergedas residual refuge sectors for workers;and, finally,
(5) The quality of employmentdeteriorated across the region with anincrease in casual and part-time work,as well as greater fragility in contracts,and fewer days of work for daylabourers.
Despite clear comparative advantagein the three key sectors, agriculture,textiles and services, post-WTOliberalisation in South Asian countrieshas failed to significantly expandexports of these sectors. Perhaps themost startling feature of this failurehas been the deterioration of theemployment situation in the region.
The late eighties and nineties were yearsof increased global integration for theSouth Asian countries. This period ofincreased openness coincided with theformation of the World TradeOrganisation (WTO). In fact, theestablishment of WTO was one of thereasons that motivated the governmentsof the region to pursue export-orientedeconomic policies.
The establishment of WTO broughtabout an air of optimism in the SouthAsian region. It was expected that thethree key sectors in which they hadcomparative advantage—agriculture,textiles and services—could grow rapidlyafter the imposition of a new multilateraltrading system. Although WTO promisedliberalisation in these three sectors, it alsolaid two crucial demands on developingcountries. Firstly, the developingcountries had to accept much stricterpatent laws globally, and secondly, theyhad to remove all non-tariff barriers andreduce tariff barriers on industrial goods.It was expected, however, that the benefitaccrued from the export in agriculture,textiles and services would more thanoffset the losses from the other two areas.
Given the labour-intensive nature ofall three sectors (agriculture, textiles, andservices), it was expected that export-ledgrowth would lead to rapid increase inemployment in these three sectors.However, in the past five years, theunemployment rate has actually gone upfor the region. This increase indicates thatliberalisation is quite evidently not apainless process. As the pattern ofproduction changes in the developingcountries, many workers lose jobs. Suchdisplaced workers may have to gothrough long periods of unemploymentas the economy readjusts. In addition toworkers, the firms themselves find it hardto readjust to join the export sector. Veryoften this requires huge investments,which most small-scale producers cannotmake.
The Agreement on Agriculture (AoA)signed by the WTO member countries in1995 sought to bring discipline in globalagricultural trade by removing tradedistortions resulting from unrestricted useof production and export subsidies andimport barriers. The developed countrieshad pursued a policy of highly subsidizingtheir agricultural sector such that thesurplus output was usually dumped in theinternational market. The developingcountries, which possessed clearcomparative advantage in this sector,
The quality ofemploymentdeteriorated acrossthe region with anincrease in casualand part-time work
Overview 5
were therefore not able to compete withthe subsidized produce from thedeveloped countries. Reduced protectionof the agriculture sector in the developedcountries was expected to create massiveemployment opportunities for the SouthAsians. Rural labour demand and wageswere expected to rise. Also, ruralinfrastructure development, which is itselfa labour-intensive process, was expectedto follow export-led growth in theagriculture sector. However, agriculturedid not show the kind of growth that wasexpected. Some of the reasons for thisfailure are structural, such as theprevalence of subsistence farming with nopotential for cash-crop production; thedependence of farmers on middlementhat sharply increases costs and reducescompetitiveness; the adoption of morecapital-intensive modes of cultivation bybigger farmers; and, the readjustmentcosts associated with switching from non-competitive crops to more internationallycompetitive crops. In addition to thesestructural issues, there are problems withthe way in which WTO is beingimplemented. The developed countrieshave not yet responded to the demandsmade on them by AoA, and continue tosubsidize their farm produce. There areindications that domestic farm subsidiesmight actually increase in the developedcountries. Under such conditions, theSouth Asian countries will not be able toreap the benefits of trade in theagriculture sector. At home, thegovernments have to work towardsdeveloping better and suitable ruralinfrastructure, which will not only providerural employment, but will also make ruralproduce more competitive internationally.And, globally, the developed countrieshave to fulfil their promises andobligations to reduce the protection oftheir agriculture sectors.
The Agreement on Textiles andClothing (ATC) was an attempt by theWTO member countries aimed atbringing the trade of textiles at par withthat of other industrial goods. Since theseventies, many developed countries had
pursued a policy of establishing quotason imports of textiles and clothing frommore competitive countries. According toATC, this quota regime is to be phasedout by 2005. ATC was seen as a greatnew hope for the textiles and clothingsector in South Asia. Most countries inthe region possess comparative advantageinternationally and would stand to gainconsiderably in a truly liberalized tradingscenario. As the sector is labour-intensive,it was expected that it would create much-needed productive employmentopportunities for the South Asians.However, eight years after theimplementation of ATC, there are verylittle signs of growth in the sector. Thecase of Bangladesh is an exceptionbecause it is allowed preferential marketaccess by the developed countries. On thewhole, implementation of ATC has notbeen extensive enough to providesubstantial gains to the South Asiancountries. This is because of three mainreasons: first, most of the quotas thatwere supposed to be eliminated stillremain in place in the developedcountries. Second, the products on whichquotas have been abolished were notcommercially significant for thedeveloping countries. Third, theliberalisation so far has only beensuperficial, since products that were neverunder quota restrictions are beingconsidered as having been integrated.Other impediments include tariff peaks,disguised trade barriers (such as anti-dumping laws), and preferential tradethrough regional trading blocks (e.g.NAFTA and EU). Keeping in view allthese considerations, it seems that the endof quota restrictions in 2005 will be amixed blessing for the South Asians.Although it will create access to newmarkets, it will also expose them to globalcompetition. It is questionable whetherthe South Asian industry is ready to meetsuch a challenge. With a dominance ofsmall and medium sized producers, whosuffer from outmoded machinery, powerfailures, management problems etc., itremains to be seen how the industry can
The developedcountries have notyet responded to thedemands made onthem by AoA, andcontinue to subsidizetheir farm produce
6 Human Development in South Asia 2003
cope in the protection-free environment.Again, as is the case with agriculture, thegovernments at home need to providesupport to the industry. Infrastructureneeds to be expanded in key areas suchas ports, telecommunications, power andhighways.
Other manufacturing goods are asignificant portion of Sri Lanka’s andIndia’s export sector. It is thought that ina liberalized scenario, significant employ-ment opportunities can be provided indeveloping countries through ForeignDirect Investment (FDI). Since mostdeveloping countries have cheap labour,manufacturing can be done more cost-effectively by multinational companies inthese countries. However, this requiresgood infrastructure in place, as well assupport by the governments in form oftax-exemptions etc. However, it is notclear whether this route would lead to analleviation of the unemployment problemin these countries. Multinationalcompanies and other large domestic firmstend to employ more capital-intensivetechnologies. In the manufacturing sector,small and medium sized industries havebeen the worst hit in the liberalizedenvironment, since they work with verylittle capital, and face intense competition.A look at the trade restrictions in the areaof other manufacturing goods shows thatthese are much higher in sectors wheredeveloping countries have export interest.In addition, tariff escalation and peaks arehuge obstacles to the diversification ofmanufacturing. Hence, the manufacturingsector also seems to have suffered as aresult of liberalisation in the South Asianregion. It is only the larger firms that willbe able to deal with the stiff globalcompetition, and as explained above,these firms are not generally labourintensive.
The services sector currentlydominates in the region, accounting forabout 49 per cent of the South AsianGDP. Liberalisation of the services sectorcan be extremely beneficial for creatingproductive employment for many SouthAsians. If there is meaningful
implementation of GATS, South Asiancountries stand to gain in at least thefollowing four areas:
• The export of services in back-office processing, call centres andmedical transcription industries, aswell as software development andbusiness process outsourcing.
• Tourism (especially significant forNepal and Maldives).
• ‘Commercial presence’ of foreignservices firms in the region (similarto Foreign Direct Investment).
• Migration of skilled workers todeveloped countries.
Till now, however, GATS has not beenvery successful in liberalizing trade inservices. The report discusses severalimpediments, including unfulfilledcommitments of developed countries andvarious conditions and limitations to freetrade in services. Given the tremendouscomparative advantage South Asiancountries possess in the key areasidentified above, meaningfulimplementation of GATS will be crucialfor employment generation in the region.
Women face various forms ofdiscrimination in employment. Theyare engaged mostly in low pro-ductivity employment in agriculturaland informal settings. Although theyoften work harder, and for longerhours than men, their earnings aresignificantly lower.
Labour market statistics and practicesdiscriminate against women. The lowparticipation of women in economicactivity is not a reality but a myth createdby the system of patriarchy. The reportdiscusses how statistical invisibility ofwomen is a cause of concern, and whysuch systematic discrimination againstwomen should be corrected. The SouthAsian governments have made efforts toaddress this problem by expanding thedefinition of economically active women.
In themanufacturingsector, small andmedium sizedindustries have beenthe worst hit in theliberalizedenvironment
Overview 7
However, they still have a long way to gobefore women get full recognition fortheir work. This recognition in statistics,although only a change in numbers, willhave the important effect of makingpolicy-makers aware of the importance ofwomen in employment.
Two-thirds of South Asian women areemployed in agriculture or agriculture-related activities. They work in variousroles such as agricultural labourers,manager of homesteads, and sometimeseven as landowners. However, they arenot allowed equal opportunities in thissector in access to credit and inputs, andface discrimination in wages.
In the informal sector, women formthe majority of the workers. Two trendshave led to the growth of femaleinvolvement in this sector. First, in therural areas where the migration of mento urban centres or abroad has providedopportunities for more female involve-ment in small enterprises. Second, inurban areas, the demand for cheap low-skilled labour has increased over the yearsowing to export-oriented manufacturing.This trend has been instrumental inproviding employment to an increasingnumber of women. However, women areoften hired on exploitative terms. Theyoften work in difficult conditions for longperiods of time. They accept low wages,and do not demand permanent contracts.As women become more active in thelabour market, their bargaining poweralso improves. At the same time,however, as women’s work gets morerecognition, there is a fear that this mightnegatively impact on the futureemployment opportunities for women.
Except in Sri Lanka, the role of womenin formal sector employment is verylimited (less than one-fifth of total publicsector employment). Even when they dofind employment, they are mostlyrelegated to relatively peripheral jobs ineducation, health and communityservices.
To link education and training to jobmarket, South Asia needs to improve,both quantitatively and qualitatively,its education and training systems,including investment to promote ICTand other new technologies, andencourage entrepreneurship.
In an increasingly global economicenvironment, it has become imperativefor a country to have people who possessnot only the basic skills of literacy andnumeracy at a functionally useful level,but also higher levels of education andskills.
The fact that South Asia has thehighest number of illiterates in the worldshould be a cause for alarm amongst theregion’s governments. However,education is not an area of priority in thebudgets of the majority of governmentsin the region. The education system isplagued by low enrolment amongst thepoor and vulnerable groups, low quality(measured by pupil-teacher ratios andrepetition rates), high dropout rates, andhigh gender disparity. In addition,teachers are not sufficiently trained toimpart quality education. The primarylevel suffers most from theseinadequacies.
Given the low quality of education thatthe majority of literate South Asians areexposed to, it is not surprising that asignificant portion of them fail to getproductive employment. The startling factthat the unemployment rates are higheramongst the educated class of the regiongoes contrary to the idea that educationleads to productive employment. Themain reasons for this situation are themanner in which education is imparted,and a number of external factors (such asthe macroeconomic policy environment)which do not produce a conducivescenario for the educated people to beproductive. In addition, in the currentglobal economy, it is important for
Women are oftenhired on exploitativeterms
8 Human Development in South Asia 2003
educated people to be creative andinnovative. One has to remain in touchwith the developments in one’s field, andhas to evolve with these. To this end, it isextremely important that entrepre-neurship be included as a significantcomponent of education at post-primarylevels.
A key area that needs uplift in theSouth Asian region is that of technicaland vocational education. The East Asianexperience has shown very clearly howtechnical and vocational education canbecome one of the main solutions to theproblems of unemployment. The SouthAsian training system suffers from at leasttwo major inadequacies. Firstly, suchtraining must build on good foundationalskills such as numeracy and literacy. Lowliteracy and substandard quality ofprimary education makes subsequenttraining difficult and useless. Secondly,the training sector is neglected by theregion’s governments. The financialallocations are niggardly, leading to a lackof requisite facilities and qualifiedteachers. In most countries of the region,vocational and technical training is in thehands of a number of departments andministries such that no one governingbody has the responsibility of supervision.South Asia can learn from the East Asiancountries in making their training sectorviable and progressive. Some importantmeasures that need to be taken areuplifting of primary education; higherallocations to technical education;emphasis on teacher training;involvement of public sector in makingtraining viable; and, planning by thegovernments to keep the training sectorcompatible to the needs of the economy.
Entrepreneurship needs to beincorporated in education to induceprogressive and creative thinking amongststudents. This is necessary for South Asiabecause a significant portion of theworkforce is employed in the small andmedium enterprises (SMEs). It is in theseenterprises that entrepreneurship can
work most successfully in producingcompetitive goods for the domestic andinternational markets. A few things needto happen to increase the spirit ofentrepreneurship in the region. Theseinclude hassle free availability of creditfor new businesses, reduction incorruption to make new businesses viable,extension of incentives to newentrepreneurs by the governments, andpromotion of business incubation forhelping new businesses to succeed. Inaddition, a very important area that needsattention of the governments is thedevelopment of suitable infrastructure.Most importantly, transport, communi-cation network and stable electricitysupply need greater investment. Not onlyis improved access necessary, but also therates of basic utilities must be loweredfor encouraging new business enterprisein the region.
The Information and CommunicationTechnologies (ICT) sector has greatpromise in providing productiveemployment to the educated SouthAsians. The region stands to gain not onlyby the development of the sector athome, but also by exporting ITprofessionals to the developed world.There is great optimism that the ICTsector will grow to a massive extent inthe region. However, ICT diffusion in theregion seems limited. The number ofinternet users in South Asia is low, andare concentrated in the urban areas.Internet is not being used in the regionin vital areas such as business, health,academic and public sectors. Internet,except in India, is used mainly as an emailor fax tool. In addition, connectivity andorganisational infrastructures are not inplace to allow full utilisation of ICT. Ifthese obstacles are dealt with successfully,then South Asia stands to gaintremendously from the ICT sector. Theproficiency in English language by theeducated in the region gives South Asia ahuge edge over other developingcountries.
The Informationand CommunicationTechnologies (ICT)sector has greatpromise in providingproductiveemployment to theeducated SouthAsians
Overview 9
The rights of South Asian workers,though enshrined in each country’sconstitution and supported by specificlabour legislation, are not protectedacross the board, especially in case ofwomen and children employed in theinformal and exploitative sectors.
In South Asia, the ratification of ILOcore labour standards, particularly eightcore ILO Conventions, has been verylow. Sri Lanka is the only country thathas ratified all eight Conventions.Pakistan and Bangladesh have ratifiedseven, India has ratified four, while Nepalhas ratified six of these Conventions.Bhutan and Maldives are not members ofILO. It should be noted, however, thatmere ratification does not automaticallyimply that the rights of workers are beingprotected in a country. Ratification ismerely the acknowledgement that acertain right has to be extended toworkers. Implementation of the labourstandard, the actual extension of the right,involves greater dedication from thegovernments. Therefore, there are oftengaps between the rights which arepromised to the workers, and those thatare actually promulgated and imple-mented. The effective implementation oflabour standards in the region has beenmade difficult on three accounts. Firstly,there is the prevalence of a huge informalsector, where protection of workersbecomes a difficult task. Secondly, thereare minimum-size restrictions fororganisations to benefit from these laws.And thirdly, the agriculture sector isusually excluded from the jurisdiction ofthese laws.
The first fundamental principle is thatof ‘freedom of association and collectivebargaining.’ These are recognised by theSouth Asian governments as thefundamental rights of workers. However,they have limited the scope of these rightsin several ways. For instance, these rightsare restricted in case of governmentservants (India), and for workers in
Export Processing Zones (India, Pakistan,Bangladesh, and Sri Lanka).
The second fundamental principle isthat of the ‘elimination of forced labour.’Forced labour is prevalent in the regionmostly in the form of bonded labour.Mostly, this is associated with thestructures of land-ownership and caste,which can keep people in bondage forseveral generations. Bonded labour ispervasive in brick kilns, leather and fishprocessing, carpet manufacturing, and inagriculture. Several initiatives to end theseunacceptable working conditions havebeen taken both by governmental andnon-governmental organisations in theregion. However, the practice continues.
The third fundamental principle is thatof the elimination of ‘discrimination inemployment or occupation.’ In SouthAsia, people are discriminated on thebasis of caste, gender, ethnicity andreligious affiliation. Both changes inlegislation and a more effectiveimplementation are required to end thediscriminatory practices in the workplace.
The fourth fundamental principle isthat of the ‘elimination of child labour.’Child labour and child trafficking arerampant in the region, and are issues thatshould be on the priority list of the SouthAsian governments. Although thegovernments have adopted numerouslegislation to protect the rights ofchildren, these have not beenimplemented widely. Many children workin agriculture, often as bonded labourers,or effectively as slaves. Other childrenwork in hazardous industries such asmining, brick-making, fireworks, brasshandicrafts, carpet weaving and gempolishing industries. Although childlabour is a global phenomenon, it is muchmore pervasive in the South Asian region.The report discusses a few initiatives thathave been taken to combat child labour(workplace monitoring, product labelling,SAARC initiatives to combat childtrafficking etc.). However, much morestill needs to be done for protectingchildren’s rights in terms of providing
Although childlabour is a globalphenomenon, it ismuch morepervasive in theSouth Asian region
10 Human Development in South Asia 2003
them with education, training and meansto get more wholesome employment.
The report also raises concern aboutthe rights of workers in the export sector.Owing to the informal and flexible natureof this sector, the workforce engaged inthis sector is vulnerable to low levels oflabour standards. Trade unions have losttheir power as the rights of freedom ofassociation and collective bargainingrights are greatly constrained in thissector.
Demographic asymmetry in the world,with populations declining in thedeveloped countries and increasing inthe developing ones, provides anopportunity for South Asia to exportits labour, which can be an importantstep towards alleviating the unemploy-ment problem.
By making a dynamic analysis of theprocess of migration, the report showsthat it can actually be beneficial forcountries to export labour to regionswhere it will be more productive.Population statistics reveal manyinteresting findings which point to a cleardemographic asymmetry in the world.Fertility rates have collapsed in thedeveloped countries (in Europe, NorthAmerica and Japan), and have declined inmany parts of the developing world. Evenin South Asia, there has been a decline infertility rates. However, in South Asia,demographic inertia will ensure anincrease in the size of the workforce. Inthe next twenty years, South Asia will addover 500 million people to its workforce.The developed world, on the other hand,will actually face a shortage of workers.Given the present demographic situationin the developed world, the populationof most of these countries is actuallyexpected to decrease in the comingdecades. Owing to rapidly declining ratesof fertility, there has been a virtualexplosion of the proportion of olderpeople in the richer economies of theworld. This suggests that there is
tremendous potential for countries withsurplus labour to export it to thedeveloped world, which is most likely toface a shortage of labour.
The report, having established thatthere is indeed tremendous opportunity forexporting workers from developing to thedeveloped countries, explores how this canbe beneficial for the labour-exportingcountry. The report challenges theassumption that migrants, when the leavetheir countries of origin, also sever all tieswith it. On the contrary, economically, theymaintain ties in at least three importantways: firstly, they send remittances to theirrelatives back home, which are sometimesa significant portion of their incomesabroad. Secondly, they sponsor foreigndirect investment in their countries oforigin. Thirdly, they assist non-governmental organisations (NGOs)engaged in various developmental andcharity work activities. These threeeconomic interactions of diasporas withtheir homelands usually happen in threephases. New settlers abroad first savesignificant amounts from their incomes tosend remittances to their families. As theyestablish roots in the new country,however, the proportion of remittancesthey send back decreases. Later, as theyget more successful economically, they areable to make foreign direct investment, andaid NGOs in their homelands.
The developed countries haverecognized the huge benefits of importingproductive labour from the developingcountries. In the recent years, there hasbeen a significant migration of workersto USA and EU. However, 9/11 hascaused a major setback to this trend. Thewestern countries (particularly the US),have become very cautious about havingforeigners in their countries.
However, whether to allow migrationof workers into their countries or not isan important choice that the developedworld will have to make. Their decisionwill have a tremendous impact not onlyon their own economies, but eventuallyon the global economy as well. Withdeclining or stagnating populations, the
There is tremendouspotential forcountries withsurplus labour toexport it to thedeveloped world,which is most likelyto face a shortage oflabour
Overview 11
bulk of which will be in the older agebracket, the developed countries face therisk of significant economic slowdown.The report argues that importingproductive labour from the developingworld is the only way out for thedeveloped world, if it wants to maintaineconomic growth. The developingcountries must also take measures to reapmaximum benefits from exporting theirlabour. For this, they must investconsiderably more on human resourcedevelopment than they are doing atpresent
There is need for a more humanemacroeconomic, trade and socialdevelopment framework in South Asiathat reinstates the critical role of statesin pursuing job-led economic growth.
Given the failure of market-basedreforms in generating productiveemployment for the South Asians, thisreport recommends the following policymeasures to improve the employmentsituation in South Asia. First, more publicinvestment is required in rural as well asin urban areas in job-creatinginfrastructure, building maintenance andin building capability of people byimproving access to and quality ofeducation and training. These measureswill also assist and provide a boost toprivate enterprise.
Second, some degree of protectionfrom global competitive markets isrequired for domestic producers,especially for small-scale producers.
Third, the governments should takemeasures to encourage more employ-ment-intensive production.
Fourth, the agriculture sector needssome protection by the governments, asit has been the worst affected by greateropenness in trade. In particular, as longas the developed countries continue tosubsidize their farm produce, it isimperative that the developing countriesprotect themselves from this unfaircompetition.
Fifth, the possibility of directed creditneeds to be revived, especially for small-scale producers.
Sixth, the dichotomy in labour marketsof the region, with a limited large-scalesector (with protected workers), and adominant small-scale sector (with littleprotection to workers), needs to bebroken.
Seventh, unemployment/undere-mployment needs to be addressed inmore active ways than through legislationalone.
Finally, the potential of regionalcooperation must be recognized andrealized by the South Asian governments.
ICT has been-and continues to be-avery promising sector, providing growthand employment opportunities to anincreasing number of people in theregion, particularly in India. Following therapid success of India in capturing theICT market, there is great optimismamongst the South Asian countries aboutthis sector. However, a detailed analysisreveals that the scope of ICT in alleviatingthe unemployment situation in South Asiais more limited than commonly imagined.The ICT sector is dominated by therelatively rich and educated English-speaking minority of the region. The bulkof the workforce is not sufficientlyeducated to do the kind of high qualitywork that ICT requires. In addition, theinfrastructure requirements for the sector(telephone connectivity and penetrationof computers) are still limited in theregion. Therefore, to use the tremendouspotential of this sector to increaseemployment for the educated in theregion, governments must provide therequired infrastructure and incentives tothe private sector, to invest more in thissector so that the countries can reap thebenefits that ICT promises.
For any real and worthwhile progress,women’s empowerment must always beone of the guiding principles of SouthAsian human development initiatives. Allof women’s work, whether it is performedwithin the household or outside, must becounted in compiling national income
Unemployment/underemploymentneeds to beaddressed in moreactive ways thanthrough legislationalone
12 Human Development in South Asia 2003
statistics. The realisation that womenoccupy an important role in the economiclife of countries will help in changingperceptions about women’s contributionto economy and society. This, in turn,will help enhance women’s employmentopportunities. Trade liberalisation has ledto increased employment opportunitiesfor women in export-oriented industries.Although this is a positive trend, theemployment conditions of women in thisarea have to be improved withoutcompromising women’s opportunitiesand growth prospects with respect tothese industries.
The report also suggests several policymeasures for improving the educationand training systems in order to keepthem consistent with the present andfuture needs of competitive national andglobal markets. There must be:
• increased efforts towards improvinguniversal primary as well assecondary education in the region;
• ensuring equivalency of degreesfrom technical and generaleducation institutions;
• creating greater and improvedaccess to technical education forwomen and for people in neglectedareas;
• provision of adequate budgetarysupport for education; and
• a closer alliance between public andprivate sectors for the promotion ofeducation, entrepreneurship, andICT.
Rights of workers must not only beenshrined in constitutions and legis-lations, but must also be enforced inpractice. The reach of these laws needsto be extended to informal sectorworkers, and to workers in export-processing zones.
And finally, the report advocates forequity in international trading rules. Theway these are currently designed andimplemented works against the interestsof poor countries, and poor people withinthese countries. Globalisation must beguided by ethical considerations if wewant to make this process sustainable.
Globalisation mustbe guided by ethicalconsiderations if wewant to make thisprocess sustainable
Working out of Poverty: A Conceptual Framework 13
People—men, women and sometimeseven very young children—must work toearn a living. However, work does notalways provide enough income to keeppeople out of poverty. And the type ofwork people sometimes have to do canstunt their long-term development. Workcan also be degrading. It can inflictirreparable damage on mind and body. Inother words, the connection betweenemployment, income and povertyalleviation is a complex one, which is notyet fully understood. The way in whichthese separate developments are linkeddiffers from region to region. It is theaim of this report to explore these variousconnections in the context of South Asia.
There is already a rich corpus ofliterature relating to the ways in whichemployment and its counterpoints—underemployment and unemployment—impact on economic and socialdevelopment. Systematic work in this areawas initiated by the International LaborOrganization (ILO) in the early 1970s,when that agency sponsored a number ofcountry studies. The major finding ofILO’s work was that the informal sectorplayed an enormously important role inabsorbing the growing labour force inmany parts of the developing world. Theinitiative taken by the ILO was continuedfurther by the World Bank and a numberof development think tanks.
The literature that has come out of thiswork deals with the way employment canhelp in promoting economic growth andalleviating poverty. Some of the moreimportant works that belong to this genreare noted in the extensive bibliographywhich we have provided at the back ofthis report. It is not our intention to writea synopsis of the analyses alreadyavailable. As has been the practice in theprevious reports produced by this Centre,
we will build upon this solid andpragmatic foundation and provide thepolicymakers in the region a frameworkof policies that would enable them tofocus on employment generation forpromoting economic growth as well asalleviating poverty.
This chapter sets out a conceptualframework which encompasses theanalyses and findings of those that follow.This part of the report focuses ondefining policy imperatives rather thandeveloping a strong analyticalunderpinning for the body of the report.It has been a tradition in the Centre’sreports to provide guidance to thepolicymakers in South Asia rather thanto break new analytical ground. Much ofwhat we say in this document isconcerned with government policies andgovernment actions. We will also explorewhat the private sector and the civilsociety can do to face the challenge posedto the millions of people in the regionwho continue to search for productivejobs.
There is a great deal that markets cando in helping people find productiveemployment. But markets do not workon their own; they have to be promptedby the governments to move in a certaindirection. The debate on what is the rightrole for the state continues to this dayand will continue to engage and energiseacademics, policymakers, and ordinarycitizens for many more decades. We madea significant contribution to this dialoguefour years ago when, in the Centre’sreport published in 1999, we addedhumane governance to the panoply ofideas that are already around to deliver tothe people their needs. ‘Humanegovernance is governance, indeed goodgovernance, which is dedicated tosecuring human development,’ we wrote
Chapter 1
Working out of Poverty: A ConceptualFramework1
Markets do not workon their own; theyhave to be promptedby the governmentsto move in a certaindirection
14 Human Development in South Asia 2003
in the 1999 report. ‘It requires effectiveparticipation of people in state, civilsociety and private sector activities thatare conducive to human development. Itfurther enjoins the state, civil society, andthe private sector to help build capacitieswhich will meet the basic needs of allpeople, particularly women, children andthe poor. Humane governance will alsoensure that human development issustainable.’ 2
The 1999 report, in focusing onhumane governance, also developed anew index—the humane governanceindex to indicate how the governmentsin the area were faring in terms of servingtheir citizens. On a scale of zero to one,our analysis indicated that in terms ofhumane governance, industrial countrieshad reached the level of 0.83. Those inEast Asia, scored at 0.65. But fourcountries (India, Pakistan, Bangladesh,and Sri Lanka) in South Asia were laggingway behind, with an aggregate score of0.56. In other words, according to ourfindings published four years ago, therewas much the South Asian governmentsneeded to do to effectively work for theircitizens. This is a theme which we willpick up at the very end of this chapter.
The chapter that follows offers astatistical profile of the South Asia regionin order to set the stage for the analysesthat come in the later parts of the report.We do this also to underscore theimportant point that South Asia has manyunique characteristics that distinguish itfrom other parts of the developing world.It is a large region with a population onlyslightly smaller than that of East Asia. Itincludes one of the two countries in theworld with a population of more thanone billion. In terms of the size of thepopulation, India is likely to overtake theother one billion plus country, China. By2035, India, at the current populationgrowth rate, is projected to be the world’smost populous country.
South Asia’s population is very youngas a consequence of high rates of fertilitysustained over a long period of time.Although the rates of fertility have begun
to decline in recent years, they are stillsignificantly higher than those in otherparts of Asia and in Latin America. Thismeans that for decades to come the SouthAsian populations will be dominated bythe young. In Pakistan, the South Asiancountry with the highest rate of fertility,the very young—those below the age of14—accounted for 41.8 per cent of thetotal population in the year 2000.
The relative youth of the South Asianpopulation provides the region with anopportunity to fill the skill gaps that arerapidly emerging in Europe, Japan andNorth America—the regions of the worldthat are now moving into a phase ofdevelopment variously called post-industrialisation or post-modernisation.How this demographic asymmetry can beturned into an opportunity for thecountries of South Asia is a subject wewill explore in chapter 8. By doing so, wewill step out of the conventional thinkingthat has dominated developmentliterature ever since developmenteconomics carved out a niche for itself asa separate sub-discipline. We willchallenge the popular view that braindrain—the migration of skilled and well-trained people from the developing worldto the countries where they earnconsiderably higher incomes—inflicts agreat deal of damage to the labourexporting country. Instead, we will arguethat the opportunities for migrationprovide a win-win solution to bothcountries with large populations andthose that have begun to experiencesevere shortages of workers with the rightkinds of skills. This, as will emerge later,is not the only new area of public policywhich we will bring to the attention ofthe policymakers in the South Asianregion.
The relative youth of the South Asianpopulations may ultimately provide themwith increased opportunities. For themoment, however, it translates into aburden with which the policymakers mustcontend and for which they must institutethe right set of policies. There is a highincidence of unemployment and
The relative youthof the South Asianpopulation providesthe region with anopportunity to fillthe skill gaps thatare rapidly emergingin Europe, Japanand North America
Working out of Poverty: A Conceptual Framework 15
underemployment among the young,which forces them into jobs that providepoor wages and do not contribute toincreasing the productivity and efficiencyof the economy. A challenge faced by theregion’s policymakers, therefore, is tocreate an economic structure that will finda place for the enormous number ofyoung people in the South Asianpopulations.
Should the provision of education bea critical part of the employment strategyin South Asia? The answer is obviouslyyes but this report, in analysing thestructure of education in South Asia, willbuild on the work done five years ago inthe report published by the Centre underthe title of The Education Challenge. It said,‘The challenge for the South Asia regiontoday is to travel the vast distancebetween its performance and its promise.On the one hand, it has emerged as thepoorest, the most illiterate, the mostmalnourished, and the least gender-sensitive region in the world… On theother, it has the potential to become themost dynamic region in the twenty-firstcentury if there is massive investment inhuman development. The most criticalcomponents in any such investment planare: (a) basic education for all, and(b) relevant technical skills.’3 These wordsring as true today as they did half a decadeago when they were written. Not onlythat, we will reach the unhappyconclusion in this report that much ofthe educational endeavour in the regiondoes not produce the workforce it needs.The weak educational system does notreach the entire population and those thatit does reach, it educates poorly. This isthe reason why there is such a largeproportion of educated unemployed inthis part of the world. Bringing theeducational system in line with theopportunities currently available, andthose that will become available, has tobe a high priority for the region’spolicymakers. This is yet anotherimportant challenge which thegovernments must address.
Political scientists, more thaneconomists, have stressed for decadestheir findings that semi-educated butunemployed youth bring politicalinstability. To this aspect of the problem,we should now add the more recentphenomenon of the rise of religiouseducation in the region. Much has alreadybeen written about the madrassas (religiousschools) in Pakistan that producegraduates with little prospect of gainingemployment in the modern part of theeconomy. They are able to find jobs onlyas teachers in madrassas or as imams inmosques. This cycle has to be broken,not only for economic reasons but forpolitical and social reasons as well.However, religious schools are notgaining a strong foothold in theeducational systems of only the Muslimcountries of the sub-continent. They havealso now appeared in some regions ofIndia where Hindu fundamentalism is onthe rise.
A disconcerting aspect of this situationis the unhappy fact that religious schoolsare receiving active financial support fromthe South Asian migrant communitieswho are all over the world. Thesediasporas are providing assistance to theinstitutions that operate at the fringes ofthe educational system. They do so in themisguided belief that it is their duty tosupport the cultural and religiousestablishment of the areas from whichthey have come. We would like to usethis report to reach the South Asiandiasporas and carry to them a differentmessage: that they should encourage themodernisation and genuine developmentof the countries they have left behind andhelp them to integrate with the globalcommunity.
The relative youth of the South Asianpopulation also poses another problemthat must be addressed with somesensitivity and urgency by thepolicymakers. This relates to child labour,a phenomenon also encountered in mostother parts of the developing world butis most prominent in South Asia and
A challenge faced bythe region’spolicymakers is tocreate an economicstructure that willfind a place for theenormous number ofyoung people in theSouth Asianpopulations
16 Human Development in South Asia 2003
Africa. Fortunately, unlike Sub-SaharanAfrica, South Asia does not have childsoldiers trained to kill and inflict cruelty.The South Asians have fought many warsthat should have been avoided and thereare yet many conflicts that still remainunresolved. Even in those conflicts inwhich non-professional soldiers wereinducted, children were not recruited todo battle. Nonetheless, the region’schildren—tens of millions of them—areengaged in another kind of war—thecontinuing war against poverty.
There are now many laws on thestatute books of many countries,developed and developing, and also onthose of international organisations suchas the ILO, to prevent children fromentering the work place. But laws do notalways provide the right solution tocomplex problems such as child labour.There is no question that it is indeedinhuman and insensitive to press youngchildren—boys and girls—into theworkforce. However, when the wagesearned by children form a significantcomponent of a poor family’s totalearnings, it can be self-defeating to takethese children out of the workforce andcause increased misery in the absence ofproper alternatives. This is one more areawhere we part from conventional andreceived wisdom. What is needed is apolicy framework that ensures thatworking children do not work inhazardous conditions, or poor environ-ment, and do not suffer seriousdeprivations to their mental and physicaldevelopment, and that they are providedsuitable opportunities for education eventhough they may be spending some timein the work place. In South Asia, thereare some NGO programmes supportedmostly by UNICEF which provideeducation to the working children. But inview of the magnitude of the problem,there is a need for many suchprogrammes.
Another characteristic of South Asia,which distinguishes it from otherdeveloping parts of the world, is thetreatment of women in the society. The
Centre’s 2000 report, titled The GenderQuestion, focused on the issue of genderand development. It underscored severalcharacteristics of the South Asiansituation, which has resulted in severediscrimination against women. In acelebrated series of articles, Amartya Sen,the Nobel Prize winning Indianeconomist, has highlighted the problemof ‘missing women’ in Asia. These arethe women who do not appear in nationalcensuses in the number expected from anormal distribution of the sexes in anypopulation. Women are ‘missing’ in SouthAsia either because of explicit or implicitfemale infanticide; or neglect of women’shealth problems; or, again, because ofunder-reporting by the heads ofhouseholds when approached to takepopulation counts. All this has a bearingon female employment. If the proportionof women in a particular population isunder-reported, policymakers cannotdevise appropriate policies. If femaleunder-representation is the result ofinfanticide or discrimination in theprovision of health care, then that posesa different set of problems.
In terms of employment, we shouldemphasise that South Asia has one of thelowest female participation rates in thedeveloping world. This has graveconsequences for any policy aimed athuman development and povertyalleviation. Studies have shown thatwomen tend to spend a much larger shareof their incomes on meeting the basicneeds of their families. Having womenparticipate in the labour force andensuring that the compensation for thework they do is comparable to thatperformed by men, are important partsof any strategy aimed at employment as acontributor to poverty alleviation.
As suggested in the 2000 report, thesubject of women’s employment getsentangled in the deeply rooted culturalpractices and beliefs. Anthropologists,more than economists, have begun torecognise how difficult it is to makeeconomic progress when it is inhibitedby cultural norms. In the 2000 report, we
The region’schildren–tens ofmillions of them–are engaged in thecontinuing waragainst poverty
Working out of Poverty: A Conceptual Framework 17
touched upon the problem posed bycultural constraints for women’sdevelopment. We discussed the structuresof South Asian patriarchy and how theywere impacting on the situation ofwomen. We noted in that report thatwhile South Asian languages do not haveterms to define gender, Bangla, Hindi andUrdu all have words—pitratontio, pitrasattaand pidarshahi—to define patriarchy. ‘Smallwonder that patriarchy remainsunassailable in South Asia under the coverof gender-blind policies that take existinggender relations for granted, whilewomen’s particular concerns are relegatedto ‘women’s issues,’ we wrote at thattime.4
Much of South Asia’s workforceremains engaged in agriculture, which isoperating at a level much below itsconsiderable potential. We explored thissubject extensively in the Centre’s reportof 2002 titled Agriculture and RuralDevelopment. It was emphasised in thatdocument that no government in theregion had given much attention toimproving the productivity—and,therefore, the incomes—of the agri-cultural workforce. This is unfortunateand much can be accomplished in thisarea. That there is a considerable gapbetween the potential and real incomeshas been demonstrated vividly by thesmall and medium sized farmers in theIndian state of Punjab. Their remarkableperformance in adopting first the ‘high-yielding’ crop technology in the late1960s, and much of the 1970s, and thenbuilding on top of that ‘green revolution’an agricultural sector that has becomehighly productive compared to the restof the sub-continent, provides hope tohundreds of millions of farmers workingin the South Asian agriculture. But thetransformation of the Indian Punjab’sagriculture did not happen without thestates support.
A series of state governments run bythe people with deep roots in the soil ofthe Indian Punjab were fully aware ofwhat the farmers needed in order toimprove their productivity. Sensitive to
the needs of the farming population, thegovernment of Punjab provided themwith credit, new seeds, water andelectricity. At the same time, thegovernment invested large amounts indeveloping physical infrastructure such asfarm to market roads, storage facilitiesand extension centres. A first classagricultural research institution was builtat Ludhiana, which became a universitythat now ranks among the very best inthe world.
All this is worth recounting since theagricultural revolution in the IndianPunjab not only turned the state into agranary for the country, it also found jobsfor all those who were looking for work.The agricultural sector in the IndianPunjab was the only part of the SouthAsian economy in the 1970s and 1980sthat experienced serious labour shortages.To meet the demand for agriculturalworkers, particularly during the busyplanting and harvesting seasons, farmersin Punjab imported labour from theneighbouring states. The Indian state ofPunjab, in other words, not only fed otherparts of that vast country, but also servedas a safety valve for the over-populatedstates in the neighbourhood that hadseveral problems of underemploymentand unemployment.
The Indian state of Punjab is not theonly area in South Asia that was able tobreak out of tradition and create arevolution for its workforce. Somethingsimilar happened in Bangladesh where theconcept of micro-credit was insti-tutionalised by Professor MuhammadYunus. His Grameen Bank broke newground and set the stage for thedevelopment of an entirely new set ofenterprises to help finance the economicactivities of essentially the rural poor. Butthere is an irony in the success of theGrameen Bank. It has been replicatedmore outside South Asia than withinSouth Asia. According to oneentrepreneur operating in this area, thetotal market for micro-loans worldwideis $3 billion. It could grow to $10 billionin the next decade if entrepreneurs could
Much of SouthAsia’s workforceremains engaged inagriculture, which isoperating at a levelmuch below itsconsiderablepotential
18 Human Development in South Asia 2003
be found to go the way of GrameenBank.5 Much of this potential market isin South Asia. Very little of it is beingreached by micro-finance institutionsmodelled after the Grameen Bank.
Microfinance is an area where the threecomponents of humane governanceidentified in the Centre’s 1999 reportmeet. This form of finance has beenpractised by institutions that have grownout of the civil society. They have a placein the economic system since moreformal parts of the financial structure—‘good economic governance’ in thelanguage of the 1999 report—failed toserve the credit needs of entrepreneurs,who had no collateral to offer other thanthe product of their own work. In theabsence of collateral, ‘good politicalgovernance,’ the third element in theconcept of humane governance, canprepare the legal environment in whichthe institutions providing microfinancecan operate.
With so much of South Asia’spopulation resident in and working in thecountryside, and with the non-agriculturalsector growing at rates two to three timesthe rate of increase in agricultural output,we should see a pick up in rural-urbanmigration in the coming decades. SouthAsia already has half a dozen or so citieswith populations of more than ten millionpeople. Their size will increaseconsiderably in the next few years. Someof these cities will probably double in sizeby the year 2010. This obviously hasenormous implications for labourabsorption and for the perpetuation—ifnot further aggravation—of the problemsof underemployment and unemployment.
If the experience of the world’s othermega-cities is any guide, much of thisinflow of people into the urban areas willbe first accommodated in the lowproductivity service sector. Is there a wayfor increasing their efficiency and hencetheir incomes? What role could thegovernment play in bringing this about?
There is no particular reason whySouth Asia should follow the path alreadytraversed by other developing regions of
the world which have reached a higherlevel of urbanisation than the currentsituation in this group of countries. Itshould be possible to skip to some extentthe phase in which the service sectorpicks up the surplus workers from thecountryside. This, as we indicated above,was the theme explored in the ILOreports in which the role of the informalsector was identified as the source ofemployment for those who had recentlyarrived from the countryside. We arefamiliar with the tens of thousands ofvendors that clog the streets of the mega-cities in Latin America and many parts ofSouth Asia.
One way of leap-frogging over theexperience of other countries is tocombine education, training, finance andentrepreneurship to develop sectors suchas Information Technology (IT) that havealready brought such handsome dividendsto the southwestern states of India. Thesestates have been so successful inproviding employment for their abundantworkforce that in the first decade of thetwenty-first century, they have begun toexperience the kind of labour shortageswhich the Indian state of Punjab dealtwith a quarter century ago. The offshoremodel of labour use that has worked sowell in the IT sector should also be ableto deliver employment opportunities inthe labour rich countries of South Asia.
The IT sector is not the only onewhich is labour and skill intensive. Thereare other parts of the service economywhich offer similar opportunities to therapidly urbanising workforce in SouthAsia. There are possibilities for large-scaleemployment in sectors such as health,education, entertainment, finance andtourism.
A strategy aimed at reducing the levelsof unemployment and underemploymentand making more productive the jobsalready held by those who are employedhas to be cast within a broader strategyof economic development. This report isnot the place for an extensive discussionof the various strategies pursued by thegovernments in the region that have been
There arepossibilities forlarge-scaleemployment insectors such ashealth, education,entertainment,finance and tourism
Working out of Poverty: A Conceptual Framework 19
in office at various points in the sub-continent’s history. Nonetheless, it wouldbe important to underscore thosecomponents of the past strategies thathave inhibited a greater use of theabundant workforce.
While much of what we have saidabove is related to specific areas whereSouth Asia faces challenges inaccommodating its large workforce, theemployment strategy must be animportant component of the overallapproach to development. There is anextensive and growing literatureexplaining why South Asia has fallen sofar behind the countries of East Asia overthe last half century. The story has beenwell told and by now is well known. Whathas not drawn sufficient attention in thisstory is that the emphasis in South Asiaon the policies favouring state ownershipof economic assets, preference ofmanufacturing over agriculture and theservice sector, and strong preference ofimport substitution over exportpromotion all affected the levels ofemployment and the quality of the jobsthat were created.
South Asia had much higher capital tolabour ratio in the way it developedvarious parts of its economy than couldbe justified by the size, geographicdistribution and age composition of itslabour force. It failed to take advantageof its large workforce to gain marketshares in the world economy for theproducts that could be produced bylabour intensive techniques. Thatapproach was followed with extraordinarysuccess by China in the last quartercentury. By turning the state into anemployer of last resort—at times even ofthe first resort—the South Asiangovernments did not succeed in creatingthe incentive structure that would haveencouraged potential workers to seekappropriate education and skilldevelopment. The South Asian states alsofailed to evolve linkages between researchand development on the one side andmanufacturing on the other. Such linkageswere developed with considerable success
in East Asia, first by South Korea andTaiwan, and later by China. Theextraordinary growth of high-techindustry in the first two countries is anillustration of what the right set ofgovernment policies can accomplish inimproving the workers’ productivity.
The early approach to development inSouth Asia also placed the crucialfinancial sector in the hands of thegovernment. The state run financialinstitutions fed resources to the largecapital-intensive state enterprises, leavingthe small and medium sized enterprisesat the mercy of the informal sector. Thatthe right interface between finance,industry and commerce can help inimproving labour absorption has beendemonstrated well by the way theTaiwanese economy developed. Thefinancial sector in that country was ableto support the development of small andmedium enterprises that were much morelabour intensive than their largercounterparts. Even today, althoughTaiwan can be considered as a fullyindustrialised country on its way tobecoming post-industrial and post-modern, small and medium enterprisesremain the economy’s back-bone.
A development strategy for South Asiashould encompass not only the need toprovide employment opportunities to itslarge and expanding workforce, it shouldalso take full advantage of the process ofchange that is altering the shape andstructure of the global economy.Globalisation is a much discussedphenomenon. It includes many things, inparticular, financial flows across bordersand trade among nations. Both aresignificant for development that is labourintensive. But as discussed in the Centre’sreport on globalisation published in 2001,this process can also pose seriousproblems for the developing world if thepolicymakers are not fully cognisant ofwhat it really entails. Those who havestudied the financial crisis in East Asia,in particular the Nobel Prize winningeconomist Joseph Stiglitz, haveunderscored how globalisation can wreak
South Asian statesfailed to evolvelinkages betweenresearch anddevelopment on theone side andmanufacturing onthe other
20 Human Development in South Asia 2003
havoc when the countries in thedeveloping world do not take action toprotect themselves against some of itsadverse consequences. After theenormous pain suffered by several EastAsian countries where tens of millions ofpeople lost their jobs and livelihood,consensus has developed that prematureand full opening of the markets—especially the financial markets—cancause enormous damage to the recipientcountries. Short-term capital flows takeplace at the flick of a computer’s switch.These flows are also nervous. They candepart quickly, leaving in their wakedevastation and job losses that cancreate—in fact, did create—great misery.Even the International Monetary Fund(IMF), the institution that had backedmost forcefully the adoption of policiesunder the collective title of The WashingtonConsensus, has more recently taken theposition that it is legitimate for countriesto make it expensive for short-termcapital to move quickly in and out of thedeveloping world. The IMF has alsoconcluded, albeit reluctantly, that it islegitimate to use public finance to createnew jobs when unemployment becomesa serious burden on the economy. TheIMF, in other words, has rediscoveredKeynesian economics to treatunemployment and jobless economicrecoveries in the countries faced withextreme distress.
Given the timing of this report—thewinter of 2003—the area of globalisationwhich concerns us most is that of furtherliberalisation of global trade. The progressmade by the Doha round of negotiationswould have been reviewed by tradeministers meeting in Cancun, Mexicobefore this report hits its intendedaudiences. The developing world hasrightly taken the position that any furtheropening of their markets must not be atthe expense of the employment of theircitizens. They have focused muchattention on the policies adopted by mostdeveloped countries that heavily subsidisetheir farmers at the expense of jobs and
earnings of the poor farmingcommunities in the developing world.
The problem is this: each year richcountries spend more than $1 billion aday supporting their agriculturalproducers—about six times the amountthey give in foreign aid. The EuropeanUnion and the US account for almosttwo-thirds of total spending. The subsidytranslates into rocketing levels of output,fewer imports and the dumping of vastsurpluses on world markets. Farmers indeveloping countries lose on severalcounts. Subsidised exports from richcountries undercut them in both the localand global markets, while high importbarriers have shut them off from richcountry markets.
As Kevin Watkins, the head ofresearch at Oxfam put it recently,‘Northern governments like to lecture onthe merits of open markets. But successin world agriculture depends less oncomparative advantage than oncomparative access to subsidies—andpoor countries lose every time.’6
There are three main conclusions wereach—and present to our audiences—inthis report. First, much of the persistentunemployment and underemployment inSouth Asia can be laid at the door of thestate. The states of South Asia have failedto pursue macroeconomic policies thatwould have generated employmentopportunities for the large and very youngpopulation in the region. Even after thebeginning of the process of economicreforms in Bangladesh, India and Pakistanin the early 1990s, the state in each casehas not adopted job creation as an explicitobjective of macroeconomic policies. Thestate has also failed in terms of improvingsocial services—in particular providingeducation, training and basic health-care—to a vast number of people.Without proper human development—arecurrent theme in these reports—SouthAsia will not be able to provideproductive employment to its largepopulation. The state has failed inparticular in helping women and childrento climb out of poverty.
Without properhuman development,South Asia will notbe able to provideproductiveemployment to itslarge population
Working out of Poverty: A Conceptual Framework 21
Then there is the second kind of failurethat we wish to underscore and that is onthe part of multilateral organisations thathave advised the South Asian nations andprovided them with financial assistancefor more than half a century. Even whenthey did focus on social development,their emphasis was sometimes misplaced.We know now from the experience ofseveral developing countries that bysimply emphasising the importance ofprimary education, states don’t preparetheir people either for productiveemployment or for attitudinal change—two imperatives of increase in earningsand, therefore, alleviation of poverty.Children have to stay in school for muchlonger periods of time—for as long aseight to ten years to prepare theworkforce for the workplace.
The third and equally egregious failurein this area is that of the developed world,whose leaders have been participating ina series of global conferences, but havenot shown the political will to hurt theirdomestic constituencies a little bit to helpthe poor and the unemployed in the
developing world a great deal. We noticethese failures in a number of areas. Today,four decades after the developed worldhad pledged to transfer at least 0.7 percent of its combined GDP to thedeveloping countries as aid, it is preparedto extend less than two-fifths of that.United States, the world’s richest country,gives only 0.1 per cent of its GDP as aidto the developing countries. And asignificant proportion of this is providedto the nations in which Washington hasstrategic and political interests. Theworld’s rich nations have also failed toopen their markets to the goods andcommodities produced by the poor of thedeveloping world especially when suchopening would come at the expense oftheir own producers.
These three failures—of the state inthe developing world, of multilateraldevelopment agencies, and of the state inthe developed world—need to berecognised and emphasised. If thathappens, we have a rich agenda for policyaction by policymakers all across theglobe.
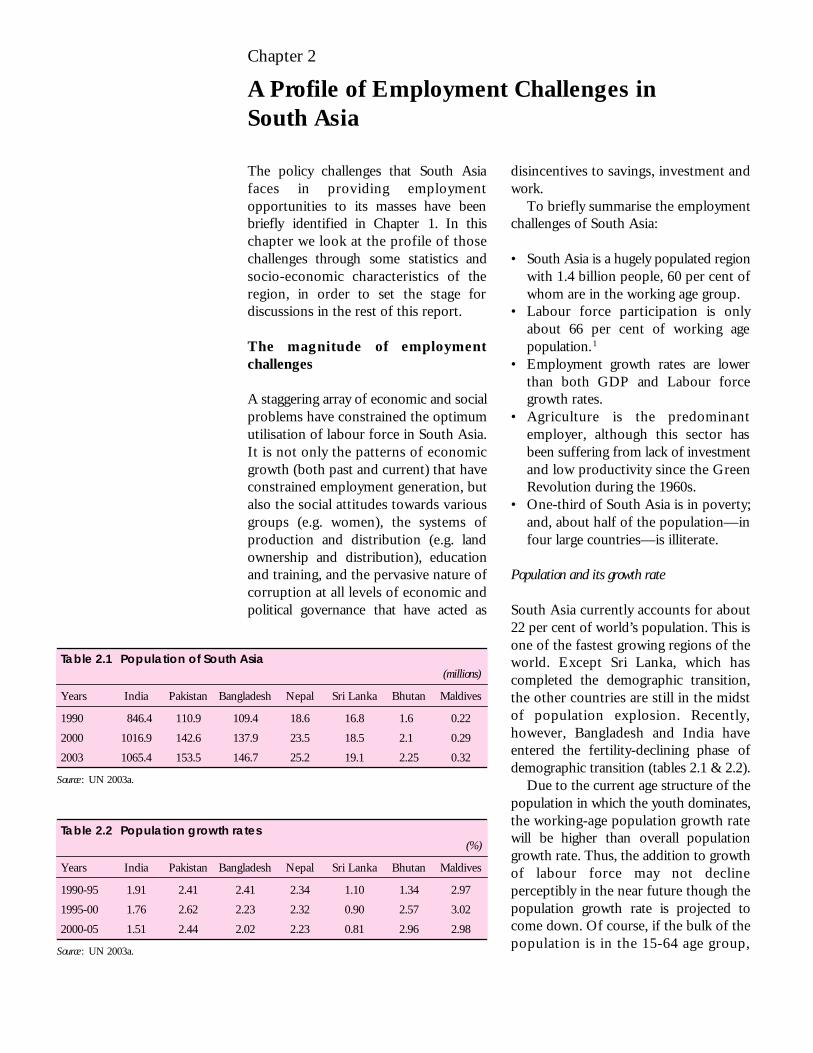
22 Human Development in South Asia 2003
The policy challenges that South Asiafaces in providing employmentopportunities to its masses have beenbriefly identified in Chapter 1. In thischapter we look at the profile of thosechallenges through some statistics andsocio-economic characteristics of theregion, in order to set the stage fordiscussions in the rest of this report.
The magnitude of employmentchallenges
A staggering array of economic and socialproblems have constrained the optimumutilisation of labour force in South Asia.It is not only the patterns of economicgrowth (both past and current) that haveconstrained employment generation, butalso the social attitudes towards variousgroups (e.g. women), the systems ofproduction and distribution (e.g. landownership and distribution), educationand training, and the pervasive nature ofcorruption at all levels of economic andpolitical governance that have acted as
disincentives to savings, investment andwork.
To briefly summarise the employmentchallenges of South Asia:
• South Asia is a hugely populated regionwith 1.4 billion people, 60 per cent ofwhom are in the working age group.
• Labour force participation is onlyabout 66 per cent of working agepopulation. 1
• Employment growth rates are lowerthan both GDP and Labour forcegrowth rates.
• Agriculture is the predominantemployer, although this sector hasbeen suffering from lack of investmentand low productivity since the GreenRevolution during the 1960s.
• One-third of South Asia is in poverty;and, about half of the population—infour large countries—is illiterate.
Population and its growth rate
South Asia currently accounts for about22 per cent of world’s population. This isone of the fastest growing regions of theworld. Except Sri Lanka, which hascompleted the demographic transition,the other countries are still in the midstof population explosion. Recently,however, Bangladesh and India haveentered the fertility-declining phase ofdemographic transition (tables 2.1 & 2.2).
Due to the current age structure of thepopulation in which the youth dominates,the working-age population growth ratewill be higher than overall populationgrowth rate. Thus, the addition to growthof labour force may not declineperceptibly in the near future though thepopulation growth rate is projected tocome down. Of course, if the bulk of thepopulation is in the 15-64 age group,
Chapter 2
A Profile of Employment Challenges inSouth Asia
Table 2.1 Population of South Asia(millions)
Years India Pakistan Bangladesh Nepal Sri Lanka Bhutan Maldives
1990 846.4 110.9 109.4 18.6 16.8 1.6 0.22
2000 1016.9 142.6 137.9 23.5 18.5 2.1 0.29
2003 1065.4 153.5 146.7 25.2 19.1 2.25 0.32
Source : UN 2003a.
Table 2.2 Population growth rates(%)
Years India Pakistan Bangladesh Nepal Sri Lanka Bhutan Maldives
1990-95 1.91 2.41 2.41 2.34 1.10 1.34 2.97
1995-00 1.76 2.62 2.23 2.32 0.90 2.57 3.02
2000-05 1.51 2.44 2.02 2.23 0.81 2.96 2.98
Source : UN 2003a.
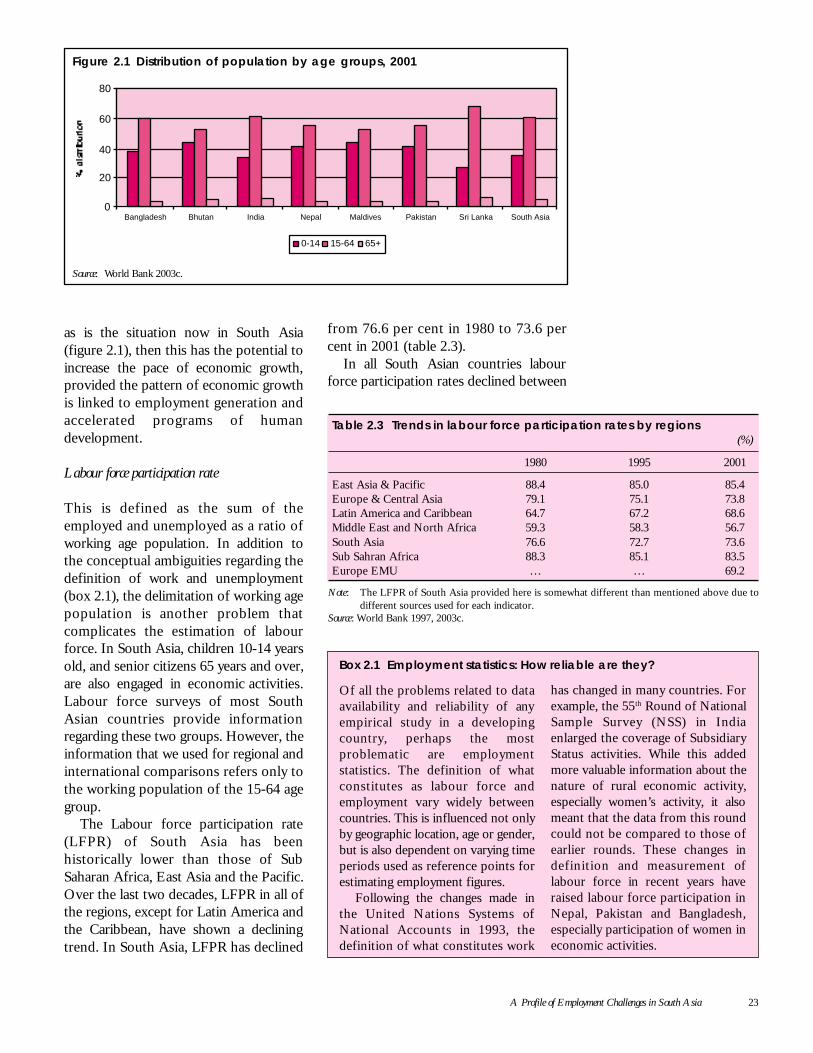
A Profile of Employment Challenges in South Asia 23
as is the situation now in South Asia(figure 2.1), then this has the potential toincrease the pace of economic growth,provided the pattern of economic growthis linked to employment generation andaccelerated programs of humandevelopment.
Labour force participation rate
This is defined as the sum of theemployed and unemployed as a ratio ofworking age population. In addition tothe conceptual ambiguities regarding thedefinition of work and unemployment(box 2.1), the delimitation of working agepopulation is another problem thatcomplicates the estimation of labourforce. In South Asia, children 10-14 yearsold, and senior citizens 65 years and over,are also engaged in economic activities.Labour force surveys of most SouthAsian countries provide informationregarding these two groups. However, theinformation that we used for regional andinternational comparisons refers only tothe working population of the 15-64 agegroup.
The Labour force participation rate(LFPR) of South Asia has beenhistorically lower than those of SubSaharan Africa, East Asia and the Pacific.Over the last two decades, LFPR in all ofthe regions, except for Latin America andthe Caribbean, have shown a decliningtrend. In South Asia, LFPR has declined
from 76.6 per cent in 1980 to 73.6 percent in 2001 (table 2.3).
In all South Asian countries labourforce participation rates declined between
0
20
40
60
80
Bangladesh Bhutan India Nepal Maldives Pakistan Sri Lanka South Asia
Figure 2.1 Distribution of population by age groups, 2001
0-14 15-64 65+
Source: World Bank 2003c.
Box 2.1 Employment statistics: How reliable are they?
Of all the problems related to dataavailability and reliability of anyempirical study in a developingcountry, perhaps the mostproblematic are employmentstatistics. The definition of whatconstitutes as labour force andemployment vary widely betweencountries. This is influenced not onlyby geographic location, age or gender,but is also dependent on varying timeperiods used as reference points forestimating employment figures.
Following the changes made inthe United Nations Systems ofNational Accounts in 1993, thedefinition of what constitutes work
has changed in many countries. Forexample, the 55th Round of NationalSample Survey (NSS) in Indiaenlarged the coverage of SubsidiaryStatus activities. While this addedmore valuable information about thenature of rural economic activity,especially women’s activity, it alsomeant that the data from this roundcould not be compared to those ofearlier rounds. These changes indefinition and measurement oflabour force in recent years haveraised labour force participation inNepal, Pakistan and Bangladesh,especially participation of women ineconomic activities.
Table 2.3 Trends in labour force participation rates by regions(%)
1980 1995 2001
East Asia & Pacific 88.4 85.0 85.4Europe & Central Asia 79.1 75.1 73.8Latin America and Caribbean 64.7 67.2 68.6Middle East and North Africa 59.3 58.3 56.7South Asia 76.6 72.7 73.6Sub Sahran Africa 88.3 85.1 83.5Europe EMU … … 69.2
Note: The LFPR of South Asia provided here is somewhat different than mentioned above due todifferent sources used for each indicator.
Source: World Bank 1997, 2003c.
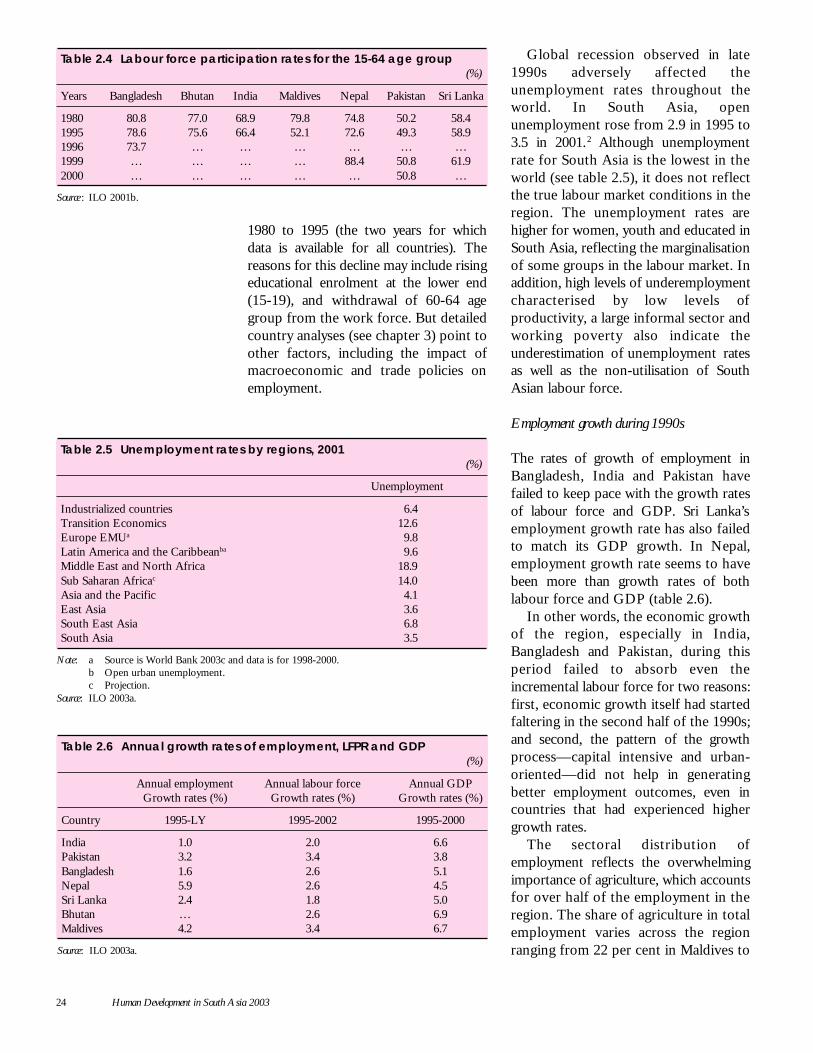
24 Human Development in South Asia 2003
1980 to 1995 (the two years for whichdata is available for all countries). Thereasons for this decline may include risingeducational enrolment at the lower end(15-19), and withdrawal of 60-64 agegroup from the work force. But detailedcountry analyses (see chapter 3) point toother factors, including the impact ofmacroeconomic and trade policies onemployment.
Global recession observed in late1990s adversely affected theunemployment rates throughout theworld. In South Asia, openunemployment rose from 2.9 in 1995 to3.5 in 2001. 2 Although unemploymentrate for South Asia is the lowest in theworld (see table 2.5), it does not reflectthe true labour market conditions in theregion. The unemployment rates arehigher for women, youth and educated inSouth Asia, reflecting the marginalisationof some groups in the labour market. Inaddition, high levels of underemploymentcharacterised by low levels ofproductivity, a large informal sector andworking poverty also indicate theunderestimation of unemployment ratesas well as the non-utilisation of SouthAsian labour force.
Employment growth during 1990s
The rates of growth of employment inBangladesh, India and Pakistan havefailed to keep pace with the growth ratesof labour force and GDP. Sri Lanka’semployment growth rate has also failedto match its GDP growth. In Nepal,employment growth rate seems to havebeen more than growth rates of bothlabour force and GDP (table 2.6).
In other words, the economic growthof the region, especially in India,Bangladesh and Pakistan, during thisperiod failed to absorb even theincremental labour force for two reasons:first, economic growth itself had startedfaltering in the second half of the 1990s;and second, the pattern of the growthprocess—capital intensive and urban-oriented—did not help in generatingbetter employment outcomes, even incountries that had experienced highergrowth rates.
The sectoral distribution ofemployment reflects the overwhelmingimportance of agriculture, which accountsfor over half of the employment in theregion. The share of agriculture in totalemployment varies across the regionranging from 22 per cent in Maldives to
Table 2.4 Labour force participation rates for the 15-64 age group(%)
Years Bangladesh Bhutan India Maldives Nepal Pakistan Sri Lanka
1980 80.8 77.0 68.9 79.8 74.8 50.2 58.41995 78.6 75.6 66.4 52.1 72.6 49.3 58.91996 73.7 … … … … … …1999 … … … … 88.4 50.8 61.92000 … … … … … 50.8 …
Source : ILO 2001b.
Table 2.6 Annual growth rates of employment, LFPR and GDP(%)
Annual employment Annual labour force Annual GDPGrowth rates (%) Growth rates (%) Growth rates (%)
Country 1995-LY 1995-2002 1995-2000
India 1.0 2.0 6.6Pakistan 3.2 3.4 3.8Bangladesh 1.6 2.6 5.1Nepal 5.9 2.6 4.5Sri Lanka 2.4 1.8 5.0Bhutan … 2.6 6.9Maldives 4.2 3.4 6.7
Source: ILO 2003a.
Table 2.5 Unemployment rates by regions, 2001(%)
Unemployment
Industrialized countries 6.4Transition Economics 12.6Europe EMUa 9.8Latin America and the Caribbeanba 9.6Middle East and North Africa 18.9Sub Saharan Africac 14.0Asia and the Pacific 4.1East Asia 3.6South East Asia 6.8South Asia 3.5
Note: a Source is World Bank 2003c and data is for 1998-2000.b Open urban unemployment.c Projection.
Source: ILO 2003a.
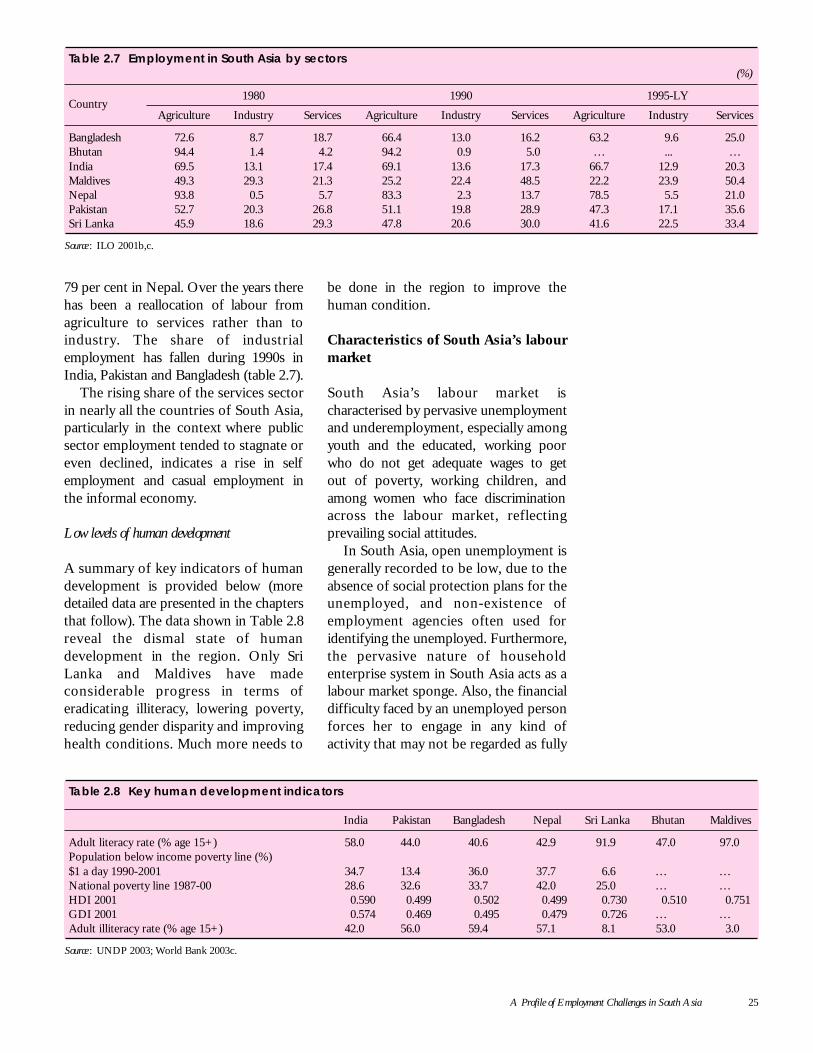
A Profile of Employment Challenges in South Asia 25
79 per cent in Nepal. Over the years therehas been a reallocation of labour fromagriculture to services rather than toindustry. The share of industrialemployment has fallen during 1990s inIndia, Pakistan and Bangladesh (table 2.7).
The rising share of the services sectorin nearly all the countries of South Asia,particularly in the context where publicsector employment tended to stagnate oreven declined, indicates a rise in selfemployment and casual employment inthe informal economy.
Low levels of human development
A summary of key indicators of humandevelopment is provided below (moredetailed data are presented in the chaptersthat follow). The data shown in Table 2.8reveal the dismal state of humandevelopment in the region. Only SriLanka and Maldives have madeconsiderable progress in terms oferadicating illiteracy, lowering poverty,reducing gender disparity and improvinghealth conditions. Much more needs to
be done in the region to improve thehuman condition.
Characteristics of South Asia’s labourmarket
South Asia’s labour market ischaracterised by pervasive unemploymentand underemployment, especially amongyouth and the educated, working poorwho do not get adequate wages to getout of poverty, working children, andamong women who face discriminationacross the labour market, reflectingprevailing social attitudes.
In South Asia, open unemployment isgenerally recorded to be low, due to theabsence of social protection plans for theunemployed, and non-existence ofemployment agencies often used foridentifying the unemployed. Furthermore,the pervasive nature of householdenterprise system in South Asia acts as alabour market sponge. Also, the financialdifficulty faced by an unemployed personforces her to engage in any kind ofactivity that may not be regarded as fully
Table 2.7 Employment in South Asia by sectors(%)
1980 1990 1995-LYCountry
Agriculture Industry Services Agriculture Industry Services Agriculture Industry Services
Bangladesh 72.6 8.7 18.7 66.4 13.0 16.2 63.2 9.6 25.0Bhutan 94.4 1.4 4.2 94.2 0.9 5.0 … ... …India 69.5 13.1 17.4 69.1 13.6 17.3 66.7 12.9 20.3Maldives 49.3 29.3 21.3 25.2 22.4 48.5 22.2 23.9 50.4Nepal 93.8 0.5 5.7 83.3 2.3 13.7 78.5 5.5 21.0Pakistan 52.7 20.3 26.8 51.1 19.8 28.9 47.3 17.1 35.6Sri Lanka 45.9 18.6 29.3 47.8 20.6 30.0 41.6 22.5 33.4
Source : ILO 2001b,c.
Table 2.8 Key human development indicators
India Pakistan Bangladesh Nepal Sri Lanka Bhutan Maldives
Adult literacy rate (% age 15+) 58.0 44.0 40.6 42.9 91.9 47.0 97.0Population below income poverty line (%)$1 a day 1990-2001 34.7 13.4 36.0 37.7 6.6 … …National poverty line 1987-00 28.6 32.6 33.7 42.0 25.0 … …HDI 2001 0.590 0.499 0.502 0.499 0.730 0.510 0.751GDI 2001 0.574 0.469 0.495 0.479 0.726 … …Adult illiteracy rate (% age 15+) 42.0 56.0 59.4 57.1 8.1 53.0 3.0
Source : UNDP 2003; World Bank 2003c.
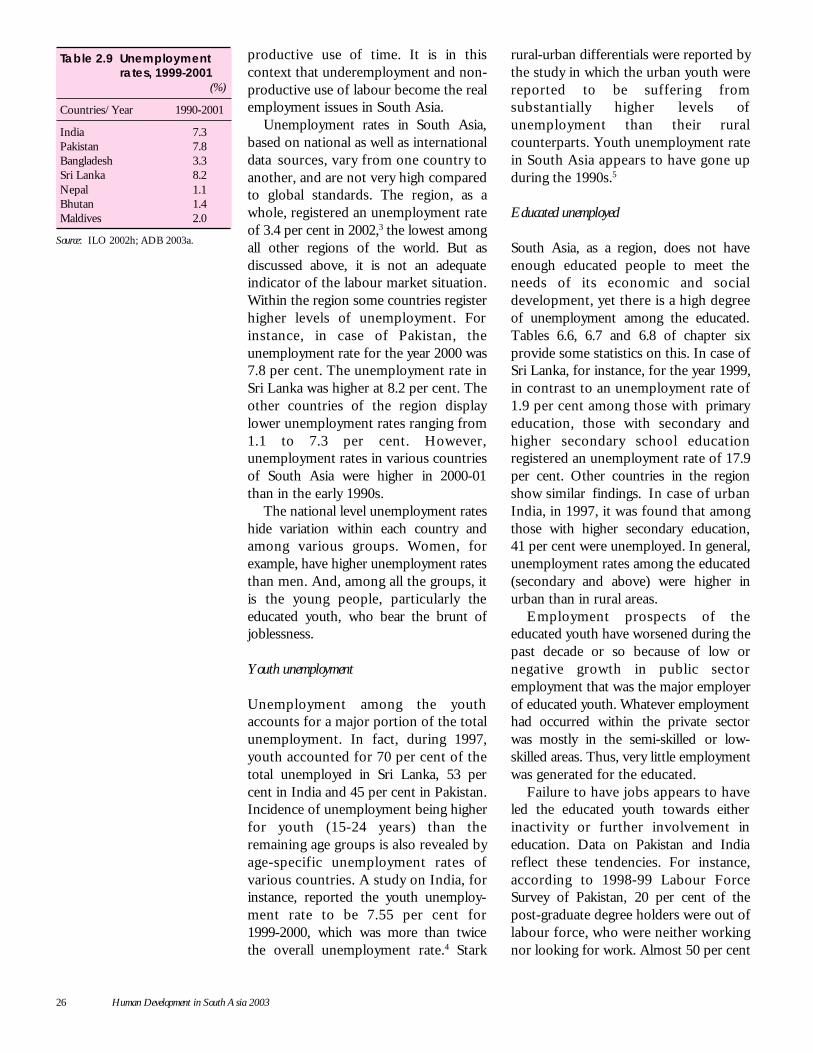
26 Human Development in South Asia 2003
productive use of time. It is in thiscontext that underemployment and non-productive use of labour become the realemployment issues in South Asia.
Unemployment rates in South Asia,based on national as well as internationaldata sources, vary from one country toanother, and are not very high comparedto global standards. The region, as awhole, registered an unemployment rateof 3.4 per cent in 2002,3 the lowest amongall other regions of the world. But asdiscussed above, it is not an adequateindicator of the labour market situation.Within the region some countries registerhigher levels of unemployment. Forinstance, in case of Pakistan, theunemployment rate for the year 2000 was7.8 per cent. The unemployment rate inSri Lanka was higher at 8.2 per cent. Theother countries of the region displaylower unemployment rates ranging from1.1 to 7.3 per cent. However,unemployment rates in various countriesof South Asia were higher in 2000-01than in the early 1990s.
The national level unemployment rateshide variation within each country andamong various groups. Women, forexample, have higher unemployment ratesthan men. And, among all the groups, itis the young people, particularly theeducated youth, who bear the brunt ofjoblessness.
Youth unemployment
Unemployment among the youthaccounts for a major portion of the totalunemployment. In fact, during 1997,youth accounted for 70 per cent of thetotal unemployed in Sri Lanka, 53 percent in India and 45 per cent in Pakistan.Incidence of unemployment being higherfor youth (15-24 years) than theremaining age groups is also revealed byage-specific unemployment rates ofvarious countries. A study on India, forinstance, reported the youth unemploy-ment rate to be 7.55 per cent for1999-2000, which was more than twicethe overall unemployment rate.4 Stark
rural-urban differentials were reported bythe study in which the urban youth werereported to be suffering fromsubstantially higher levels ofunemployment than their ruralcounterparts. Youth unemployment ratein South Asia appears to have gone upduring the 1990s.5
Educated unemployed
South Asia, as a region, does not haveenough educated people to meet theneeds of its economic and socialdevelopment, yet there is a high degreeof unemployment among the educated.Tables 6.6, 6.7 and 6.8 of chapter sixprovide some statistics on this. In case ofSri Lanka, for instance, for the year 1999,in contrast to an unemployment rate of1.9 per cent among those with primaryeducation, those with secondary andhigher secondary school educationregistered an unemployment rate of 17.9per cent. Other countries in the regionshow similar findings. In case of urbanIndia, in 1997, it was found that amongthose with higher secondary education,41 per cent were unemployed. In general,unemployment rates among the educated(secondary and above) were higher inurban than in rural areas.
Employment prospects of theeducated youth have worsened during thepast decade or so because of low ornegative growth in public sectoremployment that was the major employerof educated youth. Whatever employmenthad occurred within the private sectorwas mostly in the semi-skilled or low-skilled areas. Thus, very little employmentwas generated for the educated.
Failure to have jobs appears to haveled the educated youth towards eitherinactivity or further involvement ineducation. Data on Pakistan and Indiareflect these tendencies. For instance,according to 1998-99 Labour ForceSurvey of Pakistan, 20 per cent of thepost-graduate degree holders were out oflabour force, who were neither workingnor looking for work. Almost 50 per cent
Table 2.9 Unemploymentrates, 1999-2001
(%)
Countries/Year 1990-2001
India 7.3Pakistan 7.8Bangladesh 3.3Sri Lanka 8.2Nepal 1.1Bhutan 1.4Maldives 2.0
Source: ILO 2002h; ADB 2003a.
A Profile of Employment Challenges in South Asia 27
of female doctors and 35 per cent ofgraduates in different disciplines werereported to be out of the labour force. Incase of India,6 the study cited aboveprovides evidence on withdrawal ofeducated youth from labour force.
Underemployment
Underemployment is defined variously interms of the amount of time spent inwork, or the amount of income earned.This is regarded as a major problem incontrast to open unemployment in SouthAsia, due to predominance of agriculturein livelihood and family-based enterprises.However, problems related to lack of datapose an enormous challenge towards theestimation of the number ofunderemployed. Using time criteria, thoseworking less than 35 hours per week incase of Pakistan and 40 in case of SriLanka, for instance, around 15-20 percent of the employed are recorded to beunderemployed. In India too, thoseworking less than 40 hours a weekaccount for 34 per cent of the employed,while the corresponding number forNepal was 47 per cent in 1996. Theincidence of underemployment appears tobe higher among women and youth.
Working poor
The number of working poor has beendefined and estimated for differentcountries by ILO. An employed personliving in a poor household is defined asworking poor. Using this criterion, arecent report7 suggests that a substantialproportion of the employed can becharacterised as working poor. Forinstance, in 1997 in India, 46 per cent ofthe employed were defined as workingpoor. With the exception of Sri Lanka,where the percentage of working poorwas 7.3, the number of working poor inPakistan, Bangladesh and Nepal rangedfrom 30 to 40 per cent. According to oneestimate, currently 223 million people inSouth Asia, accounting for 47 per cent ofthe total employed in the informal sector,
were in the category of working poor.This high proportion of the employed,who failed to earn enough to get out ofpoverty, is reflective of the low as well asstagnating and declining levels of wagesand incomes provided by the labourmarket.
Child labour
Besides the high levels of working poor,there are also other manifestations of thedepressing nature of the labour market inSouth Asia. For instance, a substantialnumber of children between the ages of10-14 participate in the labour force,despite the commitment made by thegovernments in the region to eliminatechild labour. According to the WorldDevelopment Indicators 2002, 41 percent of the children of this group inNepal were reported to be in the labourforce; Bangladesh followed with 27 percent. With the exception of Sri Lankawhere it was reported to be only two percent, labour force participation rate ofchildren was over 12 per cent in theremaining countries. There has been adecline in labour force participation ofchildren, but there is not muchinformation about the time use ofchildren out of labour market.
Employment of women
The prevalence of pervasivediscrimination against women is reflectedin a number of labour market indicators.Women do not get sufficient recognitionfor their contribution to the economy andsociety. This is reflected in the very lowfemale labour force participation ratescompared to those of male. In India,female labour force participation was halfof that for males (in 2001), and inPakistan the corresponding number wasonly 18 per cent (see table 5.2). Theeducational gaps between women andmen in literacy and enrolment rates (seetable 5.3) are regarded as significantfactors for the low participation ofwomen in the job market. There is also a
Women do not getsufficient recognitionfor theircontribution to theeconomy and society
28 Human Development in South Asia 2003
segregation of female workforce in low-paying, low-productivity work (seetable 5.11). In recent years, efforts toaddress the invisibility of women in thelabour market, through expanding thedefinition of work, have resulted ingreater participation of women ineconomic activity in the national incomeaccounts of South Asia.
Characteristics of South Asianeconomy
The main features of South Asianeconomy, so far as employment of thepoor is concerned, are:
• About 90 per cent of the economy isdominated by the informal sector,which means that the vast majority ofworkers are outside the scope oflabour laws and social protection.
• Although the contribution ofagriculture to GDP has gone down,agriculture still provides employmentto more than half of the employedpeople in South Asia.
• Services sector has become animportant contributor to GDP; abouthalf the GDP in 2001 came fromservices sector.
• Although South Asia’s economicgrowth rates were reasonably good inthe context of the global economy, itsimpact on poverty and inequality wasnegative, underscoring the failure ofeconomic policies to link economicgrowth with poverty reduction throughemployment generation.
As the following chapters will pointout, since the 1980s, the economicpolicies of the South Asian governments(except Sri Lanka which started thisprocess even earlier) have shifted fromimport-substitution to export-promotion,and from state-controlled to market-focused strategy. Yet the impact onemployment, especially employment ofthe vast majority of people who live inrural areas and in urban slums, has not
been very successful. As a matter of fact,the impact of economic policies in recentyears has mostly been negative on thepoor. They have become poorer, and theinequality of income distribution betweendifferent groups of population haswidened.
Economic indicators of South Asia
Table 2.10 provides some indicators oneconomic growth and its structuraltransformation. Compared to 1980s, realGDP per capita has increased. Thecontribution to GDP by various sectorsshows the transformation that is takingplace in the economies of South Asia.Agriculture’s contribution to GDP hasgone down, and services’ contribution hasincreased. Poverty has increased in mostcountries or has remained stagnant (seechapter 3). Inequality of incomedistribution has become worse, which isa direct result of the lack of incomeearning opportunities for the masses inthe context of an expanding economy(see figure 2.2).
Economic growth
Over the past decade and a half, SouthAsian countries have implemented IMFand World Bank stabilisation andstructural adjustment programs withvarying degrees of success. Sri Lanka wasthe first country to start these reformprogrammes and India was the last.Overall, the regional GDP grew at anannual average rate of 5.7 per cent during1990-96, which was not very differentfrom the one experienced during 1980-90.
Except in Pakistan, where GDPgrowth has been lower in 1990scompared to 1980s, other South Asiancountries experienced gains in their GDPgrowth rates during 1990s. But if we lookat the rate of GDP growth since 1997,there has been an overall deceleration ofgrowth, as shown by country-specificexperiences in the next chapter (in moredetail).
The impact ofeconomic policies onemployment,especiallyemployment of thevast majority ofpeople who live inrural areas and inurban slums, hasnot been verysuccessful
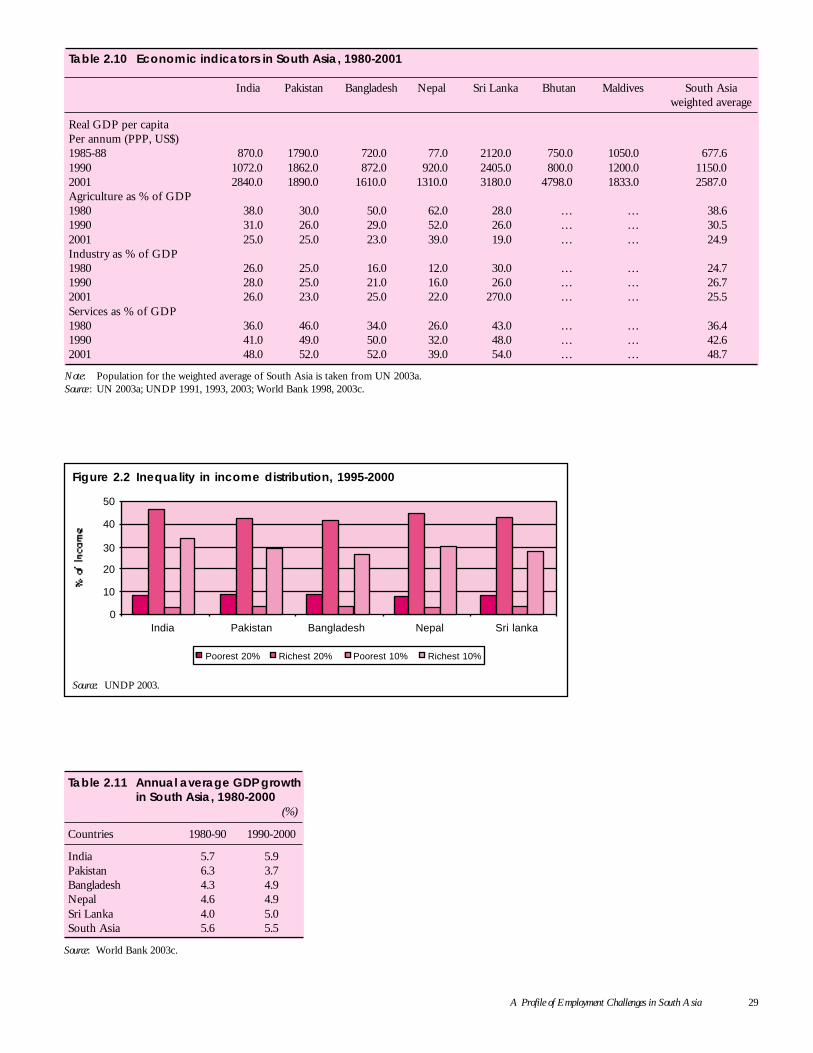
A Profile of Employment Challenges in South Asia 29
Table 2.10 Economic indicators in South Asia, 1980-2001
India Pakistan Bangladesh Nepal Sri Lanka Bhutan Maldives South Asiaweighted average
Real GDP per capitaPer annum (PPP, US$)1985-88 870.0 1790.0 720.0 77.0 2120.0 750.0 1050.0 677.61990 1072.0 1862.0 872.0 920.0 2405.0 800.0 1200.0 1150.02001 2840.0 1890.0 1610.0 1310.0 3180.0 4798.0 1833.0 2587.0Agriculture as % of GDP1980 38.0 30.0 50.0 62.0 28.0 … … 38.61990 31.0 26.0 29.0 52.0 26.0 … … 30.52001 25.0 25.0 23.0 39.0 19.0 … … 24.9Industry as % of GDP1980 26.0 25.0 16.0 12.0 30.0 … … 24.71990 28.0 25.0 21.0 16.0 26.0 … … 26.72001 26.0 23.0 25.0 22.0 270.0 … … 25.5Services as % of GDP1980 36.0 46.0 34.0 26.0 43.0 … … 36.41990 41.0 49.0 50.0 32.0 48.0 … … 42.62001 48.0 52.0 52.0 39.0 54.0 … … 48.7
Note: Population for the weighted average of South Asia is taken from UN 2003a.Source : UN 2003a; UNDP 1991, 1993, 2003; World Bank 1998, 2003c.
India Pakistan Bangladesh Nepal Sri lanka0
10
20
30
40
50
Figure 2.2 Inequality in income distribution, 1995-2000
Source: UNDP 2003.
Poorest 20% Richest 20% Poorest 10% Richest 10%
Table 2.11 Annual average GDP growthin South Asia, 1980-2000
(%)
Countries 1980-90 1990-2000
India 5.7 5.9Pakistan 6.3 3.7Bangladesh 4.3 4.9Nepal 4.6 4.9Sri Lanka 4.0 5.0South Asia 5.6 5.5
Source: World Bank 2003c.
30 Human Development in South Asia 2003
This chapter deals with the relationshipbetween economic growth andemployment in South Asia. In the firstsection, some conceptual issues andtheoretical possibilities in terms of theinteraction between employment andgrowth are explored. The second sectioncontains a brief evaluation of the pastperformance of South Asia in terms ofgrowth patterns and their effects onpoverty and employment. The thirdsection analyses the apparentcommonalities of experience across theregion, and the effects of macroeconomicpolicies, trade liberalisation andtechnological choices on employment.Issues of current interest, such as the roleof Information and CommunicationTechnologies (ICT) in generating newemployment, are also considered. Thefinal section explores some policyimplications.
Economic Growth and Employment:The Conceptual Issues
It may appear to be more than obviousto state that employment is related toeconomic growth. However, recentexperience across the world, in whichincreases in income and economic activityhave not been matched by commensurateincreases in employment (the much talkedabout phenomenon of ‘jobless growth’),have led to greater circumspection aboutthe relationship. It is now more generallyaccepted that it is not growth per se thatmatters, so much as the pattern ofgrowth, which effectively determines boththe quantity and quality of employmentgeneration.
There are various ways in whichmacroeconomic processes and policiesaffect labour market outcomes. In theshort term, clearly, the level of
employment is a function of the level ofaggregate demand in the system, whichin turn is dependent upon autonomousexpenditure such as private investmentand government spending. Quite apartfrom the direct multiplier effect of publicexpenditure, the positive associationbetween public and private investment isnow well established at an empirical levelfor most developing countries.2 Thismeans that one major determinant of thelevel of employment is the level of publicexpenditure. Under conditions ofunutilised capacity in the economy, itoperates directly to improve capacityutilisation, output and employmentthrough the multiplier process. Even inother circumstances, it can play a positiverole in terms of directly generatingemployment—easing supply bottlenecks,for example, in building infrastructure,and through its positive linkage effectswith private investment. Consequently,with a rise in aggregate employment, itusually becomes much less difficult forworkers to demand higher wages andbetter working conditions.
However, openness to trade andcapital flows changes this obvious ‘closedeconomy’ Keynesian relationship atseveral levels. First, it means that in mostsectors, the level of activity gets affectedby the relative degree of ‘competitive-ness’, which is in turn determined by acombination of existing domestic costsand relative prices, the exchange rate, andtrade policies affecting relative prices atthe border. Trade and exchange ratepolicies can operate to shift privateincentives, and therefore investment andemployment, in favour of tradeables awayfrom non-tradeables, or vice versa.Depending on the relative employmentintensity of tradeables and non-tradeables,this can, in turn, change both the level of
Chapter 3
Economic Growth and Employment inSouth Asia1
It is not growth perse that matters, somuch as the patternof growth, whichcan determine boththe quantity andquality ofemploymentgeneration
Economic Growth and Employment in South Asia 31
aggregate employment, and its distri-bution across sectors. Similar outcomescan result from other policies, that serveto shift incentives, such as credit andfinancial policies that direct credit orprovide special incentives to particularchosen sectors.
Second, openness to capital flows, andassociated financial liberalisation, can leadto changes in output and employmentlevels quite independent of anygovernment measures, besides puttingconstraints on government behaviour invarious ways. Financial openness, and theresultant need to attract or maintain levelsof capital inflow, imply constraints onfiscal and monetary behaviour ofgovernments, and dramatically reduce thepossibilities for earlier Keynesian styledemand management policies. It alsomeans that medium-term planning in theold style is no longer possible, since thelevel and direction of capital inflowscannot be predicted such as to allow forcomprehensive investment allocation insocially desired directions. Further, in thepast decade in particular, financialopenness has been strongly associatedwith high levels of volatility and instabilityin the economies of several emergingmarkets. Periods of capital inflow-ledbooms may be reflected in real exchangerate appreciation. This can consequentlychange the domestic employment leveland pattern through changes in domesticrelative prices and, therefore, incentives.These outcomes can then, in turn,become the initial causes for a change ininvestor confidence that is followed bycapital outflow resulting in a financial andeconomic crisis. It has been found thatthe workers tend to bear a dis-proportionate part of the burden of thesubsequent adjustment that is necessitatedin these economies, through falls in realwages and large losses in employment.
The point is that South Asia is now inan international context in which greatereconomic integration has drasticallyaltered the contours of public policy aswell as the requirements of employers.For most traded goods sectors, external
competitiveness has become the basicrequirement of survival and expansion,and a key element of this is seen byemployers to reside in labour marketflexibility. This, in turn, is often seen bysome commentators to have created a‘race to the bottom’ in terms of wagesand labour contracts, whereby evenminimal labour standards are under threatbecause of the perceived adverse effectson employers through higher wage costsand rigidities. There is, of course, a two-way relationship here: just as outwardorientation or the need to allow domesticproducers greater flexibility and lowerwage costs may determine patterns in thelabour market, so too the labour marketreform itself may become an importantcomplement to macroeconomic policy.This can occur through the ways in whichsuch policies change incentives for bothemployers and workers, and even in termsof providing a social cushion for shockslike inflation, cyclical behaviour etc.,which emerge in the process ofadjustment.3
A crucial link in the chain betweeninvestment and employment is theintermediating technological choice,which determines the pattern of labouruse. It is often argued in developingcountries that policies that raise the costof labour through regulation fororganised industry end up reducingemployment because they encourage thegreater use of labour saving technologies.This may in fact be a relevant concern.However, it must be recognised that inmost developing countries, includingthose in South Asia, technological choicesand changes do not reflect domesticresource availability as much as the factorproportion requirements of developedindustrial economies. These changes,which come in the form of new productsand changed processes, are typically morecapital intensive. Such changes, therefore,generally imply improvements in labourproductivity and the reduced number ofworkers per unit of output, quiteindependent of the relative price of labourin particular developing economies. The
In the past decade,financial opennesshas been stronglyassociated with highlevels of volatilityand instability inthe economies ofseveral emergingmarkets
32 Human Development in South Asia 2003
relative price of labour and capital at anyone time is, therefore, a relatively poorguide to the degree of capital intensity ofproduction.
Just as macroeconomic processesdetermine labour market patterns, suchpatterns, in turn, also affect themacroeconomic outcomes. Low levels ofemployment generation do not only resultfrom, but also contribute to, lowaggregate demand, and can thereforeintensify tendencies towards stagnation orrecession. Strongly segmented labourmarkets, with very different conditions ofwork and remuneration, can also createvery different and segmented patterns ofdemand for final goods. Such segmentedmarkets can also determine patterns oflabour supply that affect possibilities ofexpansion of particular industries orsectors of activity. In the absence ofpublic intervention, low productivitypatterns of economic activity tend to beassociated with, and reinforce, low ratesof employment expansion, creating ascenario of economic stagnation.
Because of all this, it can plausibly beargued that the primary determinant ofboth the volume of employment and theconditions of employment that prevail inmost sectors of any economy, aredetermined by factors other than thelabour market policies themselves.Indeed, typically policies that areaddressed specifically to the labourmarket alone can be irrelevant or evencounterproductive if other processes inthe economy are moving in the oppositedirection. If the aggregate demand forlabour is low because the economy isoperating in an unemploymentequilibrium with unutilised capacity, orbecause of structural reasons such as thepattern of technology, then newemployment generation will depend onpolicies which address these issuesdirectly. Similarly, attempts to improvelabour’s bargaining position only throughlegislation are likely to be much lesseffective in contexts of labour surplus andlow demand, in which individualemployers do not see additional profits
to be gained through increasedemployment. Nevertheless, there is atendency among policy makers in SouthAsia to attempt to deal with thesemacroeconomic employment outcomesthrough microeconomic changes,including changes in legislation thateffectively reduce the rights of workers,in the expectation that this will somehowdeal with the problem of inadequateemployment generation.
Growth, employment and poverty inSouth Asia: Experiences of countries
A brief review of the patterns ofeconomic development pursued in SouthAsia confirms the above theoreticalanalysis. The economic reformprogrammes of recent decades did notresult in adequate economic growth,increased employment, or reducedpoverty. South Asia, as a region, has sofar experienced almost a total delinkbetween economic growth andemployment generation.
India
Advocates of economic reform haveclaimed that the decade of reform haswitnessed India’s transition to a new,higher growth trajectory. The typical claimhas been that, as compared with the old‘Hindu rate of growth’ of around 3.5 percent per annum over the 1990s, the Indianeconomy was now set firmly on atrajectory involving a rate of growth ofwell over six per cent. It has been arguedthat despite the fiscal compression,resulting from the government’s effort tocontain the fiscal deficit in a period whenthe tax-GDP ratio was falling, liberalisationprovided a stimulus to private ‘animalspirits’ so that increasing privateinvestment more than compensated forthe sharp deceleration in public capitalformation during the 1990s. Optimisticprojections, on the basis of this perception,have even suggested that the economycould easily achieve a nine per cent rate ofgrowth in the near future.
South Asia, as aregion, has so farexperienced almost atotal delink betweeneconomic growthand employmentgeneration
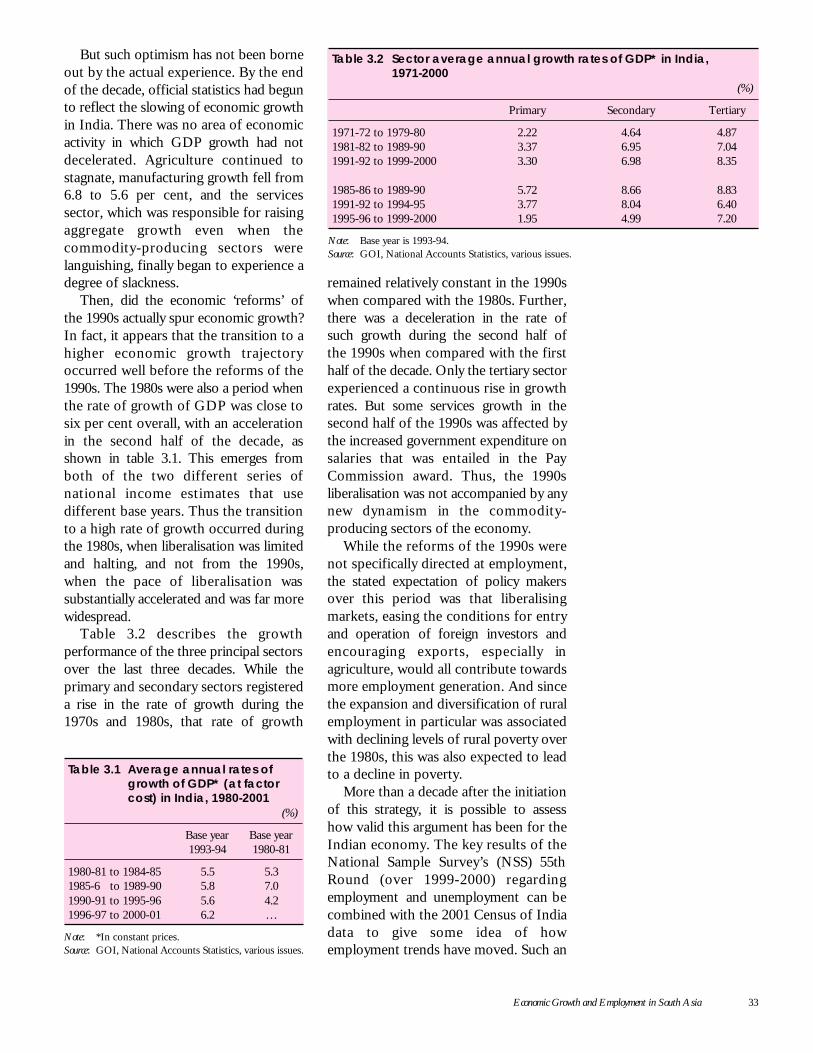
Economic Growth and Employment in South Asia 33
But such optimism has not been borneout by the actual experience. By the endof the decade, official statistics had begunto reflect the slowing of economic growthin India. There was no area of economicactivity in which GDP growth had notdecelerated. Agriculture continued tostagnate, manufacturing growth fell from6.8 to 5.6 per cent, and the servicessector, which was responsible for raisingaggregate growth even when thecommodity-producing sectors werelanguishing, finally began to experience adegree of slackness.
Then, did the economic ‘reforms’ ofthe 1990s actually spur economic growth?In fact, it appears that the transition to ahigher economic growth trajectoryoccurred well before the reforms of the1990s. The 1980s were also a period whenthe rate of growth of GDP was close tosix per cent overall, with an accelerationin the second half of the decade, asshown in table 3.1. This emerges fromboth of the two different series ofnational income estimates that usedifferent base years. Thus the transitionto a high rate of growth occurred duringthe 1980s, when liberalisation was limitedand halting, and not from the 1990s,when the pace of liberalisation wassubstantially accelerated and was far morewidespread.
Table 3.2 describes the growthperformance of the three principal sectorsover the last three decades. While theprimary and secondary sectors registereda rise in the rate of growth during the1970s and 1980s, that rate of growth
remained relatively constant in the 1990swhen compared with the 1980s. Further,there was a deceleration in the rate ofsuch growth during the second half ofthe 1990s when compared with the firsthalf of the decade. Only the tertiary sectorexperienced a continuous rise in growthrates. But some services growth in thesecond half of the 1990s was affected bythe increased government expenditure onsalaries that was entailed in the PayCommission award. Thus, the 1990sliberalisation was not accompanied by anynew dynamism in the commodity-producing sectors of the economy.
While the reforms of the 1990s werenot specifically directed at employment,the stated expectation of policy makersover this period was that liberalisingmarkets, easing the conditions for entryand operation of foreign investors andencouraging exports, especially inagriculture, would all contribute towardsmore employment generation. And sincethe expansion and diversification of ruralemployment in particular was associatedwith declining levels of rural poverty overthe 1980s, this was also expected to leadto a decline in poverty.
More than a decade after the initiationof this strategy, it is possible to assesshow valid this argument has been for theIndian economy. The key results of theNational Sample Survey’s (NSS) 55thRound (over 1999-2000) regardingemployment and unemployment can becombined with the 2001 Census of Indiadata to give some idea of howemployment trends have moved. Such an
Table 3.1 Average annual rates ofgrowth of GDP* (at factorcost) in India, 1980-2001
(%)
Base year Base year1993-94 1980-81
1980-81 to 1984-85 5.5 5.31985-6 to 1989-90 5.8 7.01990-91 to 1995-96 5.6 4.21996-97 to 2000-01 6.2 …
Note: *In constant prices.Source: GOI, National Accounts Statistics, various issues.
Table 3.2 Sector average annual growth rates of GDP* in India,1971-2000
(%)
Primary Secondary Tertiary
1971-72 to 1979-80 2.22 4.64 4.871981-82 to 1989-90 3.37 6.95 7.041991-92 to 1999-2000 3.30 6.98 8.35
1985-86 to 1989-90 5.72 8.66 8.831991-92 to 1994-95 3.77 8.04 6.401995-96 to 1999-2000 1.95 4.99 7.20
Note: Base year is 1993-94.Source: GOI, National Accounts Statistics, various issues.
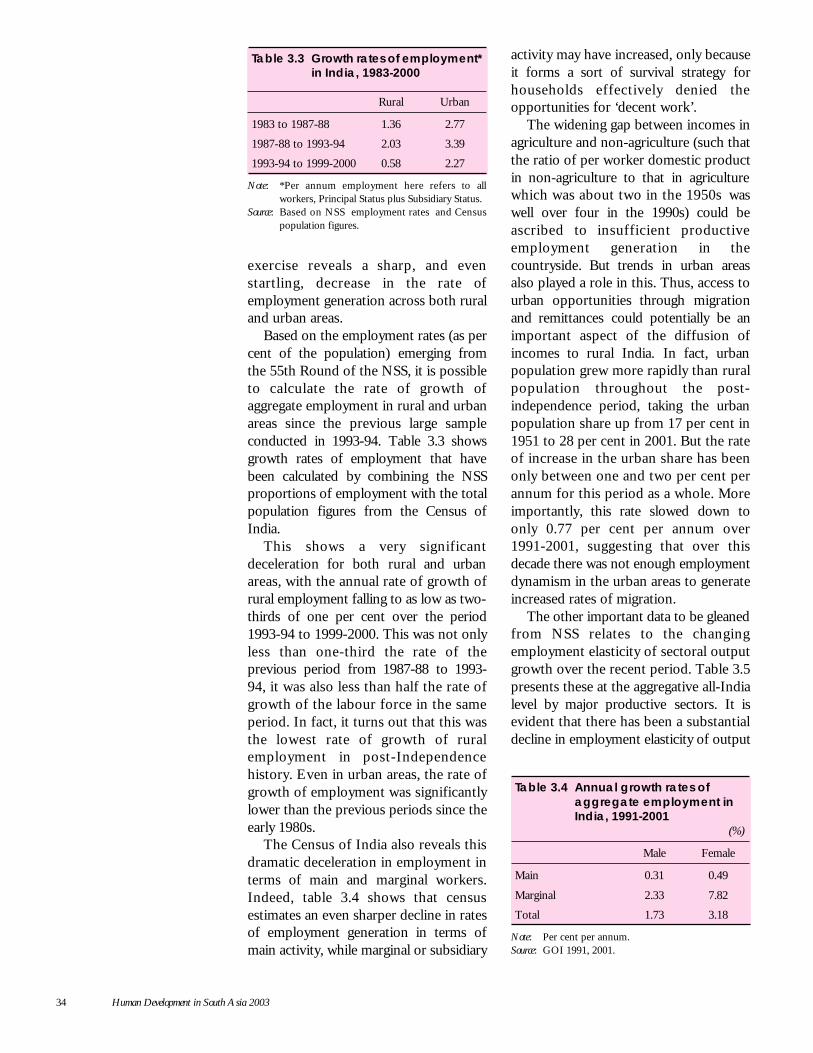
34 Human Development in South Asia 2003
exercise reveals a sharp, and evenstartling, decrease in the rate ofemployment generation across both ruraland urban areas.
Based on the employment rates (as percent of the population) emerging fromthe 55th Round of the NSS, it is possibleto calculate the rate of growth ofaggregate employment in rural and urbanareas since the previous large sampleconducted in 1993-94. Table 3.3 showsgrowth rates of employment that havebeen calculated by combining the NSSproportions of employment with the totalpopulation figures from the Census ofIndia.
This shows a very significantdeceleration for both rural and urbanareas, with the annual rate of growth ofrural employment falling to as low as two-thirds of one per cent over the period1993-94 to 1999-2000. This was not onlyless than one-third the rate of theprevious period from 1987-88 to 1993-94, it was also less than half the rate ofgrowth of the labour force in the sameperiod. In fact, it turns out that this wasthe lowest rate of growth of ruralemployment in post-Independencehistory. Even in urban areas, the rate ofgrowth of employment was significantlylower than the previous periods since theearly 1980s.
The Census of India also reveals thisdramatic deceleration in employment interms of main and marginal workers.Indeed, table 3.4 shows that censusestimates an even sharper decline in ratesof employment generation in terms ofmain activity, while marginal or subsidiary
activity may have increased, only becauseit forms a sort of survival strategy forhouseholds effectively denied theopportunities for ‘decent work’.
The widening gap between incomes inagriculture and non-agriculture (such thatthe ratio of per worker domestic productin non-agriculture to that in agriculturewhich was about two in the 1950s waswell over four in the 1990s) could beascribed to insufficient productiveemployment generation in thecountryside. But trends in urban areasalso played a role in this. Thus, access tourban opportunities through migrationand remittances could potentially be animportant aspect of the diffusion ofincomes to rural India. In fact, urbanpopulation grew more rapidly than ruralpopulation throughout the post-independence period, taking the urbanpopulation share up from 17 per cent in1951 to 28 per cent in 2001. But the rateof increase in the urban share has beenonly between one and two per cent perannum for this period as a whole. Moreimportantly, this rate slowed down toonly 0.77 per cent per annum over1991-2001, suggesting that over thisdecade there was not enough employmentdynamism in the urban areas to generateincreased rates of migration.
The other important data to be gleanedfrom NSS relates to the changingemployment elasticity of sectoral outputgrowth over the recent period. Table 3.5presents these at the aggregative all-Indialevel by major productive sectors. It isevident that there has been a substantialdecline in employment elasticity of output
Table 3.3 Growth rates of employment*in India, 1983-2000
Rural Urban
1983 to 1987-88 1.36 2.77
1987-88 to 1993-94 2.03 3.39
1993-94 to 1999-2000 0.58 2.27
Note: *Per annum employment here refers to allworkers, Principal Status plus Subsidiary Status.
Source: Based on NSS employment rates and Censuspopulation figures.
Table 3.4 Annual growth rates ofaggregate employment inIndia, 1991-2001
(%)
Male Female
Main 0.31 0.49
Marginal 2.33 7.82
Total 1.73 3.18
Note: Per cent per annum.Source: GOI 1991, 2001.
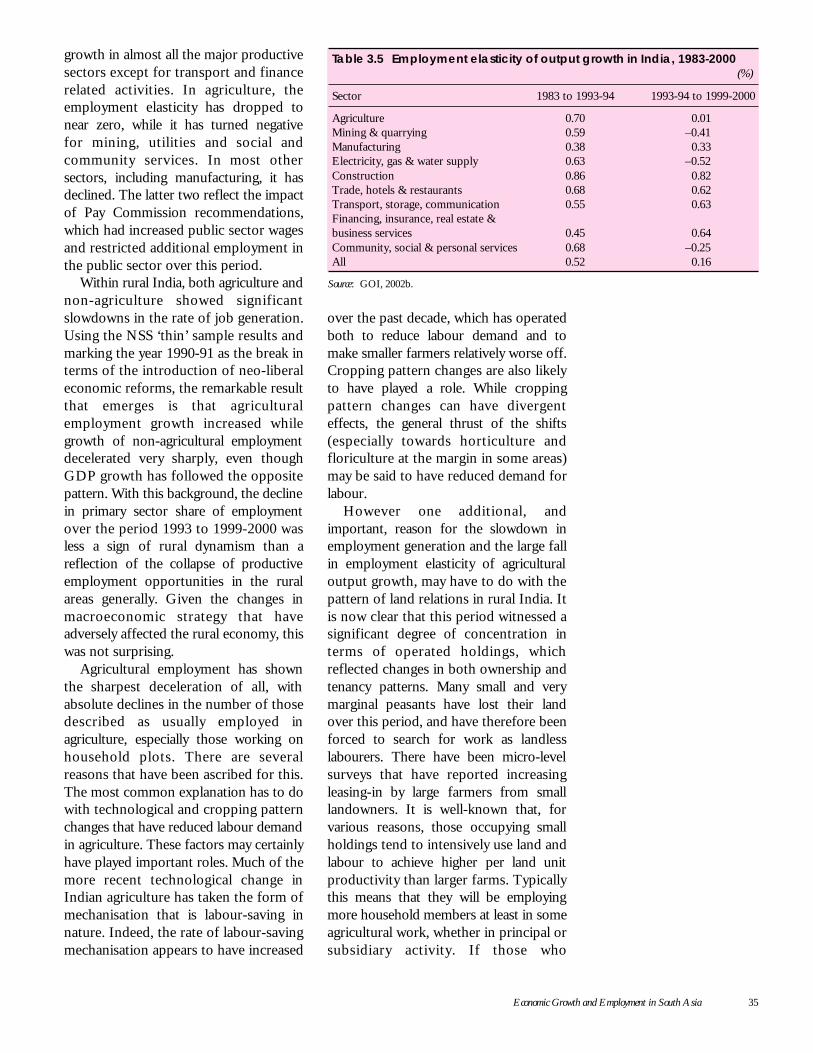
Economic Growth and Employment in South Asia 35
growth in almost all the major productivesectors except for transport and financerelated activities. In agriculture, theemployment elasticity has dropped tonear zero, while it has turned negativefor mining, utilities and social andcommunity services. In most othersectors, including manufacturing, it hasdeclined. The latter two reflect the impactof Pay Commission recommendations,which had increased public sector wagesand restricted additional employment inthe public sector over this period.
Within rural India, both agriculture andnon-agriculture showed significantslowdowns in the rate of job generation.Using the NSS ‘thin’ sample results andmarking the year 1990-91 as the break interms of the introduction of neo-liberaleconomic reforms, the remarkable resultthat emerges is that agriculturalemployment growth increased whilegrowth of non-agricultural employmentdecelerated very sharply, even thoughGDP growth has followed the oppositepattern. With this background, the declinein primary sector share of employmentover the period 1993 to 1999-2000 wasless a sign of rural dynamism than areflection of the collapse of productiveemployment opportunities in the ruralareas generally. Given the changes inmacroeconomic strategy that haveadversely affected the rural economy, thiswas not surprising.
Agricultural employment has shownthe sharpest deceleration of all, withabsolute declines in the number of thosedescribed as usually employed inagriculture, especially those working onhousehold plots. There are severalreasons that have been ascribed for this.The most common explanation has to dowith technological and cropping patternchanges that have reduced labour demandin agriculture. These factors may certainlyhave played important roles. Much of themore recent technological change inIndian agriculture has taken the form ofmechanisation that is labour-saving innature. Indeed, the rate of labour-savingmechanisation appears to have increased
over the past decade, which has operatedboth to reduce labour demand and tomake smaller farmers relatively worse off.Cropping pattern changes are also likelyto have played a role. While croppingpattern changes can have divergenteffects, the general thrust of the shifts(especially towards horticulture andfloriculture at the margin in some areas)may be said to have reduced demand forlabour.
However one additional, andimportant, reason for the slowdown inemployment generation and the large fallin employment elasticity of agriculturaloutput growth, may have to do with thepattern of land relations in rural India. Itis now clear that this period witnessed asignificant degree of concentration interms of operated holdings, whichreflected changes in both ownership andtenancy patterns. Many small and verymarginal peasants have lost their landover this period, and have therefore beenforced to search for work as landlesslabourers. There have been micro-levelsurveys that have reported increasingleasing-in by large farmers from smalllandowners. It is well-known that, forvarious reasons, those occupying smallholdings tend to intensively use land andlabour to achieve higher per land unitproductivity than larger farms. Typicallythis means that they will be employingmore household members at least in someagricultural work, whether in principal orsubsidiary activity. If those who
Table 3.5 Employment elasticity of output growth in India, 1983-2000(%)
Sector 1983 to 1993-94 1993-94 to 1999-2000
Agriculture 0.70 0.01Mining & quarrying 0.59 –0.41Manufacturing 0.38 0.33Electricity, gas & water supply 0.63 –0.52Construction 0.86 0.82Trade, hotels & restaurants 0.68 0.62Transport, storage, communication 0.55 0.63Financing, insurance, real estate &business services 0.45 0.64Community, social & personal services 0.68 –0.25All 0.52 0.16
Source: GOI, 2002b.
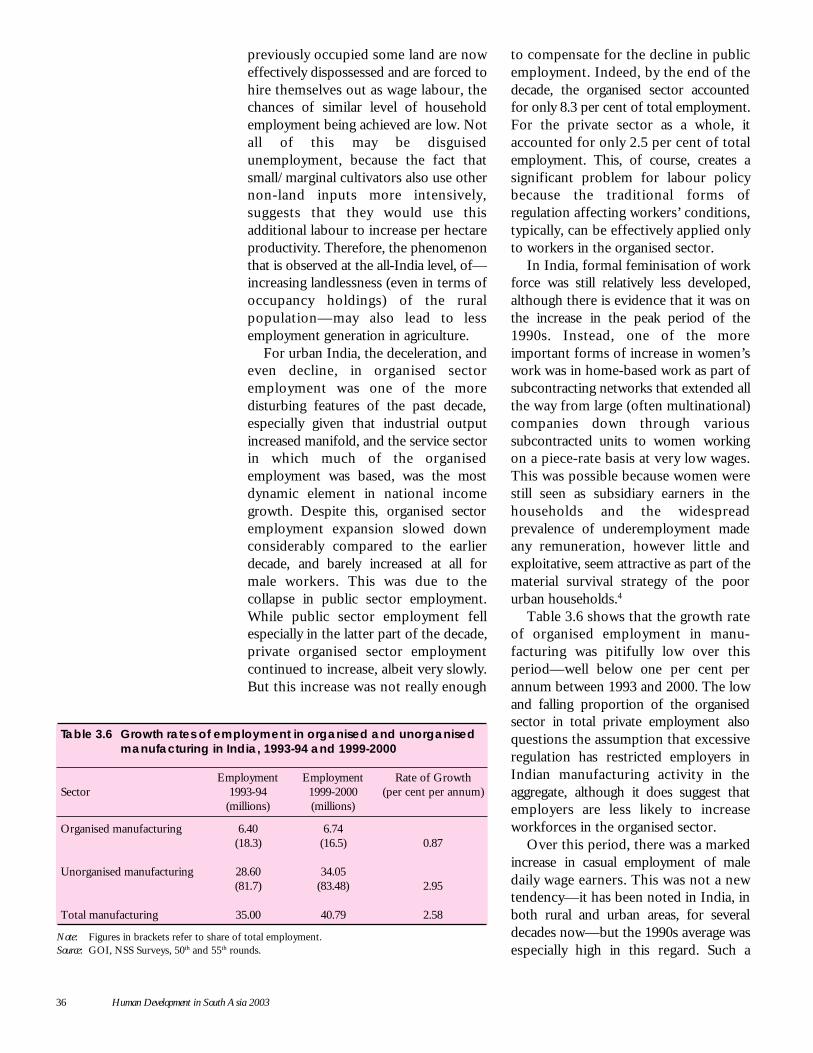
36 Human Development in South Asia 2003
previously occupied some land are noweffectively dispossessed and are forced tohire themselves out as wage labour, thechances of similar level of householdemployment being achieved are low. Notall of this may be disguisedunemployment, because the fact thatsmall/marginal cultivators also use othernon-land inputs more intensively,suggests that they would use thisadditional labour to increase per hectareproductivity. Therefore, the phenomenonthat is observed at the all-India level, of—increasing landlessness (even in terms ofoccupancy holdings) of the ruralpopulation—may also lead to lessemployment generation in agriculture.
For urban India, the deceleration, andeven decline, in organised sectoremployment was one of the moredisturbing features of the past decade,especially given that industrial outputincreased manifold, and the service sectorin which much of the organisedemployment was based, was the mostdynamic element in national incomegrowth. Despite this, organised sectoremployment expansion slowed downconsiderably compared to the earlierdecade, and barely increased at all formale workers. This was due to thecollapse in public sector employment.While public sector employment fellespecially in the latter part of the decade,private organised sector employmentcontinued to increase, albeit very slowly.But this increase was not really enough
to compensate for the decline in publicemployment. Indeed, by the end of thedecade, the organised sector accountedfor only 8.3 per cent of total employment.For the private sector as a whole, itaccounted for only 2.5 per cent of totalemployment. This, of course, creates asignificant problem for labour policybecause the traditional forms ofregulation affecting workers’ conditions,typically, can be effectively applied onlyto workers in the organised sector.
In India, formal feminisation of workforce was still relatively less developed,although there is evidence that it was onthe increase in the peak period of the1990s. Instead, one of the moreimportant forms of increase in women’swork was in home-based work as part ofsubcontracting networks that extended allthe way from large (often multinational)companies down through varioussubcontracted units to women workingon a piece-rate basis at very low wages.This was possible because women werestill seen as subsidiary earners in thehouseholds and the widespreadprevalence of underemployment madeany remuneration, however little andexploitative, seem attractive as part of thematerial survival strategy of the poorurban households.4
Table 3.6 shows that the growth rateof organised employment in manu-facturing was pitifully low over thisperiod—well below one per cent perannum between 1993 and 2000. The lowand falling proportion of the organisedsector in total private employment alsoquestions the assumption that excessiveregulation has restricted employers inIndian manufacturing activity in theaggregate, although it does suggest thatemployers are less likely to increaseworkforces in the organised sector.
Over this period, there was a markedincrease in casual employment of maledaily wage earners. This was not a newtendency—it has been noted in India, inboth rural and urban areas, for severaldecades now—but the 1990s average wasespecially high in this regard. Such a
Table 3.6 Growth rates of employment in organised and unorganisedmanufacturing in India, 1993-94 and 1999-2000
Employment Employment Rate of GrowthSector 1993-94 1999-2000 (per cent per annum)
(millions) (millions)
Organised manufacturing 6.40 6.74(18.3) (16.5) 0.87
Unorganised manufacturing 28.60 34.05(81.7) (83.48) 2.95
Total manufacturing 35.00 40.79 2.58
Note: Figures in brackets refer to share of total employment.Source: GOI, NSS Surveys, 50th and 55th rounds.
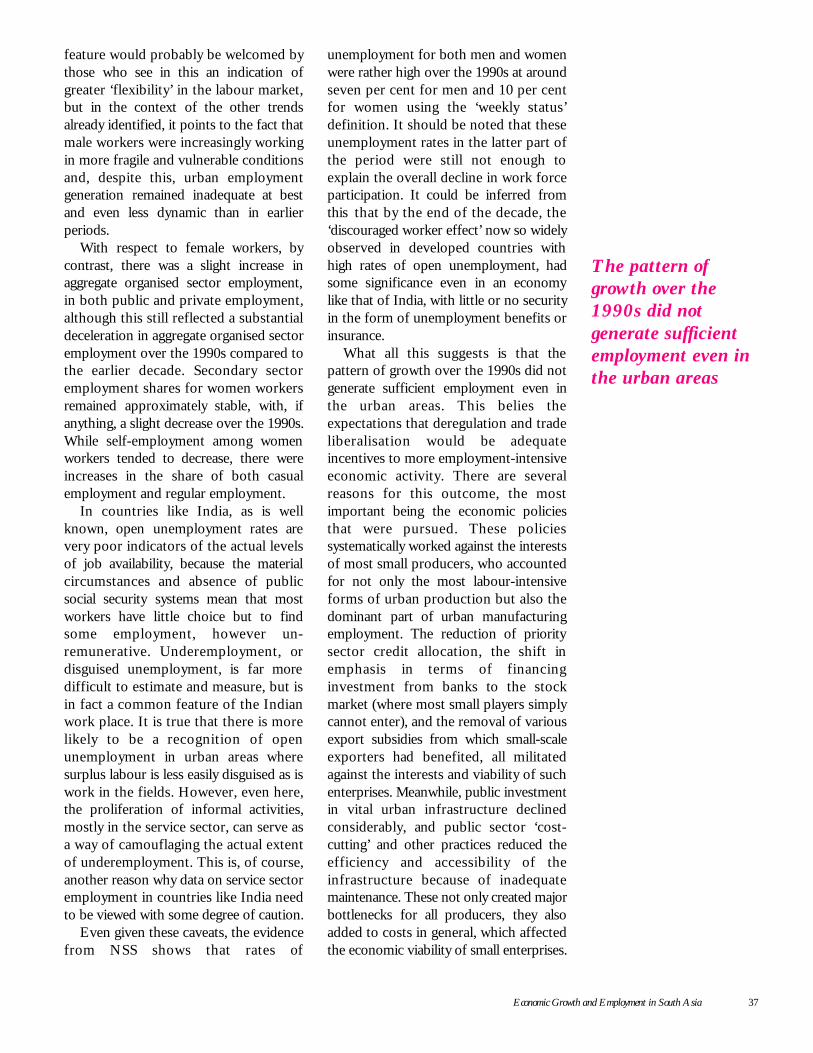
Economic Growth and Employment in South Asia 37
feature would probably be welcomed bythose who see in this an indication ofgreater ‘flexibility’ in the labour market,but in the context of the other trendsalready identified, it points to the fact thatmale workers were increasingly workingin more fragile and vulnerable conditionsand, despite this, urban employmentgeneration remained inadequate at bestand even less dynamic than in earlierperiods.
With respect to female workers, bycontrast, there was a slight increase inaggregate organised sector employment,in both public and private employment,although this still reflected a substantialdeceleration in aggregate organised sectoremployment over the 1990s compared tothe earlier decade. Secondary sectoremployment shares for women workersremained approximately stable, with, ifanything, a slight decrease over the 1990s.While self-employment among womenworkers tended to decrease, there wereincreases in the share of both casualemployment and regular employment.
In countries like India, as is wellknown, open unemployment rates arevery poor indicators of the actual levelsof job availability, because the materialcircumstances and absence of publicsocial security systems mean that mostworkers have little choice but to findsome employment, however un-remunerative. Underemployment, ordisguised unemployment, is far moredifficult to estimate and measure, but isin fact a common feature of the Indianwork place. It is true that there is morelikely to be a recognition of openunemployment in urban areas wheresurplus labour is less easily disguised as iswork in the fields. However, even here,the proliferation of informal activities,mostly in the service sector, can serve asa way of camouflaging the actual extentof underemployment. This is, of course,another reason why data on service sectoremployment in countries like India needto be viewed with some degree of caution.
Even given these caveats, the evidencefrom NSS shows that rates of
unemployment for both men and womenwere rather high over the 1990s at aroundseven per cent for men and 10 per centfor women using the ‘weekly status’definition. It should be noted that theseunemployment rates in the latter part ofthe period were still not enough toexplain the overall decline in work forceparticipation. It could be inferred fromthis that by the end of the decade, the‘discouraged worker effect’ now so widelyobserved in developed countries withhigh rates of open unemployment, hadsome significance even in an economylike that of India, with little or no securityin the form of unemployment benefits orinsurance.
What all this suggests is that thepattern of growth over the 1990s did notgenerate sufficient employment even inthe urban areas. This belies theexpectations that deregulation and tradeliberalisation would be adequateincentives to more employment-intensiveeconomic activity. There are severalreasons for this outcome, the mostimportant being the economic policiesthat were pursued. These policiessystematically worked against the interestsof most small producers, who accountedfor not only the most labour-intensiveforms of urban production but also thedominant part of urban manufacturingemployment. The reduction of prioritysector credit allocation, the shift inemphasis in terms of financinginvestment from banks to the stockmarket (where most small players simplycannot enter), and the removal of variousexport subsidies from which small-scaleexporters had benefited, all militatedagainst the interests and viability of suchenterprises. Meanwhile, public investmentin vital urban infrastructure declinedconsiderably, and public sector ‘cost-cutting’ and other practices reduced theefficiency and accessibility of theinfrastructure because of inadequatemaintenance. These not only created majorbottlenecks for all producers, they alsoadded to costs in general, which affectedthe economic viability of small enterprises.
The pattern ofgrowth over the1990s did notgenerate sufficientemployment even inthe urban areas
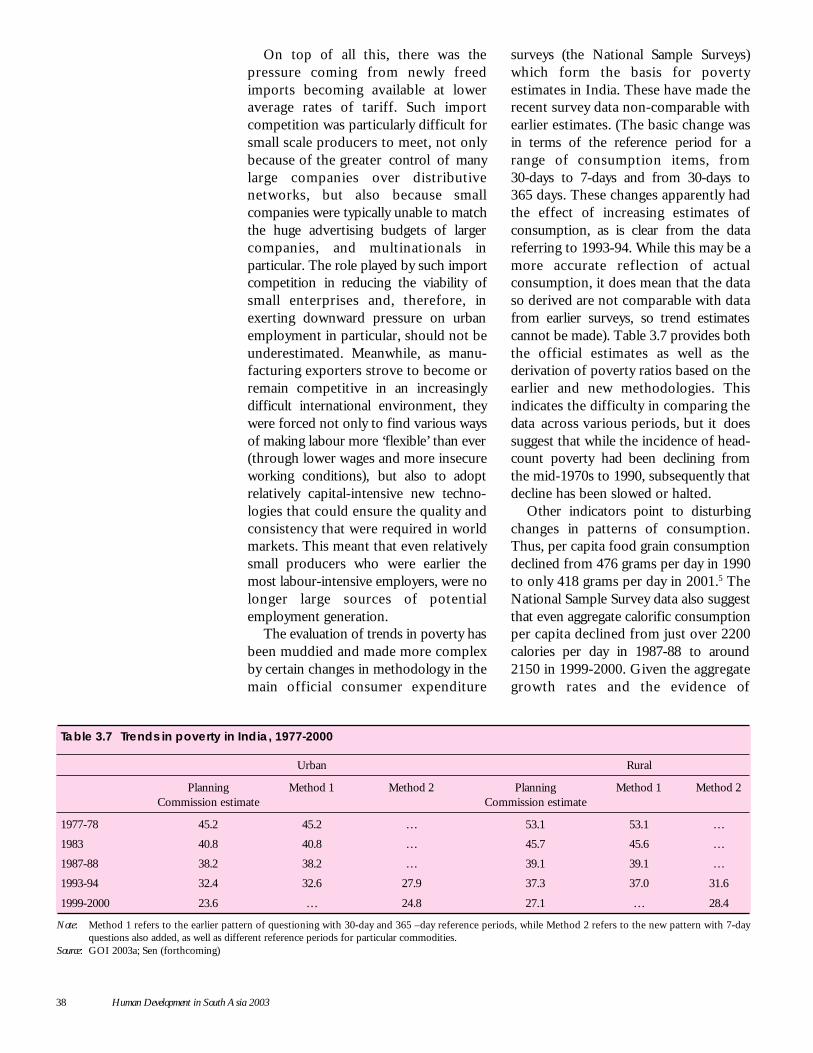
38 Human Development in South Asia 2003
On top of all this, there was thepressure coming from newly freedimports becoming available at loweraverage rates of tariff. Such importcompetition was particularly difficult forsmall scale producers to meet, not onlybecause of the greater control of manylarge companies over distributivenetworks, but also because smallcompanies were typically unable to matchthe huge advertising budgets of largercompanies, and multinationals inparticular. The role played by such importcompetition in reducing the viability ofsmall enterprises and, therefore, inexerting downward pressure on urbanemployment in particular, should not beunderestimated. Meanwhile, as manu-facturing exporters strove to become orremain competitive in an increasinglydifficult international environment, theywere forced not only to find various waysof making labour more ‘flexible’ than ever(through lower wages and more insecureworking conditions), but also to adoptrelatively capital-intensive new techno-logies that could ensure the quality andconsistency that were required in worldmarkets. This meant that even relativelysmall producers who were earlier themost labour-intensive employers, were nolonger large sources of potentialemployment generation.
The evaluation of trends in poverty hasbeen muddied and made more complexby certain changes in methodology in themain official consumer expenditure
surveys (the National Sample Surveys)which form the basis for povertyestimates in India. These have made therecent survey data non-comparable withearlier estimates. (The basic change wasin terms of the reference period for arange of consumption items, from30-days to 7-days and from 30-days to365 days. These changes apparently hadthe effect of increasing estimates ofconsumption, as is clear from the datareferring to 1993-94. While this may be amore accurate reflection of actualconsumption, it does mean that the dataso derived are not comparable with datafrom earlier surveys, so trend estimatescannot be made). Table 3.7 provides boththe official estimates as well as thederivation of poverty ratios based on theearlier and new methodologies. Thisindicates the difficulty in comparing thedata across various periods, but it doessuggest that while the incidence of head-count poverty had been declining fromthe mid-1970s to 1990, subsequently thatdecline has been slowed or halted.
Other indicators point to disturbingchanges in patterns of consumption.Thus, per capita food grain consumptiondeclined from 476 grams per day in 1990to only 418 grams per day in 2001.5 TheNational Sample Survey data also suggestthat even aggregate calorific consumptionper capita declined from just over 2200calories per day in 1987-88 to around2150 in 1999-2000. Given the aggregategrowth rates and the evidence of
Table 3.7 Trends in poverty in India, 1977-2000
Urban Rural
Planning Method 1 Method 2 Planning Method 1 Method 2Commission estimate Commission estimate
1977-78 45.2 45.2 … 53.1 53.1 …
1983 40.8 40.8 … 45.7 45.6 …
1987-88 38.2 38.2 … 39.1 39.1 …
1993-94 32.4 32.6 27.9 37.3 37.0 31.6
1999-2000 23.6 … 24.8 27.1 … 28.4
Note: Method 1 refers to the earlier pattern of questioning with 30-day and 365 –day reference periods, while Method 2 refers to the new pattern with 7-dayquestions also added, as well as different reference periods for particular commodities.
Source: GOI 2003a; Sen (forthcoming)
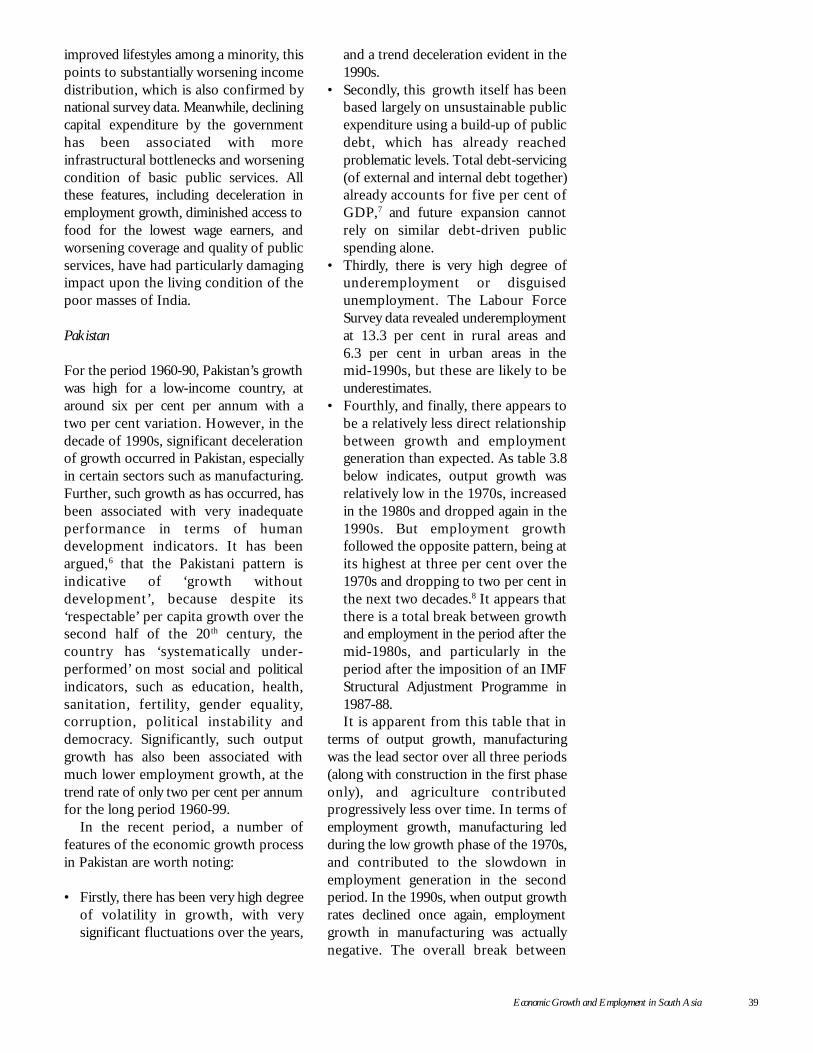
Economic Growth and Employment in South Asia 39
improved lifestyles among a minority, thispoints to substantially worsening incomedistribution, which is also confirmed bynational survey data. Meanwhile, decliningcapital expenditure by the governmenthas been associated with moreinfrastructural bottlenecks and worseningcondition of basic public services. Allthese features, including deceleration inemployment growth, diminished access tofood for the lowest wage earners, andworsening coverage and quality of publicservices, have had particularly damagingimpact upon the living condition of thepoor masses of India.
Pakistan
For the period 1960-90, Pakistan’s growthwas high for a low-income country, ataround six per cent per annum with atwo per cent variation. However, in thedecade of 1990s, significant decelerationof growth occurred in Pakistan, especiallyin certain sectors such as manufacturing.Further, such growth as has occurred, hasbeen associated with very inadequateperformance in terms of humandevelopment indicators. It has beenargued,6 that the Pakistani pattern isindicative of ‘growth withoutdevelopment’, because despite its‘respectable’ per capita growth over thesecond half of the 20 th century, thecountry has ‘systematically under-performed’ on most social and politicalindicators, such as education, health,sanitation, fertility, gender equality,corruption, political instability anddemocracy. Significantly, such outputgrowth has also been associated withmuch lower employment growth, at thetrend rate of only two per cent per annumfor the long period 1960-99.
In the recent period, a number offeatures of the economic growth processin Pakistan are worth noting:
• Firstly, there has been very high degreeof volatility in growth, with verysignificant fluctuations over the years,
and a trend deceleration evident in the1990s.
• Secondly, this growth itself has beenbased largely on unsustainable publicexpenditure using a build-up of publicdebt, which has already reachedproblematic levels. Total debt-servicing(of external and internal debt together)already accounts for five per cent ofGDP,7 and future expansion cannotrely on similar debt-driven publicspending alone.
• Thirdly, there is very high degree ofunderemployment or disguisedunemployment. The Labour ForceSurvey data revealed underemploymentat 13.3 per cent in rural areas and6.3 per cent in urban areas in themid-1990s, but these are likely to beunderestimates.
• Fourthly, and finally, there appears tobe a relatively less direct relationshipbetween growth and employmentgeneration than expected. As table 3.8below indicates, output growth wasrelatively low in the 1970s, increasedin the 1980s and dropped again in the1990s. But employment growthfollowed the opposite pattern, being atits highest at three per cent over the1970s and dropping to two per cent inthe next two decades.8 It appears thatthere is a total break between growthand employment in the period after themid-1980s, and particularly in theperiod after the imposition of an IMFStructural Adjustment Programme in1987-88.It is apparent from this table that in
terms of output growth, manufacturingwas the lead sector over all three periods(along with construction in the first phaseonly), and agriculture contributedprogressively less over time. In terms ofemployment growth, manufacturing ledduring the low growth phase of the 1970s,and contributed to the slowdown inemployment generation in the secondperiod. In the 1990s, when output growthrates declined once again, employmentgrowth in manufacturing was actuallynegative. The overall break between
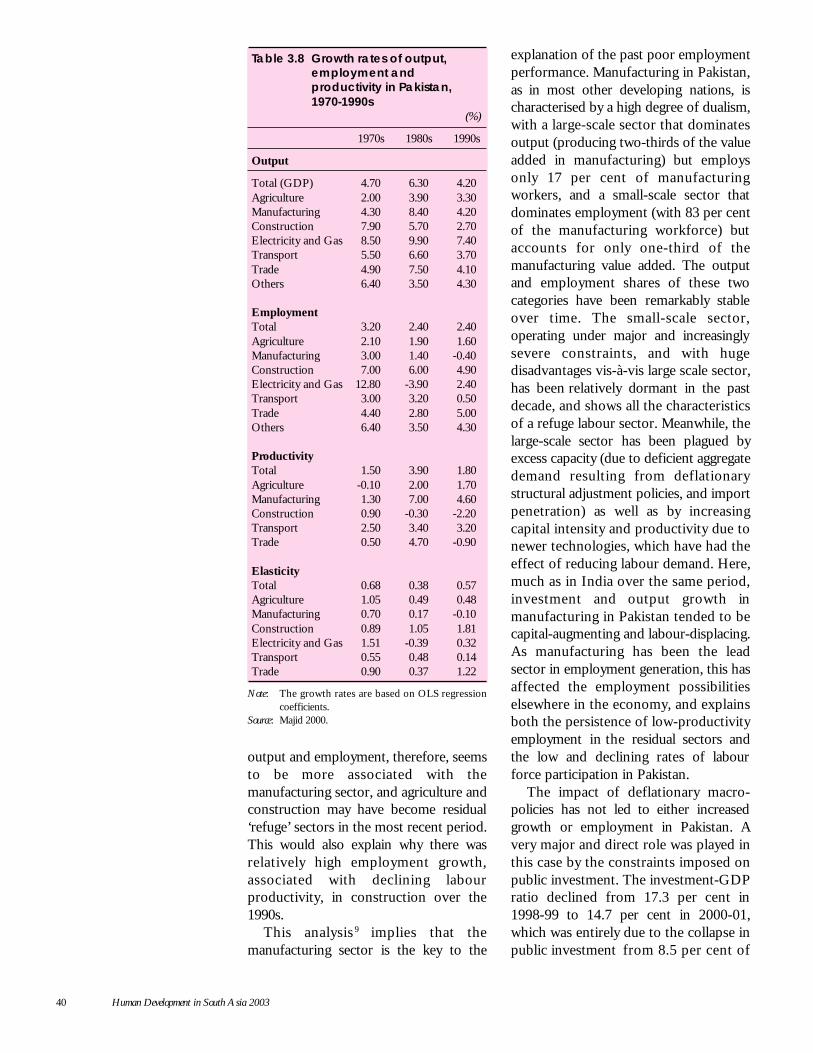
40 Human Development in South Asia 2003
output and employment, therefore, seemsto be more associated with themanufacturing sector, and agriculture andconstruction may have become residual‘refuge’ sectors in the most recent period.This would also explain why there wasrelatively high employment growth,associated with declining labourproductivity, in construction over the1990s.
This analysis 9 implies that themanufacturing sector is the key to the
explanation of the past poor employmentperformance. Manufacturing in Pakistan,as in most other developing nations, ischaracterised by a high degree of dualism,with a large-scale sector that dominatesoutput (producing two-thirds of the valueadded in manufacturing) but employsonly 17 per cent of manufacturingworkers, and a small-scale sector thatdominates employment (with 83 per centof the manufacturing workforce) butaccounts for only one-third of themanufacturing value added. The outputand employment shares of these twocategories have been remarkably stableover time. The small-scale sector,operating under major and increasinglysevere constraints, and with hugedisadvantages vis-à-vis large scale sector,has been relatively dormant in the pastdecade, and shows all the characteristicsof a refuge labour sector. Meanwhile, thelarge-scale sector has been plagued byexcess capacity (due to deficient aggregatedemand resulting from deflationarystructural adjustment policies, and importpenetration) as well as by increasingcapital intensity and productivity due tonewer technologies, which have had theeffect of reducing labour demand. Here,much as in India over the same period,investment and output growth inmanufacturing in Pakistan tended to becapital-augmenting and labour-displacing.As manufacturing has been the leadsector in employment generation, this hasaffected the employment possibilitieselsewhere in the economy, and explainsboth the persistence of low-productivityemployment in the residual sectors andthe low and declining rates of labourforce participation in Pakistan.
The impact of deflationary macro-policies has not led to either increasedgrowth or employment in Pakistan. Avery major and direct role was played inthis case by the constraints imposed onpublic investment. The investment-GDPratio declined from 17.3 per cent in1998-99 to 14.7 per cent in 2000-01,which was entirely due to the collapse inpublic investment from 8.5 per cent of
Table 3.8 Growth rates of output,employment andproductivity in Pakistan,1970-1990s
(%)
1970s 1980s 1990s
Output
Total (GDP) 4.70 6.30 4.20Agriculture 2.00 3.90 3.30Manufacturing 4.30 8.40 4.20Construction 7.90 5.70 2.70Electricity and Gas 8.50 9.90 7.40Transport 5.50 6.60 3.70Trade 4.90 7.50 4.10Others 6.40 3.50 4.30
EmploymentTotal 3.20 2.40 2.40Agriculture 2.10 1.90 1.60Manufacturing 3.00 1.40 -0.40Construction 7.00 6.00 4.90Electricity and Gas 12.80 -3.90 2.40Transport 3.00 3.20 0.50Trade 4.40 2.80 5.00Others 6.40 3.50 4.30
ProductivityTotal 1.50 3.90 1.80Agriculture -0.10 2.00 1.70Manufacturing 1.30 7.00 4.60Construction 0.90 -0.30 -2.20Transport 2.50 3.40 3.20Trade 0.50 4.70 -0.90
ElasticityTotal 0.68 0.38 0.57Agriculture 1.05 0.49 0.48Manufacturing 0.70 0.17 -0.10Construction 0.89 1.05 1.81Electricity and Gas 1.51 -0.39 0.32Transport 0.55 0.48 0.14Trade 0.90 0.37 1.22
Note: The growth rates are based on OLS regressioncoefficients.
Source: Majid 2000.
Economic Growth and Employment in South Asia 41
GDP to 5.6 per cent over the sameperiod. Private investment, which isstrongly interlinked with publicinvestment and expenditure, faced adeficiency of demand as a result, and didnot rise to meet the emerging slack. Inaddition, various other elements of thestructural adjustment programmeoperated to reduce average growth rates,accelerate inflation, and thereby increaseunemployment and poverty. The standardpackage of structural reforms includedprivatisation of public assets, ceilings onwages and employment in the publicsector, cuts in subsidies, cuts indevelopment expenditure including ‘socialsectors’, increases in user charges forpublic utilities and services, and frequentdevaluation. This last feature also had theunintended consequence of reducing theinflow of remittances from foreignworkers, which to date has been animportant and consistent source ofsustenance of Pakistan’s balance ofpayments.10 Thus, ironically, the macro-economic strategy based on StructuralAdjustment Programmes, imposed andapproved by the IMF and World Bank,supposedly to change the structure of theeconomy so as to improve the balance ofpayments, control inflation and revivegrowth, had the opposite effects inpractice.
Inadequate employment generationand persistence of low productivityemployment in most sectors, inevitablyfeeds into the persistence and evenincrease in levels of poverty. In Pakistan,there is general agreement that theincidence of poverty has increased over
the 1990s, as the combination ofdeflationary macro-economic measuresand de-industrialisation following upontrade liberalisation has made itself felt.Table 3.9 describes the broad trends inpoverty measured by the head count ratio.
It is noteworthy that the incidence ofpoverty started rising after the structuraladjustment programme began in 1987-88.There are various reasons for this mostof which relate to the direct and indirecteffects of the macro-economic strategyitself. This intertwining of lowemployment generation and increasingpoverty has been an important outcomeof the experience of the past decade anda half in Pakistan.
Bangladesh
Much like the other countries in theregion, Bangladesh also adopted thestandard range of economic reformsbeginning in the 1980s and much morecomprehensively in the 1990s. Theseincluded the usual combination ofexpenditure-reducing and expenditure-switching policies, along with institutionaland legislative changes aimed at ensuringgreater freedom of market functioning.The results of this strategy appear to havebeen mixed. There was clearly greatermacroeconomic stability in terms ofreduced rates of inflation (from anaverage of 9.9 per cent per annum in theearly 1980s to an average of 5.6 per centper annum by the end of the 1990s).However, the rate of growth of GDP inconstant prices appears to have beenremarkably stable, at around four percent, suggesting that the reforms packagehad very little effect on the trend rate ofgrowth. Also, trends in the fiscal deficit(as share of GDP) appear to have beensubstantially post reform, in the 1990s,compared to the 1980s. This also reflectsthe decline in tax revenues consequentupon fiscal reforms and tradeliberalisation.11 While the ‘fundamentals’of the economy have improved, thesehave failed to increase rates of investmentand growth. However, growth rates per
Table 3.9 Trends in Poverty in Pakistan,1969-99
(%)
Year Rural Urban All Pakistan
1969-70 49.1 38.8 46.51979 32.5 25.9 30.71987-88 18.3 14.9 17.31990-91 23.6 18.6 22.11998-99 34.8 25.9 32.6
Source: Amjad and Kemal (1997) and Qureshi and Arif(1999), as quoted in Anwar 2001.
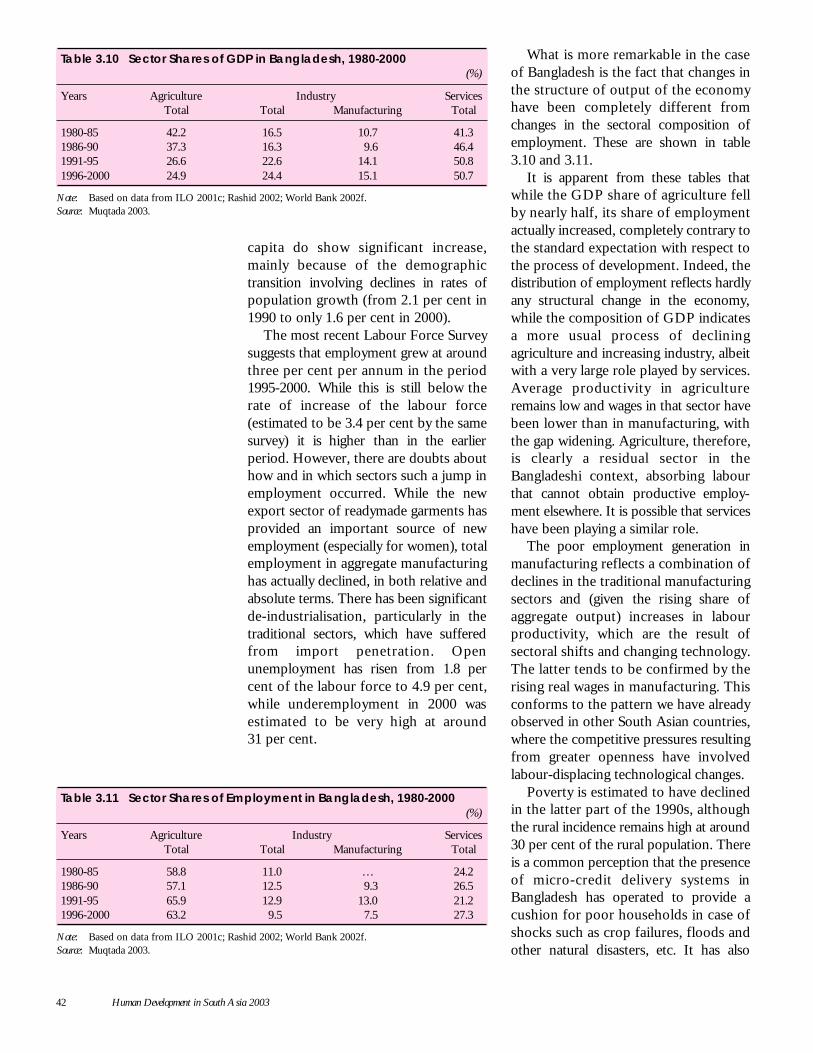
42 Human Development in South Asia 2003
capita do show significant increase,mainly because of the demographictransition involving declines in rates ofpopulation growth (from 2.1 per cent in1990 to only 1.6 per cent in 2000).
The most recent Labour Force Surveysuggests that employment grew at aroundthree per cent per annum in the period1995-2000. While this is still below therate of increase of the labour force(estimated to be 3.4 per cent by the samesurvey) it is higher than in the earlierperiod. However, there are doubts abouthow and in which sectors such a jump inemployment occurred. While the newexport sector of readymade garments hasprovided an important source of newemployment (especially for women), totalemployment in aggregate manufacturinghas actually declined, in both relative andabsolute terms. There has been significantde-industrialisation, particularly in thetraditional sectors, which have sufferedfrom import penetration. Openunemployment has risen from 1.8 percent of the labour force to 4.9 per cent,while underemployment in 2000 wasestimated to be very high at around31 per cent.
What is more remarkable in the caseof Bangladesh is the fact that changes inthe structure of output of the economyhave been completely different fromchanges in the sectoral composition ofemployment. These are shown in table3.10 and 3.11.
It is apparent from these tables thatwhile the GDP share of agriculture fellby nearly half, its share of employmentactually increased, completely contrary tothe standard expectation with respect tothe process of development. Indeed, thedistribution of employment reflects hardlyany structural change in the economy,while the composition of GDP indicatesa more usual process of decliningagriculture and increasing industry, albeitwith a very large role played by services.Average productivity in agricultureremains low and wages in that sector havebeen lower than in manufacturing, withthe gap widening. Agriculture, therefore,is clearly a residual sector in theBangladeshi context, absorbing labourthat cannot obtain productive employ-ment elsewhere. It is possible that serviceshave been playing a similar role.
The poor employment generation inmanufacturing reflects a combination ofdeclines in the traditional manufacturingsectors and (given the rising share ofaggregate output) increases in labourproductivity, which are the result ofsectoral shifts and changing technology.The latter tends to be confirmed by therising real wages in manufacturing. Thisconforms to the pattern we have alreadyobserved in other South Asian countries,where the competitive pressures resultingfrom greater openness have involvedlabour-displacing technological changes.
Poverty is estimated to have declinedin the latter part of the 1990s, althoughthe rural incidence remains high at around30 per cent of the rural population. Thereis a common perception that the presenceof micro-credit delivery systems inBangladesh has operated to provide acushion for poor households in case ofshocks such as crop failures, floods andother natural disasters, etc. It has also
Table 3.10 Sector Shares of GDP in Bangladesh, 1980-2000(%)
Years Agriculture Industry ServicesTotal Total Manufacturing Total
1980-85 42.2 16.5 10.7 41.31986-90 37.3 16.3 9.6 46.41991-95 26.6 22.6 14.1 50.81996-2000 24.9 24.4 15.1 50.7
Note: Based on data from ILO 2001c; Rashid 2002; World Bank 2002f.Source: Muqtada 2003.
Table 3.11 Sector Shares of Employment in Bangladesh, 1980-2000(%)
Years Agriculture Industry ServicesTotal Total Manufacturing Total
1980-85 58.8 11.0 … 24.21986-90 57.1 12.5 9.3 26.51991-95 65.9 12.9 13.0 21.21996-2000 63.2 9.5 7.5 27.3
Note: Based on data from ILO 2001c; Rashid 2002; World Bank 2002f.Source: Muqtada 2003.
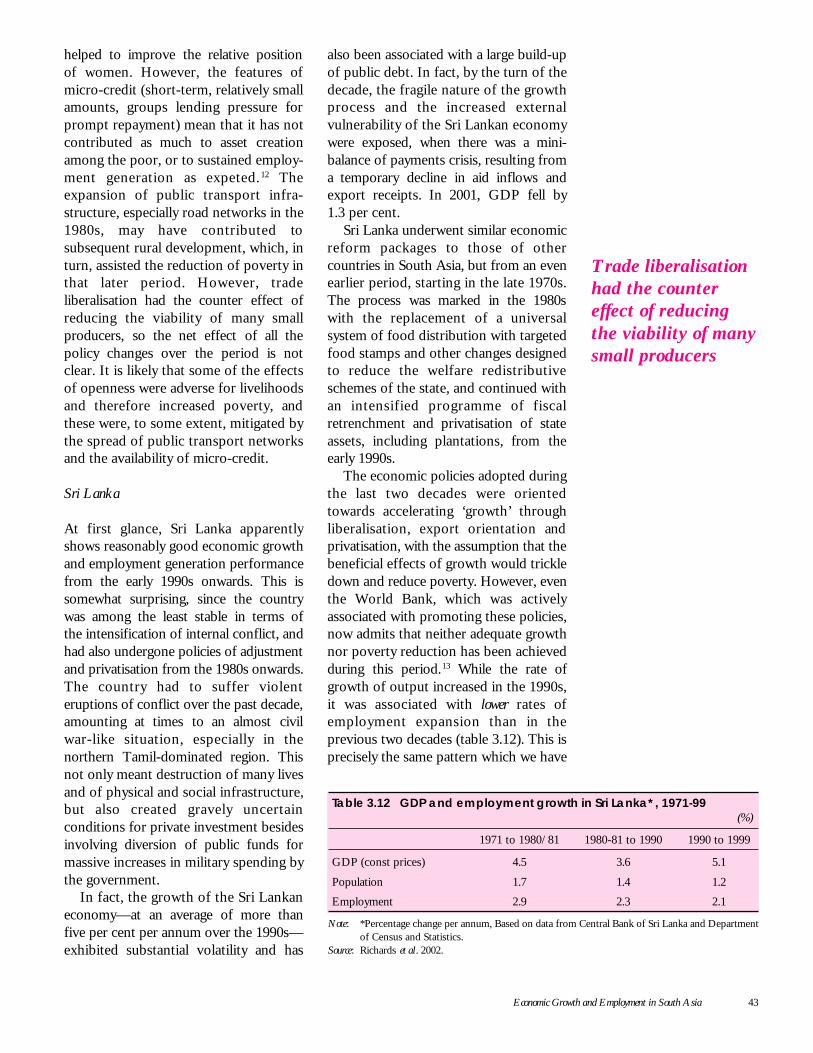
Economic Growth and Employment in South Asia 43
helped to improve the relative positionof women. However, the features ofmicro-credit (short-term, relatively smallamounts, groups lending pressure forprompt repayment) mean that it has notcontributed as much to asset creationamong the poor, or to sustained employ-ment generation as expeted. 12 Theexpansion of public transport infra-structure, especially road networks in the1980s, may have contributed tosubsequent rural development, which, inturn, assisted the reduction of poverty inthat later period. However, tradeliberalisation had the counter effect ofreducing the viability of many smallproducers, so the net effect of all thepolicy changes over the period is notclear. It is likely that some of the effectsof openness were adverse for livelihoodsand therefore increased poverty, andthese were, to some extent, mitigated bythe spread of public transport networksand the availability of micro-credit.
Sri Lanka
At first glance, Sri Lanka apparentlyshows reasonably good economic growthand employment generation performancefrom the early 1990s onwards. This issomewhat surprising, since the countrywas among the least stable in terms ofthe intensification of internal conflict, andhad also undergone policies of adjustmentand privatisation from the 1980s onwards.The country had to suffer violenteruptions of conflict over the past decade,amounting at times to an almost civilwar-like situation, especially in thenorthern Tamil-dominated region. Thisnot only meant destruction of many livesand of physical and social infrastructure,but also created gravely uncertainconditions for private investment besidesinvolving diversion of public funds formassive increases in military spending bythe government.
In fact, the growth of the Sri Lankaneconomy—at an average of more thanfive per cent per annum over the 1990s—exhibited substantial volatility and has
also been associated with a large build-upof public debt. In fact, by the turn of thedecade, the fragile nature of the growthprocess and the increased externalvulnerability of the Sri Lankan economywere exposed, when there was a mini-balance of payments crisis, resulting froma temporary decline in aid inflows andexport receipts. In 2001, GDP fell by1.3 per cent.
Sri Lanka underwent similar economicreform packages to those of othercountries in South Asia, but from an evenearlier period, starting in the late 1970s.The process was marked in the 1980swith the replacement of a universalsystem of food distribution with targetedfood stamps and other changes designedto reduce the welfare redistributiveschemes of the state, and continued withan intensified programme of fiscalretrenchment and privatisation of stateassets, including plantations, from theearly 1990s.
The economic policies adopted duringthe last two decades were orientedtowards accelerating ‘growth’ throughliberalisation, export orientation andprivatisation, with the assumption that thebeneficial effects of growth would trickledown and reduce poverty. However, eventhe World Bank, which was activelyassociated with promoting these policies,now admits that neither adequate growthnor poverty reduction has been achievedduring this period.13 While the rate ofgrowth of output increased in the 1990s,it was associated with lower rates ofemployment expansion than in theprevious two decades (table 3.12). This isprecisely the same pattern which we have
Table 3.12 GDP and employment growth in Sri Lanka*, 1971-99(%)
1971 to 1980/81 1980-81 to 1990 1990 to 1999
GDP (const prices) 4.5 3.6 5.1
Population 1.7 1.4 1.2
Employment 2.9 2.3 2.1
Note: *Percentage change per annum, Based on data from Central Bank of Sri Lanka and Departmentof Census and Statistics.
Source: Richards et al . 2002.
Trade liberalisationhad the countereffect of reducingthe viability of manysmall producers
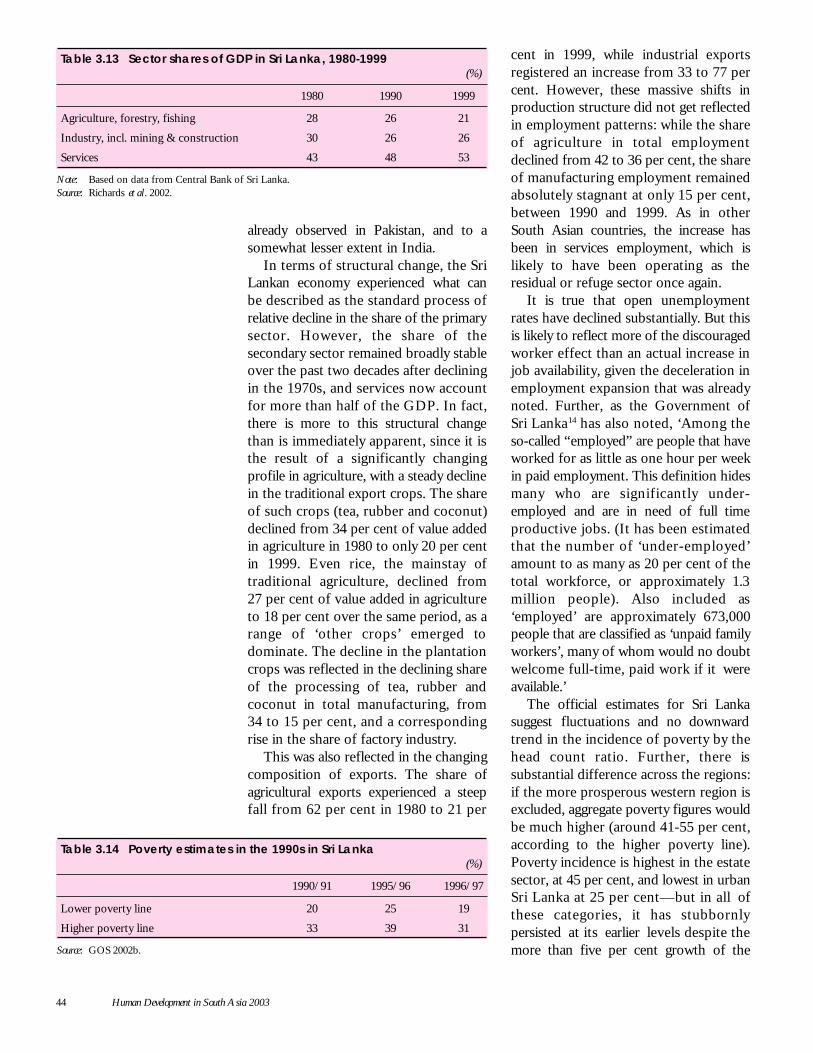
44 Human Development in South Asia 2003
already observed in Pakistan, and to asomewhat lesser extent in India.
In terms of structural change, the SriLankan economy experienced what canbe described as the standard process ofrelative decline in the share of the primarysector. However, the share of thesecondary sector remained broadly stableover the past two decades after decliningin the 1970s, and services now accountfor more than half of the GDP. In fact,there is more to this structural changethan is immediately apparent, since it isthe result of a significantly changingprofile in agriculture, with a steady declinein the traditional export crops. The shareof such crops (tea, rubber and coconut)declined from 34 per cent of value addedin agriculture in 1980 to only 20 per centin 1999. Even rice, the mainstay oftraditional agriculture, declined from27 per cent of value added in agricultureto 18 per cent over the same period, as arange of ‘other crops’ emerged todominate. The decline in the plantationcrops was reflected in the declining shareof the processing of tea, rubber andcoconut in total manufacturing, from34 to 15 per cent, and a correspondingrise in the share of factory industry.
This was also reflected in the changingcomposition of exports. The share ofagricultural exports experienced a steepfall from 62 per cent in 1980 to 21 per
cent in 1999, while industrial exportsregistered an increase from 33 to 77 percent. However, these massive shifts inproduction structure did not get reflectedin employment patterns: while the shareof agriculture in total employmentdeclined from 42 to 36 per cent, the shareof manufacturing employment remainedabsolutely stagnant at only 15 per cent,between 1990 and 1999. As in otherSouth Asian countries, the increase hasbeen in services employment, which islikely to have been operating as theresidual or refuge sector once again.
It is true that open unemploymentrates have declined substantially. But thisis likely to reflect more of the discouragedworker effect than an actual increase injob availability, given the deceleration inemployment expansion that was alreadynoted. Further, as the Government ofSri Lanka14 has also noted, ‘Among theso-called “employed” are people that haveworked for as little as one hour per weekin paid employment. This definition hidesmany who are significantly under-employed and are in need of full timeproductive jobs. (It has been estimatedthat the number of ‘under-employed’amount to as many as 20 per cent of thetotal workforce, or approximately 1.3million people). Also included as‘employed’ are approximately 673,000people that are classified as ‘unpaid familyworkers’, many of whom would no doubtwelcome full-time, paid work if it wereavailable.’
The official estimates for Sri Lankasuggest fluctuations and no downwardtrend in the incidence of poverty by thehead count ratio. Further, there issubstantial difference across the regions:if the more prosperous western region isexcluded, aggregate poverty figures wouldbe much higher (around 41-55 per cent,according to the higher poverty line).Poverty incidence is highest in the estatesector, at 45 per cent, and lowest in urbanSri Lanka at 25 per cent—but in all ofthese categories, it has stubbornlypersisted at its earlier levels despite themore than five per cent growth of the
Table 3.13 Sector shares of GDP in Sri Lanka, 1980-1999(%)
1980 1990 1999
Agriculture, forestry, fishing 28 26 21
Industry, incl. mining & construction 30 26 26
Services 43 48 53
Note: Based on data from Central Bank of Sri Lanka.Source: Richards et al . 2002.
Table 3.14 Poverty estimates in the 1990s in Sri Lanka(%)
1990/91 1995/96 1996/97
Lower poverty line 20 25 19
Higher poverty line 33 39 31
Source: GOS 2002b.
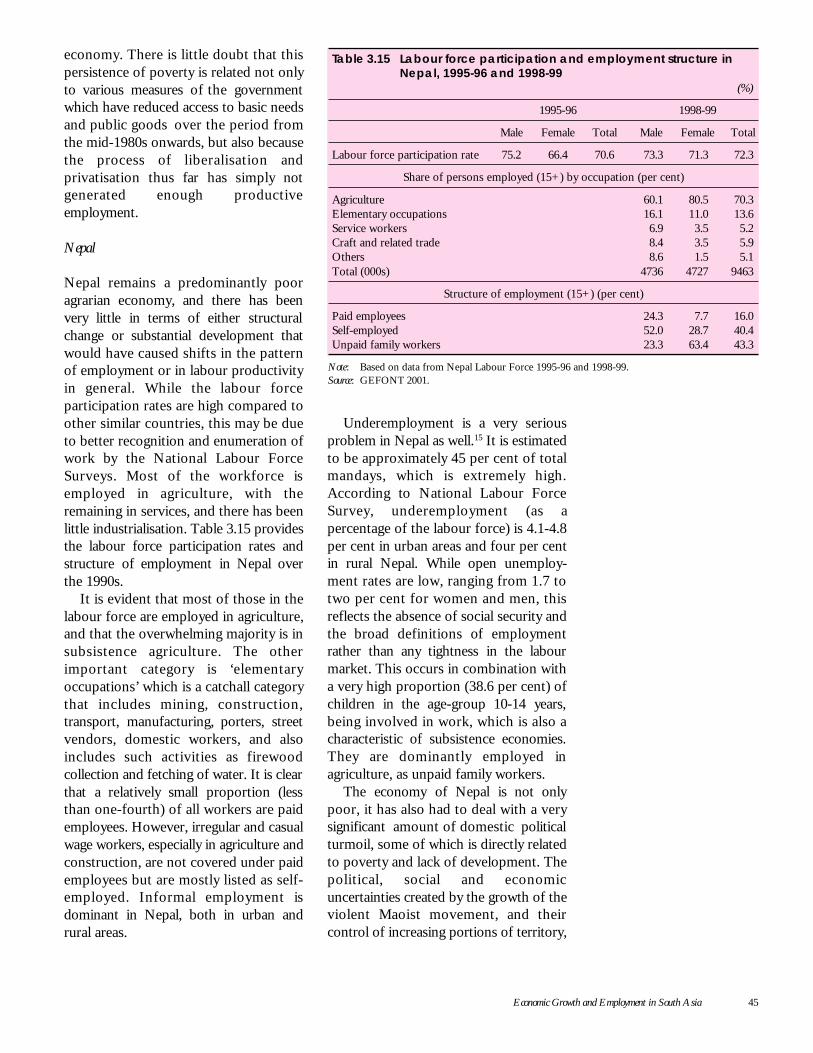
Economic Growth and Employment in South Asia 45
economy. There is little doubt that thispersistence of poverty is related not onlyto various measures of the governmentwhich have reduced access to basic needsand public goods over the period fromthe mid-1980s onwards, but also becausethe process of liberalisation andprivatisation thus far has simply notgenerated enough productiveemployment.
Nepal
Nepal remains a predominantly pooragrarian economy, and there has beenvery little in terms of either structuralchange or substantial development thatwould have caused shifts in the patternof employment or in labour productivityin general. While the labour forceparticipation rates are high compared toother similar countries, this may be dueto better recognition and enumeration ofwork by the National Labour ForceSurveys. Most of the workforce isemployed in agriculture, with theremaining in services, and there has beenlittle industrialisation. Table 3.15 providesthe labour force participation rates andstructure of employment in Nepal overthe 1990s.
It is evident that most of those in thelabour force are employed in agriculture,and that the overwhelming majority is insubsistence agriculture. The otherimportant category is ‘elementaryoccupations’ which is a catchall categorythat includes mining, construction,transport, manufacturing, porters, streetvendors, domestic workers, and alsoincludes such activities as firewoodcollection and fetching of water. It is clearthat a relatively small proportion (lessthan one-fourth) of all workers are paidemployees. However, irregular and casualwage workers, especially in agriculture andconstruction, are not covered under paidemployees but are mostly listed as self-employed. Informal employment isdominant in Nepal, both in urban andrural areas.
Underemployment is a very seriousproblem in Nepal as well.15 It is estimatedto be approximately 45 per cent of totalmandays, which is extremely high.According to National Labour ForceSurvey, underemployment (as apercentage of the labour force) is 4.1-4.8per cent in urban areas and four per centin rural Nepal. While open unemploy-ment rates are low, ranging from 1.7 totwo per cent for women and men, thisreflects the absence of social security andthe broad definitions of employmentrather than any tightness in the labourmarket. This occurs in combination witha very high proportion (38.6 per cent) ofchildren in the age-group 10-14 years,being involved in work, which is also acharacteristic of subsistence economies.They are dominantly employed inagriculture, as unpaid family workers.
The economy of Nepal is not onlypoor, it has also had to deal with a verysignificant amount of domestic politicalturmoil, some of which is directly relatedto poverty and lack of development. Thepolitical, social and economicuncertainties created by the growth of theviolent Maoist movement, and theircontrol of increasing portions of territory,
Table 3.15 Labour force participation and employment structure inNepal, 1995-96 and 1998-99
(%)
1995-96 1998-99
Male Female Total Male Female Total
Labour force participation rate 75.2 66.4 70.6 73.3 71.3 72.3
Share of persons employed (15+) by occupation (per cent)
Agriculture 60.1 80.5 70.3Elementary occupations 16.1 11.0 13.6Service workers 6.9 3.5 5.2Craft and related trade 8.4 3.5 5.9Others 8.6 1.5 5.1Total (000s) 4736 4727 9463
Structure of employment (15+) (per cent)
Paid employees 24.3 7.7 16.0Self-employed 52.0 28.7 40.4Unpaid family workers 23.3 63.4 43.3
Note: Based on data from Nepal Labour Force 1995-96 and 1998-99.Source: GEFONT 2001.
46 Human Development in South Asia 2003
have affected the government’s ability toundertake developmental activities. Thepast decade, however, has also witnessedgrowing attempts at decentralisation anddevolution of both administrative andfinancial authority, with some favourableimplications for public services at least insome rural areas. However, general fiscalconstraints, along with the effects of theopen border with India, which havemeant that Indian trade liberalisationnecessarily affects Nepal’s economy aswell, have been associated with relativelylow rates of growth and even lower ratesof employment expansion.
There is no evidence of a decline inpoverty for Nepal as a whole between1976 and 1995-96 (the date of the mostrecent Household Budget Survey).Poverty is widespread and most estimatesput it at just under half of the population.The Nepal Living Standards Survey(1995-96) found 42 per cent of thepopulation to be below the poverty line(44 per cent of urban and only 23 percent of rural populations). The differencebetween Kathmandu and the rest ofNepal, including other urban areas, is verymarked: the poverty ratio in the urbanKathmandu Valley was estimated to beonly four per cent. What is very clear isthat, despite the low level of developmentand different nature of Nepal’s economy,it shares one characteristic with othercountries of South Asia: growth over thedecade 1984-85 to 1995-96 did nottranslate into reduction in the incidenceof poverty. Rather, the survey dataindicate that inequalities increased overthis period.16
Economic policies and employment
Commonality of experience in South Asia
One striking feature of the previousdiscussion is the apparent commonalityof economic experience across the verydisparate countries of the region, whichdiffer in size, resource endowment,particular social and politicalconfigurations, and patterns of
constraints. Despite these differences,there are some significant similarities inboth the types of economic strategy thathave been pursued, and the ensuingeconomic processes, especially in termsof the employment outcomes. Thus, allof these economies share certainstructural characteristics. These include:
• the presence of a high degree ofunderemployment;
• a strong dualism between organisedand unorganised sectors, especially inmanufacturing, which sometimes (butnot always) translates into the dualismbetween large-scale and small-scale;
• the continuing significance ofagriculture as a major employer;
• the emergence of services as one ofthe largest employers, often as a refugesector; and
• the involvement of by far the largershare of the workforce in, what isessentially, low productivity employ-ment.
But in addition to these, what is moreremarkable is the apparent synchronicityof policies and processes across theregion, despite very differing social andpolitical pressures. All the economies ofthe region had import-substitutingindustrialisation strategies, with theattendant development of some industryand associated dualism in the economy,as well as regulation of much economicactivity, for the first few decades afterindependence. From the 1980s onwards,all of them moved, to varying degrees, toa strategy of development based onexport-orientation, liberalisation andprivatisation based on the market-basedeconomic paradigm. The process couldbe said to have started in South Asiawith the Sri Lankan governmentof Jayawardene moving towardsliberalisation and dismantling of theearlier universal food security system, inthe late 1970s and early 1980s.Subsequently, and more strongly in theearly 1990s, all the governments in theregion (barring that of Nepal, which had
Economic Growth and Employment in South Asia 47
a very different position) went throughfairly comprehensive policies of internaland external liberalisation, reduction ofdirect state responsibility for a range ofgoods and services, and privatisation. Bythe turn of the century, most of theimportant economies in South Asia hadundergone:
• very substantial reduction in directstate control in terms of administeredprices, regulation of economic activity;
• privatisation of state assets, often incontroversial circumstances;
• rationalisation (usually also aeuphemism for reduction) of directand indirect tax rates, which becameassociated with declining tax-GDPratios;
• attempts (typically unsuccessful) toreduce fiscal deficits which usuallyinvolved cutting back on publicproductive investment as well ascertain types of social expenditure,reducing subsidies to farmers andincreasing user charges for publicservices and utilities;
• trade liberalisation, involving shiftsfrom quantitative restrictions to tariffsand typically sharp reductions in theaverage rate of tariff protection;
• financial liberalisation involvingreductions in directed credit, freeing ofinterest rate ceilings and othermeasures which raised the cost ofborrowing, including for thegovernment;
• movement toward market determinedexchange rates and liberalisation ofcurrent account transactions; and
• some degree of capital accountliberalisation, including easing rules forForeign Direct Investment, allowingnon-residents to hold domesticfinancial assets and providing easieraccess to foreign commercialborrowing by domestic firms.
This commonality of policy experiencemeant in turn that the outcomes were alsoquite similar, despite the very differentinitial conditions in the different
economies. Some of these outcomes arediscussed in the following sections, butbefore that, certain common processesthat are quite noticeable and significant,are identified here.
First, the evidence points to increasinginequalities of income in all theeconomies of the region. These growinginequalities are evident in terms ofdifferences between rural and urbanresidents; between households of varioussizes and classes of expenditure; andbetween sub-regions within countries.The widening of income gaps have also,in some cases, been associated withincreased social and political tensions inthe region, which may be expressed notso much as direct demands for redressalof income imbalances, but in terms ofother ethnic, social, cultural or regionaldemands.
Second, across all the countries in theregion there has been a deceleration ofemployment generation, compared toprevious periods. This has occurreddespite a slight improvement, or at leastthe same trend level, of growth inaggregate economic activity. In all thecountries in South Asia, employmentgeneration has not kept pace with theincrease in population, and in severalcountries (such as India and Pakistan, forexample), this has expressed itself notonly in higher rates of unemployment andunderemployment, but also in declininglabour force participation, which is notfully explained by increased involvementin education.
Third, in most of the countries in theregion, there has been either stagnationor increase in levels of poverty as definedby the head count ratio. India is the onlycountry where the data are ambiguous onthis matter, but even here, plausibleestimates suggest that while poverty hasdeclined somewhat over this period, therate of decline has reduced compared tothe earlier periods. Such evidence onpoverty across the region is broadly inconformity with the evidence onwidening inequality and deceleratingemployment.
Across all thecountries in theregion there hasbeen deceleration ofemploymentgeneration,compared toprevious periods
48 Human Development in South Asia 2003
Fourth, the relative decline ofmanufacturing, especially in the small-scale sector, and the stagnation or declineof manufacturing employment, is markedacross the region, with the exception ofSri Lanka. In different countries of theregion, agriculture and/or services appearto have become residual refuge sectorsfor workers who cannot find productiveemployment in industry; in India,however, even agricultural employmenthas declined. Across the region, thereappears to be relatively little link betweenrates of aggregate economic growth andtotal employment generation in the recentpast.
Fifth, in all countries of the region,the quality of employment appears tohave deteriorated, with an increase incasual and part-time work, as well asgreater fragility of contracts andindications that day labourers find fewerdays of work. Real wage rates havetypically stagnated, and wage shares ofincome have typically declined.
Macroeconomic policies and employment
The patterns of growth and employment,observed in the different economies ofSouth Asia since the early 1990s, call intoquestion the arguments advanced by theadvocates of reform that there is a directlink between such reform and economicgrowth. Such a link tends to be based onthe premises that both internalderegulation and external liberalisationspur private investment; that curbingpublic investment is beneficial foraggregate growth because otherwise ittends to ‘crowd out’ private investment;that privatisation delivers assets to thosewho are likely to make socially moredesirable use of them; and, that privateagents, acting on their own, will deliverboth more efficient and more dynamicoutcomes.
This optimistic perception ignores thewidespread evidence of market failure, atboth microeconomic and macroeconomiclevels, as well as the strong evidence ofclose positive links between public and
private investment. There are obviousreasons why such an argument, therefore,would not hold over either in short-runor long-run time horizons, especially indeveloping economies such as those inSouth Asia. Given the unequal asset andincome distribution that exists and theconsequent limited nature of the homemarket, private investment would comeup against a demand constraint fairlyrapidly. This would be aggravated whenthe type of private investment that occursdoes not generate that much employment,as is likely when the investment is insectors catering to rich consumers withproduction involving high import contentor more capital-intensive technology.Public investment in developing countriestends to have strong positive linkageswith private investment, not only becauseof the standard Keynesian mechanism,but also because it operates to easeinfrastructure and other supplyconstraints, making private productioneasier and cheaper. Therefore, a strategybased on reducing public investment andderegulating private investment to fill thegap could well be expected to generatelower aggregate investment and growth.
This argument is actually borne out bythe experience of almost all the countriesof South Asia. By the turn of the decade,governments in the region had alreadyachieved major liberalisation andderegulation in many important areas ofthe economy. Thus, internal and externaltrade was almost completely liberalised inall the countries of the region by 2001.Domestic deregulation—especially forlarge capital—was extensive and providedmuch greater freedom to private investorsin general. Attempts to control the fiscaldeficit in order to prevent ‘crowding out’of private investment meant cuts in theregional governments productiveexpenditures and substantial reduction inthe ‘primary deficits’ (that is, net ofinterest payments). Many cases ofprivatisation of public assets were pushedthrough even at rock bottom prices.Despite all this, if growth still tended toslacken, the problem obviously lay to a
The quality ofemployment appearsto have deteriorated,with an increase incasual and part-timework
Economic Growth and Employment in South Asia 49
substantial extent with the reform processitself. And this was manifested in the factthat in aggregate terms, the reformprocess did not generate either higherrates of investment in the aggregate orincreases in the productivity of suchinvestment.
All the governments in the region nowrecognise that employment generation hasbeen a major failure of the reform processso far. In fact, increasing employmentgeneration is now an explicit concern inmost recent planning and policydocuments. It is strange, however, thatwhile the explicit goal has changed fromgrowth itself to employment generation,the strategies that are supposed to achievethis essentially involve further doses ofsame reform, rather than policies thatwould directly affect employment. Thus,most of the policy statements refer tofurther privatisation, further deregulationof domestic economic activity, furtherfinancial liberalisation and external capitalaccount liberalisation, and furtherrestrictions on fiscal policies. These areprecisely the set of policies that, asobserved already, have been associatedwith deceleration of employment in thepast decade. If employment generationwere to be the focus of the new policythrust in the region, then it would actuallyrequire a rethinking of these policies,towards more active state intervention interms of supporting employment-intensive activities through a range oftrade, fiscal and financial measures.Without such active involvement,aggregate employment in the region islikely to continue to stagnate, and mayeven deteriorate with further doses ofreform.
Trade liberalisation and technology choice
All the economies in the South Asianregion underwent very substantial tradeliberalisation, and effective rates ofprotection across the region reduced verysharply from the early 1990s onwards.The expectation was that there would bea consequential shift from capital-
intensive production to more labour-intensive production that would be morein keeping with the perceived staticcomparative advantage. This, in turn, wasexpected to lead to increased employmentgeneration because of the greaterincentives afforded to labour intensiveexports in particular.
However, thus far the experienceseems to have belied this optimisticexpectation. It is true that in each of theeconomies in South Asia, there has beena spurt in employment in a particularexport sector: readymade garments inBangladesh; cotton cultivation inPakistan; clothing, software and IT-enabled services in India; and somemiscellaneous manufactured exports inSri Lanka. However, this has been morethan counterbalanced by the decline inemployment in traditional sectors and inthe industries catering to the domesticmarket that have faced importcompetition consequent upon tradeliberalisation. This is why, across theregion, aggregate rates of employmentshow deceleration in growth, and inmanufacturing, even declines. It isnoteworthy that for all of South Asia, themanufacturing trade balance is stillnegative, so it is not surprising that therehas been a net employment loss throughtrade liberalisation. Two features that aresignificant for employment need to beemphasised here. First, the worst affectedby import penetration tend to be smallproducers, who are by far the mostlabour-intensive employers, and they areoften displaced by imports producedthrough more capital-intensivetechniques. Second, the effect of importcompetition on output and employmentneed not be measured only through theactual level of imports; often, the merethreat of imports is sufficient to reducedomestic prices such that the higher costor smaller producers become unviable.This has been observed, for instance, inagriculture and small-scale manufacturesin both India and Bangladesh.
Another aspect of greater opennessand the consequent increase in the level
All the governmentsin the region nowrecognise thatemploymentgeneration has beena major failure ofthe reform processso far
50 Human Development in South Asia 2003
of competition is that it also affectspatterns of technological choice ofdomestic producers, independent ofwhether they are producing for the homemarket or the export market. We havealready observed that the need tocompete in both domestic andinternational markets, with largemultinational producers able to achievecertain quality and cost standards, meansthat local producers are required to adoptrelatively capital-intensive newtechnologies simply in order to survive.Even small-scale producers are notimmune to this trend, as the products ofmultinational companies become morewidely available, even in relatively remoteor rural markets in South Asia. Onenotable feature of most of themanufacturing sectors in this region is anincrease in labour productivity (orconversely, declines in the employmentelasticity of production), reflecting mainlychanges in technology. These techno-logies are copied from the modelsdeveloped in advanced capitalist nationswhere labour-saving is more of a concern,but they impose quality and homogeneitystandards for products that becomeincreasingly necessary even to retainconsumers in the developing world.
ICT and employment in South Asia
In many official discussions across theregion, information and communicationtechnology (ICT) is seen as the great newhope, the expansion of which will employa substantial portion of the educatedworkforce and increase the value addedper worker, besides acting as an engineof growth within the economy in general.Software and IT-enabled services in the1990s emerged as the fastest growingsegment of Indian exports, and this hascontinued into the current decade. Therecent success of Indian software and IT-enabled services has been a source ofoptimism in India and in other countriesof South Asia, all of which are nowanxious to capture some of this potentialmarket. Much has been made of the
growth potential of this sector and itsability to absorb increasing number of theeducated, as well as the importantpotential it offers, especially for urbaneducated women, to enter employmenton relatively advantageous terms. Thereis no doubt that these new sectors offer avery promising combination ofemployment opportunities and exportrevenues from hardware, software andIT-enabled services. Projections by bothprivate industry and government of thelikely trends in output, exports andemployment, are extremely optimistic.Also, recent trends confirm that there hasbeen a decline in open unemploymentamong the urban educated groups inIndia, which has been attributed by manyto the employment expansion in IT-enabled services in particular.
According to one study17, India alonehas the potential of raising exportrevenues from software and IT-enabledservices from its 1999-2000 level of$4 billion to $50 billion in 2008, involvingan annual rate of growth of 40 per centin the output of the industry. As a result,the IT sector’s contribution to GDPgrowth is expected to touch 7.5 per centand its share in India’s exports to reach30 per cent as compared with around fiveper cent currently. Such growth isexpected to have substantial employmentimplications, with employment in thesoftware industry alone projected to risefrom its 1997-98 level of 180,000 to 2.2million in 2008. This makes the projectedincrease in employment in the softwaresector greater than the increase in totalorganised public and private sectoremployment of 181,300 between 1990and 1998. To this should be added theprojection that direct and indirectemployment in the hardware sector isexpected to touch 1.6 million and 3.2million respectively, which would taketotal IT employment to seven million in2008. And, of course, this still does notinclude the employment potential of awide range of IT-enabled services,including data entry and processing,medical transcription and back-office
Economic Growth and Employment in South Asia 51
work subcontracted by multinationalcompanies, where it is often argued thatthe scope for job expansion is evengreater.
As always, however, there is a needfor caution in interpreting such optimisticfigures. The first problem relates to thedigital divide, in terms of both availabilityof, and access to, even the hardwarenecessary, as well as the levels ofeducation required to make use of thetechnology even at a relatively basic level.The penetration of PCs in India and inSouth Asia as a whole is among thelowest in the world. Telephoneconnectivity is also low, although it hasbeen growing more rapidly recently. Evenafter taking account of the optimisticprojections of IT growth to the year 2008,PC penetration in India is expected totouch only 20 per thousand and fixedtelephone penetration just 100 perthousand. In these circumstances, theimpact of IT on the nation as a wholecan only be marginal, and generallyconfined to urban India.18
The ability to make use of thetechnology is critically determined bylevels of education. And here, of course,most of South Asia is woefully lacking.The literacy requirement for officialfigures is set so low that in most casesbeing literate would be inadequate to becompetent enough to become digitallyliterate, as a minimum of schooleducation would be a prerequisite beyonda point. And in terms of this criterion,the picture is quite depressing, accordingto a recent report on the state of publiceducation. Even in India, which issupposedly the frontrunner in the regionfor software and related activities, oneestimate (relating to the 1990s) is that halfof the country’s population (61 per centof women and 36 per cent of men, agedseven and above) is functionally unableto read and write; less than 30 per cent ofall adults have completed eight years ofschooling; and, one-third of all childrenaged 6-14 years (about 23 million boysand 36 million girls) are out of school.19
Similarly, since much of the activity isin English, the employment generated byboth the software and IT-enabled servicessectors is currently concentrated amongthe richer and English-educated sectionsof urban (and even metropolitan) SouthAsia, and is likely to remain so.
It is also true that the impact of IT ongrowth and employment is uncertain. Theremarkable rates of growth recentlyrecorded are from very small bases, andthe sector typically remains very smallrelative to the rest of the economy, inIndia as elsewhere in the region. Also,because this industry is characterised bysubstantial dependence on importedcapital goods, components and software,this substantially reduces the domesticmultiplier effects of such spending.
A study20 points out that there are atleast three prerequisites for full realisationof the growth potential in this sector.First, software exports need to diversifyin term of sources and destinations.Currently the US market dominates,which is why the recent slowdown in theUS has generated apprehensions aboutthe sustainability of the Indian IT boom.Second, software service providers shouldbe able to sustain the quality of servicesoffered by inducting appropriatelyqualified and skilled personnel to notmerely write code but design systems.Third, Indian firms should be able tomigrate up the value chain, so as toensure a growing share of the market aswell as enter into segments that offerhigher value per employee. In all theseareas the availability of personnel isbound to prove a constraint. Theinadequacy of training services resultingfrom the proliferation of poorly-staffed,profit-hungry teaching shops, and thelimited base for training and skilled-development in the domestic softwareservices segment are already evident. Asa result even as an outsourcer, India stillremains a lower-end supplier of softwareand IT-enabled services.
Further, it is not clear how much ofthis export revenue is little more than thesale of cheap skilled and not-so-skilled
The ability to makeuse of technology iscritically determinedby levels ofeducation
52 Human Development in South Asia 2003
IT-enabled labour services, whose outputis transmitted via modern communicationtechnologies to sites where those servicesare required. The possibility of suchservice delivery has helped Indiacircumvent the obstacle to service exportscreated by immigration laws in thedeveloped countries. This means that alarge part of software exports is not verydifferent from the exports of nursing,carpentry, masonry and other suchservices, except for the fact that unlikethose exports, the presence of the serviceprovider at the point of sale is notrequired in the case of IT-enabledservices. This will generate moreemployment for the educated which iscertainly a good thing for the region, butthat does not necessarily translate into animprovement in aggregate labourproductivity or a rise in employmentconditions for the mass of workers in theregion.
This sector shows clear signs of labourmarket segmentation by gender, caste andclass. As almost all of those involved arefrom the urban upper caste English-speaking elite of South Asian society, ithas been argued that the pattern ofdevelopment of the software andIT-enabled services sector brings intosharp relief the tendency of the marketto reinforce or aggravate existing socio-economic inequities. 21 While it willcertainly draw more of the educatedyoung persons into paid jobs and reducethe problem of unemployment of theeducated youth to some extent, it wouldnot bring about any major transformationin aggregate employment patterns in thenear future.
Policy implications
It is clear from the above discussion that,despite their diversity of context andexperience, South Asian economies sharea number of problems with respect toemployment generation. Many of thecurrent commonalities in this regard stemnot only from structural features, whichare shared across countries, but also from
the similar set of macroeconomic, tradeand financial liberalisation policies thathave been adopted, and which have hada net deleterious effect on employmentgeneration, notwithstanding expectationsto the contrary. It would be correct tostate that productive employmentgeneration is probably the single mostcritical economic issue in all of thesecountries, and should be the primaryfocus of future government policies.Several policy implications clearly emergefrom our analysis:
1. The first important policy implicationthat emerges from the precedingdiscussion is that all the countries inthe region need to rethink, modify andrevise at least some of the economicstrategy that has been broadly commonto all of them. This refers mostspecifically to the supposed emphasison fiscal discipline, which has not beenreflected so much in actual declines inthe fiscal deficit to GDP ratios, as incompression of important productivepublic expenditure with high linkageand multiplier effects. Across SouthAsia, rates of public investment havecome down. This process verydefinitely needs to be reversed. Inaddition, there should be a greateremphasis on public expenditure withhigh direct and indirect effects onemployment generation. Some obviousexamples are:
(a) public expenditure on ruralemployment schemes that are usedto build rural infrastructure andtherefore improve future supplyconditions, and
(b) urban employment schemes whichare used to provide importantpublic services (including repair ofexisting infrastructure), therebyimproving both welfare and theconditions for future growth.
2. In addition, it was evident above thattrade liberalisation, while it may havebeen associated with some expansion
All the countries inthe region need torethink, modify andrevise at least someof the economicstrategy that hasbeen broadlycommon to all ofthem
Economic Growth and Employment in South Asia 53
in exports in certain countries, hasmeant a loss of employment in the net,because of the effects of importcompetition on domestic producers,especially on the employment-intensivesmall-scale producers. It is imperativefor this region to counter some of theadverse effects of trade liberalisationon employment. Possible interventionsinclude:
(a) some special measures, includingmarketing assistance and somedegree of protection, for small-scale producers competing withlarge multinational producers;
(b) a system of variable tariffs topreserve some degree of stabilityin domestic output prices,especially for perishable goods;and
(c) ensuring adequate infrastructureconditions especially for smallproducers.
While WTO membership currentlyprecludes use of the protection measuresthat were historically a standard featureof late industrialisation across the world,it is possible to use even the existingGATT provisions in a way so as to ensuresome degree of protection to industriesthat are considered important for theeconomy, either from the strategic or theemployment perspective.
3. As the pressures of import competitionhave had the effect of forcing morecapital-intensive techniques upondomestic producers (even on small-scale producers) simply to comply withquality standards that are increasinglyimposed by consumers, some publicpolicy measures are required tocounteract this trend and make more‘appropriate’ (in terms of labour-using)technologies more widely accepted.These could include fiscal and creditincentives to producers who chooseemploy more labour.
4. The one sector which has been theworst affected because of greater tradeopenness in the recent past isagriculture, and there is no questionthat agriculture is facing a severe crisisacross the region. Since this sectorremains the most important employerin South Asia, much more needs to bedone to protect livelihood and foodsecurity in agriculture. The measuresthat should be considered here include:
(a) continuing and even expandingsome degree of price supportoperations to ensure stable outputprices for cultivators of importantcrops;
(b) expansion of public agriculturalextension activities, which havedeclined in all countries, so as tocounteract the growing power ofmultinational seed and inputsuppliers in determining croppingpatterns and input use, andincreasing the risk of cultivation;
(c) variable tariff on agriculturaloutput, to smoothen the volatilityof world prices for domesticcultivators and prevent dumpingof subsidised crop productionfrom USA and Europe;
(d) reversing the trend towards cuttingall subsidies on agriculture,especially when huge subsidies toAmerican and European farmerscontinue unabated; and
(e) insisting (in international tradenegotiations) upon the equal rightto protect domestic cultivators aslong as high subsidies andproblems of market access persistin the developed countries.
5. Financial liberalisation has had anindirect but profound impact uponemployment generation possibilities byreducing the viability of the largestemployers—agriculture and small-scaleproducers in manufacturing andservices. It is important to revive the
Much more needs tobe done to protectlivelihood and foodsecurity inagriculture
54 Human Development in South Asia 2003
possibility of directed credit, which hasbeen reduced or removed across theregion, so as to provide a means ofensuring the continued economicviability of small-scale producers, whoare unable to access other capitalmarkets for finance.
6. A problem that exists throughout theregion is that of strong dualism inlabour markets, with a large-scalesector that employs relatively few butmore protected workers, and a small-scale (or unorganised) sector thatemploys the bulk of the workforcebut provides little or no protectionto workers, who are typically engagedin low-productivity operations.Obviously, for genuine progress on theemployment front, this dualism mustbe broken. However, the currentapproach appears to be that oflevelling downwards, that is of denyingworkers in the large or organised sectortheir basic rights, rather thanattempting to improve the wages andworking conditions of all workers. Theproblem is not a simple one oflegislation, although, of course, that isalso a necessary condition forimproving the ability of workers tobargain for better conditions and toensure their basic socio-economicrights. But a reduction or removal oflabour market dualism can only comeabout through an increase in labourdemand that dramatically improves thebargaining power of workers. Growthin itself is not an adequate means ofensuring such a rise in labour demand;other related processes must occur.
7. Similarly, the endemic problem ofunderemployment that was mentionedin this chapter, cannot be addressedthrough legislation alone. It requires acertain increase in labour demand thatemploys all labour productively. Thepolicy focus, therefore, must be onemployment diversification, onidentifying sectors with a potentiallylarge use of labour, and systematicallypromoting them through a variety ofmeasures. Sectors like IT-enabledservices do have some promise forincreasing employment among theeducated groups, but equally, otherdiversified forms of employmentgeneration must urgently be found forless skilled workers, especially in ruralareas.
8. Finally, it is apparent that in thisregion, where the problems are sosimilar, there is tremendous scope forregional co-operation. The potentialfor economic integration in the regionthrough South Asian Association forRegional Cooperation (SAARC) hasthus far been bogged down by mutualdistrust, especially between the twolarge members, India and Pakistan. Ifthis can be overcome, and trade withinthe region is widened, as well asexpansion in other forms of South-South trade (as indeed is the casecurrently between India and theMercosur countries, or India andAfrica), there are genuine and hugepossibilities of embarking on amutually beneficial path of growth withemployment generation.
Growth in itself isnot an adequatemeans of ensuring arise in labourdemand; otherrelated processesmust occur
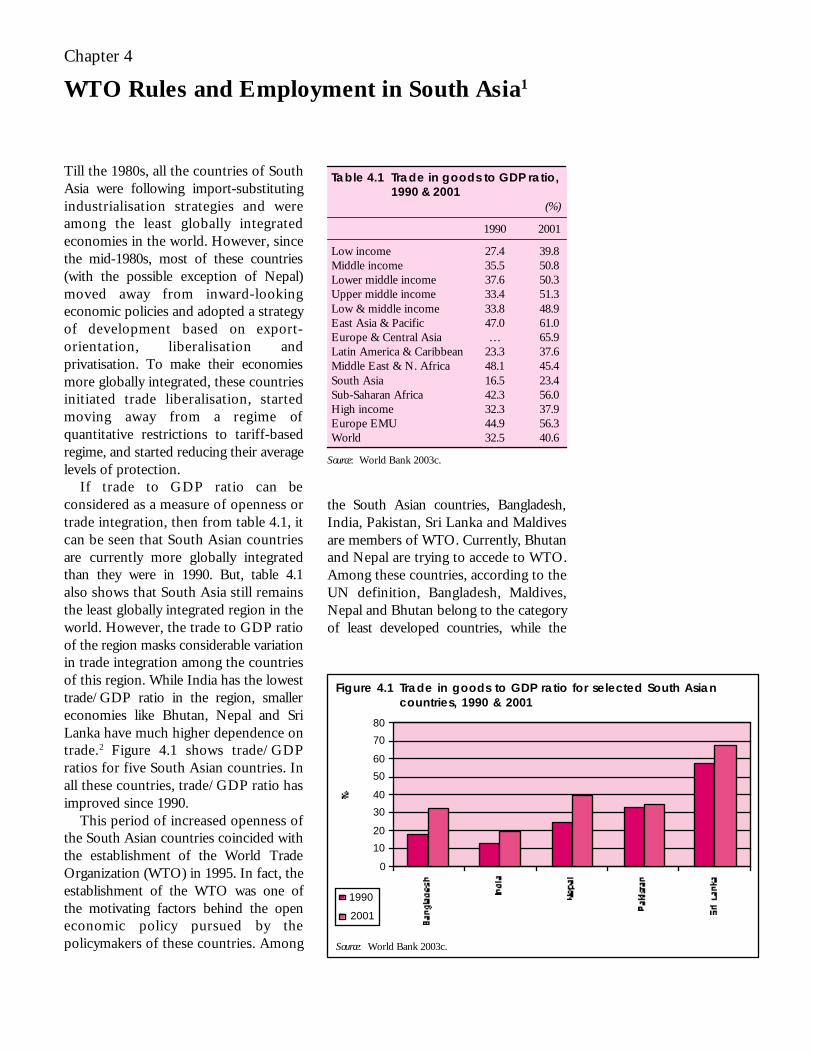
WTO Rules and Employment in South Asia 55
Till the 1980s, all the countries of SouthAsia were following import-substitutingindustrialisation strategies and wereamong the least globally integratedeconomies in the world. However, sincethe mid-1980s, most of these countries(with the possible exception of Nepal)moved away from inward-lookingeconomic policies and adopted a strategyof development based on export-orientation, liberalisation andprivatisation. To make their economiesmore globally integrated, these countriesinitiated trade liberalisation, startedmoving away from a regime ofquantitative restrictions to tariff-basedregime, and started reducing their averagelevels of protection.
If trade to GDP ratio can beconsidered as a measure of openness ortrade integration, then from table 4.1, itcan be seen that South Asian countriesare currently more globally integratedthan they were in 1990. But, table 4.1also shows that South Asia still remainsthe least globally integrated region in theworld. However, the trade to GDP ratioof the region masks considerable variationin trade integration among the countriesof this region. While India has the lowesttrade/GDP ratio in the region, smallereconomies like Bhutan, Nepal and SriLanka have much higher dependence ontrade.2 Figure 4.1 shows trade/GDPratios for five South Asian countries. Inall these countries, trade/GDP ratio hasimproved since 1990.
This period of increased openness ofthe South Asian countries coincided withthe establishment of the World TradeOrganization (WTO) in 1995. In fact, theestablishment of the WTO was one ofthe motivating factors behind the openeconomic policy pursued by thepolicymakers of these countries. Among
the South Asian countries, Bangladesh,India, Pakistan, Sri Lanka and Maldivesare members of WTO. Currently, Bhutanand Nepal are trying to accede to WTO.Among these countries, according to theUN definition, Bangladesh, Maldives,Nepal and Bhutan belong to the categoryof least developed countries, while the
Chapter 4
WTO Rules and Employment in South Asia1
Figure 4.1 Trade in goods to GDP ratio for selected South Asiancountries, 1990 & 2001
Source: World Bank 2003c.
1990
2001
80
70
60
50
40
30
20
10
0
Table 4.1 Trade in goods to GDP ratio,1990 & 2001
(%)
1990 2001
Low income 27.4 39.8Middle income 35.5 50.8Lower middle income 37.6 50.3Upper middle income 33.4 51.3Low & middle income 33.8 48.9East Asia & Pacific 47.0 61.0Europe & Central Asia … 65.9Latin America & Caribbean 23.3 37.6Middle East & N. Africa 48.1 45.4South Asia 16.5 23.4Sub-Saharan Africa 42.3 56.0High income 32.3 37.9Europe EMU 44.9 56.3World 32.5 40.6
Source: World Bank 2003c.
56 Human Development in South Asia 2003
other countries of this region are includedin developing countries.
Unfulfilled promises of WTO
When WTO was set up, it was widelybelieved that it would be a vastimprovement over its predecessor GATT(General Agreement on Tariff and Trade),and that the imposition of the newmultilateral trading system would helpdeveloping countries to pursue export-ledgrowth. There were three main reasonsbehind this optimism.
Firstly, in WTO, agriculture wasbrought in for the first time under theeffective purview of a multilateral tradingsystem. Though agriculture was includedin the original 1947 GATT agreement,too many exemptions were allowed forthis sector rendering the GATT rulesoperationally ineffective. Thus it wasbelieved that the new WTO rules wouldbring about a structural change in theglobal agricultural trade, such that moreefficient agricultural producers wouldstand to benefit from the WTO. As mostSouth Asian countries are low costproducers of agricultural goods, it wasexpected that these countries wouldsignificantly benefit from a more openand less distorted global agricultural traderegime.
Secondly, prior to WTO, market accessfor textile products in developedcountries was constrained by theextremely restrictive Multi FibreArrangement (MFA), which allowed thedeveloped countries to selectively imposequantitative restrictions on imports oftextiles and clothing from developingcountries. WTO Agreement on Textilesand Clothing (ATC) intended to phaseout MFA, and integrate textiles andclothing within the general WTO rulesthat govern trade in manufactured goods.It was projected that removal of quotason exports of textiles and clothing wouldact as a big fillip for developing countries,because the low labour cost of thesecountries makes them efficient producersof these goods. Given the fact that labour
cost in South Asia is among the lowest inthe world, almost all the countries of thisregion expected to benefit from thephasing out of MFA.
Thirdly, another aspect of WTO,which raised the hopes of developingcountries, was the promise to liberalisetrade in services. Traditionally, trade inservices was under a very high level ofprotection and was kept out of anymultilateral trading system. The GeneralAgreement in Trade in Services (GATS)was considered to be a first step towardsthe eventual liberalisation of trade inservices. GATS was supposed to openup a huge market for developingcountries. As GATS covers a broad rangeof services like tourism, education,consultancy services and manpowerexports, the South Asian countries withabundant supply of skilled and unskilledlabour were expected to benefit fromsuch an agreement.
In exchange of the promise ofliberalisation in these three key areas,developing countries had to give twocrucial concessions to developedcountries. Firstly, they had to accept theWTO Trade Related Intellectual PropertyRights (TRIPS) agreement, whichproposed to impose much stricter patentlaws globally. Secondly, they also had toremove all non-tariff barriers on industrialgoods and reduce tariff barriers on theseproducts substantially. It was feared thatthese two agreements would have anegative effect on the industrialisationprocess of developing countries.
But on balance, it was projected thatdeveloping countries would be net gainersas the benefits accruing to them from theliberalisation of the three key sectorsagriculture, textiles and services werelikely to more than offset the expectedlosses from the other two areas.
As almost all the South Asian countriespossess comparative advantage in thethree key areas, policymakers of thesecountries expected that increased marketaccess in agriculture, textiles and serviceswould allow these countries to follow anopen and export-led development policy.
WTO Rules and Employment in South Asia 57
As an overwhelming proportion ofworkers in South Asia are involved inagriculture, textiles and services sectors,it was also expected that there would bea significant boost in employment. Anypossible negative effect of the WTOagreement on the industrial sector of thecountries was expected to be more thancompensated for by the gains in the threekey sectors.
However, after seven years ofimplementation of WTO rules, mostexpectations remain unfulfilled. Thedejection of South Asian countries withWTO is well summarised in the latesttrade policy review of Pakistan. It says:
‘… Uruguay Round had not broughtfundamental changes, and the disadvantages facedby developing countries had been furtherexacerbated; these countries had not gained anymeaningful increase in market access in the keyareas where they have a clear comparativeadvantage (textiles and agriculture). Services hadbeen liberalised in sectors of primary interest todeveloped countries (e.g. telecoms, financialservices). The costs to developing countries of theWTO Agreement on Intellectual Property(TRIPS) Agreement were becoming evident, andthe Agreement on Trade-Related InvestmentMeasures (TRIMs) was having an equallyharmful effect on the endeavours of developingcountries to build their industrial base. Theasymmetries in the multilateral trading systemhad contributed to the growing inequalities andasymmetric benefits between countries.’3
The failure of WTO to generate theexpected level of benefits is also reflectedin the employment figures for South Asia.According to ILO, 4 for South Asiaunemployment level has increased from2.9 per cent in 1995 to 3.4 per cent in2001, and annual employment growth ratehas also come down during the secondhalf of the 1990s as compared to the firsthalf. Data from Asian Development Bank(ADB)5 show that unemployment hasincreased in Pakistan, Bangladesh, andMaldives while it has decreased only inSri Lanka during this period (figure 4.2).
Though the ADB data do not reportIndia’s unemployment rates, EconomicSurvey of the Government of Indiashows that the unemployment rate inIndia has increased from 5.99 per cent in1993-94 to 7.32 per cent in 1999-2000.
The figures reveal that in most SouthAsian countries the employment scenariohas worsened in the post-WTO period.Given this worsening employmentscenario and the fact that more thanseven years have passed since the WTOrules were implemented, it is importantto analyse whether and how globalisationand WTO has affected the employmentscenario in South Asia. That is what weare going to explore in this chapter.Section one briefly reviews the theoreticalarguments about how trade liberalisationcan affect employment in developingcountries. Section two investigates theimpact of WTO Agreement onAgriculture on employment in SouthAsia. Section three analyses theAgreement on Textiles and Clothing andits employment implications for SouthAsia. Section four examines the impactof WTO rules on other manufacturinggoods. Section five reviews the GATSagreement and its implications for SouthAsia. The final section draws someconclusions from the analysis in thischapter.
Trade liberalisation and employmentin developing countries
The debate on trade as an engine ofgrowth is probably one of the mostwidely argued topics in developmentliterature. Proponents of tradeliberalisation generally argue that aliberalised trade regime is likely to have afavourable impact on employment in adeveloping country. For example, theWorld Development Report of 1995,6
while discussing the likely impact ofWTO on developing countries, concludesthat workers stand to gain from tradeliberalisation on the following counts:
In most South Asiancountries theemployment scenariohas worsened in thepost-WTO period
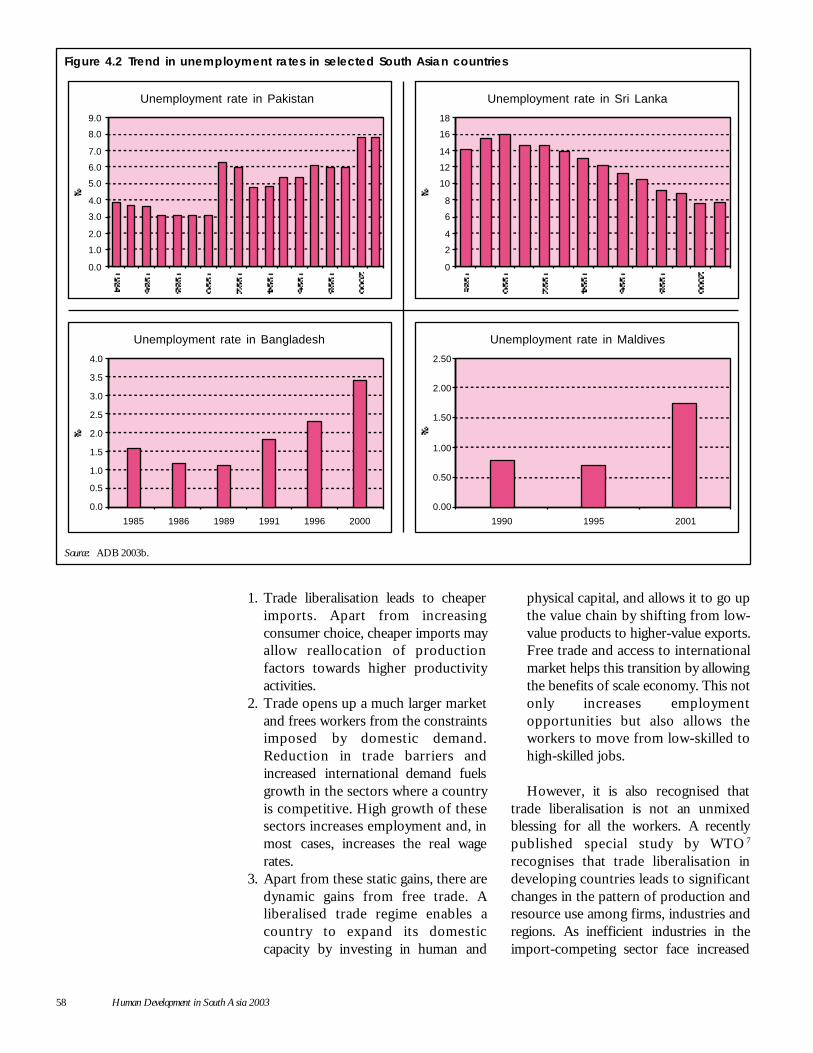
58 Human Development in South Asia 2003
1. Trade liberalisation leads to cheaperimports. Apart from increasingconsumer choice, cheaper imports mayallow reallocation of productionfactors towards higher productivityactivities.
2. Trade opens up a much larger marketand frees workers from the constraintsimposed by domestic demand.Reduction in trade barriers andincreased international demand fuelsgrowth in the sectors where a countryis competitive. High growth of thesesectors increases employment and, inmost cases, increases the real wagerates.
3. Apart from these static gains, there aredynamic gains from free trade. Aliberalised trade regime enables acountry to expand its domesticcapacity by investing in human and
physical capital, and allows it to go upthe value chain by shifting from low-value products to higher-value exports.Free trade and access to internationalmarket helps this transition by allowingthe benefits of scale economy. This notonly increases employmentopportunities but also allows theworkers to move from low-skilled tohigh-skilled jobs.
However, it is also recognised thattrade liberalisation is not an unmixedblessing for all the workers. A recentlypublished special study by WTO 7
recognises that trade liberalisation indeveloping countries leads to significantchanges in the pattern of production andresource use among firms, industries andregions. As inefficient industries in theimport-competing sector face increased
9.0
8.0
7.0
6.0
5.0
4.0
3.0
2.0
1.0
0.0
Unemployment rate in Pakistan
18
16
14
12
10
8
6
4
2
0
Unemployment rate in Sri Lanka
2.50
2.00
1.50
1.00
0.50
0.00
Unemployment rate in Maldives
1990 1995 2001
4.0
3.5
3.0
2.5
2.0
1.5
1.0
0.5
0.0
Unemployment rate in Bangladesh
1985 1986 1989 1991 1996 2000
Figure 4.2 Trend in unemployment rates in selected South Asian countries
Source: ADB 2003b.
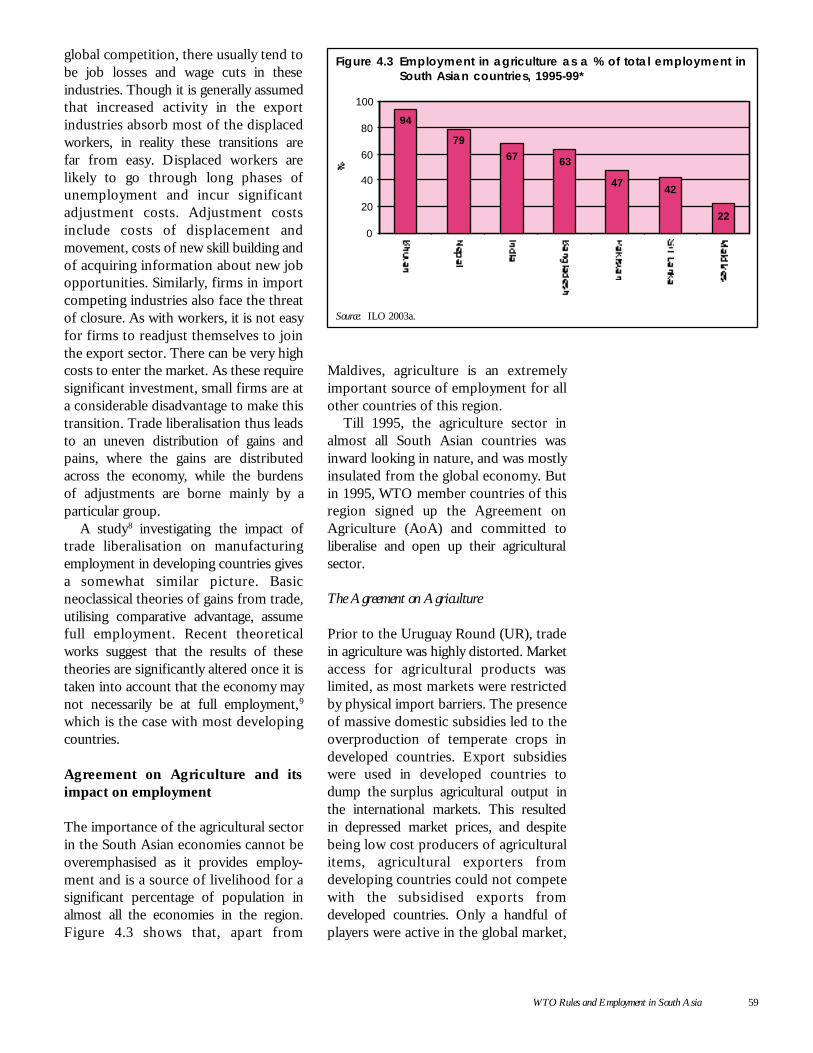
WTO Rules and Employment in South Asia 59
global competition, there usually tend tobe job losses and wage cuts in theseindustries. Though it is generally assumedthat increased activity in the exportindustries absorb most of the displacedworkers, in reality these transitions arefar from easy. Displaced workers arelikely to go through long phases ofunemployment and incur significantadjustment costs. Adjustment costsinclude costs of displacement andmovement, costs of new skill building andof acquiring information about new jobopportunities. Similarly, firms in importcompeting industries also face the threatof closure. As with workers, it is not easyfor firms to readjust themselves to jointhe export sector. There can be very highcosts to enter the market. As these requiresignificant investment, small firms are ata considerable disadvantage to make thistransition. Trade liberalisation thus leadsto an uneven distribution of gains andpains, where the gains are distributedacross the economy, while the burdensof adjustments are borne mainly by aparticular group.
A study8 investigating the impact oftrade liberalisation on manufacturingemployment in developing countries givesa somewhat similar picture. Basicneoclassical theories of gains from trade,utilising comparative advantage, assumefull employment. Recent theoreticalworks suggest that the results of thesetheories are significantly altered once it istaken into account that the economy maynot necessarily be at full employment,9
which is the case with most developingcountries.
Agreement on Agriculture and itsimpact on employment
The importance of the agricultural sectorin the South Asian economies cannot beoveremphasised as it provides employ-ment and is a source of livelihood for asignificant percentage of population inalmost all the economies in the region.Figure 4.3 shows that, apart from
Maldives, agriculture is an extremelyimportant source of employment for allother countries of this region.
Till 1995, the agriculture sector inalmost all South Asian countries wasinward looking in nature, and was mostlyinsulated from the global economy. Butin 1995, WTO member countries of thisregion signed up the Agreement onAgriculture (AoA) and committed toliberalise and open up their agriculturalsector.
The Agreement on Agriculture
Prior to the Uruguay Round (UR), tradein agriculture was highly distorted. Marketaccess for agricultural products waslimited, as most markets were restrictedby physical import barriers. The presenceof massive domestic subsidies led to theoverproduction of temperate crops indeveloped countries. Export subsidieswere used in developed countries todump the surplus agricultural output inthe international markets. This resultedin depressed market prices, and despitebeing low cost producers of agriculturalitems, agricultural exporters fromdeveloping countries could not competewith the subsidised exports fromdeveloped countries. Only a handful ofplayers were active in the global market,
Figure 4.3 Employment in agriculture as a % of total employment inSouth Asian countries, 1995-99*
Source: ILO 2003a.
94
79
67 63
4742
22
0
20
40
60
80
100
60 Human Development in South Asia 2003
and the thinness of the global farm traderesulted in high price fluctuations ofagricultural commodities.
The AoA tried to bring discipline inglobal agricultural trade by removingtrade distortions resulting fromunrestricted use of production and exportsubsidies and import barriers, both tariffsand non-tariff. During the UruguayRound, initial projections suggested thatthe reform measures initiated by the AoAwould open up new opportunities fordeveloping countries. Early analysis of thelikely effect of the AoA on world marketspredicted that reduction in domesticsupport and export subsidies in thedeveloped countries would lead to adeepening of world trade in agriculture, aspatial redistribution of agriculturalproduction, an increase in the share ofdeveloping countries in global agriculturalexports and more transparency inagricultural trade.
Implications of AoA for South Asia
As predominantly agricultural countries,with abundant supply of cheap labour, itwas expected that free and fair trade inagriculture would spur strong growth ofthe agricultural sector in South Asia. Avibrant and growing agricultural sectormight improve rural employment becausein the South Asian countries, agricultureis a very labour intensive process. Anysignificant increase in agriculturalproduction should generally result in anincrease in rural labour demand and ruralreal wages.10 Also, the construction of theinfrastructural support for agriculture ishighly labour intensive in nature. Alongwith these, agricultural growth and ruraldevelopment is likely to generate ruraldemand for relatively labour intensiveconsumer goods and services.
However, the effects of theliberalisation of agricultural trade on ruralemployment are, at best, uncertain,because of many reasons, some of whichare structural in nature, while others aredue to the way the AoA is beingimplemented. For example:
1. In South Asia, agricultural landholdings are, on average, quite small.These lands are generally heavilydependent on the monsoons. Also,because of less capital and relativelylow intensity of other farm inputs,farm productivity is quite low. Asignificant section of the farmingcommunity is engaged in subsistenceland farming with the result that theirability to participate in internationaltrade is limited. The supposed benefitsof a free trade regime are likely tobypass, if not adversely affect, thesefarmers.
2. The small and medium estate holdingfarmers also face commercial problemsin marketing their produce themselvesand are often dependent uponmiddlemen. It has been observed thatin most South Asian countries theintermediaries add substantial mark-upto the prices of agriculturalcommodities. This price hikenegatively affects internationalcompetitiveness of these products. Arecent study 11 observes that thoughIndia is competitive in a number ofcrops at the farmgate level, at the portmost of these commodities lose theircompetitiveness as the middlemenpush up the prices. Although AoAdoes not allow developing countries toprovide subsidies on their agriculturalexports, some export subsidies areallowed, for example:
a) provision of subsidies to reducethe costs of marketing exports ofagricultural products (other thanwidely available export promotionand advisory services) includinghandling, upgrading and otherprocessing costs, and the costs ofinternational transport and freight;and
b) internal transport and freightcharges on export shipments,provided or mandated bygovernments, on terms morefavourable than for domesticshipments.
It was expected thatfree and fair tradein agriculture couldspur strong growthof the agriculturalsector in South Asia
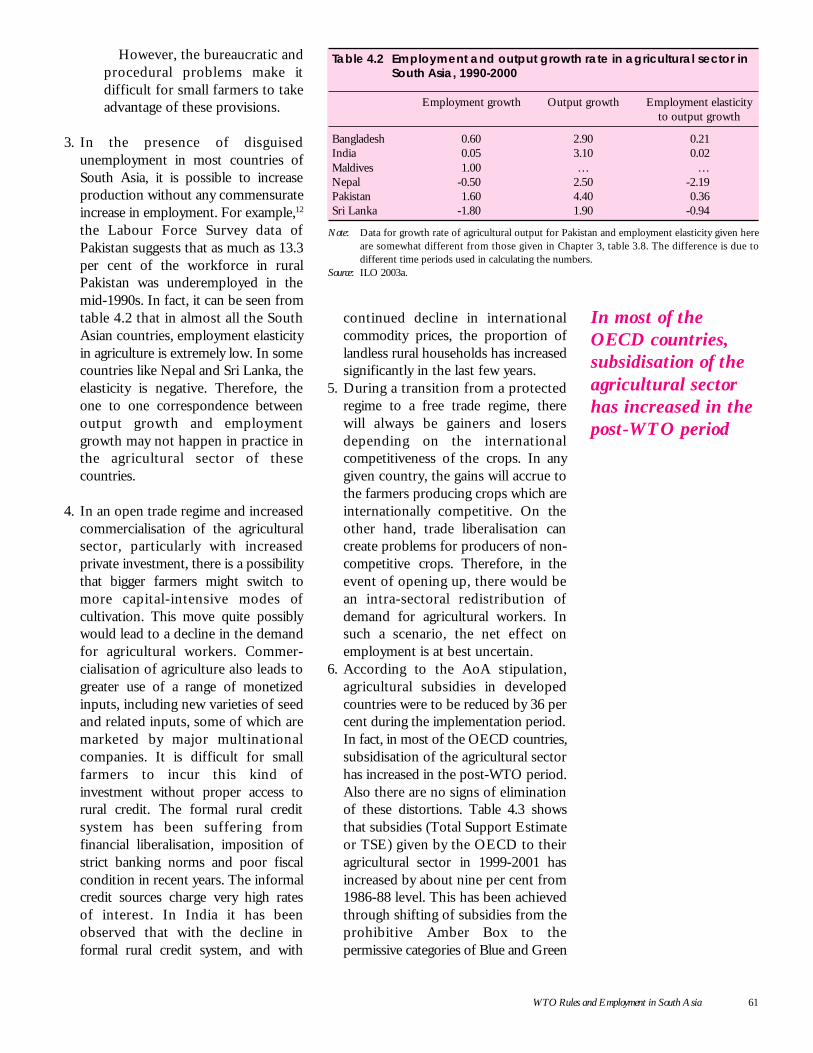
WTO Rules and Employment in South Asia 61
However, the bureaucratic andprocedural problems make itdifficult for small farmers to takeadvantage of these provisions.
3. In the presence of disguisedunemployment in most countries ofSouth Asia, it is possible to increaseproduction without any commensurateincrease in employment. For example,12
the Labour Force Survey data ofPakistan suggests that as much as 13.3per cent of the workforce in ruralPakistan was underemployed in themid-1990s. In fact, it can be seen fromtable 4.2 that in almost all the SouthAsian countries, employment elasticityin agriculture is extremely low. In somecountries like Nepal and Sri Lanka, theelasticity is negative. Therefore, theone to one correspondence betweenoutput growth and employmentgrowth may not happen in practice inthe agricultural sector of thesecountries.
4. In an open trade regime and increasedcommercialisation of the agriculturalsector, particularly with increasedprivate investment, there is a possibilitythat bigger farmers might switch tomore capital-intensive modes ofcultivation. This move quite possiblywould lead to a decline in the demandfor agricultural workers. Commer-cialisation of agriculture also leads togreater use of a range of monetizedinputs, including new varieties of seedand related inputs, some of which aremarketed by major multinationalcompanies. It is difficult for smallfarmers to incur this kind ofinvestment without proper access torural credit. The formal rural creditsystem has been suffering fromfinancial liberalisation, imposition ofstrict banking norms and poor fiscalcondition in recent years. The informalcredit sources charge very high ratesof interest. In India it has beenobserved that with the decline informal rural credit system, and with
continued decline in internationalcommodity prices, the proportion oflandless rural households has increasedsignificantly in the last few years.
5. During a transition from a protectedregime to a free trade regime, therewill always be gainers and losersdepending on the internationalcompetitiveness of the crops. In anygiven country, the gains will accrue tothe farmers producing crops which areinternationally competitive. On theother hand, trade liberalisation cancreate problems for producers of non-competitive crops. Therefore, in theevent of opening up, there would bean intra-sectoral redistribution ofdemand for agricultural workers. Insuch a scenario, the net effect onemployment is at best uncertain.
6. According to the AoA stipulation,agricultural subsidies in developedcountries were to be reduced by 36 percent during the implementation period.In fact, in most of the OECD countries,subsidisation of the agricultural sectorhas increased in the post-WTO period.Also there are no signs of eliminationof these distortions. Table 4.3 showsthat subsidies (Total Support Estimateor TSE) given by the OECD to theiragricultural sector in 1999-2001 hasincreased by about nine per cent from1986-88 level. This has been achievedthrough shifting of subsidies from theprohibitive Amber Box to thepermissive categories of Blue and Green
Table 4.2 Employment and output growth rate in agricultural sector inSouth Asia, 1990-2000
Employment growth Output growth Employment elasticityto output growth
Bangladesh 0.60 2.90 0.21India 0.05 3.10 0.02Maldives 1.00 … …Nepal -0.50 2.50 -2.19Pakistan 1.60 4.40 0.36Sri Lanka -1.80 1.90 -0.94
Note: Data for growth rate of agricultural output for Pakistan and employment elasticity given hereare somewhat different from those given in Chapter 3, table 3.8. The difference is due todifferent time periods used in calculating the numbers.
Source: ILO 2003a.
In most of theOECD countries,subsidisation of theagricultural sectorhas increased in thepost-WTO period
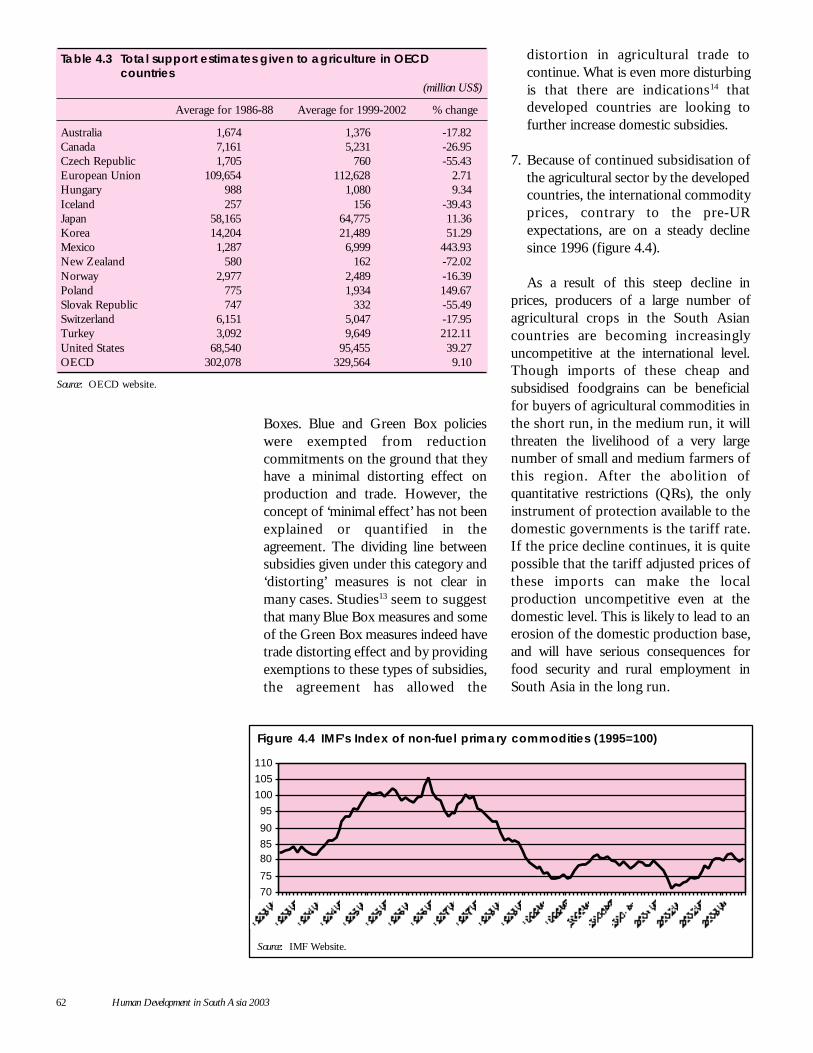
62 Human Development in South Asia 2003
Boxes. Blue and Green Box policieswere exempted from reductioncommitments on the ground that theyhave a minimal distorting effect onproduction and trade. However, theconcept of ‘minimal effect’ has not beenexplained or quantified in theagreement. The dividing line betweensubsidies given under this category and‘distorting’ measures is not clear inmany cases. Studies13 seem to suggestthat many Blue Box measures and someof the Green Box measures indeed havetrade distorting effect and by providingexemptions to these types of subsidies,the agreement has allowed the
distortion in agricultural trade tocontinue. What is even more disturbingis that there are indications14 thatdeveloped countries are looking tofurther increase domestic subsidies.
7. Because of continued subsidisation ofthe agricultural sector by the developedcountries, the international commodityprices, contrary to the pre-URexpectations, are on a steady declinesince 1996 (figure 4.4).
As a result of this steep decline inprices, producers of a large number ofagricultural crops in the South Asiancountries are becoming increasinglyuncompetitive at the international level.Though imports of these cheap andsubsidised foodgrains can be beneficialfor buyers of agricultural commodities inthe short run, in the medium run, it willthreaten the livelihood of a very largenumber of small and medium farmers ofthis region. After the abolition ofquantitative restrictions (QRs), the onlyinstrument of protection available to thedomestic governments is the tariff rate.If the price decline continues, it is quitepossible that the tariff adjusted prices ofthese imports can make the localproduction uncompetitive even at thedomestic level. This is likely to lead to anerosion of the domestic production base,and will have serious consequences forfood security and rural employment inSouth Asia in the long run.
Table 4.3 Total support estimates given to agriculture in OECDcountries
(million US$)
Average for 1986-88 Average for 1999-2002 % change
Australia 1,674 1,376 -17.82Canada 7,161 5,231 -26.95Czech Republic 1,705 760 -55.43European Union 109,654 112,628 2.71Hungary 988 1,080 9.34Iceland 257 156 -39.43Japan 58,165 64,775 11.36Korea 14,204 21,489 51.29Mexico 1,287 6,999 443.93New Zealand 580 162 -72.02Norway 2,977 2,489 -16.39Poland 775 1,934 149.67Slovak Republic 747 332 -55.49Switzerland 6,151 5,047 -17.95Turkey 3,092 9,649 212.11United States 68,540 95,455 39.27OECD 302,078 329,564 9.10
Source: OECD website.
70
75
8085
90
95
100
105
110
Figure 4.4 IMF’s Index of non-fuel primary commodities (1995=100)
Source: IMF Website.
WTO Rules and Employment in South Asia 63
It can be argued that in a free traderegime, producers of uncompetitivecommodities should shift to thecommodities in which the country isinternationally competitive. Under thecurrent set of circumstances, this basicallysuggests that farmers of South Asiashould diversify towards the cultivationof cash crops. However, this argumentdoes not take into account the fact thatfor small and medium farmers of poordeveloping countries, it is not easy to shiftfrom one crop to another. Low capital,inadequate rural credit and lack ofinformation about the internationalcommodity market conditions make itdifficult for the farmers to make thistransition. Also it is important torecognise that diversification is cruciallydependent on food security. Unless abasic cushion of food security is assured,it will be extremely risky for small andmedium farmers to diversify into non-foodgrain crops.
Furthermore, as export competitive-ness of agricultural commodities is aderivative of the complex interaction ofdomestic supply parameters, policyregime and external market conditions, itis subject to frequent changes. Coupledwith this, the volatility of commodityprices in the international market can shiftthe export competitiveness of a productin a very unpredictable manner. Givenless than perfect transmission ofinformation to farmers in a developingcountry, this makes it extremely difficultfor farmers to plan their output both fordomestic as well as international markets.For a number of crops, price volatilityhas actually increased in the post-URperiod.
Most of the pre-UR projectionsestimated large gains for developingcountries from agricultural tradeliberalisation because it was assumed thatmarket access in developed countries foragricultural goods would increasesubstantially in the post-UR period.However, data show that in reality,agricultural trade is still highly protected.A study15 reports that the world average
of agricultural tariffs is as high as 62 percent. Also there are problems of tariffpeaks and tariff escalations. As a result,in the post-Uruguay Round period,agricultural exports from developingcountries showed only sluggish growthrates. In fact, a WTO secretariat paperpublished in 2000,16 shows that theaverage annual growth of the value ofagricultural exports of Developing Asiahas declined from 8.2 per cent during1990-94 to 0.5 per cent for the period1994-98. Lack of market access foragricultural goods in developed countriesis said to be the reason behind this poorperformance.
Also, taking advantage of the WTOagreement on Sanitary and PhytosanitaryMeasures (SPS), developed countries areoften imposing irrationally high foodstandards. There have also been instanceswhere the SPS standards are made stricterwithout giving proper scientific reasoning.These are acting as non-tariff barriers forexporters from developing countries asthey are finding it increasingly difficult tomatch the high SPS standards adopted bythe developed countries. Marine products,fishery products, peanuts and teaexporters of South Asia have facedconsiderable market access barriers indeveloped countries.
To sum up, it can be said that theinitial expectation that AoA would inducehigher production of agricultural goodsin developing countries and thereby,would promote rural development andemployment, has not materialised inpractice. On the other hand, a shift to atariff only regime and opening up of theagricultural sector has made the small andmedium farmers of South Asia vulnerableto external shocks. However, investmentin rural infrastructure is labour intensivein nature, and WTO imposes no ceilingson expenditures incurred by governmentstowards building or improving ruralinfrastructure as these come under the‘Green Box’ category of subsidies in AoA.Increased expenditure on ruralinfrastructure can not only boost ruralemployment in the short run, but it also
The initialexpectation thatAoA would inducehigher production ofagricultural goods indeveloping countriesand, thereby, wouldpromote ruraldevelopment andemployment, has notmaterialised inpractice
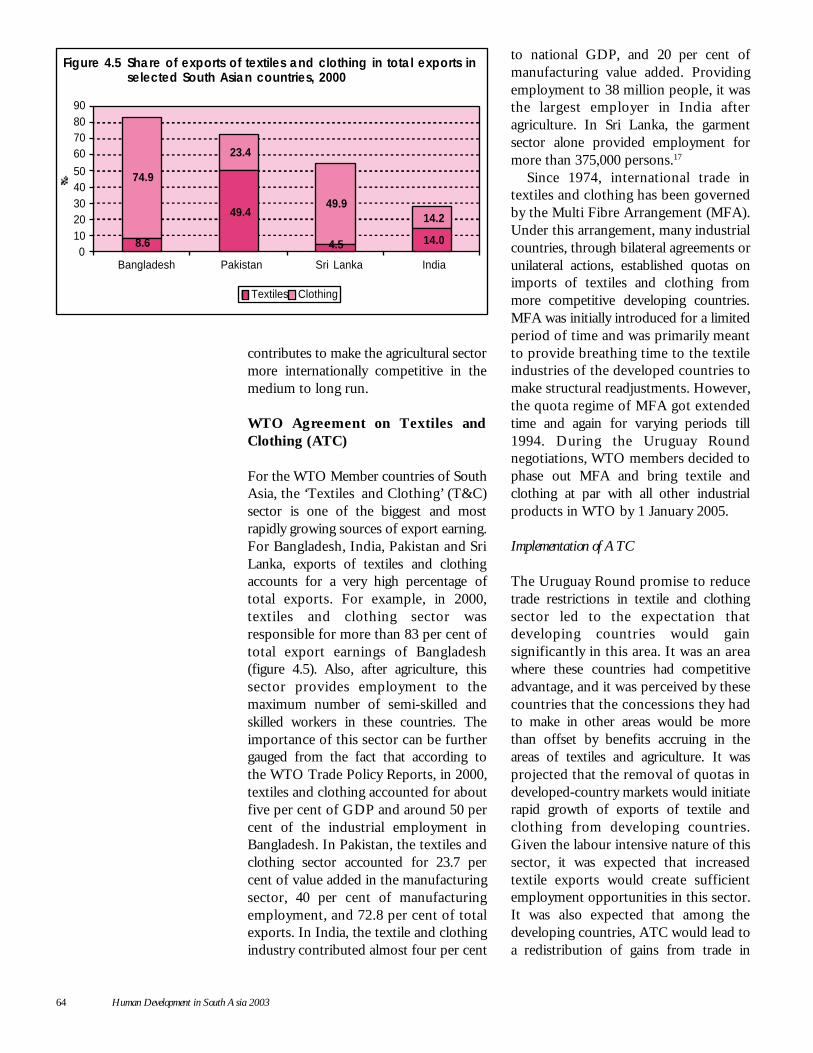
64 Human Development in South Asia 2003
contributes to make the agricultural sectormore internationally competitive in themedium to long run.
WTO Agreement on Textiles andClothing (ATC)
For the WTO Member countries of SouthAsia, the ‘Textiles and Clothing’ (T&C)sector is one of the biggest and mostrapidly growing sources of export earning.For Bangladesh, India, Pakistan and SriLanka, exports of textiles and clothingaccounts for a very high percentage oftotal exports. For example, in 2000,textiles and clothing sector wasresponsible for more than 83 per cent oftotal export earnings of Bangladesh(figure 4.5). Also, after agriculture, thissector provides employment to themaximum number of semi-skilled andskilled workers in these countries. Theimportance of this sector can be furthergauged from the fact that according tothe WTO Trade Policy Reports, in 2000,textiles and clothing accounted for aboutfive per cent of GDP and around 50 percent of the industrial employment inBangladesh. In Pakistan, the textiles andclothing sector accounted for 23.7 percent of value added in the manufacturingsector, 40 per cent of manufacturingemployment, and 72.8 per cent of totalexports. In India, the textile and clothingindustry contributed almost four per cent
to national GDP, and 20 per cent ofmanufacturing value added. Providingemployment to 38 million people, it wasthe largest employer in India afteragriculture. In Sri Lanka, the garmentsector alone provided employment formore than 375,000 persons.17
Since 1974, international trade intextiles and clothing has been governedby the Multi Fibre Arrangement (MFA).Under this arrangement, many industrialcountries, through bilateral agreements orunilateral actions, established quotas onimports of textiles and clothing frommore competitive developing countries.MFA was initially introduced for a limitedperiod of time and was primarily meantto provide breathing time to the textileindustries of the developed countries tomake structural readjustments. However,the quota regime of MFA got extendedtime and again for varying periods till1994. During the Uruguay Roundnegotiations, WTO members decided tophase out MFA and bring textile andclothing at par with all other industrialproducts in WTO by 1 January 2005.
Implementation of ATC
The Uruguay Round promise to reducetrade restrictions in textile and clothingsector led to the expectation thatdeveloping countries would gainsignificantly in this area. It was an areawhere these countries had competitiveadvantage, and it was perceived by thesecountries that the concessions they hadto make in other areas would be morethan offset by benefits accruing in theareas of textiles and agriculture. It wasprojected that the removal of quotas indeveloped-country markets would initiaterapid growth of exports of textile andclothing from developing countries.Given the labour intensive nature of thissector, it was expected that increasedtextile exports would create sufficientemployment opportunities in this sector.It was also expected that among thedeveloping countries, ATC would lead toa redistribution of gains from trade in
Figure 4.5 Share of exports of textiles and clothing in total exports inselected South Asian countries, 2000
74.9
8.6
23.4
49.449.9
4.5
14.2
14.0
90807060
50403020100
Bangladesh Pakistan Sri Lanka India
Textiles Clothing
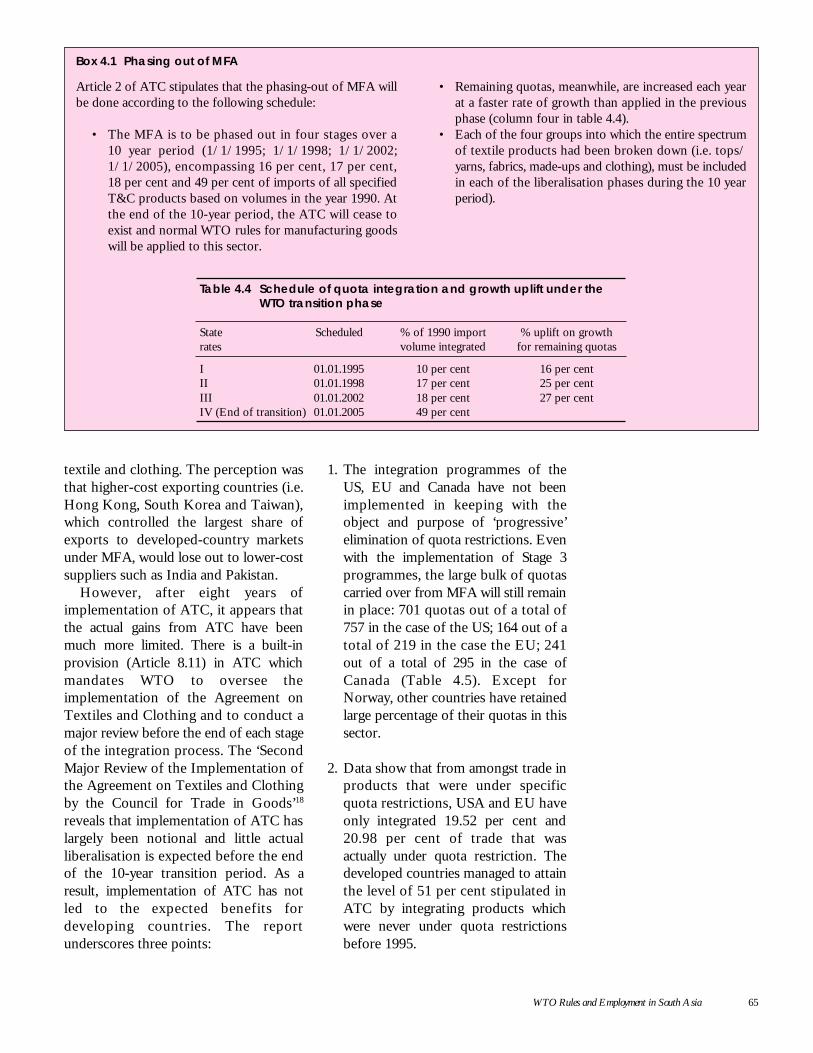
WTO Rules and Employment in South Asia 65
textile and clothing. The perception wasthat higher-cost exporting countries (i.e.Hong Kong, South Korea and Taiwan),which controlled the largest share ofexports to developed-country marketsunder MFA, would lose out to lower-costsuppliers such as India and Pakistan.
However, after eight years ofimplementation of ATC, it appears thatthe actual gains from ATC have beenmuch more limited. There is a built-inprovision (Article 8.11) in ATC whichmandates WTO to oversee theimplementation of the Agreement onTextiles and Clothing and to conduct amajor review before the end of each stageof the integration process. The ‘SecondMajor Review of the Implementation ofthe Agreement on Textiles and Clothingby the Council for Trade in Goods’18
reveals that implementation of ATC haslargely been notional and little actualliberalisation is expected before the endof the 10-year transition period. As aresult, implementation of ATC has notled to the expected benefits fordeveloping countries. The reportunderscores three points:
1. The integration programmes of theUS, EU and Canada have not beenimplemented in keeping with theobject and purpose of ‘progressive’elimination of quota restrictions. Evenwith the implementation of Stage 3programmes, the large bulk of quotascarried over from MFA will still remainin place: 701 quotas out of a total of757 in the case of the US; 164 out of atotal of 219 in the case the EU; 241out of a total of 295 in the case ofCanada (Table 4.5). Except forNorway, other countries have retainedlarge percentage of their quotas in thissector.
2. Data show that from amongst trade inproducts that were under specificquota restrictions, USA and EU haveonly integrated 19.52 per cent and20.98 per cent of trade that wasactually under quota restriction. Thedeveloped countries managed to attainthe level of 51 per cent stipulated inATC by integrating products whichwere never under quota restrictionsbefore 1995.
Article 2 of ATC stipulates that the phasing-out of MFA willbe done according to the following schedule:
• The MFA is to be phased out in four stages over a10 year period (1/1/1995; 1/1/1998; 1/1/2002;1/1/2005), encompassing 16 per cent, 17 per cent,18 per cent and 49 per cent of imports of all specifiedT&C products based on volumes in the year 1990. Atthe end of the 10-year period, the ATC will cease toexist and normal WTO rules for manufacturing goodswill be applied to this sector.
Box 4.1 Phasing out of MFA
• Remaining quotas, meanwhile, are increased each yearat a faster rate of growth than applied in the previousphase (column four in table 4.4).
• Each of the four groups into which the entire spectrumof textile products had been broken down (i.e. tops/yarns, fabrics, made-ups and clothing), must be includedin each of the liberalisation phases during the 10 yearperiod).
Table 4.4 Schedule of quota integration and growth uplift under theWTO transition phase
State Scheduled % of 1990 import % uplift on growthrates volume integrated for remaining quotas
I 01.01.1995 10 per cent 16 per centII 01.01.1998 17 per cent 25 per centIII 01.01.2002 18 per cent 27 per centIV (End of transition) 01.01.2005 49 per cent
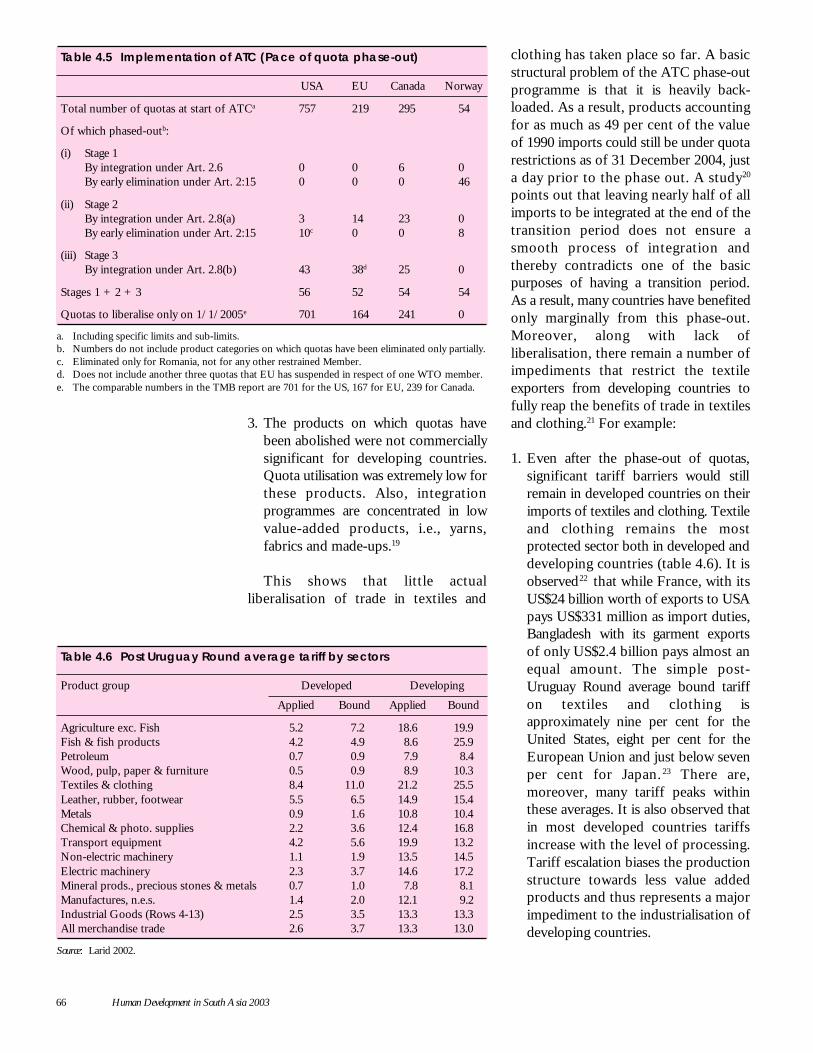
66 Human Development in South Asia 2003
3. The products on which quotas havebeen abolished were not commerciallysignificant for developing countries.Quota utilisation was extremely low forthese products. Also, integrationprogrammes are concentrated in lowvalue-added products, i.e., yarns,fabrics and made-ups.19
This shows that little actualliberalisation of trade in textiles and
clothing has taken place so far. A basicstructural problem of the ATC phase-outprogramme is that it is heavily back-loaded. As a result, products accountingfor as much as 49 per cent of the valueof 1990 imports could still be under quotarestrictions as of 31 December 2004, justa day prior to the phase out. A study20
points out that leaving nearly half of allimports to be integrated at the end of thetransition period does not ensure asmooth process of integration andthereby contradicts one of the basicpurposes of having a transition period.As a result, many countries have benefitedonly marginally from this phase-out.Moreover, along with lack ofliberalisation, there remain a number ofimpediments that restrict the textileexporters from developing countries tofully reap the benefits of trade in textilesand clothing.21 For example:
1. Even after the phase-out of quotas,significant tariff barriers would stillremain in developed countries on theirimports of textiles and clothing. Textileand clothing remains the mostprotected sector both in developed anddeveloping countries (table 4.6). It isobserved22 that while France, with itsUS$24 billion worth of exports to USApays US$331 million as import duties,Bangladesh with its garment exportsof only US$2.4 billion pays almost anequal amount. The simple post-Uruguay Round average bound tariffon textiles and clothing isapproximately nine per cent for theUnited States, eight per cent for theEuropean Union and just below sevenper cent for Japan. 23 There are,moreover, many tariff peaks withinthese averages. It is also observed thatin most developed countries tariffsincrease with the level of processing.Tariff escalation biases the productionstructure towards less value addedproducts and thus represents a majorimpediment to the industrialisation ofdeveloping countries.
Table 4.5 Implementation of ATC (Pace of quota phase-out)
USA EU Canada Norway
Total number of quotas at start of ATCa 757 219 295 54
Of which phased-outb:
(i) Stage 1By integration under Art. 2.6 0 0 6 0By early elimination under Art. 2:15 0 0 0 46
(ii) Stage 2By integration under Art. 2.8(a) 3 14 23 0By early elimination under Art. 2:15 10c 0 0 8
(iii) Stage 3By integration under Art. 2.8(b) 43 38d 25 0
Stages 1 + 2 + 3 56 52 54 54
Quotas to liberalise only on 1/1/2005e 701 164 241 0
a. Including specific limits and sub-limits.b. Numbers do not include product categories on which quotas have been eliminated only partially.c. Eliminated only for Romania, not for any other restrained Member.d. Does not include another three quotas that EU has suspended in respect of one WTO member.e. The comparable numbers in the TMB report are 701 for the US, 167 for EU, 239 for Canada.
Table 4.6 Post Uruguay Round average tariff by sectors
Product group Developed Developing
Applied Bound Applied Bound
Agriculture exc. Fish 5.2 7.2 18.6 19.9Fish & fish products 4.2 4.9 8.6 25.9Petroleum 0.7 0.9 7.9 8.4Wood, pulp, paper & furniture 0.5 0.9 8.9 10.3Textiles & clothing 8.4 11.0 21.2 25.5Leather, rubber, footwear 5.5 6.5 14.9 15.4Metals 0.9 1.6 10.8 10.4Chemical & photo. supplies 2.2 3.6 12.4 16.8Transport equipment 4.2 5.6 19.9 13.2Non-electric machinery 1.1 1.9 13.5 14.5Electric machinery 2.3 3.7 14.6 17.2Mineral prods., precious stones & metals 0.7 1.0 7.8 8.1Manufactures, n.e.s. 1.4 2.0 12.1 9.2Industrial Goods (Rows 4-13) 2.5 3.5 13.3 13.3All merchandise trade 2.6 3.7 13.3 13.0
Source: Larid 2002.
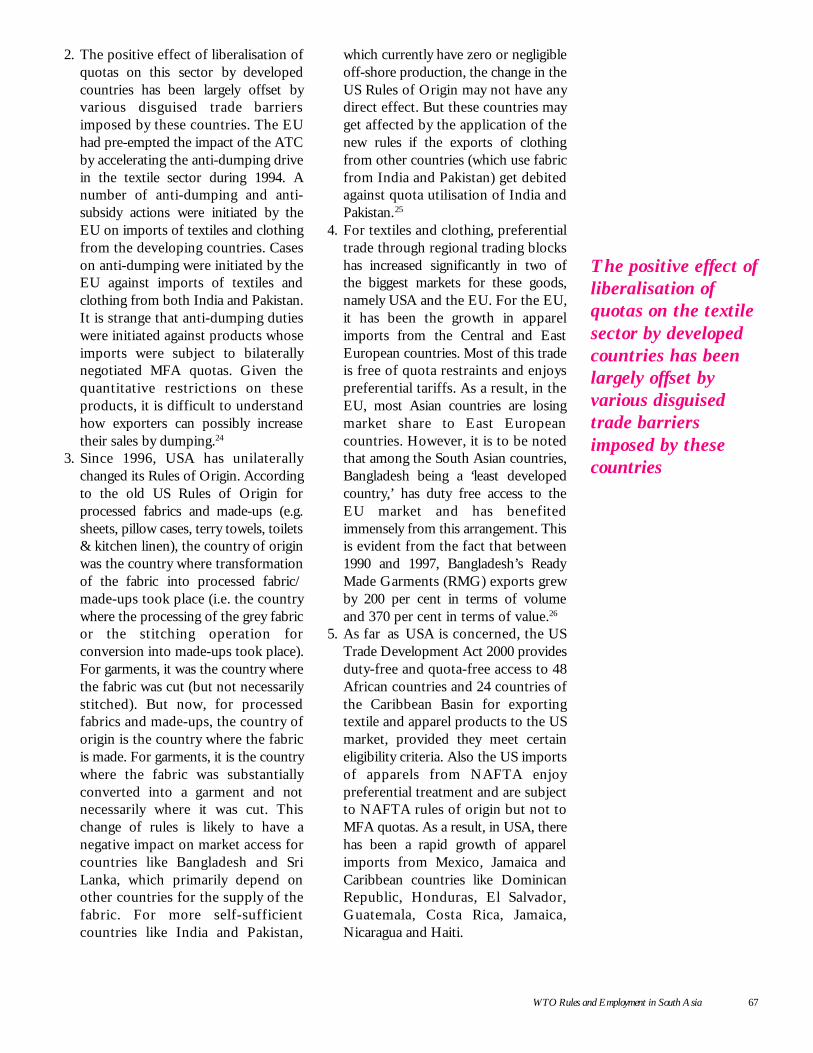
WTO Rules and Employment in South Asia 67
2. The positive effect of liberalisation ofquotas on this sector by developedcountries has been largely offset byvarious disguised trade barriersimposed by these countries. The EUhad pre-empted the impact of the ATCby accelerating the anti-dumping drivein the textile sector during 1994. Anumber of anti-dumping and anti-subsidy actions were initiated by theEU on imports of textiles and clothingfrom the developing countries. Caseson anti-dumping were initiated by theEU against imports of textiles andclothing from both India and Pakistan.It is strange that anti-dumping dutieswere initiated against products whoseimports were subject to bilaterallynegotiated MFA quotas. Given thequantitative restrictions on theseproducts, it is difficult to understandhow exporters can possibly increasetheir sales by dumping.24
3. Since 1996, USA has unilaterallychanged its Rules of Origin. Accordingto the old US Rules of Origin forprocessed fabrics and made-ups (e.g.sheets, pillow cases, terry towels, toilets& kitchen linen), the country of originwas the country where transformationof the fabric into processed fabric/made-ups took place (i.e. the countrywhere the processing of the grey fabricor the stitching operation forconversion into made-ups took place).For garments, it was the country wherethe fabric was cut (but not necessarilystitched). But now, for processedfabrics and made-ups, the country oforigin is the country where the fabricis made. For garments, it is the countrywhere the fabric was substantiallyconverted into a garment and notnecessarily where it was cut. Thischange of rules is likely to have anegative impact on market access forcountries like Bangladesh and SriLanka, which primarily depend onother countries for the supply of thefabric. For more self-sufficientcountries like India and Pakistan,
which currently have zero or negligibleoff-shore production, the change in theUS Rules of Origin may not have anydirect effect. But these countries mayget affected by the application of thenew rules if the exports of clothingfrom other countries (which use fabricfrom India and Pakistan) get debitedagainst quota utilisation of India andPakistan.25
4. For textiles and clothing, preferentialtrade through regional trading blockshas increased significantly in two ofthe biggest markets for these goods,namely USA and the EU. For the EU,it has been the growth in apparelimports from the Central and EastEuropean countries. Most of this tradeis free of quota restraints and enjoyspreferential tariffs. As a result, in theEU, most Asian countries are losingmarket share to East Europeancountries. However, it is to be notedthat among the South Asian countries,Bangladesh being a ‘least developedcountry,’ has duty free access to theEU market and has benefitedimmensely from this arrangement. Thisis evident from the fact that between1990 and 1997, Bangladesh’s ReadyMade Garments (RMG) exports grewby 200 per cent in terms of volumeand 370 per cent in terms of value.26
5. As far as USA is concerned, the USTrade Development Act 2000 providesduty-free and quota-free access to 48African countries and 24 countries ofthe Caribbean Basin for exportingtextile and apparel products to the USmarket, provided they meet certaineligibility criteria. Also the US importsof apparels from NAFTA enjoypreferential treatment and are subjectto NAFTA rules of origin but not toMFA quotas. As a result, in USA, therehas been a rapid growth of apparelimports from Mexico, Jamaica andCaribbean countries like DominicanRepublic, Honduras, El Salvador,Guatemala, Costa Rica, Jamaica,Nicaragua and Haiti.
The positive effect ofliberalisation ofquotas on the textilesector by developedcountries has beenlargely offset byvarious disguisedtrade barriersimposed by thesecountries
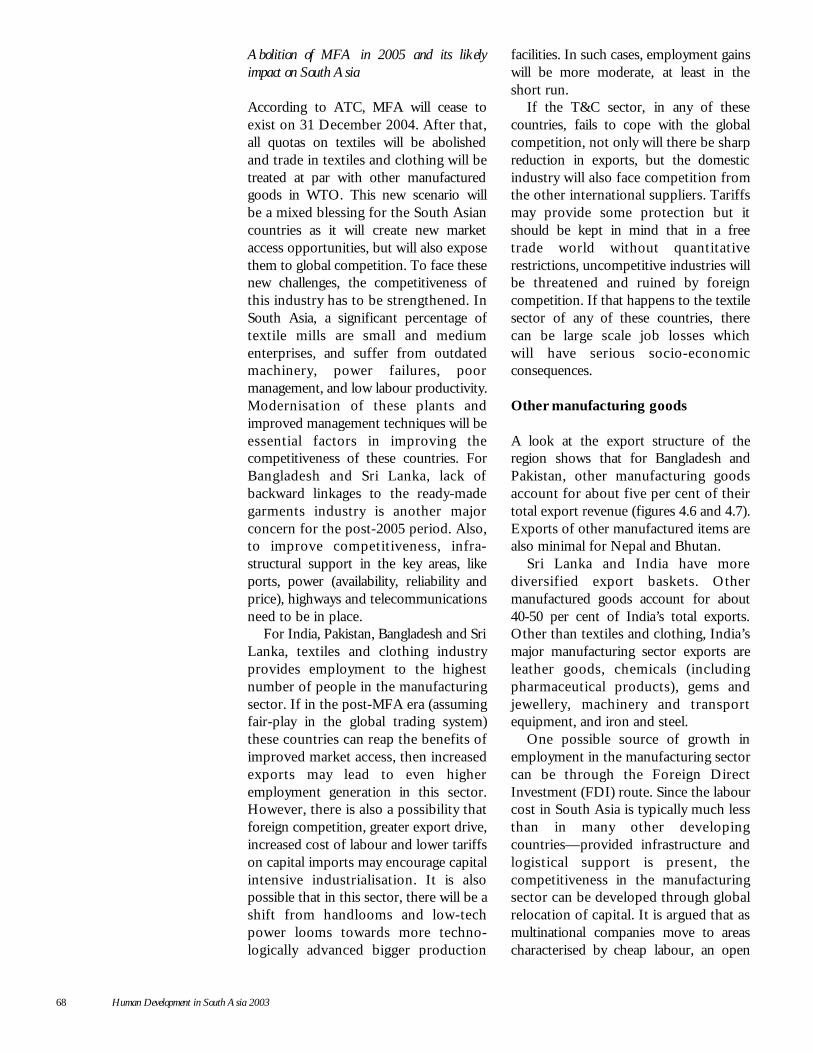
68 Human Development in South Asia 2003
Abolition of MFA in 2005 and its likelyimpact on South Asia
According to ATC, MFA will cease toexist on 31 December 2004. After that,all quotas on textiles will be abolishedand trade in textiles and clothing will betreated at par with other manufacturedgoods in WTO. This new scenario willbe a mixed blessing for the South Asiancountries as it will create new marketaccess opportunities, but will also exposethem to global competition. To face thesenew challenges, the competitiveness ofthis industry has to be strengthened. InSouth Asia, a significant percentage oftextile mills are small and mediumenterprises, and suffer from outdatedmachinery, power failures, poormanagement, and low labour productivity.Modernisation of these plants andimproved management techniques will beessential factors in improving thecompetitiveness of these countries. ForBangladesh and Sri Lanka, lack ofbackward linkages to the ready-madegarments industry is another majorconcern for the post-2005 period. Also,to improve competitiveness, infra-structural support in the key areas, likeports, power (availability, reliability andprice), highways and telecommunicationsneed to be in place.
For India, Pakistan, Bangladesh and SriLanka, textiles and clothing industryprovides employment to the highestnumber of people in the manufacturingsector. If in the post-MFA era (assumingfair-play in the global trading system)these countries can reap the benefits ofimproved market access, then increasedexports may lead to even higheremployment generation in this sector.However, there is also a possibility thatforeign competition, greater export drive,increased cost of labour and lower tariffson capital imports may encourage capitalintensive industrialisation. It is alsopossible that in this sector, there will be ashift from handlooms and low-techpower looms towards more techno-logically advanced bigger production
facilities. In such cases, employment gainswill be more moderate, at least in theshort run.
If the T&C sector, in any of thesecountries, fails to cope with the globalcompetition, not only will there be sharpreduction in exports, but the domesticindustry will also face competition fromthe other international suppliers. Tariffsmay provide some protection but itshould be kept in mind that in a freetrade world without quantitativerestrictions, uncompetitive industries willbe threatened and ruined by foreigncompetition. If that happens to the textilesector of any of these countries, therecan be large scale job losses whichwill have serious socio-economicconsequences.
Other manufacturing goods
A look at the export structure of theregion shows that for Bangladesh andPakistan, other manufacturing goodsaccount for about five per cent of theirtotal export revenue (figures 4.6 and 4.7).Exports of other manufactured items arealso minimal for Nepal and Bhutan.
Sri Lanka and India have morediversified export baskets. Othermanufactured goods account for about40-50 per cent of India’s total exports.Other than textiles and clothing, India’smajor manufacturing sector exports areleather goods, chemicals (includingpharmaceutical products), gems andjewellery, machinery and transportequipment, and iron and steel.
One possible source of growth inemployment in the manufacturing sectorcan be through the Foreign DirectInvestment (FDI) route. Since the labourcost in South Asia is typically much lessthan in many other developingcountries—provided infrastructure andlogistical support is present, thecompetitiveness in the manufacturingsector can be developed through globalrelocation of capital. It is argued that asmultinational companies move to areascharacterised by cheap labour, an open
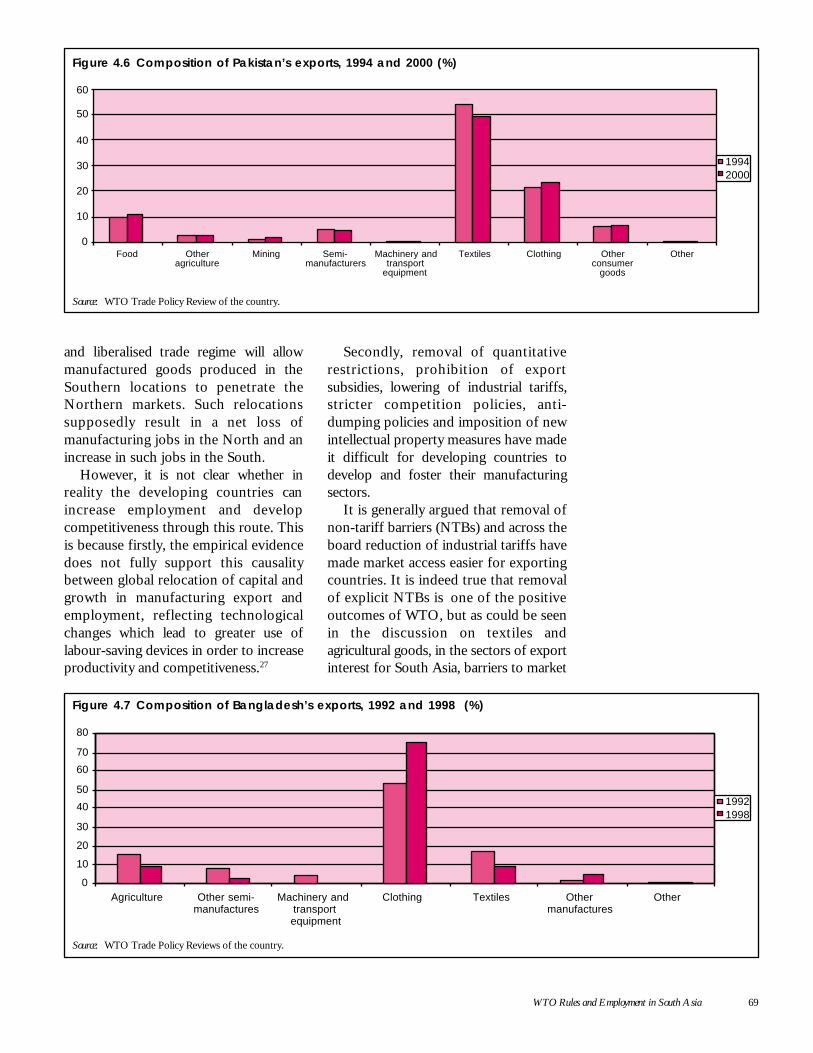
WTO Rules and Employment in South Asia 69
and liberalised trade regime will allowmanufactured goods produced in theSouthern locations to penetrate theNorthern markets. Such relocationssupposedly result in a net loss ofmanufacturing jobs in the North and anincrease in such jobs in the South.
However, it is not clear whether inreality the developing countries canincrease employment and developcompetitiveness through this route. Thisis because firstly, the empirical evidencedoes not fully support this causalitybetween global relocation of capital andgrowth in manufacturing export andemployment, reflecting technologicalchanges which lead to greater use oflabour-saving devices in order to increaseproductivity and competitiveness.27
Secondly, removal of quantitativerestrictions, prohibition of exportsubsidies, lowering of industrial tariffs,stricter competition policies, anti-dumping policies and imposition of newintellectual property measures have madeit difficult for developing countries todevelop and foster their manufacturingsectors.
It is generally argued that removal ofnon-tariff barriers (NTBs) and across theboard reduction of industrial tariffs havemade market access easier for exportingcountries. It is indeed true that removalof explicit NTBs is one of the positiveoutcomes of WTO, but as could be seenin the discussion on textiles andagricultural goods, in the sectors of exportinterest for South Asia, barriers to market
Figure 4.6 Composition of Pakistan’s exports, 1994 and 2000 (%)
Source: WTO Trade Policy Review of the country.
Food Otheragriculture
Mining Semi-manufacturers
Machinery andtransport
equipment
Textiles Clothing Otherconsumer
goods
Other0
10
20
30
40
50
60
19942000
Figure 4.7 Composition of Bangladesh’s exports, 1992 and 1998 (%)
Source: WTO Trade Policy Reviews of the country.
0
10
20
30
40
50
60
70
80
Agriculture Other semi-manufactures
Machinery andtransportequipment
Clothing Textiles Othermanufactures
Other
19921998
70 Human Development in South Asia 2003
access are still present in various guises.As far as other industrial goods areconcerned, empirical studies haverevealed that tariffs are much higher insectors where developing countries haveexport interest. Currently,the mostprotected manufacturing sectors ininternational trade are:
1) fish and fish products2) leather, rubber, footwear and travel
goods3) textiles and clothing and4) transport equipment.
It is no coincidence that the developingcountries have more export interest inthese sectors than other manufacturinggoods.28
Also, the low average tariff rate hidesboth the problems of tariff escalation andtariff peaks. A special study by the WTOreveals that in most industrialisedcountries, including USA and Canada, thelargest share of peaks can be found intextiles and clothing, leather and, to alesser extent, in transport equipmentcategories. The European Union andNorway are exceptions, with no tariffpeaks in the textile and clothing sector,but a high concentration of peaks in thefish and fish products category.
Similarly, tariff escalation is also foundto occur in sectors where the developingcountries have export interest. Tariffescalation refers to a situation in whichtariff rates increase with the level ofprocessing. The problems of tariffescalation for developing countries havebeen explained well in a submission tothe WTO by a group of developingcountries:
‘Tariff escalation prohibits diversification, whichis very important for developing countries’economies, particularly as most of the value addedis created at the latter stages of production.Unfortunately, to date, due to the tariff structuresin OECD countries, the value-added fromprocessing is largely captured by the developedcountries. ’29
The Article 27.2 of the Subsidies andCountervailing Measures (SCM)Agreement exempts least developedcountries and certain developingcountries with per-capita income of lessthan US$1000 from the prohibition ofexport subsidies. All the WTO Membercountries of South Asia are covered bythis article. Therefore, WTO rules do notprevent these countries to subsidise theirnon-agricultural exports. However, theSCM agreement imposes two restrictionson the use of export subsidies by thesecountries. If a country reaches ‘exportcompetitiveness’ in a certain product, theSCM agreement requires that the exportsubsidy on that product should be phasedout over a period of eight years. Exportcompetitiveness in a product exists if adeveloping country member’s exports ofthat product have reached a share of atleast 3.25 per cent in world trade of thatproduct for two consecutive calendaryears.
The second category of prohibitedsubsidy for developing countries is thatof import substitution or local contentsubsidy. This subsidy did not apply todeveloping country members for a periodof 5-years ending on 31 December 1999.For the least developing countrymembers, the exemption period is 8 years.
It should, however, be emphasised thateven if the WTO SCM Agreement allowsdeveloping countries to have exportsubsidies, this does not make thesecountries immune from the counter-vailing duties (CVD). If the conditionsfor imposing CVD on certain productsare met, the other member countries canimpose CVD on those subsidised importsfrom the developing countries mentionedin Article 27.2.
As most of the South Asian countrieshave extremely low level ofmanufacturing exports, subsidisation ofmanufacturing industries to promoteexports, growth and employment can bea possible strategy for these countries.The WTO rules do not impose muchrestriction on these countries regarding
Tariffs are muchhigher in sectorswhere developingcountries haveexport interest
WTO Rules and Employment in South Asia 71
export subsidies of non-agriculturalgoods. However, the fiscal compulsionsof these countries impose severeconstraints on the governments’ abilitiesto promote an industry through highexport subsidies. This limitation and theextent of uncompetitiveness of themanufacturing sector in the South Asiancountries implies that it will be difficultfor the governments of these countriesto take advantage of this WTO clause anduse export subsidies to promotemanufacturing export growth.
Employment impact of ATC and other WTOrules on manufacturing goods
A significant portion of manufacturingoutput is produced in small and mediumscale enterprises (SMEs) in the informalor semi-formal sectors. These units aregenerally technologically backward, workwith very little capital and arecharacterised by extremely low labour andfactor productivity. Being small units,they also lack the advantages of scaleeconomies. Until recently, these unitswere given protection from foreigncompetition by an array of policyinstruments, including tariff and non-tariff barriers. 30 In a liberalisedenvironment, these firms will be thehardest hit as they will find it extremelydifficult to compete with imports fromforeign firms which are much moreefficient. Absence of any safeguardmechanisms and further reduction oftariff rates will only make the matterworse for these firms. As anoverwhelming majority of workers inSouth Asia are working in SMEs andinformal sectors,31 employment of a verylarge number of people will be threatenedif drastic tariff reductions in non-agricultural goods are carried out in thecurrent round of negotiations.
A study32 showing the effect of importliberalisation on domestic industry andemployment in India concludes:
‘Trade has over the years shrunk India’smanufacturing base, both in terms of value
addition and employment. There is a distinctirony here. Traditional classical theory argues infavour of free trade; yet, in the Indian case, itsrole has been more of deprivation than providinga stimulus to growth.’
Given the fact that India has a strongermanufacturing base than the other SouthAsian countries, it is only likely that freetrade and low tariff on manufacturinggoods will have an even more damagingeffect on its manufacturing base andemployment than in other South Asiancountries.
It is also unlikely that the large-scalemanufacturing sector in South Asia,which is in general much more capitalintensive than SMEs, will be able toabsorb the workers from informal andsemi-formal sectors. The large-scalesector in South Asia, which probably hasthe potential to fight foreign competition,at least in their domestic market, employsa very small percentage of manufacturingworkers. Large scale downsizing of publicsector enterprises in almost all the SouthAsian countries has further reduced theability of the formal sector to generateemployment. It will be extremely difficultfor this sector to generate enoughemployment for the displaced workers aswell as for millions of new workers whoenter the labour force every year. It isalso unlikely that growth in exports willgenerate sufficient employment as theexport sector is not well developed andtrade in manufacturers is extremelylimited in these countries. Therefore,given lower industrial tariffs and a freertrade regime, the prospect of higheremployment generation in themanufacturing sector seems unlikely inthe short to medium run in South Asia(box 4.2).
GATS and employment
Why GATS is important for South Asiancountries
The services sector is currently the mostdominant sector in most economies of
In a liberalisedenvironment,smaller firms will bethe hardest hit asthey will find itextremely difficult tocompete withimports from foreignfirms which aremuch more efficient
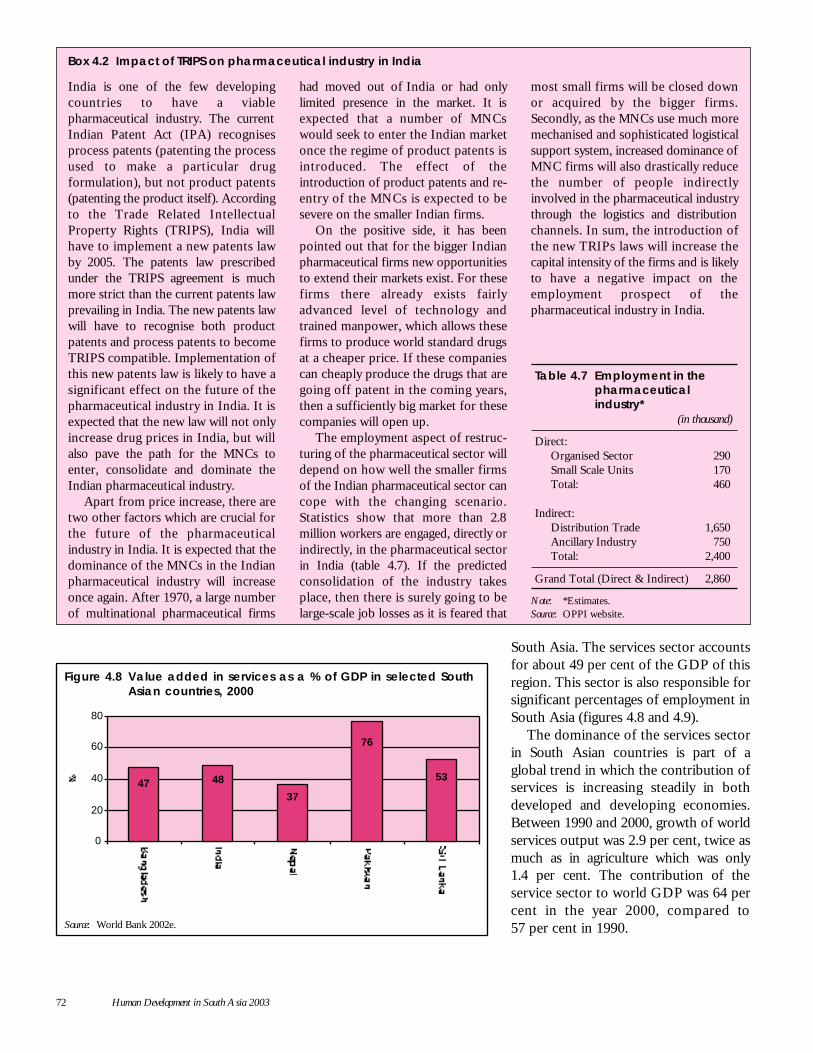
72 Human Development in South Asia 2003
South Asia. The services sector accountsfor about 49 per cent of the GDP of thisregion. This sector is also responsible forsignificant percentages of employment inSouth Asia (figures 4.8 and 4.9).
The dominance of the services sectorin South Asian countries is part of aglobal trend in which the contribution ofservices is increasing steadily in bothdeveloped and developing economies.Between 1990 and 2000, growth of worldservices output was 2.9 per cent, twice asmuch as in agriculture which was only1.4 per cent. The contribution of theservice sector to world GDP was 64 percent in the year 2000, compared to57 per cent in 1990.
India is one of the few developingcountries to have a viablepharmaceutical industry. The currentIndian Patent Act (IPA) recognisesprocess patents (patenting the processused to make a particular drugformulation), but not product patents(patenting the product itself). Accordingto the Trade Related IntellectualProperty Rights (TRIPS), India willhave to implement a new patents lawby 2005. The patents law prescribedunder the TRIPS agreement is muchmore strict than the current patents lawprevailing in India. The new patents lawwill have to recognise both productpatents and process patents to becomeTRIPS compatible. Implementation ofthis new patents law is likely to have asignificant effect on the future of thepharmaceutical industry in India. It isexpected that the new law will not onlyincrease drug prices in India, but willalso pave the path for the MNCs toenter, consolidate and dominate theIndian pharmaceutical industry.
Apart from price increase, there aretwo other factors which are crucial forthe future of the pharmaceuticalindustry in India. It is expected that thedominance of the MNCs in the Indianpharmaceutical industry will increaseonce again. After 1970, a large numberof multinational pharmaceutical firms
Box 4.2 Impact of TRIPS on pharmaceutical industry in India
had moved out of India or had onlylimited presence in the market. It isexpected that a number of MNCswould seek to enter the Indian marketonce the regime of product patents isintroduced. The effect of theintroduction of product patents and re-entry of the MNCs is expected to besevere on the smaller Indian firms.
On the positive side, it has beenpointed out that for the bigger Indianpharmaceutical firms new opportunitiesto extend their markets exist. For thesefirms there already exists fairlyadvanced level of technology andtrained manpower, which allows thesefirms to produce world standard drugsat a cheaper price. If these companiescan cheaply produce the drugs that aregoing off patent in the coming years,then a sufficiently big market for thesecompanies will open up.
The employment aspect of restruc-turing of the pharmaceutical sector willdepend on how well the smaller firmsof the Indian pharmaceutical sector cancope with the changing scenario.Statistics show that more than 2.8million workers are engaged, directly orindirectly, in the pharmaceutical sectorin India (table 4.7). If the predictedconsolidation of the industry takesplace, then there is surely going to belarge-scale job losses as it is feared that
most small firms will be closed downor acquired by the bigger firms.Secondly, as the MNCs use much moremechanised and sophisticated logisticalsupport system, increased dominance ofMNC firms will also drastically reducethe number of people indirectlyinvolved in the pharmaceutical industrythrough the logistics and distributionchannels. In sum, the introduction ofthe new TRIPs laws will increase thecapital intensity of the firms and is likelyto have a negative impact on theemployment prospect of thepharmaceutical industry in India.
Table 4.7 Employment in thepharmaceuticalindustry*
(in thousand)
Direct:Organised Sector 290Small Scale Units 170Total: 460
Indirect:Distribution Trade 1,650Ancillary Industry 750Total: 2,400
Grand Total (Direct & Indirect) 2,860
Note: *Estimates.Source: OPPI website.
Figure 4.8 Value added in services as a % of GDP in selected SouthAsian countries, 2000
Source: World Bank 2002e.
53
76
37
4847
0
20
40
60
80
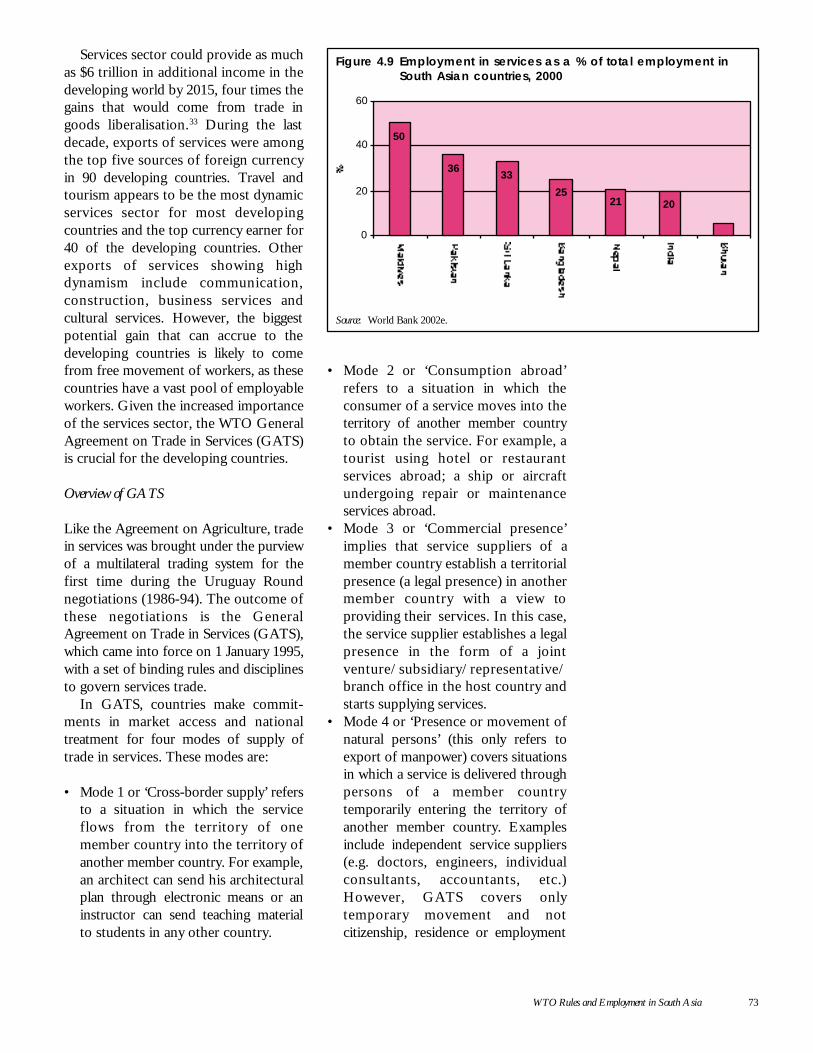
WTO Rules and Employment in South Asia 73
Services sector could provide as muchas $6 trillion in additional income in thedeveloping world by 2015, four times thegains that would come from trade ingoods liberalisation.33 During the lastdecade, exports of services were amongthe top five sources of foreign currencyin 90 developing countries. Travel andtourism appears to be the most dynamicservices sector for most developingcountries and the top currency earner for40 of the developing countries. Otherexports of services showing highdynamism include communication,construction, business services andcultural services. However, the biggestpotential gain that can accrue to thedeveloping countries is likely to comefrom free movement of workers, as thesecountries have a vast pool of employableworkers. Given the increased importanceof the services sector, the WTO GeneralAgreement on Trade in Services (GATS)is crucial for the developing countries.
Overview of GATS
Like the Agreement on Agriculture, tradein services was brought under the purviewof a multilateral trading system for thefirst time during the Uruguay Roundnegotiations (1986-94). The outcome ofthese negotiations is the GeneralAgreement on Trade in Services (GATS),which came into force on 1 January 1995,with a set of binding rules and disciplinesto govern services trade.
In GATS, countries make commit-ments in market access and nationaltreatment for four modes of supply oftrade in services. These modes are:
• Mode 1 or ‘Cross-border supply’ refersto a situation in which the serviceflows from the territory of onemember country into the territory ofanother member country. For example,an architect can send his architecturalplan through electronic means or aninstructor can send teaching materialto students in any other country.
• Mode 2 or ‘Consumption abroad’refers to a situation in which theconsumer of a service moves into theterritory of another member countryto obtain the service. For example, atourist using hotel or restaurantservices abroad; a ship or aircraftundergoing repair or maintenanceservices abroad.
• Mode 3 or ‘Commercial presence’implies that service suppliers of amember country establish a territorialpresence (a legal presence) in anothermember country with a view toproviding their services. In this case,the service supplier establishes a legalpresence in the form of a jointventure/subsidiary/representative/branch office in the host country andstarts supplying services.
• Mode 4 or ‘Presence or movement ofnatural persons’ (this only refers toexport of manpower) covers situationsin which a service is delivered throughpersons of a member countrytemporarily entering the territory ofanother member country. Examplesinclude independent service suppliers(e.g. doctors, engineers, individualconsultants, accountants, etc.)However, GATS covers onlytemporary movement and notcitizenship, residence or employment
0
20
40
60
50
3633
2521 20
Figure 4.9 Employment in services as a % of total employment inSouth Asian countries, 2000
Source: World Bank 2002e.
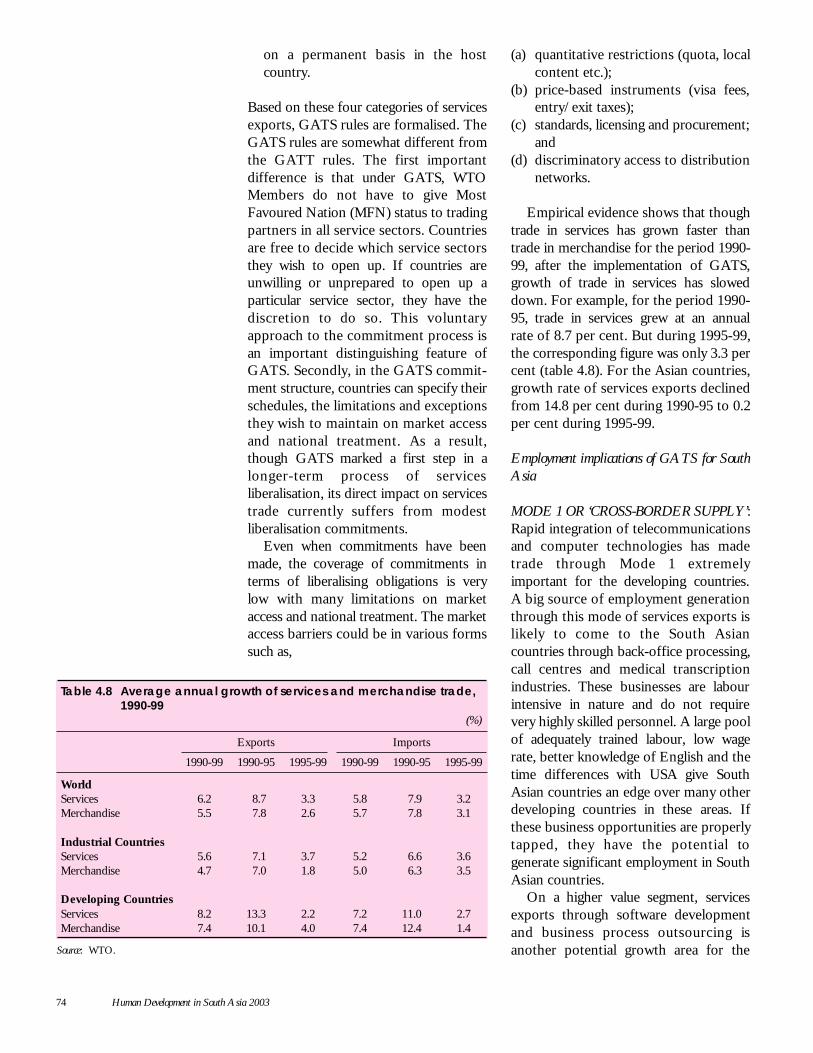
74 Human Development in South Asia 2003
on a permanent basis in the hostcountry.
Based on these four categories of servicesexports, GATS rules are formalised. TheGATS rules are somewhat different fromthe GATT rules. The first importantdifference is that under GATS, WTOMembers do not have to give MostFavoured Nation (MFN) status to tradingpartners in all service sectors. Countriesare free to decide which service sectorsthey wish to open up. If countries areunwilling or unprepared to open up aparticular service sector, they have thediscretion to do so. This voluntaryapproach to the commitment process isan important distinguishing feature ofGATS. Secondly, in the GATS commit-ment structure, countries can specify theirschedules, the limitations and exceptionsthey wish to maintain on market accessand national treatment. As a result,though GATS marked a first step in alonger-term process of servicesliberalisation, its direct impact on servicestrade currently suffers from modestliberalisation commitments.
Even when commitments have beenmade, the coverage of commitments interms of liberalising obligations is verylow with many limitations on marketaccess and national treatment. The marketaccess barriers could be in various formssuch as,
(a) quantitative restrictions (quota, localcontent etc.);
(b) price-based instruments (visa fees,entry/exit taxes);
(c) standards, licensing and procurement;and
(d) discriminatory access to distributionnetworks.
Empirical evidence shows that thoughtrade in services has grown faster thantrade in merchandise for the period 1990-99, after the implementation of GATS,growth of trade in services has sloweddown. For example, for the period 1990-95, trade in services grew at an annualrate of 8.7 per cent. But during 1995-99,the corresponding figure was only 3.3 percent (table 4.8). For the Asian countries,growth rate of services exports declinedfrom 14.8 per cent during 1990-95 to 0.2per cent during 1995-99.
Employment implications of GATS for SouthAsia
MODE 1 OR ‘CROSS-BORDER SUPPLY’:Rapid integration of telecommunicationsand computer technologies has madetrade through Mode 1 extremelyimportant for the developing countries.A big source of employment generationthrough this mode of services exports islikely to come to the South Asiancountries through back-office processing,call centres and medical transcriptionindustries. These businesses are labourintensive in nature and do not requirevery highly skilled personnel. A large poolof adequately trained labour, low wagerate, better knowledge of English and thetime differences with USA give SouthAsian countries an edge over many otherdeveloping countries in these areas. Ifthese business opportunities are properlytapped, they have the potential togenerate significant employment in SouthAsian countries.
On a higher value segment, servicesexports through software developmentand business process outsourcing isanother potential growth area for the
Table 4.8 Average annual growth of services and merchandise trade,1990-99
(%)
Exports Imports
1990-99 1990-95 1995-99 1990-99 1990-95 1995-99
WorldServices 6.2 8.7 3.3 5.8 7.9 3.2Merchandise 5.5 7.8 2.6 5.7 7.8 3.1
Industrial CountriesServices 5.6 7.1 3.7 5.2 6.6 3.6Merchandise 4.7 7.0 1.8 5.0 6.3 3.5
Developing CountriesServices 8.2 13.3 2.2 7.2 11.0 2.7Merchandise 7.4 10.1 4.0 7.4 12.4 1.4
Source: WTO.
WTO Rules and Employment in South Asia 75
economies of this region. The Indiansoftware industry has already gainedsubstantially, both in revenue andemployment terms, from these services.34
Given the similarities of cost structureamong the economies of South Asia, it islikely that the other South Asian countriescan replicate India’s success in this area.
Apart from the software andinformation technology related services,financial service providers are increasinglyusing Mode 1 for their business. Also,long distance consultancy services in legalservices, accounting, architecture andengineering are also possible through thischannel. Considerable employmentopportunities exist in these areas.However, export of these services facessignificant market access barriers as mostdeveloped countries do not recognise theprofessional qualifications acquired inthese fields in the developing countries.To improve export and employmentopportunities in these areas, it would benecessary to work for the establishmentand adoption of minimum internationalstandards and criteria for recognition.
MODE 2 OR ‘CONSUMPTIONABROAD’: For South Asian countries,Mode 2 services are extremely importantfor employment generation. Mode 2services cover tourism, transport, medicaland educational services. Among theseservices, tourism is an extremelyimportant source of exports of servicesfor all the South Asian countries.Particularly for countries like Maldivesand Nepal, tourism is the most importantsource of revenue. As a WTO SecretariatReport points out, Nepal and Maldiveshave one of the highest dependence ontourism in the world. Tourism is highlylabour intensive, and growth in this sectorwill definitely help to boost employmentin the South Asian countries.
MODE 3 OR ‘COMMERCIALPRESENCE’: Mode 3 refers to servicessold in the territory of a member byforeign entities that have established acommercial presence. Liberalisation ofthis sector has received maximumattention in GATS. From the definition,
it is easy to understand that this mode ofservices is analogous to Foreign DirectInvestment (FDI). According to WTOAnnual Reports, Mode 3 accounts forabout 40 per cent of the global annualstock of FDI, at about $30 billion, andfor 50 per cent of the world’s annual FDIflows, with the developed countries againaccounting for the majority of this FDI.Therefore, the advantages of this modeof services trade are similar to thoseassociated with FDI.
Increased commercial presencethrough Mode 3 can bring new capitalinto a country, which can generate newemployment possibilities, reducedependence on foreign exchange, increasecompetition, which can lead to efficiencygains. Dynamic innovation gains throughknowledge spillovers and transfer oftechnology can open up areas forpotential trade opportunities. It is alsoexpected to boost employment anddevelop human capital because foreignentrants will employ significant numbersof the local work force.
FDI, if properly regulated, can behelpful for the South Asian countries.Countries like Nepal and Bhutan, whichare now trying to get a membership inWTO, have extremely limited exportablesector. Unless these countries build upexport competitiveness in some areas,they will find it difficult to gain muchfrom WTO membership. Properidentification of the sectors of potentialcompetitiveness, and allowing FDI inthose areas can help these countries todevelop core competitiveness. Also, forcountries like Bangladesh, which have anextremely skewed export basket, FDI canbe used to diversify their export baskets.As most South Asian countries sufferfrom chronic capital shortage, foreigncapital inflow through Mode 3 can bringin much needed investible resources tothese countries.
Currently, most of the countries inSouth Asia are going through aliberalisation and privatisation drive andare allowing entry of foreign companiesin previously reserved sectors like
76 Human Development in South Asia 2003
infrastructure, banks, insurance andfinancial services, energy, transport andtelecommunications. On account of hugeinitial capital investment and technologyrequirements, foreign companies aredeemed to be better suited for thesesectors. It is argued that FDI in thesesectors has the capacity to generatedemand for goods and services in othersectors following an increase in their ownoutput.
However, increased commercialpresence of foreign companies may notguarantee increased welfare andemployment for the economy. Very oftencommercial presence is establishedthrough mergers and acquisitions insteadof greenfield investments in new markets.According to the United NationsConference on Trade and Development(UNCTAD), the services sectoraccounted for over 60 per cent of globalmergers and acquisitions (M&A) and asmuch as 90 per cent of those in thedeveloping countries. M&A, in fact, canhave a negative impact on employment,because, in most cases, foreign capitalbrings in more capital intensivetechnologies of production, which, bydefinition, use less labour.
Secondly, in most cases, internationalservices markets are dominated by only afew large firms from the developedcountries. These large foreign firms aretechnologically superior and financiallymore powerful than their developingcountry counterparts. Competition fromthese large companies in their domesticmarkets can make the developing countryfirms (mostly Small and MediumEnterprises) extremely vulnerable and canlead to closure and massive job losses.
Thirdly, increased liberalisation ofbanking and financial services withoutcreating a proper set of prudentialregulations can lead to serious problemsfor an economy. Since 1997, a largenumber of developing countries havesuffered from financial crisis and, in mostcases, the major problem was prematureand excessively rapid capital accountliberalisation and the failure to put into
place adequate regulatory frameworks. Asit has been observed in a number ofcountries, financial crises can have aserious negative impact on theemployment scenario of any developingcountry.
However, it is fair to mention here thatGATS, per se , does not imposeprivatisation and deregulation ondeveloping countries. In GATS,governments are given completeflexibility of choosing the sectors, sub-sectors and mode of services they wantto open up. Developing countries facepressures for privatisation throughconditionality in structural adjustmentprograms or because of their fiscalcompulsions. GATS only facilitates thecommercialisation of services.
MODE 4 OR ‘PRESENCE ORMOVEMENT OF NATURALPERSONS’: Mode 4 refers to GATSMembers’ commitment to temporaryadmission of foreign nationals or foreignpermanent residents as services providersin their territory. For developingcountries, with abundant supply oflabour, this mode of supply of servicesholds huge potential. All South Asiancountries have significant potential forexporting many services throughtemporary movement of professionals, aswell as semi-skilled and unskilled workers.For these countries, the benefit fromlabour migration becomes maximumwhen the migration is temporary. In thatcase, these countries gain financially aswell as from the knowledge and humancapital of the service suppliers returninghome after a certain period abroad.
The potential of South Asian countriesto improve employment through thismode of services exports is huge. This isevident from workers’ remittances figure,which gives only a poor approximationof income of migrant workers. Accordingto the Global Development FinanceReport of 2003, India, Bangladesh,Pakistan and Sri Lanka are among the top20 developing country recipients ofworkers’ remittances in 2001 (figure 4.10).As a percentage of GDP, the share of
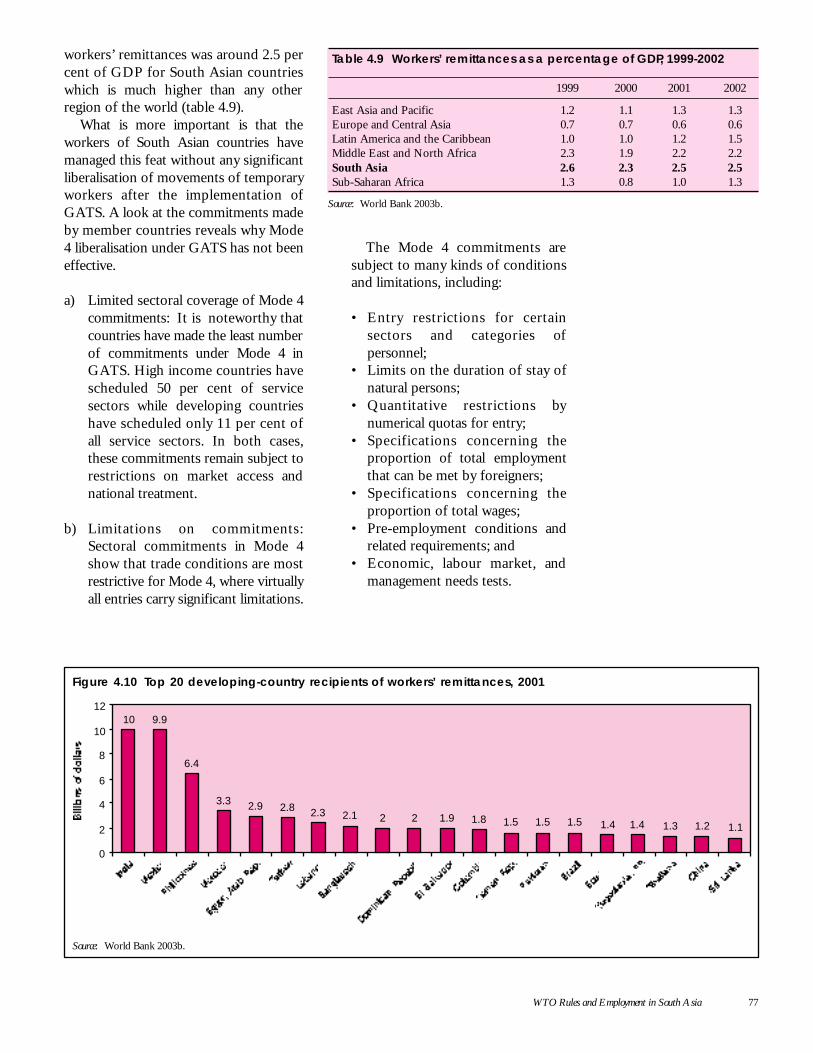
WTO Rules and Employment in South Asia 77
workers’ remittances was around 2.5 percent of GDP for South Asian countrieswhich is much higher than any otherregion of the world (table 4.9).
What is more important is that theworkers of South Asian countries havemanaged this feat without any significantliberalisation of movements of temporaryworkers after the implementation ofGATS. A look at the commitments madeby member countries reveals why Mode4 liberalisation under GATS has not beeneffective.
a) Limited sectoral coverage of Mode 4commitments: It is noteworthy thatcountries have made the least numberof commitments under Mode 4 inGATS. High income countries havescheduled 50 per cent of servicesectors while developing countrieshave scheduled only 11 per cent ofall service sectors. In both cases,these commitments remain subject torestrictions on market access andnational treatment.
b) Limitations on commitments:Sectoral commitments in Mode 4show that trade conditions are mostrestrictive for Mode 4, where virtuallyall entries carry significant limitations.
The Mode 4 commitments aresubject to many kinds of conditionsand limitations, including:
• Entry restrictions for certainsectors and categories ofpersonnel;
• Limits on the duration of stay ofnatural persons;
• Quantitative restrictions bynumerical quotas for entry;
• Specifications concerning theproportion of total employmentthat can be met by foreigners;
• Specifications concerning theproportion of total wages;
• Pre-employment conditions andrelated requirements; and
• Economic, labour market, andmanagement needs tests.
Table 4.9 Workers’ remittances as a percentage of GDP, 1999-2002
1999 2000 2001 2002
East Asia and Pacific 1.2 1.1 1.3 1.3Europe and Central Asia 0.7 0.7 0.6 0.6Latin America and the Caribbean 1.0 1.0 1.2 1.5Middle East and North Africa 2.3 1.9 2.2 2.2South Asia 2.6 2.3 2.5 2.5Sub-Saharan Africa 1.3 0.8 1.0 1.3
Source: World Bank 2003b.
Source: World Bank 2003b.
10 9.9
6.4
3.3 2.9 2.8 2.3 2.1 2 2 1.9 1.8 1.5 1.5 1.5 1.4 1.4 1.3 1.2 1.1
0
2
4
6
8
10
12
Figure 4.10 Top 20 developing-country recipients of workers’ remittances, 2001
78 Human Development in South Asia 2003
c) Bias towards higher-level servicespersonnel and intra-corporatemovements: Most members haveonly allowed entry of specialists andhigher-level management staff,significantly curtailing the scope forcross-border (non-establishmentrelated) trade in services. Recent datafrom WTO show that there is astrong bias towards liberalising themovement of higher level servicespersonnel.
d) Structural problems: A fundamentalproblem is that there is no separationof temporary and permanent labourunder the existing framework ofcommitments, even though GATS ismeant to cover only temporary labourflows in services.
In sum, GATS thus far has limitedimplications for liberalising service tradethrough this mode. Market accesscommitments by high-income countriestend to be restrictive with respect toactivities in which developing countrieshave a comparative advantage—both lowand high skill labour intensive activitiesthat require either temporary entry orestablishment or work permits.Developing countries have madesubstantial commitments under GATSwith respect to many service industries.In contrast, as far as movements ofnatural persons are concerned, they havenot received concessions of anymeaningful economic value.
For South Asian countries, it will beimportant to ensure a more meaningfulimplementation of GATS in the comingrounds. These countries stand to benefita lot from a trade regime in whichmovements of workers are less restricted.If the restrictions on the movements ofnatural persons are eased, given thequality and the quantity of manpoweravailable to the South Asian countries,exporting manpower will be a significantsource of employment for thesecountries.
WTO and South Asia: Concludingremarks
The South Asian countries expected togain from WTO rules in three key areas:agriculture, textiles and services. It wasexpected that increased market access anda less distorted trade regime would allowthese countries to take advantage of theircheap labour to increase their exports. Itwas also expected that increased exportwould generate high employment growthin these sectors. But as the discussions inthe previous sections have shown,continued presence of high level ofsubsidies in agriculture, backloading ofquotas in textiles and lack of meaningfulliberalisation in the services sectorensured that the benefits accruing todeveloping countries are much less thananticipated.
Though the WTO managed todismantle most of the explicit non-tariffbarriers that were prevalent ininternational trade, new instruments likeanti-dumping duties, SPS and TBTregulations are increasingly used by thedeveloped countries as new forms ofprotectionist devices against imports fromdeveloping countries. On the other hand,declining industrial tariffs, stricterimplementation of TRIPS and removalof all quantitative restrictions available todeveloping countries have resulted inincreased imports of industrial goods inthese countries. This has threatened theviability of their domestic industrial sectorand resulted in increased job losses in themanufacturing sector.
Overall, it can be concluded thatemployment generation in South Asiancountries has so far not benefited muchfrom WTO. The example of the successof textile sector in Bangladesh, which isoften cited as an example of the successof WTO, is more due to preferentialmarket access allowed to Bangladesh bythe developed countries. On the otherhand, there is a strong possibility thatonce MFA is totally withdrawn,Bangladesh will face increased
Employmentgeneration in SouthAsian countries hasso far not benefitedmuch from WTO
WTO Rules and Employment in South Asia 79
competition in the international market.Estimates suggest that there will be largescale job losses in the textiles sector ofthat country.
Since 2000, new round of negotiationsare going on in AoA and GATS.However, in the Doha MinisterialMeeting, a comprehensive new round ofnegotiations was launched. Though thesenegotiations are still at an early stage,some disturbing trends can be discerned:
1. More than one year after the DohaDeclaration, lack of progress innegotiations on most fronts indicatesthat most deadlines are going to slipwithout any firm commitments. It isnow expected these will be decided inthe Cancun Ministerial Meeting inSeptember 2003.
2. Secondly, non-trade issues like labourstandards, environmental standardsand multifunctionality are increasinglybeing discussed in the WTO. Althoughthese issues are important, WTO maynot be the proper forum to discussthese issues.
3. The so-called Singapore Issues like(i) Competition Policy, (ii) InvestmentPolicy, (iii) Transparency in Govern-ment Procurement, and (iv) TradeFacilitation are so far on thebackburner in the WTO. Developedcountries are likely to raise these issuesin the Cancun Ministerial Meeting.These measures have the potential tofurther restrict the policy optionsavailable to the developing countries.
4. Lately some developed countries havestarted taking unilateral trade measureswhich violate the spirit of the WTO.For example, USA has changed itsRules of Origin Policy for the textilessector, unilaterally imposed additionalduty on steel imports and proposedenormous increase in its farm subsidyoutlays. Though some of these stepshave been challenged in the WTO, sofar no action has been taken.
If these issues are not addressed, then itwill become even more difficult for thedeveloping countries to reap any benefitsfrom WTO.
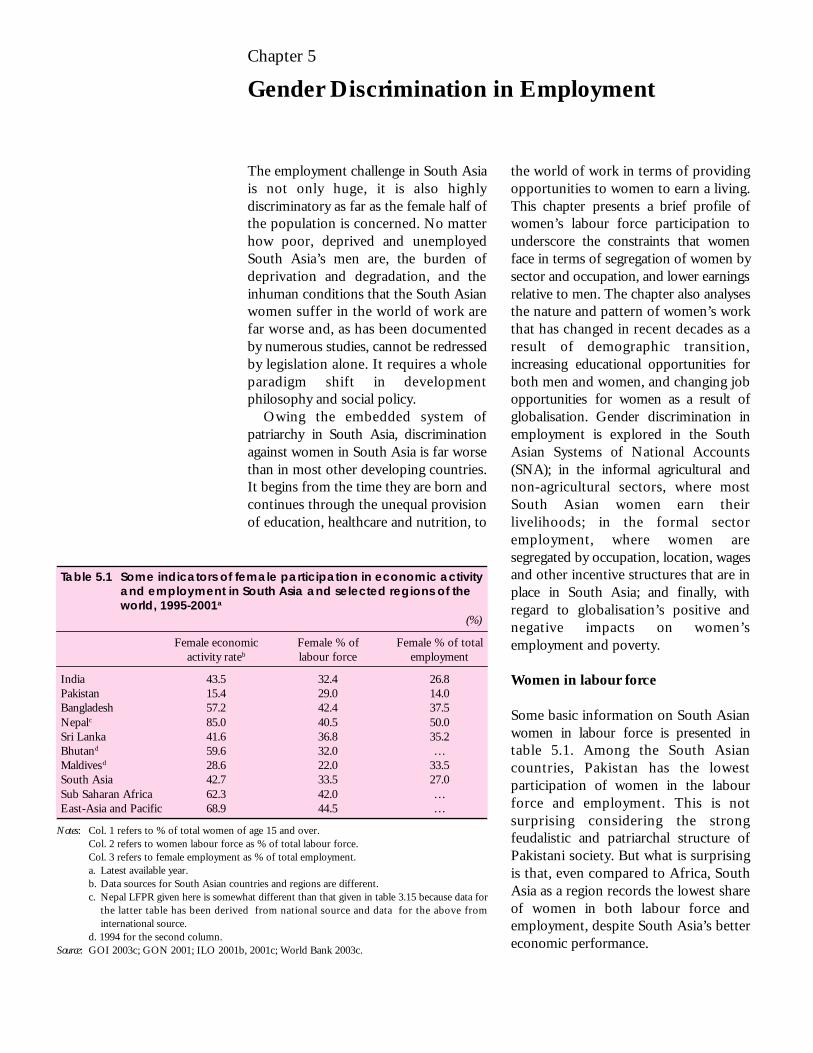
80 Human Development in South Asia 2003
The employment challenge in South Asiais not only huge, it is also highlydiscriminatory as far as the female half ofthe population is concerned. No matterhow poor, deprived and unemployedSouth Asia’s men are, the burden ofdeprivation and degradation, and theinhuman conditions that the South Asianwomen suffer in the world of work arefar worse and, as has been documentedby numerous studies, cannot be redressedby legislation alone. It requires a wholeparadigm shift in developmentphilosophy and social policy.
Owing the embedded system ofpatriarchy in South Asia, discriminationagainst women in South Asia is far worsethan in most other developing countries.It begins from the time they are born andcontinues through the unequal provisionof education, healthcare and nutrition, to
the world of work in terms of providingopportunities to women to earn a living.This chapter presents a brief profile ofwomen’s labour force participation tounderscore the constraints that womenface in terms of segregation of women bysector and occupation, and lower earningsrelative to men. The chapter also analysesthe nature and pattern of women’s workthat has changed in recent decades as aresult of demographic transition,increasing educational opportunities forboth men and women, and changing jobopportunities for women as a result ofglobalisation. Gender discrimination inemployment is explored in the SouthAsian Systems of National Accounts(SNA); in the informal agricultural andnon-agricultural sectors, where mostSouth Asian women earn theirlivelihoods; in the formal sectoremployment, where women aresegregated by occupation, location, wagesand other incentive structures that are inplace in South Asia; and finally, withregard to globalisation’s positive andnegative impacts on women’semployment and poverty.
Women in labour force
Some basic information on South Asianwomen in labour force is presented intable 5.1. Among the South Asiancountries, Pakistan has the lowestparticipation of women in the labourforce and employment. This is notsurprising considering the strongfeudalistic and patriarchal structure ofPakistani society. But what is surprisingis that, even compared to Africa, SouthAsia as a region records the lowest shareof women in both labour force andemployment, despite South Asia’s bettereconomic performance.
Chapter 5
Gender Discrimination in Employment
Table 5.1 Some indicators of female participation in economic activityand employment in South Asia and selected regions of theworld, 1995-2001a
(%)
Female economic Female % of Female % of totalactivity rateb labour force employment
India 43.5 32.4 26.8Pakistan 15.4 29.0 14.0Bangladesh 57.2 42.4 37.5Nepalc 85.0 40.5 50.0Sri Lanka 41.6 36.8 35.2Bhutand 59.6 32.0 …Maldivesd 28.6 22.0 33.5South Asia 42.7 33.5 27.0Sub Saharan Africa 62.3 42.0 …East-Asia and Pacific 68.9 44.5 …
Notes: Col. 1 refers to % of total women of age 15 and over.Col. 2 refers to women labour force as % of total labour force.Col. 3 refers to female employment as % of total employment.a. Latest available year.b. Data sources for South Asian countries and regions are different.c. Nepal LFPR given here is somewhat different than that given in table 3.15 because data for
the latter table has been derived from national source and data for the above frominternational source.
d. 1994 for the second column.Source: GOI 2003c; GON 2001; ILO 2001b, 2001c; World Bank 2003c.
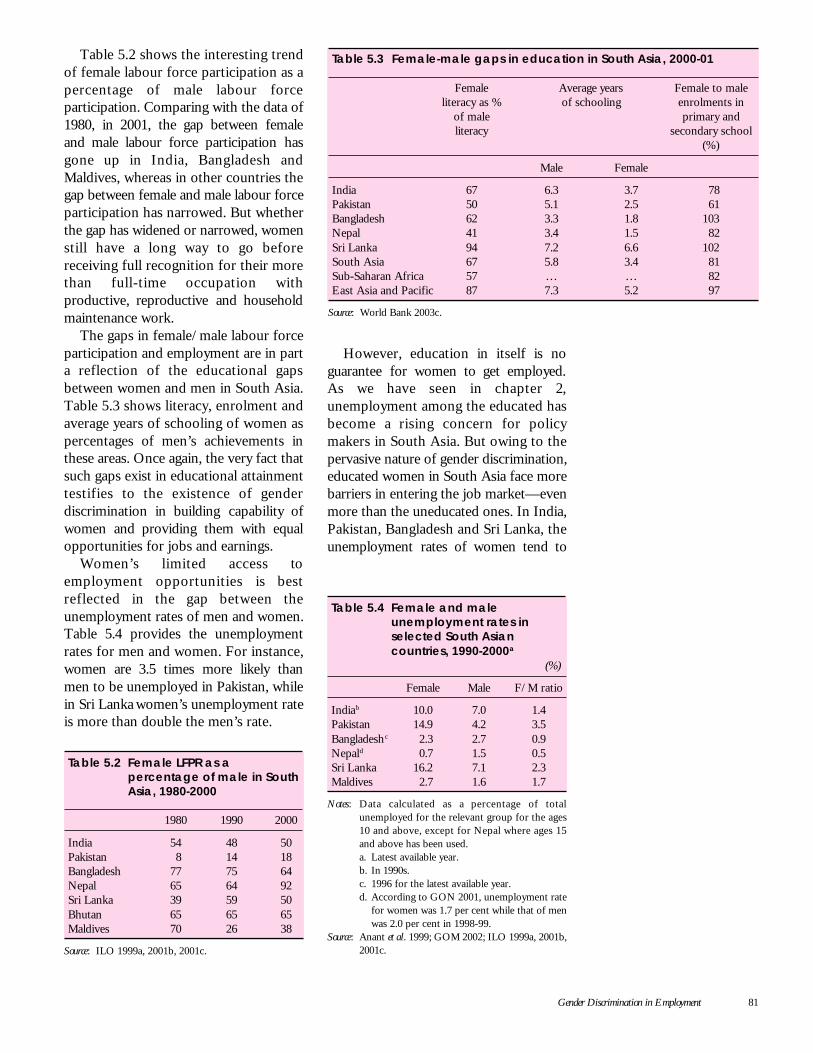
Gender Discrimination in Employment 81
Table 5.2 shows the interesting trendof female labour force participation as apercentage of male labour forceparticipation. Comparing with the data of1980, in 2001, the gap between femaleand male labour force participation hasgone up in India, Bangladesh andMaldives, whereas in other countries thegap between female and male labour forceparticipation has narrowed. But whetherthe gap has widened or narrowed, womenstill have a long way to go beforereceiving full recognition for their morethan full-time occupation withproductive, reproductive and householdmaintenance work.
The gaps in female/male labour forceparticipation and employment are in parta reflection of the educational gapsbetween women and men in South Asia.Table 5.3 shows literacy, enrolment andaverage years of schooling of women aspercentages of men’s achievements inthese areas. Once again, the very fact thatsuch gaps exist in educational attainmenttestifies to the existence of genderdiscrimination in building capability ofwomen and providing them with equalopportunities for jobs and earnings.
Women’s limited access toemployment opportunities is bestreflected in the gap between theunemployment rates of men and women.Table 5.4 provides the unemploymentrates for men and women. For instance,women are 3.5 times more likely thanmen to be unemployed in Pakistan, whilein Sri Lanka women’s unemployment rateis more than double the men’s rate.
However, education in itself is noguarantee for women to get employed.As we have seen in chapter 2,unemployment among the educated hasbecome a rising concern for policymakers in South Asia. But owing to thepervasive nature of gender discrimination,educated women in South Asia face morebarriers in entering the job market—evenmore than the uneducated ones. In India,Pakistan, Bangladesh and Sri Lanka, theunemployment rates of women tend to
Table 5.2 Female LFPR as apercentage of male in SouthAsia, 1980-2000
1980 1990 2000
India 54 48 50Pakistan 8 14 18Bangladesh 77 75 64Nepal 65 64 92Sri Lanka 39 59 50Bhutan 65 65 65Maldives 70 26 38
Source: ILO 1999a, 2001b, 2001c.
Table 5.3 Female-male gaps in education in South Asia, 2000-01
Female Average years Female to maleliteracy as % of schooling enrolments in
of male primary andliteracy secondary school
(%)
Male Female
India 67 6.3 3.7 78Pakistan 50 5.1 2.5 61Bangladesh 62 3.3 1.8 103Nepal 41 3.4 1.5 82Sri Lanka 94 7.2 6.6 102South Asia 67 5.8 3.4 81Sub-Saharan Africa 57 … … 82East Asia and Pacific 87 7.3 5.2 97
Source: World Bank 2003c.
Table 5.4 Female and maleunemployment rates inselected South Asiancountries, 1990-2000a
(%)
Female Male F/M ratio
Indiab 10.0 7.0 1.4Pakistan 14.9 4.2 3.5Bangladeshc 2.3 2.7 0.9Nepald 0.7 1.5 0.5Sri Lanka 16.2 7.1 2.3Maldives 2.7 1.6 1.7
Notes: Data calculated as a percentage of totalunemployed for the relevant group for the ages10 and above, except for Nepal where ages 15and above has been used.a. Latest available year.b. In 1990s.c. 1996 for the latest available year.d. According to GON 2001, unemployment rate
for women was 1.7 per cent while that of menwas 2.0 per cent in 1998-99.
Source: Anant et al. 1999; GOM 2002; ILO 1999a, 2001b,2001c.
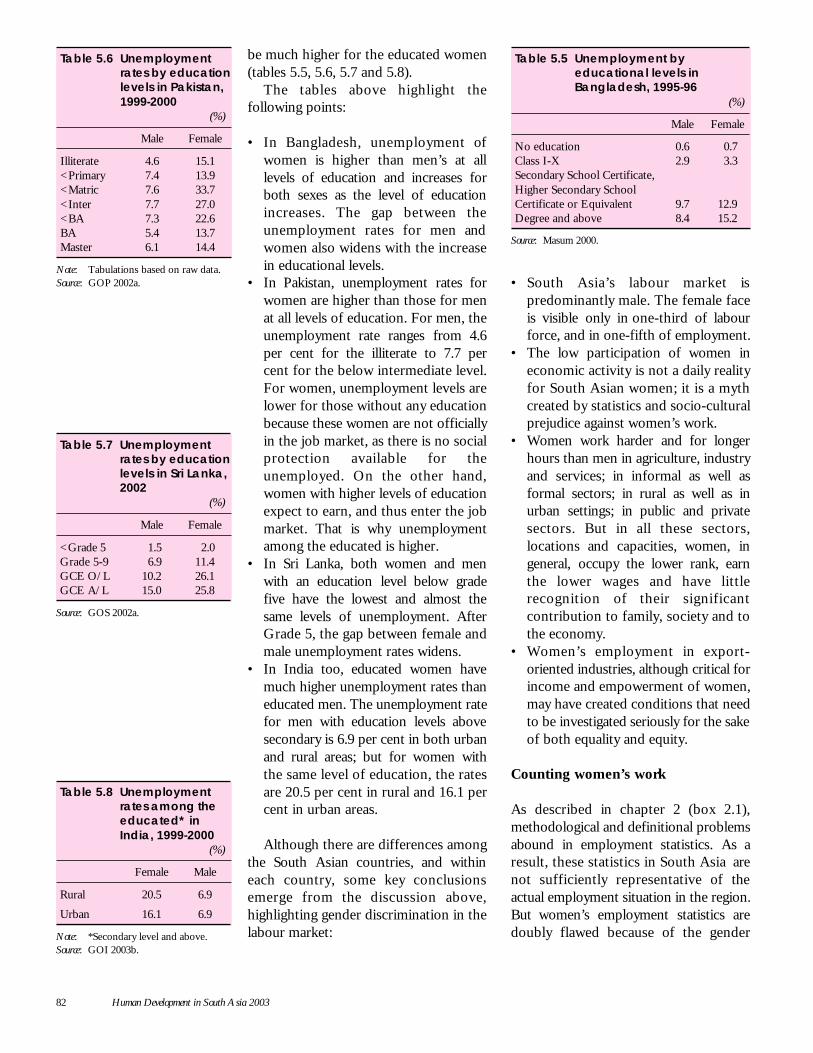
82 Human Development in South Asia 2003
be much higher for the educated women(tables 5.5, 5.6, 5.7 and 5.8).
The tables above highlight thefollowing points:
• In Bangladesh, unemployment ofwomen is higher than men’s at alllevels of education and increases forboth sexes as the level of educationincreases. The gap between theunemployment rates for men andwomen also widens with the increasein educational levels.
• In Pakistan, unemployment rates forwomen are higher than those for menat all levels of education. For men, theunemployment rate ranges from 4.6per cent for the illiterate to 7.7 percent for the below intermediate level.For women, unemployment levels arelower for those without any educationbecause these women are not officiallyin the job market, as there is no socialprotection available for theunemployed. On the other hand,women with higher levels of educationexpect to earn, and thus enter the jobmarket. That is why unemploymentamong the educated is higher.
• In Sri Lanka, both women and menwith an education level below gradefive have the lowest and almost thesame levels of unemployment. AfterGrade 5, the gap between female andmale unemployment rates widens.
• In India too, educated women havemuch higher unemployment rates thaneducated men. The unemployment ratefor men with education levels abovesecondary is 6.9 per cent in both urbanand rural areas; but for women withthe same level of education, the ratesare 20.5 per cent in rural and 16.1 percent in urban areas.
Although there are differences amongthe South Asian countries, and withineach country, some key conclusionsemerge from the discussion above,highlighting gender discrimination in thelabour market:
• South Asia’s labour market ispredominantly male. The female faceis visible only in one-third of labourforce, and in one-fifth of employment.
• The low participation of women ineconomic activity is not a daily realityfor South Asian women; it is a mythcreated by statistics and socio-culturalprejudice against women’s work.
• Women work harder and for longerhours than men in agriculture, industryand services; in informal as well asformal sectors; in rural as well as inurban settings; in public and privatesectors. But in all these sectors,locations and capacities, women, ingeneral, occupy the lower rank, earnthe lower wages and have littlerecognition of their significantcontribution to family, society and tothe economy.
• Women’s employment in export-oriented industries, although critical forincome and empowerment of women,may have created conditions that needto be investigated seriously for the sakeof both equality and equity.
Counting women’s work
As described in chapter 2 (box 2.1),methodological and definitional problemsabound in employment statistics. As aresult, these statistics in South Asia arenot sufficiently representative of theactual employment situation in the region.But women’s employment statistics aredoubly flawed because of the gender
Table 5.6 Unemploymentrates by educationlevels in Pakistan,1999-2000
(%)
Male Female
Illiterate 4.6 15.1<Primary 7.4 13.9<Matric 7.6 33.7<Inter 7.7 27.0<BA 7.3 22.6BA 5.4 13.7Master 6.1 14.4
Note: Tabulations based on raw data.Source: GOP 2002a.
Table 5.7 Unemploymentrates by educationlevels in Sri Lanka,2002
(%)
Male Female
<Grade 5 1.5 2.0Grade 5-9 6.9 11.4GCE O/L 10.2 26.1GCE A/L 15.0 25.8
Source: GOS 2002a.
Table 5.8 Unemploymentrates among theeducated* inIndia, 1999-2000
(%)
Female Male
Rural 20.5 6.9
Urban 16.1 6.9
Note: *Secondary level and above.Source: GOI 2003b.
Table 5.5 Unemployment byeducational levels inBangladesh, 1995-96
(%)
Male Female
No education 0.6 0.7Class I-X 2.9 3.3Secondary School Certificate,Higher Secondary SchoolCertificate or Equivalent 9.7 12.9Degree and above 8.4 15.2
Source: Masum 2000.
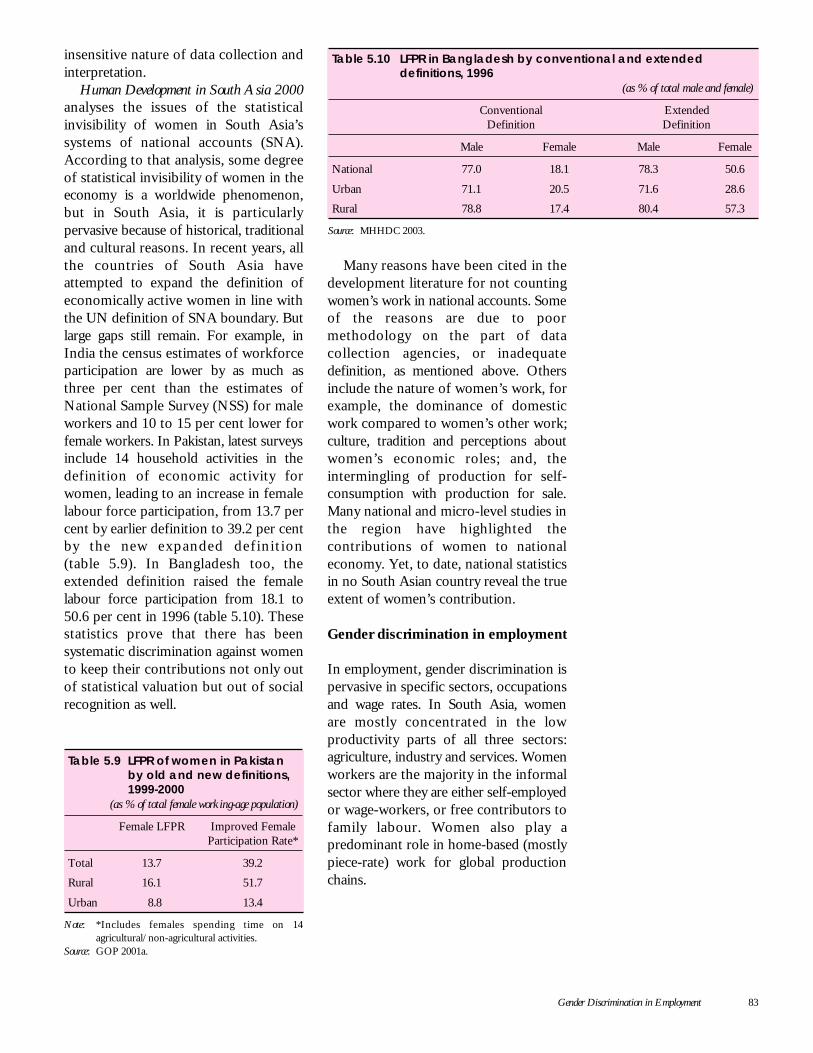
Gender Discrimination in Employment 83
insensitive nature of data collection andinterpretation.
Human Development in South Asia 2000analyses the issues of the statisticalinvisibility of women in South Asia’ssystems of national accounts (SNA).According to that analysis, some degreeof statistical invisibility of women in theeconomy is a worldwide phenomenon,but in South Asia, it is particularlypervasive because of historical, traditionaland cultural reasons. In recent years, allthe countries of South Asia haveattempted to expand the definition ofeconomically active women in line withthe UN definition of SNA boundary. Butlarge gaps still remain. For example, inIndia the census estimates of workforceparticipation are lower by as much asthree per cent than the estimates ofNational Sample Survey (NSS) for maleworkers and 10 to 15 per cent lower forfemale workers. In Pakistan, latest surveysinclude 14 household activities in thedefinition of economic activity forwomen, leading to an increase in femalelabour force participation, from 13.7 percent by earlier definition to 39.2 per centby the new expanded def in i t ion(table 5.9). In Bangladesh too, theextended definition raised the femalelabour force participation from 18.1 to50.6 per cent in 1996 (table 5.10). Thesestatistics prove that there has beensystematic discrimination against womento keep their contributions not only outof statistical valuation but out of socialrecognition as well.
Many reasons have been cited in thedevelopment literature for not countingwomen’s work in national accounts. Someof the reasons are due to poormethodology on the part of datacollection agencies, or inadequatedefinition, as mentioned above. Othersinclude the nature of women’s work, forexample, the dominance of domesticwork compared to women’s other work;culture, tradition and perceptions aboutwomen’s economic roles; and, theintermingling of production for self-consumption with production for sale.Many national and micro-level studies inthe region have highlighted thecontributions of women to nationaleconomy. Yet, to date, national statisticsin no South Asian country reveal the trueextent of women’s contribution.
Gender discrimination in employment
In employment, gender discrimination ispervasive in specific sectors, occupationsand wage rates. In South Asia, womenare mostly concentrated in the lowproductivity parts of all three sectors:agriculture, industry and services. Womenworkers are the majority in the informalsector where they are either self-employedor wage-workers, or free contributors tofamily labour. Women also play apredominant role in home-based (mostlypiece-rate) work for global productionchains.
Table 5.9 LFPR of women in Pakistanby old and new definitions,1999-2000
(as % of total female working-age population)
Female LFPR Improved FemaleParticipation Rate*
Total 13.7 39.2
Rural 16.1 51.7
Urban 8.8 13.4
Note: *Includes females spending time on 14agricultural/non-agricultural activities.
Source: GOP 2001a.
Table 5.10 LFPR in Bangladesh by conventional and extendeddefinitions, 1996
(as % of total male and female)
Conventional ExtendedDefinition Definition
Male Female Male Female
National 77.0 18.1 78.3 50.6
Urban 71.1 20.5 71.6 28.6
Rural 78.8 17.4 80.4 57.3
Source: MHHDC 2003.
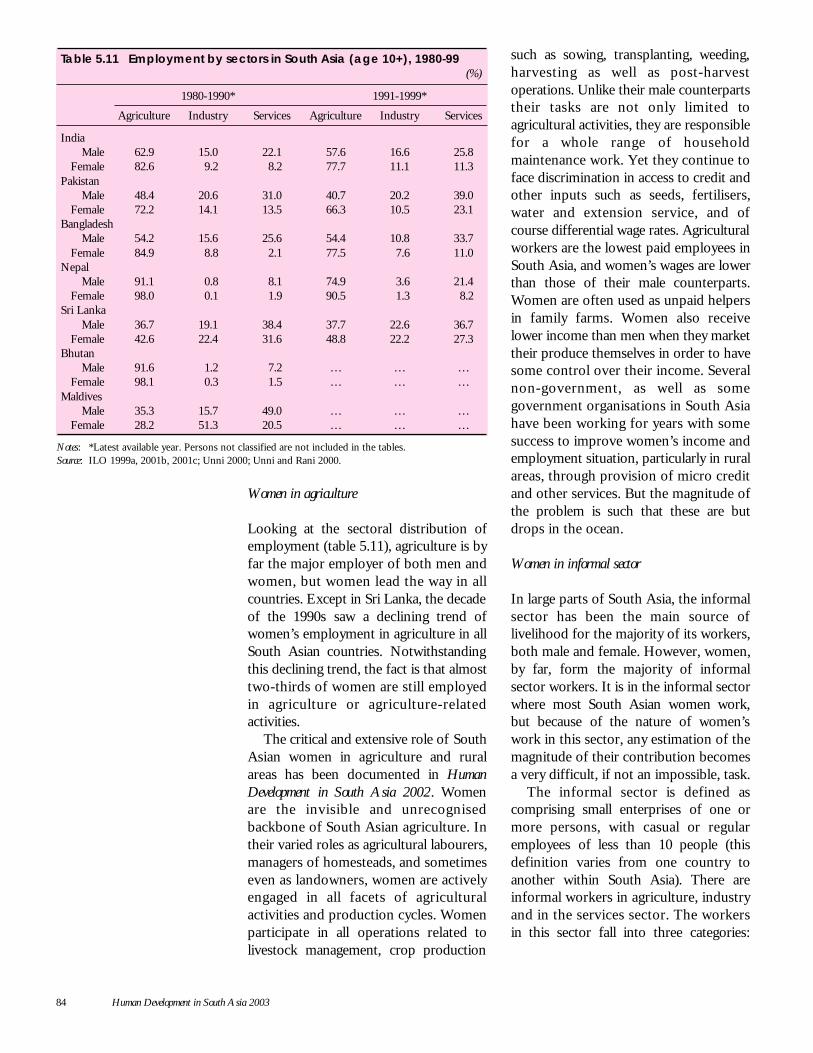
84 Human Development in South Asia 2003
Women in agriculture
Looking at the sectoral distribution ofemployment (table 5.11), agriculture is byfar the major employer of both men andwomen, but women lead the way in allcountries. Except in Sri Lanka, the decadeof the 1990s saw a declining trend ofwomen’s employment in agriculture in allSouth Asian countries. Notwithstandingthis declining trend, the fact is that almosttwo-thirds of women are still employedin agriculture or agriculture-relatedactivities.
The critical and extensive role of SouthAsian women in agriculture and ruralareas has been documented in HumanDevelopment in South Asia 2002. Womenare the invisible and unrecognisedbackbone of South Asian agriculture. Intheir varied roles as agricultural labourers,managers of homesteads, and sometimeseven as landowners, women are activelyengaged in all facets of agriculturalactivities and production cycles. Womenparticipate in all operations related tolivestock management, crop production
such as sowing, transplanting, weeding,harvesting as well as post-harvestoperations. Unlike their male counterpartstheir tasks are not only limited toagricultural activities, they are responsiblefor a whole range of householdmaintenance work. Yet they continue toface discrimination in access to credit andother inputs such as seeds, fertilisers,water and extension service, and ofcourse differential wage rates. Agriculturalworkers are the lowest paid employees inSouth Asia, and women’s wages are lowerthan those of their male counterparts.Women are often used as unpaid helpersin family farms. Women also receivelower income than men when they markettheir produce themselves in order to havesome control over their income. Severalnon-government, as well as somegovernment organisations in South Asiahave been working for years with somesuccess to improve women’s income andemployment situation, particularly in ruralareas, through provision of micro creditand other services. But the magnitude ofthe problem is such that these are butdrops in the ocean.
Women in informal sector
In large parts of South Asia, the informalsector has been the main source oflivelihood for the majority of its workers,both male and female. However, women,by far, form the majority of informalsector workers. It is in the informal sectorwhere most South Asian women work,but because of the nature of women’swork in this sector, any estimation of themagnitude of their contribution becomesa very difficult, if not an impossible, task.
The informal sector is defined ascomprising small enterprises of one ormore persons, with casual or regularemployees of less than 10 people (thisdefinition varies from one country toanother within South Asia). There areinformal workers in agriculture, industryand in the services sector. The workersin this sector fall into three categories:
Table 5.11 Employment by sectors in South Asia (age 10+), 1980-99(%)
1980-1990* 1991-1999*
Agriculture Industry Services Agriculture Industry Services
IndiaMale 62.9 15.0 22.1 57.6 16.6 25.8
Female 82.6 9.2 8.2 77.7 11.1 11.3Pakistan
Male 48.4 20.6 31.0 40.7 20.2 39.0Female 72.2 14.1 13.5 66.3 10.5 23.1
BangladeshMale 54.2 15.6 25.6 54.4 10.8 33.7
Female 84.9 8.8 2.1 77.5 7.6 11.0Nepal
Male 91.1 0.8 8.1 74.9 3.6 21.4Female 98.0 0.1 1.9 90.5 1.3 8.2
Sri LankaMale 36.7 19.1 38.4 37.7 22.6 36.7
Female 42.6 22.4 31.6 48.8 22.2 27.3Bhutan
Male 91.6 1.2 7.2 … … …Female 98.1 0.3 1.5 … … …
MaldivesMale 35.3 15.7 49.0 … … …
Female 28.2 51.3 20.5 … … …
Notes: *Latest available year. Persons not classified are not included in the tables.Source: ILO 1999a, 2001b, 2001c; Unni 2000; Unni and Rani 2000.
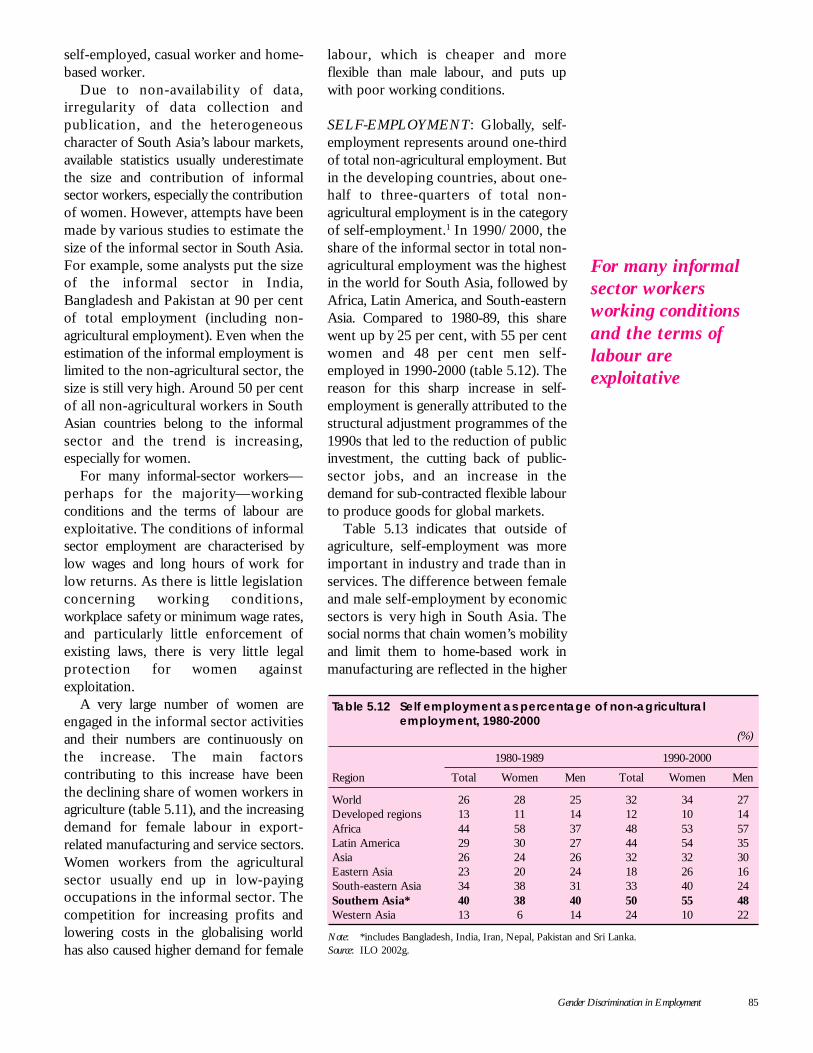
Gender Discrimination in Employment 85
self-employed, casual worker and home-based worker.
Due to non-availability of data,irregularity of data collection andpublication, and the heterogeneouscharacter of South Asia’s labour markets,available statistics usually underestimatethe size and contribution of informalsector workers, especially the contributionof women. However, attempts have beenmade by various studies to estimate thesize of the informal sector in South Asia.For example, some analysts put the sizeof the informal sector in India,Bangladesh and Pakistan at 90 per centof total employment (including non-agricultural employment). Even when theestimation of the informal employment islimited to the non-agricultural sector, thesize is still very high. Around 50 per centof all non-agricultural workers in SouthAsian countries belong to the informalsector and the trend is increasing,especially for women.
For many informal-sector workers—perhaps for the majority—workingconditions and the terms of labour areexploitative. The conditions of informalsector employment are characterised bylow wages and long hours of work forlow returns. As there is little legislationconcerning working conditions,workplace safety or minimum wage rates,and particularly little enforcement ofexisting laws, there is very little legalprotection for women againstexploitation.
A very large number of women areengaged in the informal sector activitiesand their numbers are continuously onthe increase. The main factorscontributing to this increase have beenthe declining share of women workers inagriculture (table 5.11), and the increasingdemand for female labour in export-related manufacturing and service sectors.Women workers from the agriculturalsector usually end up in low-payingoccupations in the informal sector. Thecompetition for increasing profits andlowering costs in the globalising worldhas also caused higher demand for female
labour, which is cheaper and moreflexible than male labour, and puts upwith poor working conditions.
SELF-EMPLOYMENT: Globally, self-employment represents around one-thirdof total non-agricultural employment. Butin the developing countries, about one-half to three-quarters of total non-agricultural employment is in the categoryof self-employment.1 In 1990/2000, theshare of the informal sector in total non-agricultural employment was the highestin the world for South Asia, followed byAfrica, Latin America, and South-easternAsia. Compared to 1980-89, this sharewent up by 25 per cent, with 55 per centwomen and 48 per cent men self-employed in 1990-2000 (table 5.12). Thereason for this sharp increase in self-employment is generally attributed to thestructural adjustment programmes of the1990s that led to the reduction of publicinvestment, the cutting back of public-sector jobs, and an increase in thedemand for sub-contracted flexible labourto produce goods for global markets.
Table 5.13 indicates that outside ofagriculture, self-employment was moreimportant in industry and trade than inservices. The difference between femaleand male self-employment by economicsectors is very high in South Asia. Thesocial norms that chain women’s mobilityand limit them to home-based work inmanufacturing are reflected in the higher
Table 5.12 Self employment as percentage of non-agriculturalemployment, 1980-2000
(%)
1980-1989 1990-2000
Region Total Women Men Total Women Men
World 26 28 25 32 34 27Developed regions 13 11 14 12 10 14Africa 44 58 37 48 53 57Latin America 29 30 27 44 54 35Asia 26 24 26 32 32 30Eastern Asia 23 20 24 18 26 16South-eastern Asia 34 38 31 33 40 24Southern Asia* 40 38 40 50 55 48Western Asia 13 6 14 24 10 22
Note: *includes Bangladesh, India, Iran, Nepal, Pakistan and Sri Lanka.Source: ILO 2002g.
For many informalsector workersworking conditionsand the terms oflabour areexploitative
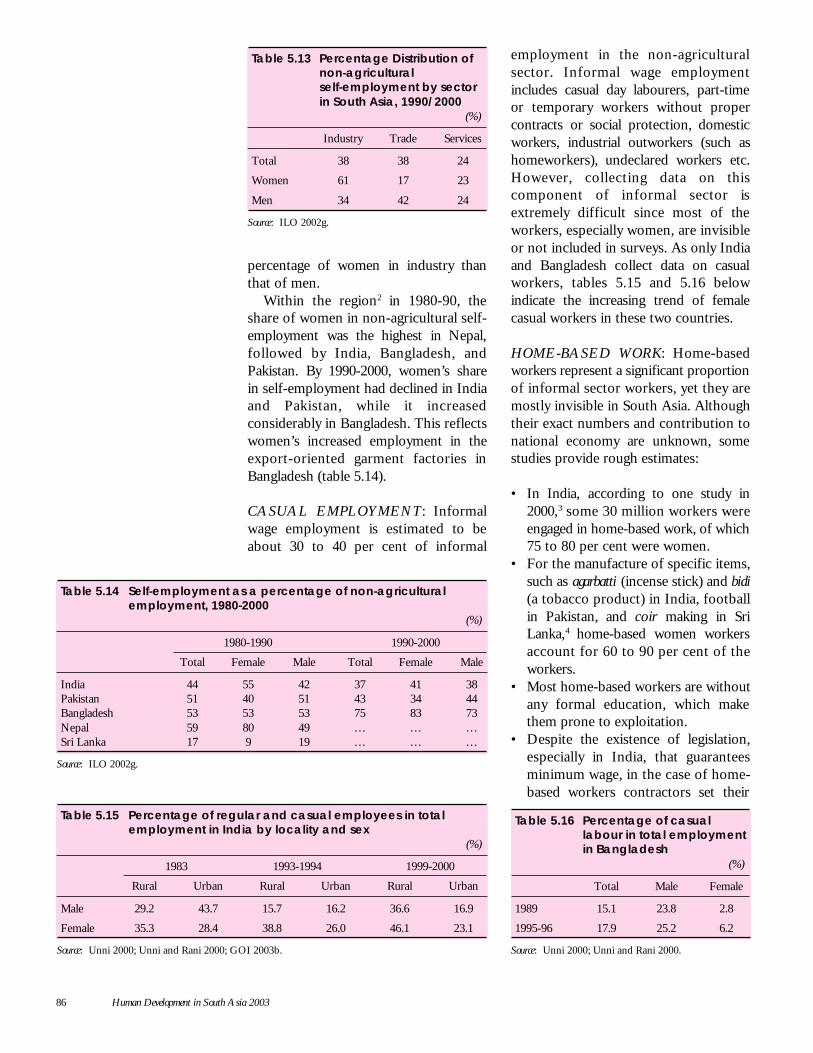
86 Human Development in South Asia 2003
percentage of women in industry thanthat of men.
Within the region2 in 1980-90, theshare of women in non-agricultural self-employment was the highest in Nepal,followed by India, Bangladesh, andPakistan. By 1990-2000, women’s sharein self-employment had declined in Indiaand Pakistan, while it increasedconsiderably in Bangladesh. This reflectswomen’s increased employment in theexport-oriented garment factories inBangladesh (table 5.14).
CASUAL EMPLOYMENT: Informalwage employment is estimated to beabout 30 to 40 per cent of informal
employment in the non-agriculturalsector. Informal wage employmentincludes casual day labourers, part-timeor temporary workers without propercontracts or social protection, domesticworkers, industrial outworkers (such ashomeworkers), undeclared workers etc.However, collecting data on thiscomponent of informal sector isextremely difficult since most of theworkers, especially women, are invisibleor not included in surveys. As only Indiaand Bangladesh collect data on casualworkers, tables 5.15 and 5.16 belowindicate the increasing trend of femalecasual workers in these two countries.
HOME-BASED WORK: Home-basedworkers represent a significant proportionof informal sector workers, yet they aremostly invisible in South Asia. Althoughtheir exact numbers and contribution tonational economy are unknown, somestudies provide rough estimates:
• In India, according to one study in2000,3 some 30 million workers wereengaged in home-based work, of which75 to 80 per cent were women.
• For the manufacture of specific items,such as agarbatti (incense stick) and bidi(a tobacco product) in India, footballin Pakistan, and coir making in SriLanka,4 home-based women workersaccount for 60 to 90 per cent of theworkers.
• Most home-based workers are withoutany formal education, which makethem prone to exploitation.
• Despite the existence of legislation,especially in India, that guaranteesminimum wage, in the case of home-based workers contractors set their
Table 5.13 Percentage Distribution ofnon-agriculturalself-employment by sectorin South Asia, 1990/2000
(%)
Industry Trade Services
Total 38 38 24
Women 61 17 23
Men 34 42 24
Source: ILO 2002g.
Table 5.14 Self-employment as a percentage of non-agriculturalemployment, 1980-2000
(%)
1980-1990 1990-2000
Total Female Male Total Female Male
India 44 55 42 37 41 38Pakistan 51 40 51 43 34 44Bangladesh 53 53 53 75 83 73Nepal 59 80 49 … … …Sri Lanka 17 9 19 … … …
Source: ILO 2002g.
Table 5.15 Percentage of regular and casual employees in totalemployment in India by locality and sex
(%)
1983 1993-1994 1999-2000
Rural Urban Rural Urban Rural Urban
Male 29.2 43.7 15.7 16.2 36.6 16.9
Female 35.3 28.4 38.8 26.0 46.1 23.1
Source: Unni 2000; Unni and Rani 2000; GOI 2003b.
Table 5.16 Percentage of casuallabour in total employmentin Bangladesh
(%)
Total Male Female
1989 15.1 23.8 2.8
1995-96 17.9 25.2 6.2
Source: Unni 2000; Unni and Rani 2000.
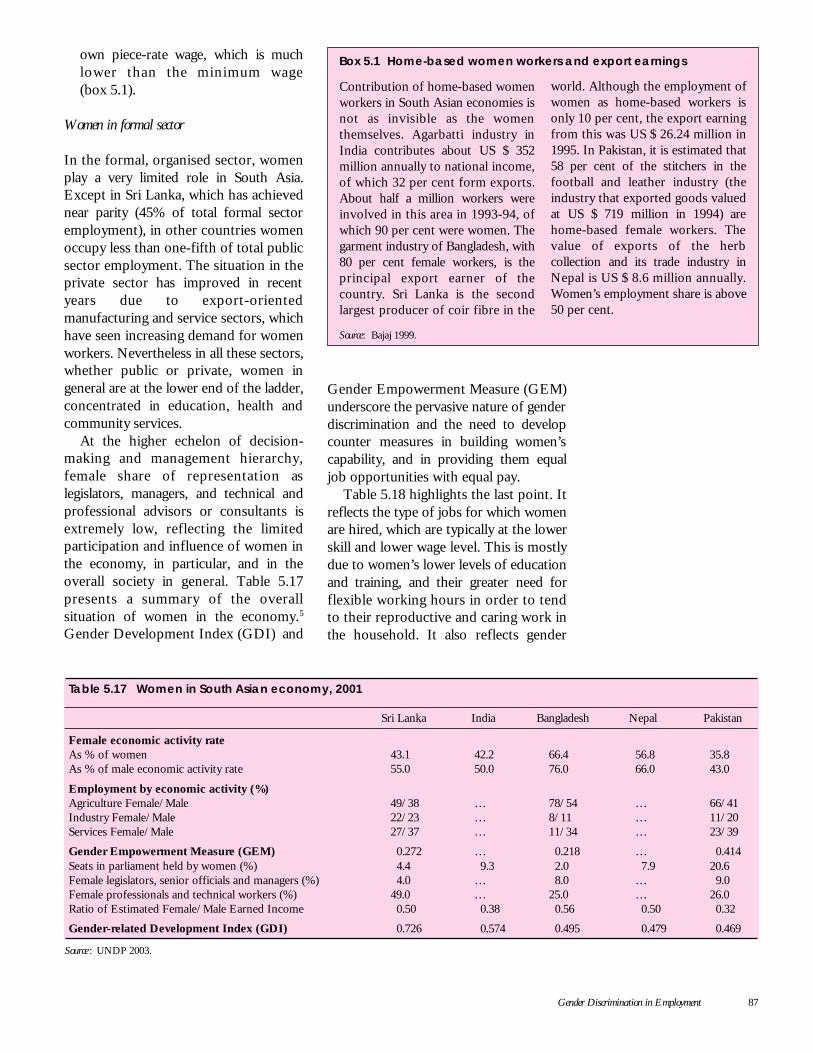
Gender Discrimination in Employment 87
own piece-rate wage, which is muchlower than the minimum wage(box 5.1).
Women in formal sector
In the formal, organised sector, womenplay a very limited role in South Asia.Except in Sri Lanka, which has achievednear parity (45% of total formal sectoremployment), in other countries womenoccupy less than one-fifth of total publicsector employment. The situation in theprivate sector has improved in recentyears due to export-orientedmanufacturing and service sectors, whichhave seen increasing demand for womenworkers. Nevertheless in all these sectors,whether public or private, women ingeneral are at the lower end of the ladder,concentrated in education, health andcommunity services.
At the higher echelon of decision-making and management hierarchy,female share of representation aslegislators, managers, and technical andprofessional advisors or consultants isextremely low, reflecting the limitedparticipation and influence of women inthe economy, in particular, and in theoverall society in general. Table 5.17presents a summary of the overallsituation of women in the economy.5
Gender Development Index (GDI) and
Gender Empowerment Measure (GEM)underscore the pervasive nature of genderdiscrimination and the need to developcounter measures in building women’scapability, and in providing them equaljob opportunities with equal pay.
Table 5.18 highlights the last point. Itreflects the type of jobs for which womenare hired, which are typically at the lowerskill and lower wage level. This is mostlydue to women’s lower levels of educationand training, and their greater need forflexible working hours in order to tendto their reproductive and caring work inthe household. It also reflects gender
Box 5.1 Home-based women workers and export earnings
Contribution of home-based womenworkers in South Asian economies isnot as invisible as the womenthemselves. Agarbatti industry inIndia contributes about US $ 352million annually to national income,of which 32 per cent form exports.About half a million workers wereinvolved in this area in 1993-94, ofwhich 90 per cent were women. Thegarment industry of Bangladesh, with80 per cent female workers, is theprincipal export earner of thecountry. Sri Lanka is the secondlargest producer of coir fibre in the
world. Although the employment ofwomen as home-based workers isonly 10 per cent, the export earningfrom this was US $ 26.24 million in1995. In Pakistan, it is estimated that58 per cent of the stitchers in thefootball and leather industry (theindustry that exported goods valuedat US $ 719 million in 1994) arehome-based female workers. Thevalue of exports of the herbcollection and its trade industry inNepal is US $ 8.6 million annually.Women’s employment share is above50 per cent.
Source: Bajaj 1999.
Table 5.17 Women in South Asian economy, 2001
Sri Lanka India Bangladesh Nepal Pakistan
Female economic activity rateAs % of women 43.1 42.2 66.4 56.8 35.8As % of male economic activity rate 55.0 50.0 76.0 66.0 43.0
Employment by economic activity (%)Agriculture Female/Male 49/38 … 78/54 … 66/41Industry Female/Male 22/23 … 8/11 … 11/20Services Female/Male 27/37 … 11/34 … 23/39
Gender Empowerment Measure (GEM) 0.272 … 0.218 … 0.414Seats in parliament held by women (%) 4.4 9.3 2.0 7.9 20.6Female legislators, senior officials and managers (%) 4.0 … 8.0 … 9.0Female professionals and technical workers (%) 49.0 … 25.0 … 26.0Ratio of Estimated Female/Male Earned Income 0.50 0.38 0.56 0.50 0.32
Gender-related Development Index (GDI) 0.726 0.574 0.495 0.479 0.469
Source : UNDP 2003.
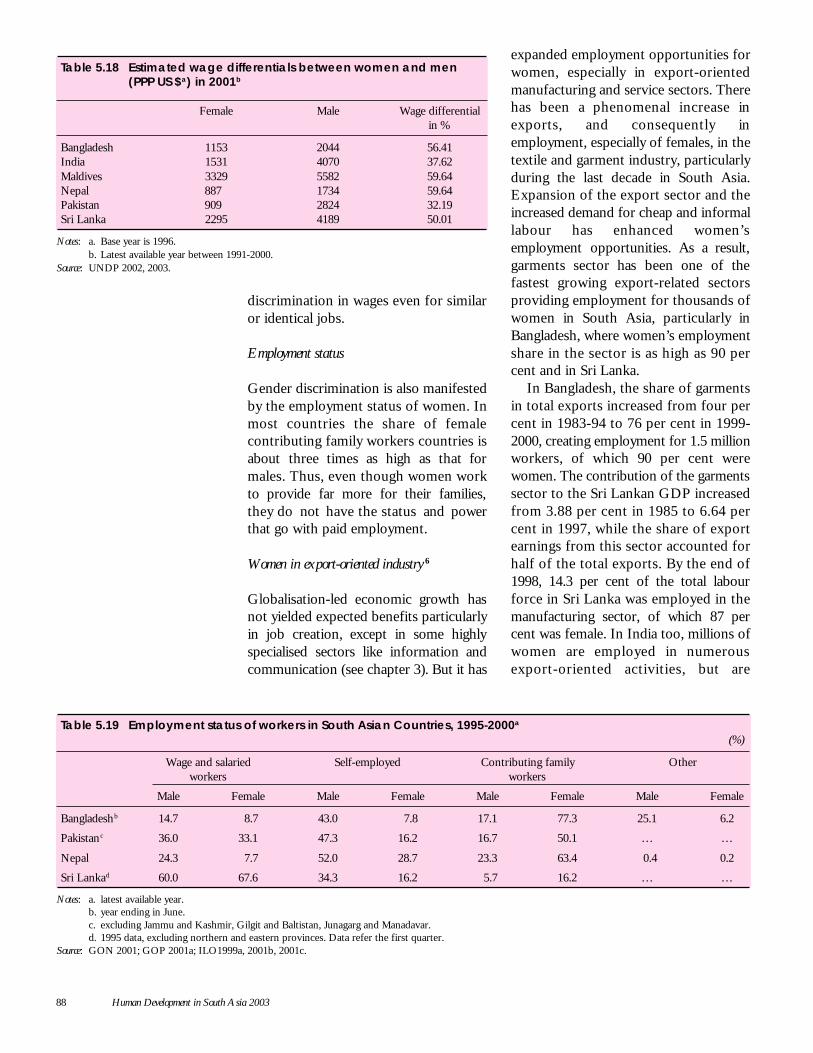
88 Human Development in South Asia 2003
discrimination in wages even for similaror identical jobs.
Employment status
Gender discrimination is also manifestedby the employment status of women. Inmost countries the share of femalecontributing family workers countries isabout three times as high as that formales. Thus, even though women workto provide far more for their families,they do not have the status and powerthat go with paid employment.
Women in export-oriented industry 6
Globalisation-led economic growth hasnot yielded expected benefits particularlyin job creation, except in some highlyspecialised sectors like information andcommunication (see chapter 3). But it has
expanded employment opportunities forwomen, especially in export-orientedmanufacturing and service sectors. Therehas been a phenomenal increase inexports, and consequently inemployment, especially of females, in thetextile and garment industry, particularlyduring the last decade in South Asia.Expansion of the export sector and theincreased demand for cheap and informallabour has enhanced women’semployment opportunities. As a result,garments sector has been one of thefastest growing export-related sectorsproviding employment for thousands ofwomen in South Asia, particularly inBangladesh, where women’s employmentshare in the sector is as high as 90 percent and in Sri Lanka.
In Bangladesh, the share of garmentsin total exports increased from four percent in 1983-94 to 76 per cent in 1999-2000, creating employment for 1.5 millionworkers, of which 90 per cent werewomen. The contribution of the garmentssector to the Sri Lankan GDP increasedfrom 3.88 per cent in 1985 to 6.64 percent in 1997, while the share of exportearnings from this sector accounted forhalf of the total exports. By the end of1998, 14.3 per cent of the total labourforce in Sri Lanka was employed in themanufacturing sector, of which 87 percent was female. In India too, millions ofwomen are employed in numerousexport-oriented activities, but are
Table 5.18 Estimated wage differentials between women and men(PPP US $a) in 2001b
Female Male Wage differentialin %
Bangladesh 1153 2044 56.41India 1531 4070 37.62Maldives 3329 5582 59.64Nepal 887 1734 59.64Pakistan 909 2824 32.19Sri Lanka 2295 4189 50.01
Notes: a. Base year is 1996.b. Latest available year between 1991-2000.
Source: UNDP 2002, 2003.
Table 5.19 Employment status of workers in South Asian Countries, 1995-2000a
(%)
Wage and salaried Self-employed Contributing family Otherworkers workers
Male Female Male Female Male Female Male Female
Bangladeshb 14.7 8.7 43.0 7.8 17.1 77.3 25.1 6.2
Pakistanc 36.0 33.1 47.3 16.2 16.7 50.1 … …
Nepal 24.3 7.7 52.0 28.7 23.3 63.4 0.4 0.2
Sri Lankad 60.0 67.6 34.3 16.2 5.7 16.2 … …
Notes: a. latest available year.b. year ending in June.c. excluding Jammu and Kashmir, Gilgit and Baltistan, Junagarg and Manadavar.d. 1995 data, excluding northern and eastern provinces. Data refer the first quarter.
Source: GON 2001; GOP 2001a; ILO1999a, 2001b, 2001c.
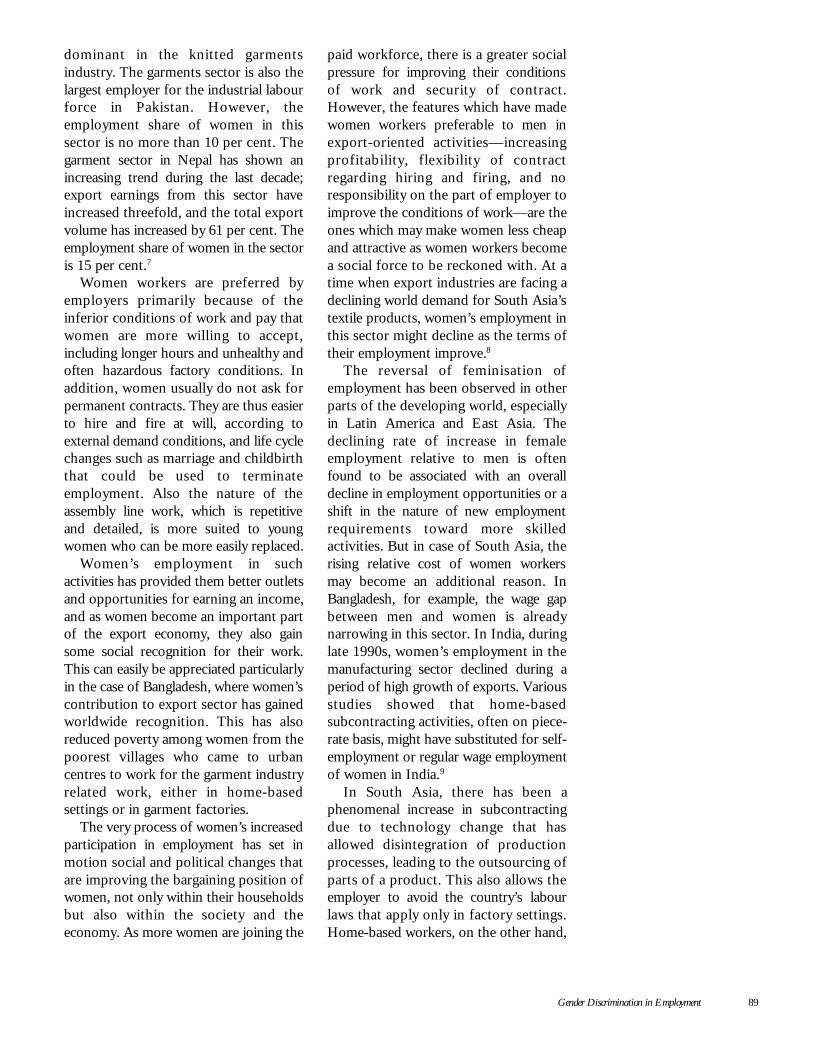
Gender Discrimination in Employment 89
dominant in the knitted garmentsindustry. The garments sector is also thelargest employer for the industrial labourforce in Pakistan. However, theemployment share of women in thissector is no more than 10 per cent. Thegarment sector in Nepal has shown anincreasing trend during the last decade;export earnings from this sector haveincreased threefold, and the total exportvolume has increased by 61 per cent. Theemployment share of women in the sectoris 15 per cent.7
Women workers are preferred byemployers primarily because of theinferior conditions of work and pay thatwomen are more willing to accept,including longer hours and unhealthy andoften hazardous factory conditions. Inaddition, women usually do not ask forpermanent contracts. They are thus easierto hire and fire at will, according toexternal demand conditions, and life cyclechanges such as marriage and childbirththat could be used to terminateemployment. Also the nature of theassembly line work, which is repetitiveand detailed, is more suited to youngwomen who can be more easily replaced.
Women’s employment in suchactivities has provided them better outletsand opportunities for earning an income,and as women become an important partof the export economy, they also gainsome social recognition for their work.This can easily be appreciated particularlyin the case of Bangladesh, where women’scontribution to export sector has gainedworldwide recognition. This has alsoreduced poverty among women from thepoorest villages who came to urbancentres to work for the garment industryrelated work, either in home-basedsettings or in garment factories.
The very process of women’s increasedparticipation in employment has set inmotion social and political changes thatare improving the bargaining position ofwomen, not only within their householdsbut also within the society and theeconomy. As more women are joining the
paid workforce, there is a greater socialpressure for improving their conditionsof work and security of contract.However, the features which have madewomen workers preferable to men inexport-oriented activities—increasingprofitability, flexibility of contractregarding hiring and firing, and noresponsibility on the part of employer toimprove the conditions of work—are theones which may make women less cheapand attractive as women workers becomea social force to be reckoned with. At atime when export industries are facing adeclining world demand for South Asia’stextile products, women’s employment inthis sector might decline as the terms oftheir employment improve.8
The reversal of feminisation ofemployment has been observed in otherparts of the developing world, especiallyin Latin America and East Asia. Thedeclining rate of increase in femaleemployment relative to men is oftenfound to be associated with an overalldecline in employment opportunities or ashift in the nature of new employmentrequirements toward more skilledactivities. But in case of South Asia, therising relative cost of women workersmay become an additional reason. InBangladesh, for example, the wage gapbetween men and women is alreadynarrowing in this sector. In India, duringlate 1990s, women’s employment in themanufacturing sector declined during aperiod of high growth of exports. Variousstudies showed that home-basedsubcontracting activities, often on piece-rate basis, might have substituted for self-employment or regular wage employmentof women in India.9
In South Asia, there has been aphenomenal increase in subcontractingdue to technology change that hasallowed disintegration of productionprocesses, leading to the outsourcing ofparts of a product. This also allows theemployer to avoid the country’s labourlaws that apply only in factory settings.Home-based workers, on the other hand,
90 Human Development in South Asia 2003
bear all costs of production from site,machinery, and utilities to health andsafety.
The most visible sign of feminisationof paid work and export orientation is inthe export processing zones (EPZs) ofSouth Asia. EPZs clearly show theemployers preference for female workersof a certain age group. The numericaldominance of women workers is acharacteristic feature of EPZs. Officially,EPZs are governed by the country’slabour laws, although they are outside thecustom territory. But if the EPZs aredeclared as public utilities, as they are inmost countries, country’s labour laws canbe breached with impunity.
Is it possible to ensure a minimumprovision of basic rights and privileges towomen workers and to improve theconditions of their work without erodingtheir attractiveness to employers, and thusreducing the extent of female wageemployment? How can such rights andbasic labour standards be assured in thecurrent phase of globalisation in which
intense export competition is combinedwith a declining world economy? Theissues related to labour laws and labourstandards, are discussed in chapter 7.
Policy implications
Under the current world economicdownturn, it is not easy to prescribepolicies that could be implemented toenhance women’s participation inemployment with better pay and workingconditions. In our previous reports wehad addressed some of these policy issuesand offered suggestions such as legislativeactions to establish the principle ofaffirmative action in building women’scapability, and providing them earningopportunities, as well as ensuringenforcement of such actions. But theimportant issue is a much bigger one—itis how to improve women’s status inSouth Asian society. These and otherpolicy issues will be discussed inchapter 9.
Under the currentworld economicdownturn, it is noteasy to prescribepolicies that couldbe implemented toenhance women’sparticipation inemployment
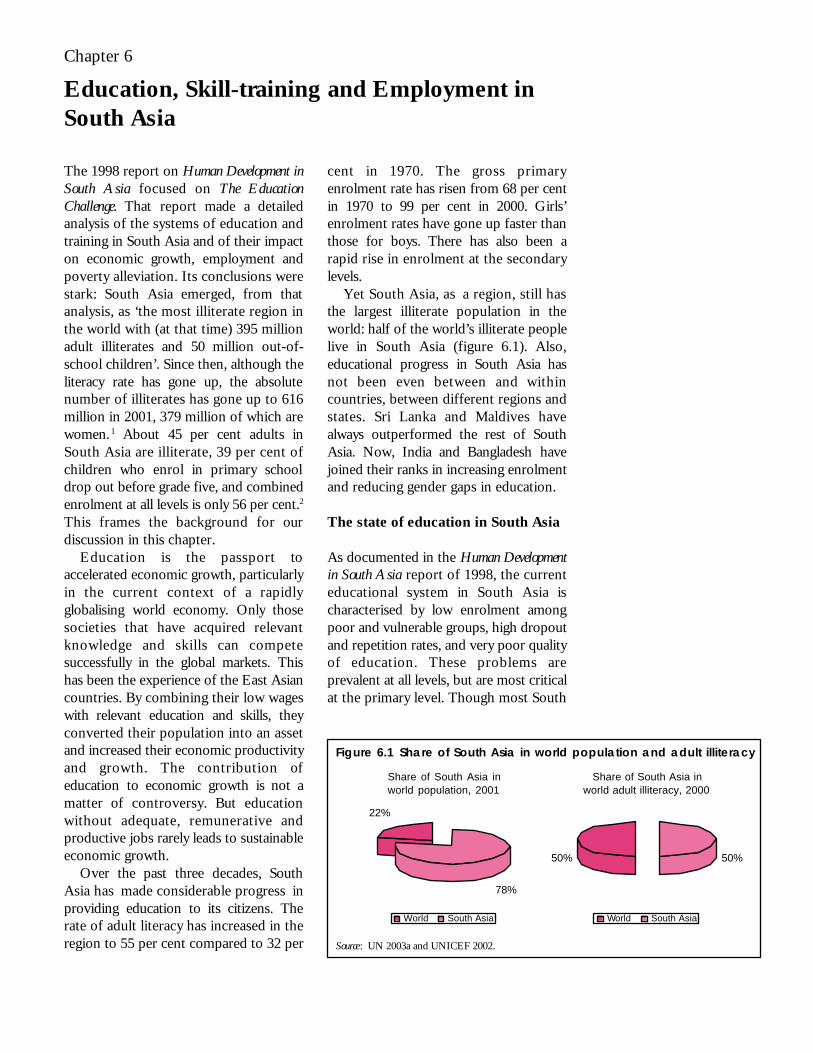
Education, Skill-training and Employment in South Asia 91
The 1998 report on Human Development inSouth Asia focused on The EducationChallenge. That report made a detailedanalysis of the systems of education andtraining in South Asia and of their impacton economic growth, employment andpoverty alleviation. Its conclusions werestark: South Asia emerged, from thatanalysis, as ‘the most illiterate region inthe world with (at that time) 395 millionadult illiterates and 50 million out-of-school children’. Since then, although theliteracy rate has gone up, the absolutenumber of illiterates has gone up to 616million in 2001, 379 million of which arewomen. 1 About 45 per cent adults inSouth Asia are illiterate, 39 per cent ofchildren who enrol in primary schooldrop out before grade five, and combinedenrolment at all levels is only 56 per cent.2
This frames the background for ourdiscussion in this chapter.
Education is the passport toaccelerated economic growth, particularlyin the current context of a rapidlyglobalising world economy. Only thosesocieties that have acquired relevantknowledge and skills can competesuccessfully in the global markets. Thishas been the experience of the East Asiancountries. By combining their low wageswith relevant education and skills, theyconverted their population into an assetand increased their economic productivityand growth. The contribution ofeducation to economic growth is not amatter of controversy. But educationwithout adequate, remunerative andproductive jobs rarely leads to sustainableeconomic growth.
Over the past three decades, SouthAsia has made considerable progress inproviding education to its citizens. Therate of adult literacy has increased in theregion to 55 per cent compared to 32 per
cent in 1970. The gross primaryenrolment rate has risen from 68 per centin 1970 to 99 per cent in 2000. Girls’enrolment rates have gone up faster thanthose for boys. There has also been arapid rise in enrolment at the secondarylevels.
Yet South Asia, as a region, still hasthe largest illiterate population in theworld: half of the world’s illiterate peoplelive in South Asia (figure 6.1). Also,educational progress in South Asia hasnot been even between and withincountries, between different regions andstates. Sri Lanka and Maldives havealways outperformed the rest of SouthAsia. Now, India and Bangladesh havejoined their ranks in increasing enrolmentand reducing gender gaps in education.
The state of education in South Asia
As documented in the Human Developmentin South Asia report of 1998, the currenteducational system in South Asia ischaracterised by low enrolment amongpoor and vulnerable groups, high dropoutand repetition rates, and very poor qualityof education. These problems areprevalent at all levels, but are most criticalat the primary level. Though most South
Chapter 6
Education, Skill-training and Employment inSouth Asia
Share of South Asia inworld adult illiteracy, 2000
22%
78%
50% 50%
World South AsiaWorld South Asia
Share of South Asia inworld population, 2001
Figure 6.1 Share of South Asia in world population and adult illiteracy
Source : UN 2003a and UNICEF 2002.
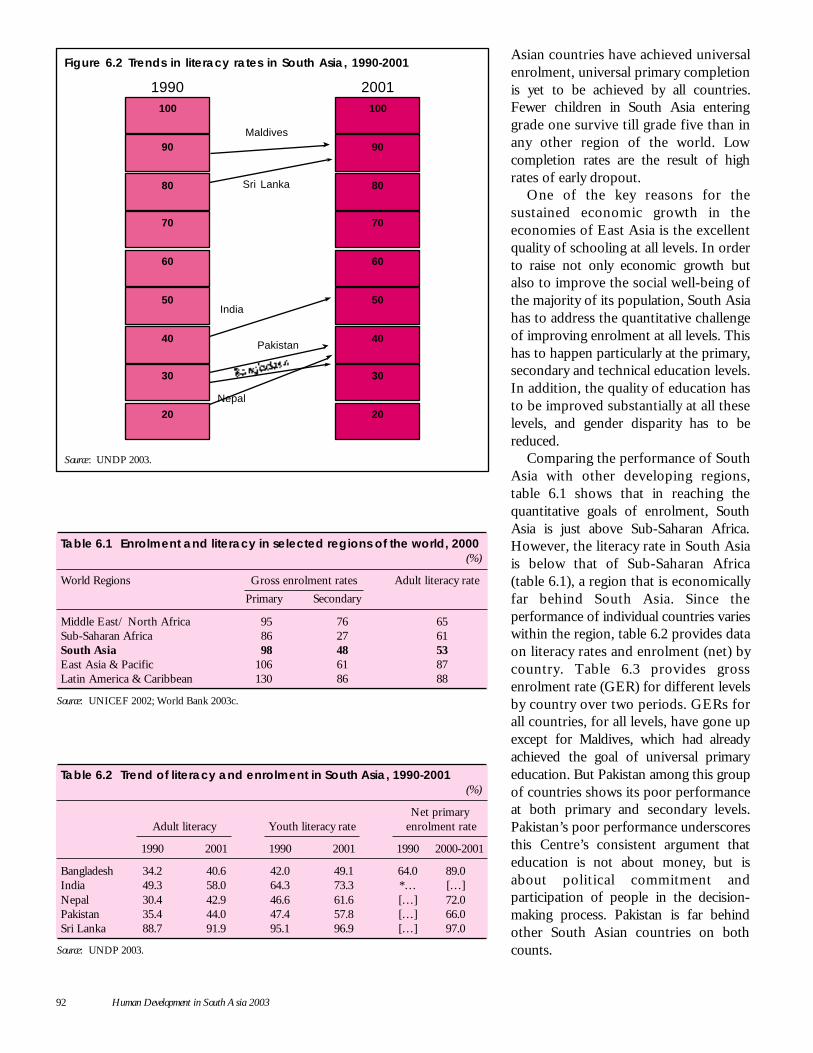
92 Human Development in South Asia 2003
Asian countries have achieved universalenrolment, universal primary completionis yet to be achieved by all countries.Fewer children in South Asia enteringgrade one survive till grade five than inany other region of the world. Lowcompletion rates are the result of highrates of early dropout.
One of the key reasons for thesustained economic growth in theeconomies of East Asia is the excellentquality of schooling at all levels. In orderto raise not only economic growth butalso to improve the social well-being ofthe majority of its population, South Asiahas to address the quantitative challengeof improving enrolment at all levels. Thishas to happen particularly at the primary,secondary and technical education levels.In addition, the quality of education hasto be improved substantially at all theselevels, and gender disparity has to bereduced.
Comparing the performance of SouthAsia with other developing regions,table 6.1 shows that in reaching thequantitative goals of enrolment, SouthAsia is just above Sub-Saharan Africa.However, the literacy rate in South Asiais below that of Sub-Saharan Africa(table 6.1), a region that is economicallyfar behind South Asia. Since theperformance of individual countries varieswithin the region, table 6.2 provides dataon literacy rates and enrolment (net) bycountry. Table 6.3 provides grossenrolment rate (GER) for different levelsby country over two periods. GERs forall countries, for all levels, have gone upexcept for Maldives, which had alreadyachieved the goal of universal primaryeducation. But Pakistan among this groupof countries shows its poor performanceat both primary and secondary levels.Pakistan’s poor performance underscoresthis Centre’s consistent argument thateducation is not about money, but isabout political commitment andparticipation of people in the decision-making process. Pakistan is far behindother South Asian countries on bothcounts.
30
20
40
50
60
70
80
90
100
30
20
40
50
60
70
80
90
100
1990 2001
Maldives
Sri Lanka
India
Pakistan
Nepal
Figure 6.2 Trends in literacy rates in South Asia, 1990-2001
Source : UNDP 2003.
Table 6.1 Enrolment and literacy in selected regions of the world, 2000(%)
World Regions Gross enrolment rates Adult literacy rate
Primary Secondary
Middle East/ North Africa 95 76 65Sub-Saharan Africa 86 27 61South Asia 98 48 53East Asia & Pacific 106 61 87Latin America & Caribbean 130 86 88
Source: UNICEF 2002; World Bank 2003c.
Table 6.2 Trend of literacy and enrolment in South Asia, 1990-2001(%)
Net primaryAdult literacy Youth literacy rate enrolment rate
1990 2001 1990 2001 1990 2000-2001
Bangladesh 34.2 40.6 42.0 49.1 64.0 89.0India 49.3 58.0 64.3 73.3 *… […]Nepal 30.4 42.9 46.6 61.6 […] 72.0Pakistan 35.4 44.0 47.4 57.8 […] 66.0Sri Lanka 88.7 91.9 95.1 96.9 […] 97.0
Source: UNDP 2003.
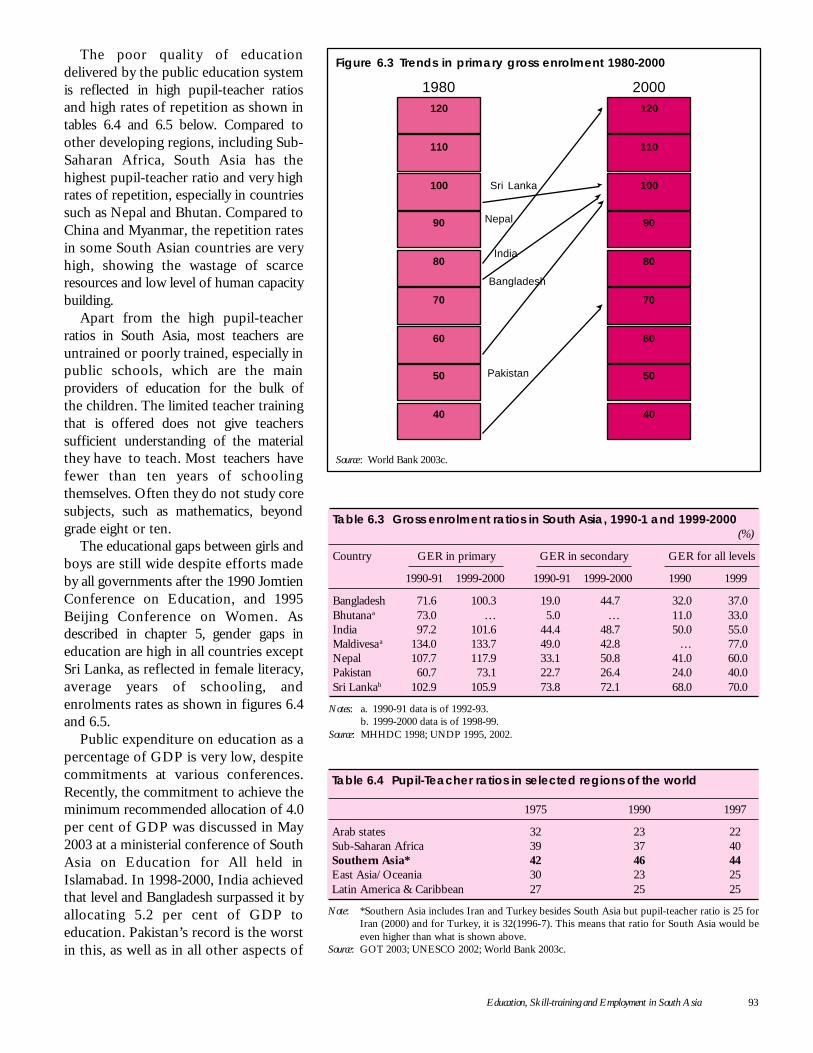
Education, Skill-training and Employment in South Asia 93
The poor quality of educationdelivered by the public education systemis reflected in high pupil-teacher ratiosand high rates of repetition as shown intables 6.4 and 6.5 below. Compared toother developing regions, including Sub-Saharan Africa, South Asia has thehighest pupil-teacher ratio and very highrates of repetition, especially in countriessuch as Nepal and Bhutan. Compared toChina and Myanmar, the repetition ratesin some South Asian countries are veryhigh, showing the wastage of scarceresources and low level of human capacitybuilding.
Apart from the high pupil-teacherratios in South Asia, most teachers areuntrained or poorly trained, especially inpublic schools, which are the mainproviders of education for the bulk ofthe children. The limited teacher trainingthat is offered does not give teacherssufficient understanding of the materialthey have to teach. Most teachers havefewer than ten years of schoolingthemselves. Often they do not study coresubjects, such as mathematics, beyondgrade eight or ten.
The educational gaps between girls andboys are still wide despite efforts madeby all governments after the 1990 JomtienConference on Education, and 1995Beijing Conference on Women. Asdescribed in chapter 5, gender gaps ineducation are high in all countries exceptSri Lanka, as reflected in female literacy,average years of schooling, andenrolments rates as shown in figures 6.4and 6.5.
Public expenditure on education as apercentage of GDP is very low, despitecommitments at various conferences.Recently, the commitment to achieve theminimum recommended allocation of 4.0per cent of GDP was discussed in May2003 at a ministerial conference of SouthAsia on Education for All held inIslamabad. In 1998-2000, India achievedthat level and Bangladesh surpassed it byallocating 5.2 per cent of GDP toeducation. Pakistan’s record is the worstin this, as well as in all other aspects of
50
40
60
70
80
90
100
110
120
50
40
60
70
80
90
100
110
120
1980 2000
Sri Lanka
India
Pakistan
Bangladesh
Nepal
Figure 6.3 Trends in primary gross enrolment 1980-2000
Source : World Bank 2003c.
Table 6.3 Gross enrolment ratios in South Asia, 1990-1 and 1999-2000(%)
Country GER in primary GER in secondary GER for all levels
1990-91 1999-2000 1990-91 1999-2000 1990 1999
Bangladesh 71.6 100.3 19.0 44.7 32.0 37.0Bhutanaa 73.0 … 5.0 … 11.0 33.0India 97.2 101.6 44.4 48.7 50.0 55.0Maldivesaa 134.0 133.7 49.0 42.8 … 77.0Nepal 107.7 117.9 33.1 50.8 41.0 60.0Pakistan 60.7 73.1 22.7 26.4 24.0 40.0Sri Lankab 102.9 105.9 73.8 72.1 68.0 70.0
Notes: a. 1990-91 data is of 1992-93.b. 1999-2000 data is of 1998-99.
Source: MHHDC 1998; UNDP 1995, 2002.
Table 6.4 Pupil-Teacher ratios in selected regions of the world
1975 1990 1997
Arab states 32 23 22Sub-Saharan Africa 39 37 40Southern Asia* 42 46 44East Asia/Oceania 30 23 25Latin America & Caribbean 27 25 25
Note: *Southern Asia includes Iran and Turkey besides South Asia but pupil-teacher ratio is 25 forIran (2000) and for Turkey, it is 32(1996-7). This means that ratio for South Asia would beeven higher than what is shown above.
Source: GOT 2003; UNESCO 2002; World Bank 2003c.
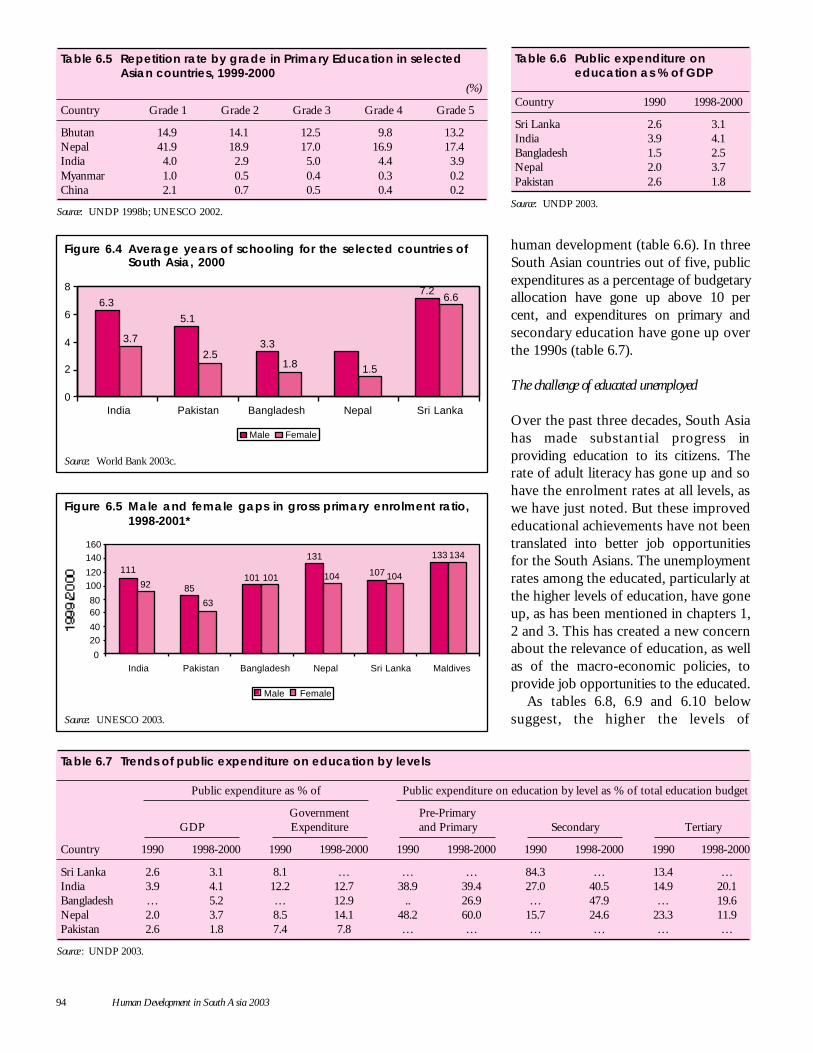
94 Human Development in South Asia 2003
human development (table 6.6). In threeSouth Asian countries out of five, publicexpenditures as a percentage of budgetaryallocation have gone up above 10 percent, and expenditures on primary andsecondary education have gone up overthe 1990s (table 6.7).
The challenge of educated unemployed
Over the past three decades, South Asiahas made substantial progress inproviding education to its citizens. Therate of adult literacy has gone up and sohave the enrolment rates at all levels, aswe have just noted. But these improvededucational achievements have not beentranslated into better job opportunitiesfor the South Asians. The unemploymentrates among the educated, particularly atthe higher levels of education, have goneup, as has been mentioned in chapters 1,2 and 3. This has created a new concernabout the relevance of education, as wellas of the macro-economic policies, toprovide job opportunities to the educated.
As tables 6.8, 6.9 and 6.10 belowsuggest, the higher the levels of
Table 6.5 Repetition rate by grade in Primary Education in selectedAsian countries, 1999-2000
(%)
Country Grade 1 Grade 2 Grade 3 Grade 4 Grade 5
Bhutan 14.9 14.1 12.5 9.8 13.2Nepal 41.9 18.9 17.0 16.9 17.4India 4.0 2.9 5.0 4.4 3.9Myanmar 1.0 0.5 0.4 0.3 0.2China 2.1 0.7 0.5 0.4 0.2
Source: UNDP 1998b; UNESCO 2002.
6.3
5.1
3.33.4
7.2
3.7
2.51.8 1.5
6.6
0
2
4
6
8
India Pakistan Bangladesh Nepal Sri Lanka
Source: World Bank 2003c.
Male Female
Figure 6.4 Average years of schooling for the selected countries ofSouth Asia, 2000
Source: UNESCO 2003.
Figure 6.5 Male and female gaps in gross primary enrolment ratio,1998-2001*
85101
131
107
133
63
101 104 104
134
0
2040
6080
100120
140160
India Pakistan Bangladesh Nepal Sri Lanka Maldives
Male Female
111
92
Table 6.6 Public expenditure oneducation as % of GDP
Country 1990 1998-2000
Sri Lanka 2.6 3.1India 3.9 4.1Bangladesh 1.5 2.5Nepal 2.0 3.7Pakistan 2.6 1.8
Source: UNDP 2003.
Table 6.7 Trends of public expenditure on education by levels
Public expenditure as % of Public expenditure on education by level as % of total education budget
Government Pre-PrimaryGDP Expenditure and Primary Secondary Tertiary
Country 1990 1998-2000 1990 1998-2000 1990 1998-2000 1990 1998-2000 1990 1998-2000
Sri Lanka 2.6 3.1 8.1 … … … 84.3 … 13.4 …India 3.9 4.1 12.2 12.7 38.9 39.4 27.0 40.5 14.9 20.1Bangladesh … 5.2 … 12.9 .. 26.9 … 47.9 … 19.6Nepal 2.0 3.7 8.5 14.1 48.2 60.0 15.7 24.6 23.3 11.9Pakistan 2.6 1.8 7.4 7.8 … … … … … …
Source : UNDP 2003.
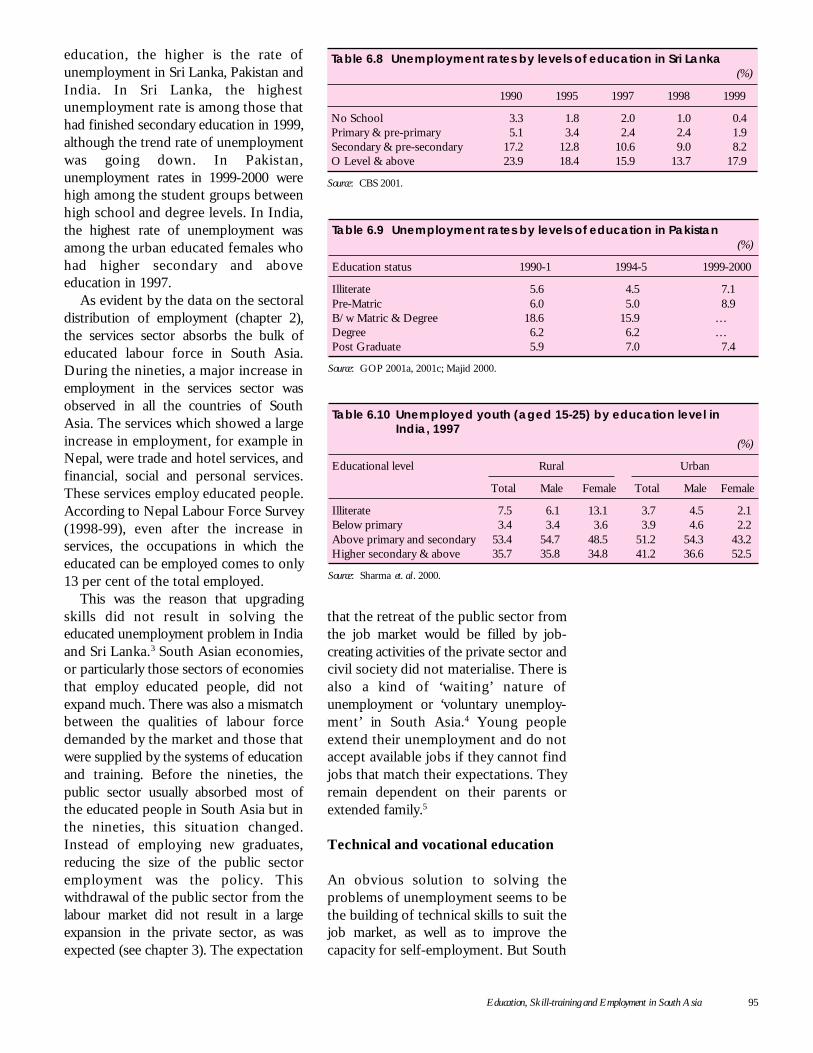
Education, Skill-training and Employment in South Asia 95
education, the higher is the rate ofunemployment in Sri Lanka, Pakistan andIndia. In Sri Lanka, the highestunemployment rate is among those thathad finished secondary education in 1999,although the trend rate of unemploymentwas going down. In Pakistan,unemployment rates in 1999-2000 werehigh among the student groups betweenhigh school and degree levels. In India,the highest rate of unemployment wasamong the urban educated females whohad higher secondary and aboveeducation in 1997.
As evident by the data on the sectoraldistribution of employment (chapter 2),the services sector absorbs the bulk ofeducated labour force in South Asia.During the nineties, a major increase inemployment in the services sector wasobserved in all the countries of SouthAsia. The services which showed a largeincrease in employment, for example inNepal, were trade and hotel services, andfinancial, social and personal services.These services employ educated people.According to Nepal Labour Force Survey(1998-99), even after the increase inservices, the occupations in which theeducated can be employed comes to only13 per cent of the total employed.
This was the reason that upgradingskills did not result in solving theeducated unemployment problem in Indiaand Sri Lanka.3 South Asian economies,or particularly those sectors of economiesthat employ educated people, did notexpand much. There was also a mismatchbetween the qualities of labour forcedemanded by the market and those thatwere supplied by the systems of educationand training. Before the nineties, thepublic sector usually absorbed most ofthe educated people in South Asia but inthe nineties, this situation changed.Instead of employing new graduates,reducing the size of the public sectoremployment was the policy. Thiswithdrawal of the public sector from thelabour market did not result in a largeexpansion in the private sector, as wasexpected (see chapter 3). The expectation
that the retreat of the public sector fromthe job market would be filled by job-creating activities of the private sector andcivil society did not materialise. There isalso a kind of ‘waiting’ nature ofunemployment or ‘voluntary unemploy-ment’ in South Asia.4 Young peopleextend their unemployment and do notaccept available jobs if they cannot findjobs that match their expectations. Theyremain dependent on their parents orextended family.5
Technical and vocational education
An obvious solution to solving theproblems of unemployment seems to bethe building of technical skills to suit thejob market, as well as to improve thecapacity for self-employment. But South
Table 6.8 Unemployment rates by levels of education in Sri Lanka(%)
1990 1995 1997 1998 1999
No School 3.3 1.8 2.0 1.0 0.4Primary & pre-primary 5.1 3.4 2.4 2.4 1.9Secondary & pre-secondary 17.2 12.8 10.6 9.0 8.2O Level & above 23.9 18.4 15.9 13.7 17.9
Source: CBS 2001.
Table 6.10 Unemployed youth (aged 15-25) by education level inIndia, 1997
(%)
Educational level Rural Urban
Total Male Female Total Male Female
Illiterate 7.5 6.1 13.1 3.7 4.5 2.1Below primary 3.4 3.4 3.6 3.9 4.6 2.2Above primary and secondary 53.4 54.7 48.5 51.2 54.3 43.2Higher secondary & above 35.7 35.8 34.8 41.2 36.6 52.5
Source: Sharma et. al . 2000.
Table 6.9 Unemployment rates by levels of education in Pakistan(%)
Education status 1990-1 1994-5 1999-2000
Illiterate 5.6 4.5 7.1Pre-Matric 6.0 5.0 8.9B/w Matric & Degree 18.6 15.9 …Degree 6.2 6.2 …Post Graduate 5.9 7.0 7.4
Source: GOP 2001a, 2001c; Majid 2000.
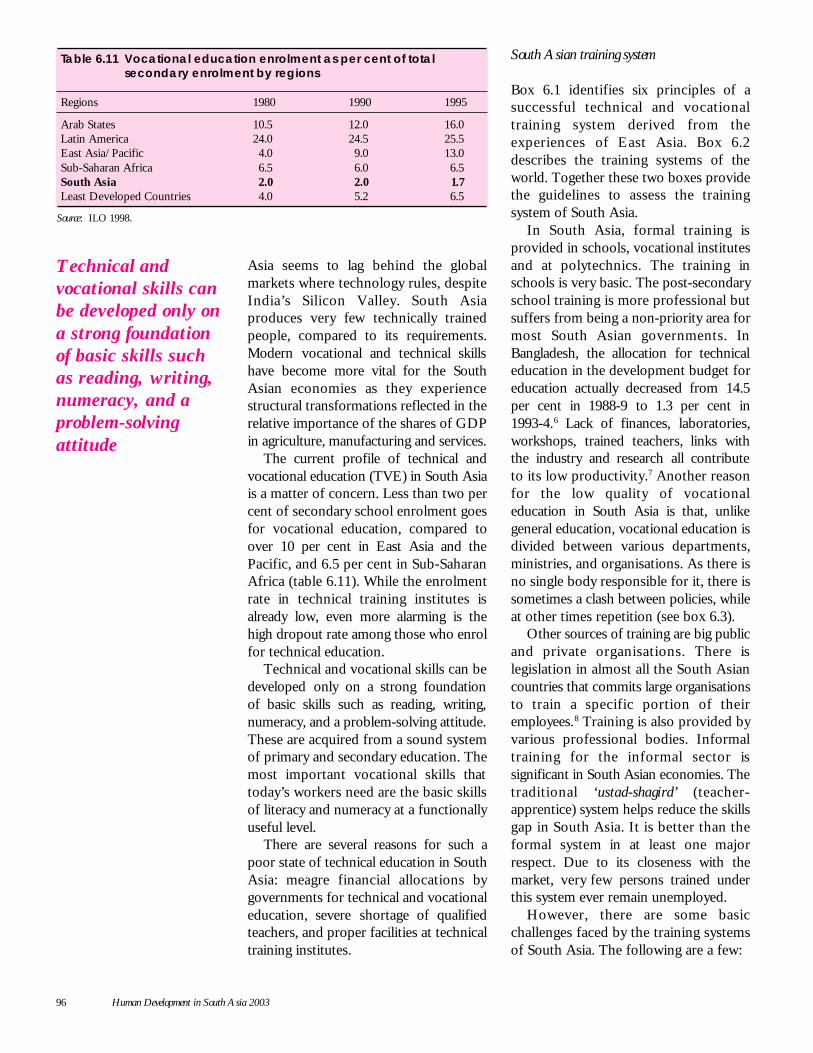
96 Human Development in South Asia 2003
Asia seems to lag behind the globalmarkets where technology rules, despiteIndia’s Silicon Valley. South Asiaproduces very few technically trainedpeople, compared to its requirements.Modern vocational and technical skillshave become more vital for the SouthAsian economies as they experiencestructural transformations reflected in therelative importance of the shares of GDPin agriculture, manufacturing and services.
The current profile of technical andvocational education (TVE) in South Asiais a matter of concern. Less than two percent of secondary school enrolment goesfor vocational education, compared toover 10 per cent in East Asia and thePacific, and 6.5 per cent in Sub-SaharanAfrica (table 6.11). While the enrolmentrate in technical training institutes isalready low, even more alarming is thehigh dropout rate among those who enrolfor technical education.
Technical and vocational skills can bedeveloped only on a strong foundationof basic skills such as reading, writing,numeracy, and a problem-solving attitude.These are acquired from a sound systemof primary and secondary education. Themost important vocational skills thattoday’s workers need are the basic skillsof literacy and numeracy at a functionallyuseful level.
There are several reasons for such apoor state of technical education in SouthAsia: meagre financial allocations bygovernments for technical and vocationaleducation, severe shortage of qualifiedteachers, and proper facilities at technicaltraining institutes.
South Asian training system
Box 6.1 identifies six principles of asuccessful technical and vocationaltraining system derived from theexperiences of East Asia. Box 6.2describes the training systems of theworld. Together these two boxes providethe guidelines to assess the trainingsystem of South Asia.
In South Asia, formal training isprovided in schools, vocational institutesand at polytechnics. The training inschools is very basic. The post-secondaryschool training is more professional butsuffers from being a non-priority area formost South Asian governments. InBangladesh, the allocation for technicaleducation in the development budget foreducation actually decreased from 14.5per cent in 1988-9 to 1.3 per cent in1993-4.6 Lack of finances, laboratories,workshops, trained teachers, links withthe industry and research all contributeto its low productivity.7 Another reasonfor the low quality of vocationaleducation in South Asia is that, unlikegeneral education, vocational education isdivided between various departments,ministries, and organisations. As there isno single body responsible for it, there issometimes a clash between policies, whileat other times repetition (see box 6.3).
Other sources of training are big publicand private organisations. There islegislation in almost all the South Asiancountries that commits large organisationsto train a specific portion of theiremployees.8 Training is also provided byvarious professional bodies. Informaltraining for the informal sector issignificant in South Asian economies. Thetraditional ‘ustad-shagird ’ (teacher-apprentice) system helps reduce the skillsgap in South Asia. It is better than theformal system in at least one majorrespect. Due to its closeness with themarket, very few persons trained underthis system ever remain unemployed.
However, there are some basicchallenges faced by the training systemsof South Asia. The following are a few:
Table 6.11 Vocational education enrolment as per cent of totalsecondary enrolment by regions
Regions 1980 1990 1995
Arab States 10.5 12.0 16.0Latin America 24.0 24.5 25.5East Asia/Pacific 4.0 9.0 13.0Sub-Saharan Africa 6.5 6.0 6.5South Asia 2.0 2.0 1.7Least Developed Countries 4.0 5.2 6.5
Source: ILO 1998.
Technical andvocational skills canbe developed only ona strong foundationof basic skills suchas reading, writing,numeracy, and aproblem-solvingattitude
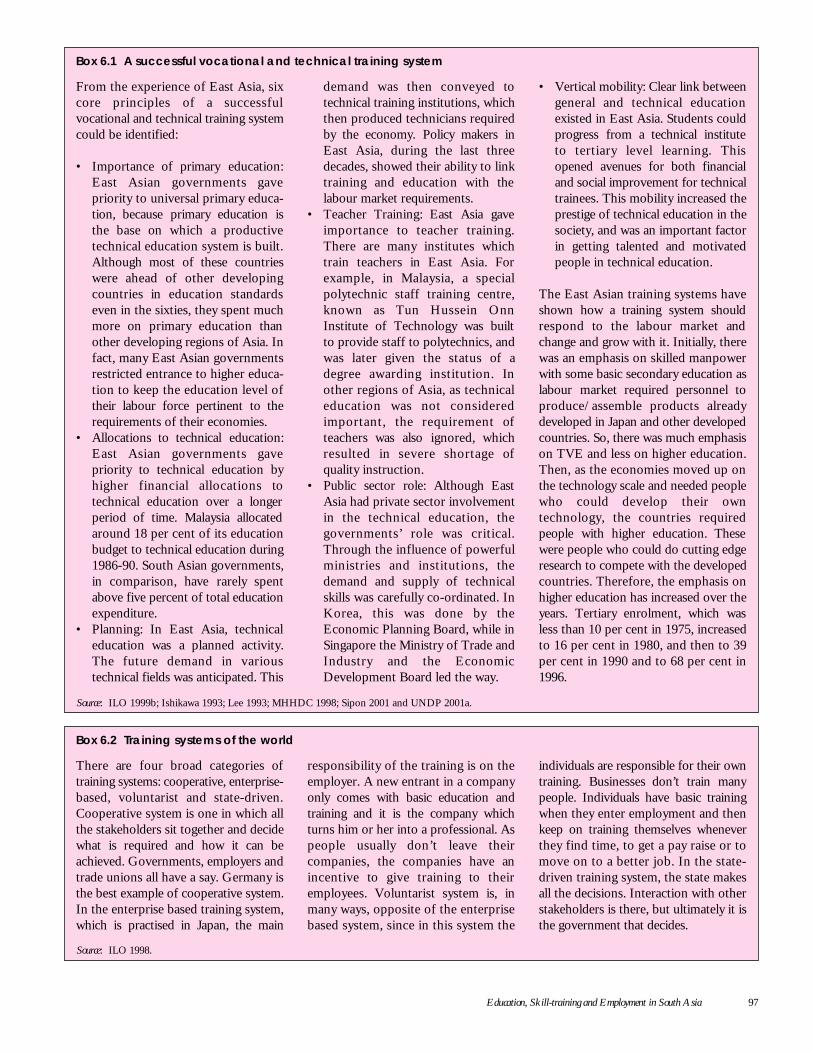
Education, Skill-training and Employment in South Asia 97
From the experience of East Asia, sixcore principles of a successfulvocational and technical training systemcould be identified:
• Importance of primary education:East Asian governments gavepriority to universal primary educa-tion, because primary education isthe base on which a productivetechnical education system is built.Although most of these countrieswere ahead of other developingcountries in education standardseven in the sixties, they spent muchmore on primary education thanother developing regions of Asia. Infact, many East Asian governmentsrestricted entrance to higher educa-tion to keep the education level oftheir labour force pertinent to therequirements of their economies.
• Allocations to technical education:East Asian governments gavepriority to technical education byhigher financial allocations totechnical education over a longerperiod of time. Malaysia allocatedaround 18 per cent of its educationbudget to technical education during1986-90. South Asian governments,in comparison, have rarely spentabove five percent of total educationexpenditure.
• Planning: In East Asia, technicaleducation was a planned activity.The future demand in varioustechnical fields was anticipated. This
Box 6.1 A successful vocational and technical training system
demand was then conveyed totechnical training institutions, whichthen produced technicians requiredby the economy. Policy makers inEast Asia, during the last threedecades, showed their ability to linktraining and education with thelabour market requirements.
• Teacher Training: East Asia gaveimportance to teacher training.There are many institutes whichtrain teachers in East Asia. Forexample, in Malaysia, a specialpolytechnic staff training centre,known as Tun Hussein OnnInstitute of Technology was builtto provide staff to polytechnics, andwas later given the status of adegree awarding institution. Inother regions of Asia, as technicaleducation was not consideredimportant, the requirement ofteachers was also ignored, whichresulted in severe shortage ofquality instruction.
• Public sector role: Although EastAsia had private sector involvementin the technical education, thegovernments’ role was critical.Through the influence of powerfulministries and institutions, thedemand and supply of technicalskills was carefully co-ordinated. InKorea, this was done by theEconomic Planning Board, while inSingapore the Ministry of Trade andIndustry and the EconomicDevelopment Board led the way.
• Vertical mobility: Clear link betweengeneral and technical educationexisted in East Asia. Students couldprogress from a technical instituteto tertiary level learning. Thisopened avenues for both financialand social improvement for technicaltrainees. This mobility increased theprestige of technical education in thesociety, and was an important factorin getting talented and motivatedpeople in technical education.
The East Asian training systems haveshown how a training system shouldrespond to the labour market andchange and grow with it. Initially, therewas an emphasis on skilled manpowerwith some basic secondary education aslabour market required personnel toproduce/assemble products alreadydeveloped in Japan and other developedcountries. So, there was much emphasison TVE and less on higher education.Then, as the economies moved up onthe technology scale and needed peoplewho could develop their owntechnology, the countries requiredpeople with higher education. Thesewere people who could do cutting edgeresearch to compete with the developedcountries. Therefore, the emphasis onhigher education has increased over theyears. Tertiary enrolment, which wasless than 10 per cent in 1975, increasedto 16 per cent in 1980, and then to 39per cent in 1990 and to 68 per cent in1996.
Source: ILO 1999b; Ishikawa 1993; Lee 1993; MHHDC 1998; Sipon 2001 and UNDP 2001a.
There are four broad categories oftraining systems: cooperative, enterprise-based, voluntarist and state-driven.Cooperative system is one in which allthe stakeholders sit together and decidewhat is required and how it can beachieved. Governments, employers andtrade unions all have a say. Germany isthe best example of cooperative system.In the enterprise based training system,which is practised in Japan, the main
Box 6.2 Training systems of the world
responsibility of the training is on theemployer. A new entrant in a companyonly comes with basic education andtraining and it is the company whichturns him or her into a professional. Aspeople usually don’t leave theircompanies, the companies have anincentive to give training to theiremployees. Voluntarist system is, inmany ways, opposite of the enterprisebased system, since in this system the
individuals are responsible for their owntraining. Businesses don’t train manypeople. Individuals have basic trainingwhen they enter employment and thenkeep on training themselves wheneverthey find time, to get a pay raise or tomove on to a better job. In the state-driven training system, the state makesall the decisions. Interaction with otherstakeholders is there, but ultimately it isthe government that decides.
Source: ILO 1998.
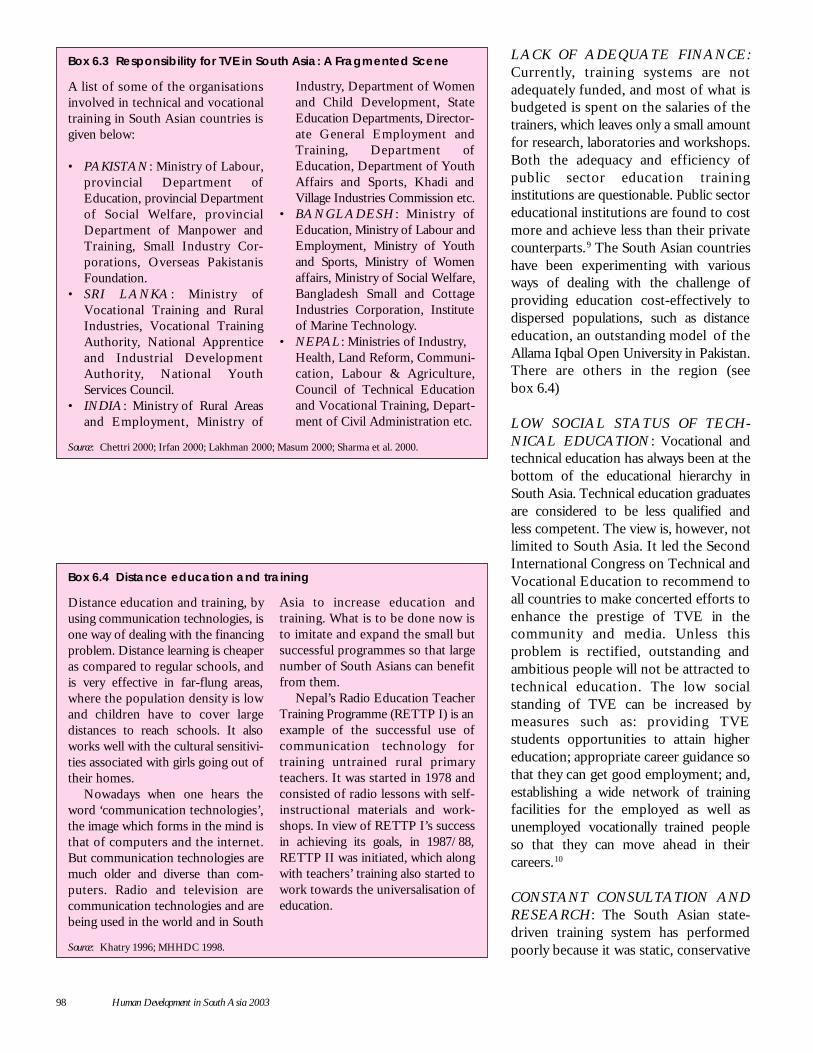
98 Human Development in South Asia 2003
LACK OF ADEQUATE FINANCE:Currently, training systems are notadequately funded, and most of what isbudgeted is spent on the salaries of thetrainers, which leaves only a small amountfor research, laboratories and workshops.Both the adequacy and efficiency ofpublic sector education traininginstitutions are questionable. Public sectoreducational institutions are found to costmore and achieve less than their privatecounterparts. 9 The South Asian countrieshave been experimenting with variousways of dealing with the challenge ofproviding education cost-effectively todispersed populations, such as distanceeducation, an outstanding model of theAllama Iqbal Open University in Pakistan.There are others in the region (seebox 6.4)
LOW SOCIAL STATUS OF TECH-NICAL EDUCATION : Vocational andtechnical education has always been at thebottom of the educational hierarchy inSouth Asia. Technical education graduatesare considered to be less qualified andless competent. The view is, however, notlimited to South Asia. It led the SecondInternational Congress on Technical andVocational Education to recommend toall countries to make concerted efforts toenhance the prestige of TVE in thecommunity and media. Unless thisproblem is rectified, outstanding andambitious people will not be attracted totechnical education. The low socialstanding of TVE can be increased bymeasures such as: providing TVEstudents opportunities to attain highereducation; appropriate career guidance sothat they can get good employment; and,establishing a wide network of trainingfacilities for the employed as well asunemployed vocationally trained peopleso that they can move ahead in theircareers.10
CONSTANT CONSULTATION ANDRESEARCH: The South Asian state-driven training system has performedpoorly because it was static, conservative
Box 6.3 Responsibility for TVE in South Asia: A Fragmented Scene
A list of some of the organisationsinvolved in technical and vocationaltraining in South Asian countries isgiven below:
• PAKISTAN : Ministry of Labour,provincial Department ofEducation, provincial Departmentof Social Welfare, provincialDepartment of Manpower andTraining, Small Industry Cor-porations, Overseas PakistanisFoundation.
• SRI LANKA : Ministry ofVocational Training and RuralIndustries, Vocational TrainingAuthority, National Apprenticeand Industrial DevelopmentAuthority, National YouthServices Council.
• INDIA: Ministry of Rural Areasand Employment, Ministry of
Industry, Department of Womenand Child Development, StateEducation Departments, Director-ate General Employment andTraining, Department ofEducation, Department of YouthAffairs and Sports, Khadi andVillage Industries Commission etc.
• BANGLADESH : Ministry ofEducation, Ministry of Labour andEmployment, Ministry of Youthand Sports, Ministry of Womenaffairs, Ministry of Social Welfare,Bangladesh Small and CottageIndustries Corporation, Instituteof Marine Technology.
• NEPAL: Ministries of Industry,Health, Land Reform, Communi-cation, Labour & Agriculture,Council of Technical Educationand Vocational Training, Depart-ment of Civil Administration etc.
Source: Chettri 2000; Irfan 2000; Lakhman 2000; Masum 2000; Sharma et al. 2000.
Box 6.4 Distance education and training
Distance education and training, byusing communication technologies, isone way of dealing with the financingproblem. Distance learning is cheaperas compared to regular schools, andis very effective in far-flung areas,where the population density is lowand children have to cover largedistances to reach schools. It alsoworks well with the cultural sensitivi-ties associated with girls going out oftheir homes.
Nowadays when one hears theword ‘communication technologies’,the image which forms in the mind isthat of computers and the internet.But communication technologies aremuch older and diverse than com-puters. Radio and television arecommunication technologies and arebeing used in the world and in South
Asia to increase education andtraining. What is to be done now isto imitate and expand the small butsuccessful programmes so that largenumber of South Asians can benefitfrom them.
Nepal’s Radio Education TeacherTraining Programme (RETTP I) is anexample of the successful use ofcommunication technology fortraining untrained rural primaryteachers. It was started in 1978 andconsisted of radio lessons with self-instructional materials and work-shops. In view of RETTP I’s successin achieving its goals, in 1987/88,RETTP II was initiated, which alongwith teachers’ training also started towork towards the universalisation ofeducation.
Source: Khatry 1996; MHHDC 1998.
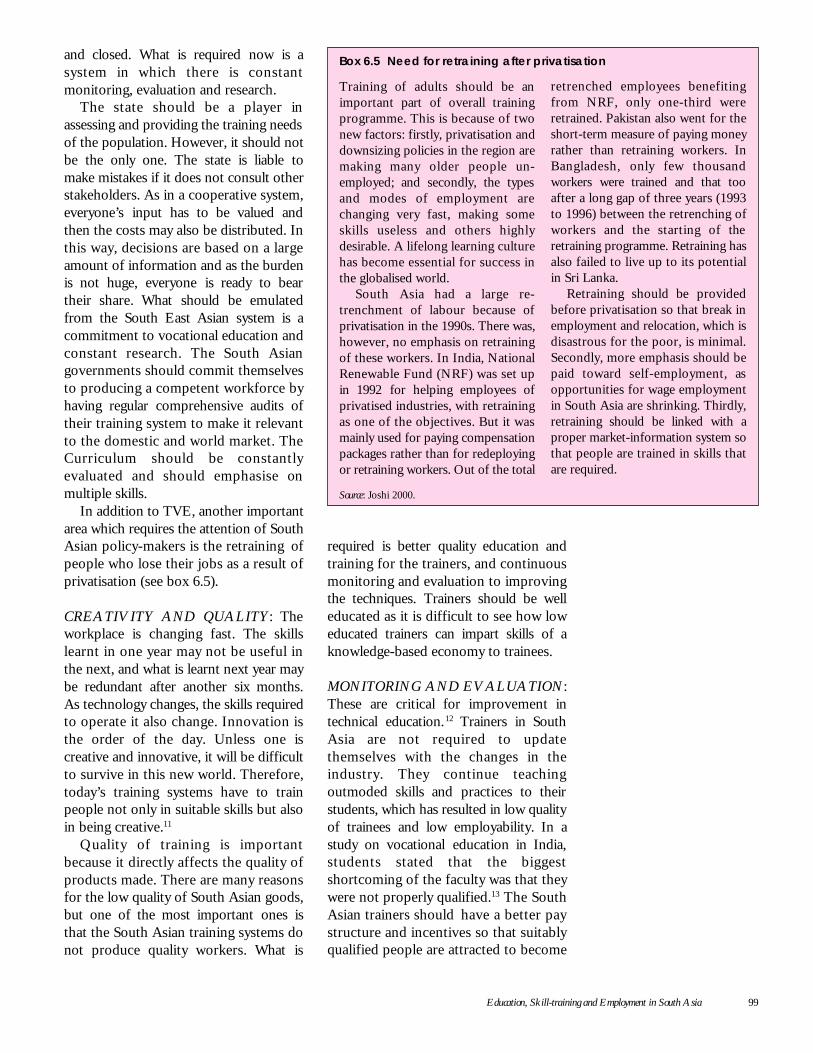
Education, Skill-training and Employment in South Asia 99
and closed. What is required now is asystem in which there is constantmonitoring, evaluation and research.
The state should be a player inassessing and providing the training needsof the population. However, it should notbe the only one. The state is liable tomake mistakes if it does not consult otherstakeholders. As in a cooperative system,everyone’s input has to be valued andthen the costs may also be distributed. Inthis way, decisions are based on a largeamount of information and as the burdenis not huge, everyone is ready to beartheir share. What should be emulatedfrom the South East Asian system is acommitment to vocational education andconstant research. The South Asiangovernments should commit themselvesto producing a competent workforce byhaving regular comprehensive audits oftheir training system to make it relevantto the domestic and world market. TheCurriculum should be constantlyevaluated and should emphasise onmultiple skills.
In addition to TVE, another importantarea which requires the attention of SouthAsian policy-makers is the retraining ofpeople who lose their jobs as a result ofprivatisation (see box 6.5).
CREATIVITY AND QUALITY: Theworkplace is changing fast. The skillslearnt in one year may not be useful inthe next, and what is learnt next year maybe redundant after another six months.As technology changes, the skills requiredto operate it also change. Innovation isthe order of the day. Unless one iscreative and innovative, it will be difficultto survive in this new world. Therefore,today’s training systems have to trainpeople not only in suitable skills but alsoin being creative.11
Quality of training is importantbecause it directly affects the quality ofproducts made. There are many reasonsfor the low quality of South Asian goods,but one of the most important ones isthat the South Asian training systems donot produce quality workers. What is
required is better quality education andtraining for the trainers, and continuousmonitoring and evaluation to improvingthe techniques. Trainers should be welleducated as it is difficult to see how loweducated trainers can impart skills of aknowledge-based economy to trainees.
MONITORING AND EVALUATION:These are critical for improvement intechnical education.12 Trainers in SouthAsia are not required to updatethemselves with the changes in theindustry. They continue teachingoutmoded skills and practices to theirstudents, which has resulted in low qualityof trainees and low employability. In astudy on vocational education in India,students stated that the biggestshortcoming of the faculty was that theywere not properly qualified.13 The SouthAsian trainers should have a better paystructure and incentives so that suitablyqualified people are attracted to become
Box 6.5 Need for retraining after privatisation
Training of adults should be animportant part of overall trainingprogramme. This is because of twonew factors: firstly, privatisation anddownsizing policies in the region aremaking many older people un-employed; and secondly, the typesand modes of employment arechanging very fast, making someskills useless and others highlydesirable. A lifelong learning culturehas become essential for success inthe globalised world.
South Asia had a large re-trenchment of labour because ofprivatisation in the 1990s. There was,however, no emphasis on retrainingof these workers. In India, NationalRenewable Fund (NRF) was set upin 1992 for helping employees ofprivatised industries, with retrainingas one of the objectives. But it wasmainly used for paying compensationpackages rather than for redeployingor retraining workers. Out of the total
retrenched employees benefitingfrom NRF, only one-third wereretrained. Pakistan also went for theshort-term measure of paying moneyrather than retraining workers. InBangladesh, only few thousandworkers were trained and that tooafter a long gap of three years (1993to 1996) between the retrenching ofworkers and the starting of theretraining programme. Retraining hasalso failed to live up to its potentialin Sri Lanka.
Retraining should be providedbefore privatisation so that break inemployment and relocation, which isdisastrous for the poor, is minimal.Secondly, more emphasis should bepaid toward self-employment, asopportunities for wage employmentin South Asia are shrinking. Thirdly,retraining should be linked with aproper market-information system sothat people are trained in skills thatare required.
Source: Joshi 2000.
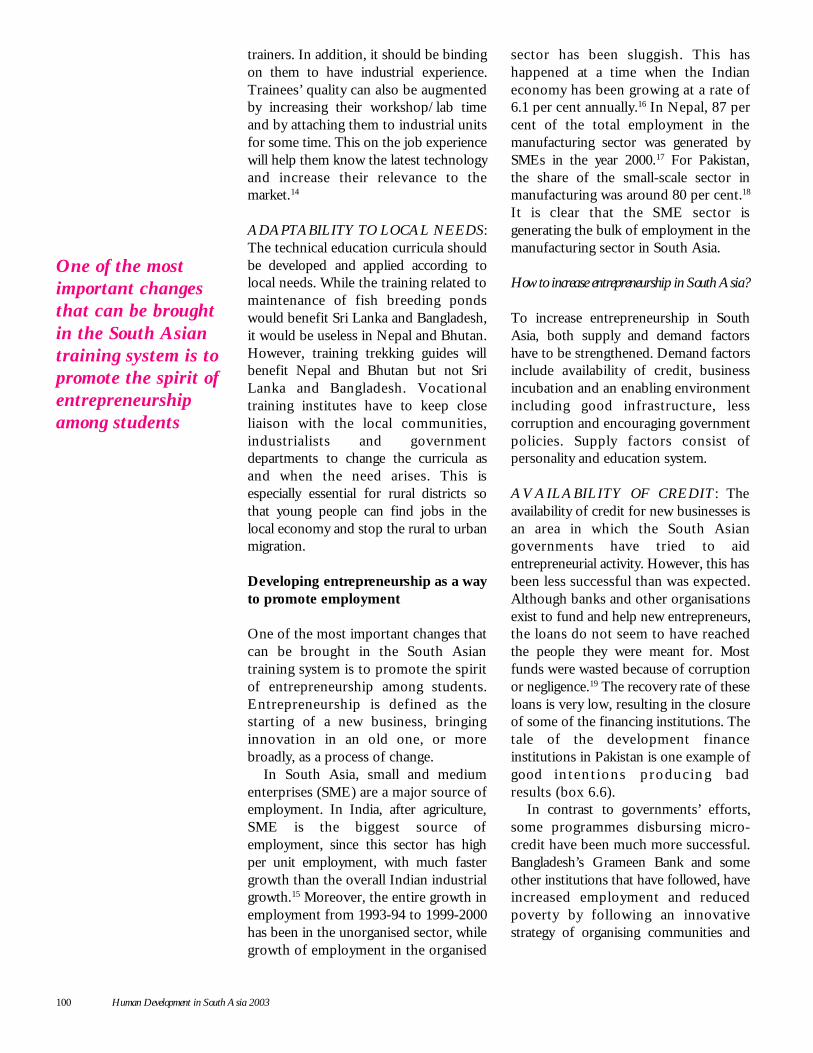
100 Human Development in South Asia 2003
trainers. In addition, it should be bindingon them to have industrial experience.Trainees’ quality can also be augmentedby increasing their workshop/lab timeand by attaching them to industrial unitsfor some time. This on the job experiencewill help them know the latest technologyand increase their relevance to themarket.14
ADAPTABILITY TO LOCAL NEEDS:The technical education curricula shouldbe developed and applied according tolocal needs. While the training related tomaintenance of fish breeding pondswould benefit Sri Lanka and Bangladesh,it would be useless in Nepal and Bhutan.However, training trekking guides willbenefit Nepal and Bhutan but not SriLanka and Bangladesh. Vocationaltraining institutes have to keep closeliaison with the local communities,industrialists and governmentdepartments to change the curricula asand when the need arises. This isespecially essential for rural districts sothat young people can find jobs in thelocal economy and stop the rural to urbanmigration.
Developing entrepreneurship as a wayto promote employment
One of the most important changes thatcan be brought in the South Asiantraining system is to promote the spiritof entrepreneurship among students.Entrepreneurship is defined as thestarting of a new business, bringinginnovation in an old one, or morebroadly, as a process of change.
In South Asia, small and mediumenterprises (SME) are a major source ofemployment. In India, after agriculture,SME is the biggest source ofemployment, since this sector has highper unit employment, with much fastergrowth than the overall Indian industrialgrowth.15 Moreover, the entire growth inemployment from 1993-94 to 1999-2000has been in the unorganised sector, whilegrowth of employment in the organised
sector has been sluggish. This hashappened at a time when the Indianeconomy has been growing at a rate of6.1 per cent annually.16 In Nepal, 87 percent of the total employment in themanufacturing sector was generated bySMEs in the year 2000.17 For Pakistan,the share of the small-scale sector inmanufacturing was around 80 per cent.18
It is clear that the SME sector isgenerating the bulk of employment in themanufacturing sector in South Asia.
How to increase entrepreneurship in South Asia?
To increase entrepreneurship in SouthAsia, both supply and demand factorshave to be strengthened. Demand factorsinclude availability of credit, businessincubation and an enabling environmentincluding good infrastructure, lesscorruption and encouraging governmentpolicies. Supply factors consist ofpersonality and education system.
AVAILABILITY OF CREDIT : Theavailability of credit for new businesses isan area in which the South Asiangovernments have tried to aidentrepreneurial activity. However, this hasbeen less successful than was expected.Although banks and other organisationsexist to fund and help new entrepreneurs,the loans do not seem to have reachedthe people they were meant for. Mostfunds were wasted because of corruptionor negligence.19 The recovery rate of theseloans is very low, resulting in the closureof some of the financing institutions. Thetale of the development financeinstitutions in Pakistan is one example ofgood in tent ions produc ing badresults (box 6.6).
In contrast to governments’ efforts,some programmes disbursing micro-credit have been much more successful.Bangladesh’s Grameen Bank and someother institutions that have followed, haveincreased employment and reducedpoverty by following an innovativestrategy of organising communities and
One of the mostimportant changesthat can be broughtin the South Asiantraining system is topromote the spirit ofentrepreneurshipamong students
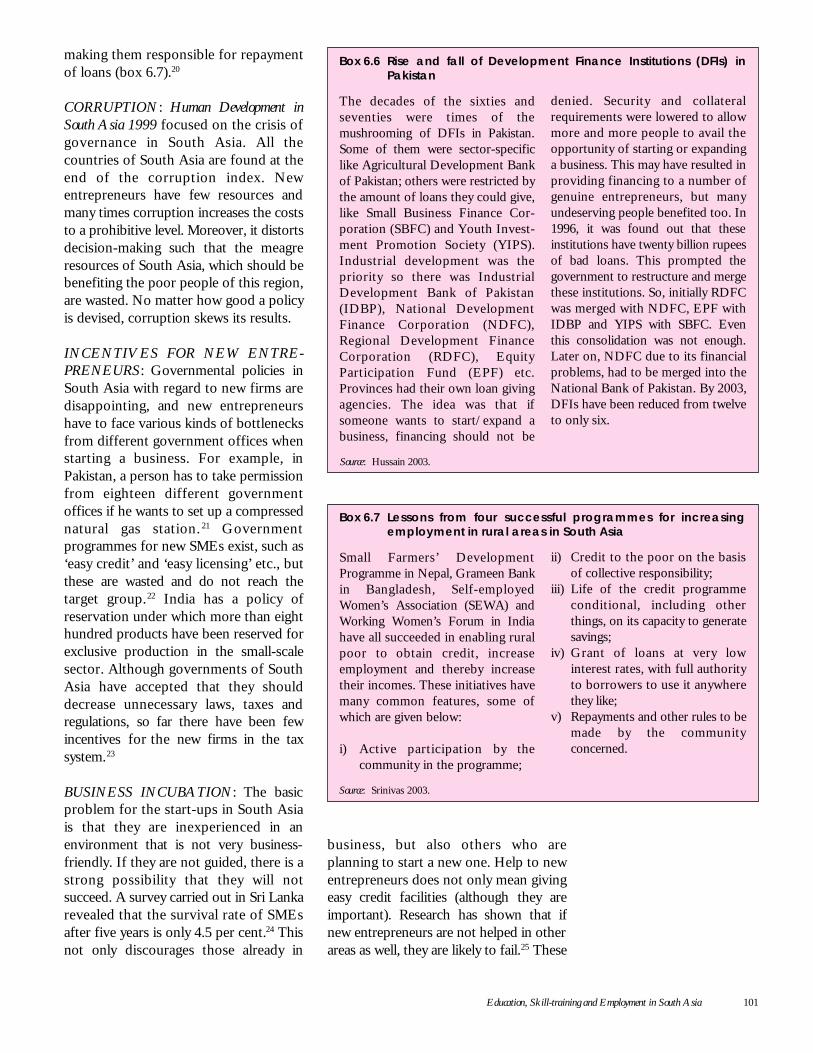
Education, Skill-training and Employment in South Asia 101
making them responsible for repaymentof loans (box 6.7).20
CORRUPTION: Human Development inSouth Asia 1999 focused on the crisis ofgovernance in South Asia. All thecountries of South Asia are found at theend of the corruption index. Newentrepreneurs have few resources andmany times corruption increases the coststo a prohibitive level. Moreover, it distortsdecision-making such that the meagreresources of South Asia, which should bebenefiting the poor people of this region,are wasted. No matter how good a policyis devised, corruption skews its results.
INCENTIVES FOR NEW ENTRE-PRENEURS : Governmental policies inSouth Asia with regard to new firms aredisappointing, and new entrepreneurshave to face various kinds of bottlenecksfrom different government offices whenstarting a business. For example, inPakistan, a person has to take permissionfrom eighteen different governmentoffices if he wants to set up a compressednatural gas station. 21 Governmentprogrammes for new SMEs exist, such as‘easy credit’ and ‘easy licensing’ etc., butthese are wasted and do not reach thetarget group. 22 India has a policy ofreservation under which more than eighthundred products have been reserved forexclusive production in the small-scalesector. Although governments of SouthAsia have accepted that they shoulddecrease unnecessary laws, taxes andregulations, so far there have been fewincentives for the new firms in the taxsystem.23
BUSINESS INCUBATION: The basicproblem for the start-ups in South Asiais that they are inexperienced in anenvironment that is not very business-friendly. If they are not guided, there is astrong possibility that they will notsucceed. A survey carried out in Sri Lankarevealed that the survival rate of SMEsafter five years is only 4.5 per cent.24 Thisnot only discourages those already in
business, but also others who areplanning to start a new one. Help to newentrepreneurs does not only mean givingeasy credit facilities (although they areimportant). Research has shown that ifnew entrepreneurs are not helped in otherareas as well, they are likely to fail.25 These
Box 6.7 Lessons from four successful programmes for increasingemployment in rural areas in South Asia
Small Farmers’ DevelopmentProgramme in Nepal, Grameen Bankin Bangladesh, Self-employedWomen’s Association (SEWA) andWorking Women’s Forum in Indiahave all succeeded in enabling ruralpoor to obtain credit, increaseemployment and thereby increasetheir incomes. These initiatives havemany common features, some ofwhich are given below:
i) Active participation by thecommunity in the programme;
ii) Credit to the poor on the basisof collective responsibility;
iii) Life of the credit programmeconditional, including otherthings, on its capacity to generatesavings;
iv) Grant of loans at very lowinterest rates, with full authorityto borrowers to use it anywherethey like;
v) Repayments and other rules to bemade by the communityconcerned.
Source: Srinivas 2003.
Box 6.6 Rise and fall of Development Finance Institutions (DFIs) inPakistan
The decades of the sixties andseventies were times of themushrooming of DFIs in Pakistan.Some of them were sector-specificlike Agricultural Development Bankof Pakistan; others were restricted bythe amount of loans they could give,like Small Business Finance Cor-poration (SBFC) and Youth Invest-ment Promotion Society (YIPS).Industrial development was thepriority so there was IndustrialDevelopment Bank of Pakistan(IDBP), National DevelopmentFinance Corporation (NDFC),Regional Development FinanceCorporation (RDFC), EquityParticipation Fund (EPF) etc.Provinces had their own loan givingagencies. The idea was that ifsomeone wants to start/expand abusiness, financing should not be
denied. Security and collateralrequirements were lowered to allowmore and more people to avail theopportunity of starting or expandinga business. This may have resulted inproviding financing to a number ofgenuine entrepreneurs, but manyundeserving people benefited too. In1996, it was found out that theseinstitutions have twenty billion rupeesof bad loans. This prompted thegovernment to restructure and mergethese institutions. So, initially RDFCwas merged with NDFC, EPF withIDBP and YIPS with SBFC. Eventhis consolidation was not enough.Later on, NDFC due to its financialproblems, had to be merged into theNational Bank of Pakistan. By 2003,DFIs have been reduced from twelveto only six.
Source: Hussain 2003.
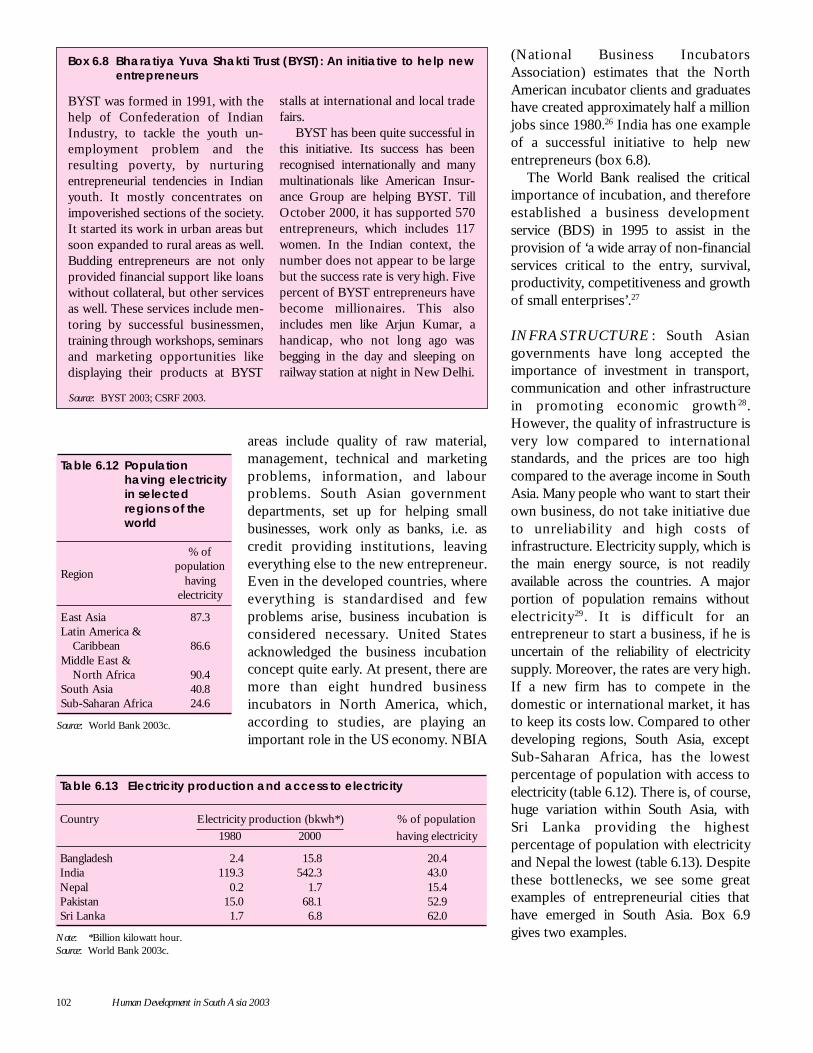
102 Human Development in South Asia 2003
areas include quality of raw material,management, technical and marketingproblems, information, and labourproblems. South Asian governmentdepartments, set up for helping smallbusinesses, work only as banks, i.e. ascredit providing institutions, leavingeverything else to the new entrepreneur.Even in the developed countries, whereeverything is standardised and fewproblems arise, business incubation isconsidered necessary. United Statesacknowledged the business incubationconcept quite early. At present, there aremore than eight hundred businessincubators in North America, which,according to studies, are playing animportant role in the US economy. NBIA
(National Business IncubatorsAssociation) estimates that the NorthAmerican incubator clients and graduateshave created approximately half a millionjobs since 1980.26 India has one exampleof a successful initiative to help newentrepreneurs (box 6.8).
The World Bank realised the criticalimportance of incubation, and thereforeestablished a business developmentservice (BDS) in 1995 to assist in theprovision of ‘a wide array of non-financialservices critical to the entry, survival,productivity, competitiveness and growthof small enterprises’.27
INFRASTRUCTURE : South Asiangovernments have long accepted theimportance of investment in transport,communication and other infrastructurein promoting economic growth 28.However, the quality of infrastructure isvery low compared to internationalstandards, and the prices are too highcompared to the average income in SouthAsia. Many people who want to start theirown business, do not take initiative dueto unreliability and high costs ofinfrastructure. Electricity supply, which isthe main energy source, is not readilyavailable across the countries. A majorportion of population remains withoutelectricity 29 . It is difficult for anentrepreneur to start a business, if he isuncertain of the reliability of electricitysupply. Moreover, the rates are very high.If a new firm has to compete in thedomestic or international market, it hasto keep its costs low. Compared to otherdeveloping regions, South Asia, exceptSub-Saharan Africa, has the lowestpercentage of population with access toelectricity (table 6.12). There is, of course,huge variation within South Asia, withSri Lanka providing the highestpercentage of population with electricityand Nepal the lowest (table 6.13). Despitethese bottlenecks, we see some greatexamples of entrepreneurial cities thathave emerged in South Asia. Box 6.9gives two examples.
Box 6.8 Bharatiya Yuva Shakti Trust (BYST): An initiative to help newentrepreneurs
BYST was formed in 1991, with thehelp of Confederation of IndianIndustry, to tackle the youth un-employment problem and theresulting poverty, by nurturingentrepreneurial tendencies in Indianyouth. It mostly concentrates onimpoverished sections of the society.It started its work in urban areas butsoon expanded to rural areas as well.Budding entrepreneurs are not onlyprovided financial support like loanswithout collateral, but other servicesas well. These services include men-toring by successful businessmen,training through workshops, seminarsand marketing opportunities likedisplaying their products at BYST
stalls at international and local tradefairs.
BYST has been quite successful inthis initiative. Its success has beenrecognised internationally and manymultinationals like American Insur-ance Group are helping BYST. TillOctober 2000, it has supported 570entrepreneurs, which includes 117women. In the Indian context, thenumber does not appear to be largebut the success rate is very high. Fivepercent of BYST entrepreneurs havebecome millionaires. This alsoincludes men like Arjun Kumar, ahandicap, who not long ago wasbegging in the day and sleeping onrailway station at night in New Delhi.
Source: BYST 2003; CSRF 2003.
Table 6.12 Populationhaving electricityin selectedregions of theworld
% ofpopulation
Region havingelectricity
East Asia 87.3Latin America &
Caribbean 86.6Middle East &
North Africa 90.4South Asia 40.8Sub-Saharan Africa 24.6
Source: World Bank 2003c.
Table 6.13 Electricity production and access to electricity
Country Electricity production (bkwh*) % of population
1980 2000 having electricity
Bangladesh 2.4 15.8 20.4India 119.3 542.3 43.0Nepal 0.2 1.7 15.4Pakistan 15.0 68.1 52.9Sri Lanka 1.7 6.8 62.0
Note: *Billion kilowatt hour.Source: World Bank 2003c.
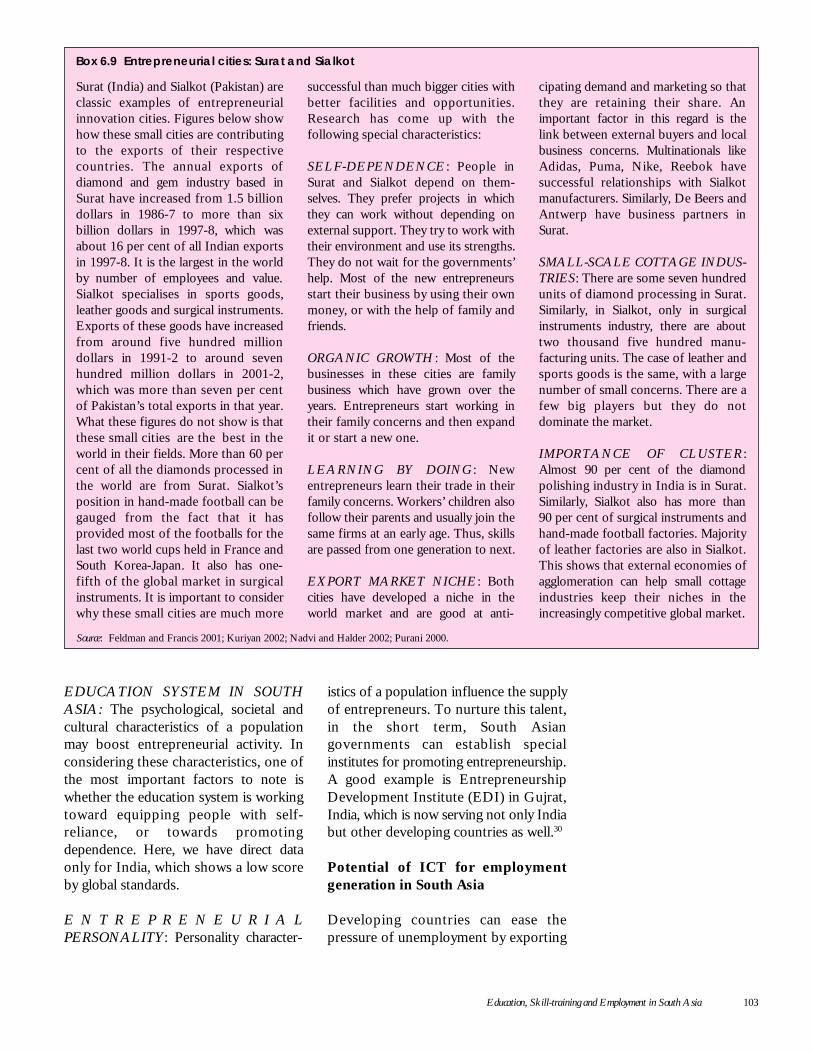
Education, Skill-training and Employment in South Asia 103
EDUCATION SYSTEM IN SOUTHASIA: The psychological, societal andcultural characteristics of a populationmay boost entrepreneurial activity. Inconsidering these characteristics, one ofthe most important factors to note iswhether the education system is workingtoward equipping people with self-reliance, or towards promotingdependence. Here, we have direct dataonly for India, which shows a low scoreby global standards.
E N T R E P R E N E U R I A LPERSONALITY: Personality character-
istics of a population influence the supplyof entrepreneurs. To nurture this talent,in the short term, South Asiangovernments can establish specialinstitutes for promoting entrepreneurship.A good example is EntrepreneurshipDevelopment Institute (EDI) in Gujrat,India, which is now serving not only Indiabut other developing countries as well.30
Potential of ICT for employmentgeneration in South Asia
Developing countries can ease thepressure of unemployment by exporting
Surat (India) and Sialkot (Pakistan) areclassic examples of entrepreneurialinnovation cities. Figures below showhow these small cities are contributingto the exports of their respectivecountries. The annual exports ofdiamond and gem industry based inSurat have increased from 1.5 billiondollars in 1986-7 to more than sixbillion dollars in 1997-8, which wasabout 16 per cent of all Indian exportsin 1997-8. It is the largest in the worldby number of employees and value.Sialkot specialises in sports goods,leather goods and surgical instruments.Exports of these goods have increasedfrom around five hundred milliondollars in 1991-2 to around sevenhundred million dollars in 2001-2,which was more than seven per centof Pakistan’s total exports in that year.What these figures do not show is thatthese small cities are the best in theworld in their fields. More than 60 percent of all the diamonds processed inthe world are from Surat. Sialkot’sposition in hand-made football can begauged from the fact that it hasprovided most of the footballs for thelast two world cups held in France andSouth Korea-Japan. It also has one-fifth of the global market in surgicalinstruments. It is important to considerwhy these small cities are much more
Box 6.9 Entrepreneurial cities: Surat and Sialkot
successful than much bigger cities withbetter facilities and opportunities.Research has come up with thefollowing special characteristics:
SELF-DEPENDENCE : People inSurat and Sialkot depend on them-selves. They prefer projects in whichthey can work without depending onexternal support. They try to work withtheir environment and use its strengths.They do not wait for the governments’help. Most of the new entrepreneursstart their business by using their ownmoney, or with the help of family andfriends.
ORGANIC GROWTH : Most of thebusinesses in these cities are familybusiness which have grown over theyears. Entrepreneurs start working intheir family concerns and then expandit or start a new one.
LEARNING BY DOING : Newentrepreneurs learn their trade in theirfamily concerns. Workers’ children alsofollow their parents and usually join thesame firms at an early age. Thus, skillsare passed from one generation to next.
EXPORT MARKET NICHE : Bothcities have developed a niche in theworld market and are good at anti-
cipating demand and marketing so thatthey are retaining their share. Animportant factor in this regard is thelink between external buyers and localbusiness concerns. Multinationals likeAdidas, Puma, Nike, Reebok havesuccessful relationships with Sialkotmanufacturers. Similarly, De Beers andAntwerp have business partners inSurat.
SMALL-SCALE COTTAGE INDUS-TRIES: There are some seven hundredunits of diamond processing in Surat.Similarly, in Sialkot, only in surgicalinstruments industry, there are abouttwo thousand five hundred manu-facturing units. The case of leather andsports goods is the same, with a largenumber of small concerns. There are afew big players but they do notdominate the market.
IMPORTANCE OF CLUSTER :Almost 90 per cent of the diamondpolishing industry in India is in Surat.Similarly, Sialkot also has more than90 per cent of surgical instruments andhand-made football factories. Majorityof leather factories are also in Sialkot.This shows that external economies ofagglomeration can help small cottageindustries keep their niches in theincreasingly competitive global market.
Source: Feldman and Francis 2001; Kuriyan 2002; Nadvi and Halder 2002; Purani 2000.
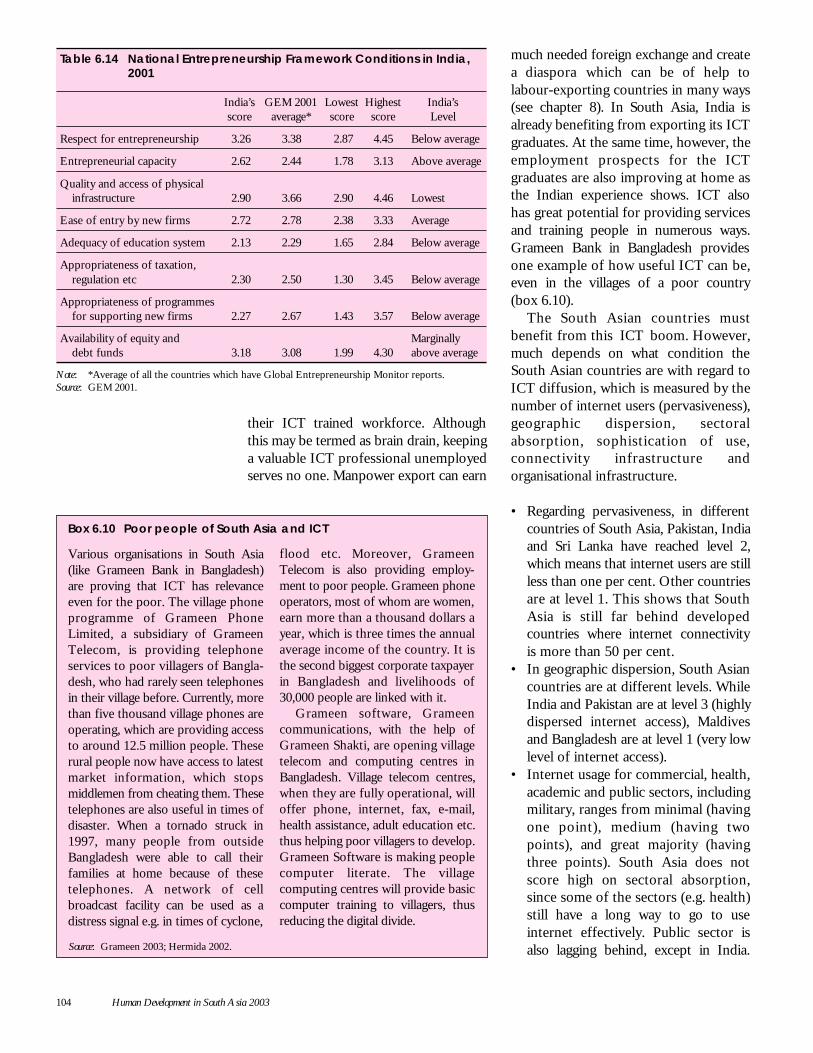
104 Human Development in South Asia 2003
much needed foreign exchange and createa diaspora which can be of help tolabour-exporting countries in many ways(see chapter 8). In South Asia, India isalready benefiting from exporting its ICTgraduates. At the same time, however, theemployment prospects for the ICTgraduates are also improving at home asthe Indian experience shows. ICT alsohas great potential for providing servicesand training people in numerous ways.Grameen Bank in Bangladesh providesone example of how useful ICT can be,even in the villages of a poor country(box 6.10).
The South Asian countries mustbenefit from this ICT boom. However,much depends on what condition theSouth Asian countries are with regard toICT diffusion, which is measured by thenumber of internet users (pervasiveness),geographic dispersion, sectoralabsorption, sophistication of use,connectivity infrastructure andorganisational infrastructure.
• Regarding pervasiveness, in differentcountries of South Asia, Pakistan, Indiaand Sri Lanka have reached level 2,which means that internet users are stillless than one per cent. Other countriesare at level 1. This shows that SouthAsia is still far behind developedcountries where internet connectivityis more than 50 per cent.
• In geographic dispersion, South Asiancountries are at different levels. WhileIndia and Pakistan are at level 3 (highlydispersed internet access), Maldivesand Bangladesh are at level 1 (very lowlevel of internet access).
• Internet usage for commercial, health,academic and public sectors, includingmilitary, ranges from minimal (havingone point), medium (having twopoints), and great majority (havingthree points). South Asia does notscore high on sectoral absorption,since some of the sectors (e.g. health)still have a long way to go to useinternet effectively. Public sector isalso lagging behind, except in India.
Table 6.14 National Entrepreneurship Framework Conditions in India,2001
India’s GEM 2001 Lowest Highest India’sscore average* score score Level
Respect for entrepreneurship 3.26 3.38 2.87 4.45 Below average
Entrepreneurial capacity 2.62 2.44 1.78 3.13 Above average
Quality and access of physicalinfrastructure 2.90 3.66 2.90 4.46 Lowest
Ease of entry by new firms 2.72 2.78 2.38 3.33 Average
Adequacy of education system 2.13 2.29 1.65 2.84 Below average
Appropriateness of taxation,regulation etc 2.30 2.50 1.30 3.45 Below average
Appropriateness of programmesfor supporting new firms 2.27 2.67 1.43 3.57 Below average
Availability of equity and Marginallydebt funds 3.18 3.08 1.99 4.30 above average
Note: *Average of all the countries which have Global Entrepreneurship Monitor reports.Source: GEM 2001.
Box 6.10 Poor people of South Asia and ICT
Various organisations in South Asia(like Grameen Bank in Bangladesh)are proving that ICT has relevanceeven for the poor. The village phoneprogramme of Grameen PhoneLimited, a subsidiary of GrameenTelecom, is providing telephoneservices to poor villagers of Bangla-desh, who had rarely seen telephonesin their village before. Currently, morethan five thousand village phones areoperating, which are providing accessto around 12.5 million people. Theserural people now have access to latestmarket information, which stopsmiddlemen from cheating them. Thesetelephones are also useful in times ofdisaster. When a tornado struck in1997, many people from outsideBangladesh were able to call theirfamilies at home because of thesetelephones. A network of cellbroadcast facility can be used as adistress signal e.g. in times of cyclone,
flood etc. Moreover, GrameenTelecom is also providing employ-ment to poor people. Grameen phoneoperators, most of whom are women,earn more than a thousand dollars ayear, which is three times the annualaverage income of the country. It isthe second biggest corporate taxpayerin Bangladesh and livelihoods of30,000 people are linked with it.
Grameen software, Grameencommunications, with the help ofGrameen Shakti, are opening villagetelecom and computing centres inBangladesh. Village telecom centres,when they are fully operational, willoffer phone, internet, fax, e-mail,health assistance, adult education etc.thus helping poor villagers to develop.Grameen Software is making peoplecomputer literate. The villagecomputing centres will provide basiccomputer training to villagers, thusreducing the digital divide.
Source: Grameen 2003; Hermida 2002.
their ICT trained workforce. Althoughthis may be termed as brain drain, keepinga valuable ICT professional unemployedserves no one. Manpower export can earn
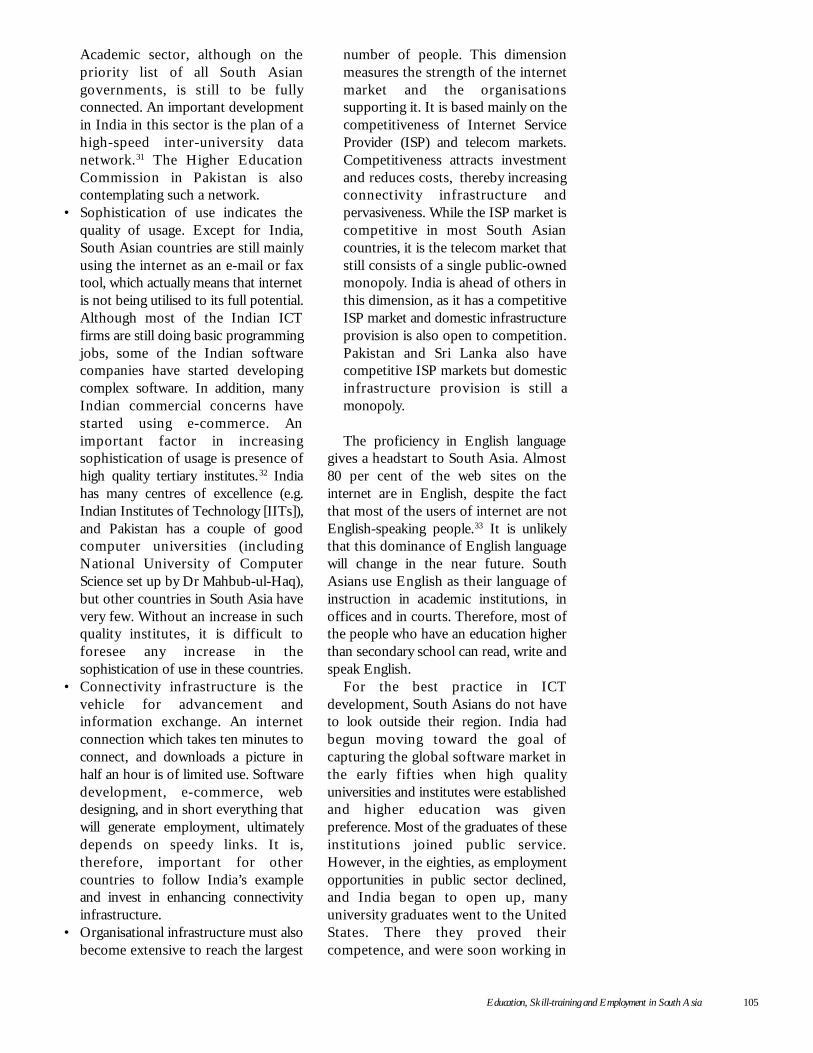
Education, Skill-training and Employment in South Asia 105
Academic sector, although on thepriority list of all South Asiangovernments, is still to be fullyconnected. An important developmentin India in this sector is the plan of ahigh-speed inter-university datanetwork.31 The Higher EducationCommission in Pakistan is alsocontemplating such a network.
• Sophistication of use indicates thequality of usage. Except for India,South Asian countries are still mainlyusing the internet as an e-mail or faxtool, which actually means that internetis not being utilised to its full potential.Although most of the Indian ICTfirms are still doing basic programmingjobs, some of the Indian softwarecompanies have started developingcomplex software. In addition, manyIndian commercial concerns havestarted using e-commerce. Animportant factor in increasingsophistication of usage is presence ofhigh quality tertiary institutes. 32 Indiahas many centres of excellence (e.g.Indian Institutes of Technology [IITs]),and Pakistan has a couple of goodcomputer universities (includingNational University of ComputerScience set up by Dr Mahbub-ul-Haq),but other countries in South Asia havevery few. Without an increase in suchquality institutes, it is difficult toforesee any increase in thesophistication of use in these countries.
• Connectivity infrastructure is thevehicle for advancement andinformation exchange. An internetconnection which takes ten minutes toconnect, and downloads a picture inhalf an hour is of limited use. Softwaredevelopment, e-commerce, webdesigning, and in short everything thatwill generate employment, ultimatelydepends on speedy links. It is,therefore, important for othercountries to follow India’s exampleand invest in enhancing connectivityinfrastructure.
• Organisational infrastructure must alsobecome extensive to reach the largest
number of people. This dimensionmeasures the strength of the internetmarket and the organisationssupporting it. It is based mainly on thecompetitiveness of Internet ServiceProvider (ISP) and telecom markets.Competitiveness attracts investmentand reduces costs, thereby increasingconnectivity infrastructure andpervasiveness. While the ISP market iscompetitive in most South Asiancountries, it is the telecom market thatstill consists of a single public-ownedmonopoly. India is ahead of others inthis dimension, as it has a competitiveISP market and domestic infrastructureprovision is also open to competition.Pakistan and Sri Lanka also havecompetitive ISP markets but domesticinfrastructure provision is still amonopoly.
The proficiency in English languagegives a headstart to South Asia. Almost80 per cent of the web sites on theinternet are in English, despite the factthat most of the users of internet are notEnglish-speaking people.33 It is unlikelythat this dominance of English languagewill change in the near future. SouthAsians use English as their language ofinstruction in academic institutions, inoffices and in courts. Therefore, most ofthe people who have an education higherthan secondary school can read, write andspeak English.
For the best practice in ICTdevelopment, South Asians do not haveto look outside their region. India hadbegun moving toward the goal ofcapturing the global software market inthe early fifties when high qualityuniversities and institutes were establishedand higher education was givenpreference. Most of the graduates of theseinstitutions joined public service.However, in the eighties, as employmentopportunities in public sector declined,and India began to open up, manyuniversity graduates went to the UnitedStates. There they proved theircompetence, and were soon working in
106 Human Development in South Asia 2003
leading firms like IBM, Microsoft, Apple,Intel etc. With the advent of the internet,distances and barriers becameunimportant. Also, India opened up itseconomy and implemented policies thathelped in the formation of softwarehouses in India.34
Policies for promoting education andtraining for employment
Human Development in South Asia 1998presented a ten-point agenda foreducational reform in South Asia in orderto empower the South Asians with qualityeducation and skills to compete in theglobal marketplace. Many changes havetaken place in the educational systems inSouth Asia. Many private and non-governmental organizations are engagedin education and training activities. SouthAsian cities are dotted with computerliteracy institutes. Yet that ten-pointagenda of 1998 still seems to be asrelevant today as it was then. So we needto revisit some of those policiesrecommendations and add some more inview of changing needs and concerns.
(1) A conducive macroeconomicpolicy environment must be created forthe promotion of education. There is notgoing to be much demand for theeducated, or even technically trainedpeople, if industrial and agriculturalgrowth is sluggish, if exports do notexpand, or of the macroeconomicmanagement is not concerned aboutpeople. Economic managers must workon both economic growth andemployment generation.
(2) To prevent a mismatch betweentraining and employment, and to steertraining priorities and programmes in theright direction, a market-orientedplanning approach has to be adopted thatrelies on analyses of trends in the labourmarket, and the economy as a whole. Inthis regard, comprehensive surveys andtracer studies are useful tools foremployers.
(3) Universal primary education ofacceptable quality is the most importantcontribution that can be made forpreparing young people for the world ofwork. Expansion of eventual universalaccess to secondary education constitutesthe foundation for technical andvocational skills.
(4) There is an urgent need to ensureequivalency of degrees of technicalinstitutes and general educationuniversities. Malaysia offers a model inwhich vocational certificates areconsidered at par with degrees fromprestigious general education schools andcolleges.
(5) The coverage of technicaleducation needs to be extended in SouthAsia to women and to neglected ruralareas. The East Asian experience hasdemonstrated that women excel at newtechnologies. Women already constitute80-90 per cent of workers in export-related industries in South Asia (seechapter 5).
(6) Education must have adequatebudgetary support. Education budgets inSouth Asia need to be at least twice oftheir current allocations, and technicaleducation should have at least 25 per centof the total education budget.
(7) A closer alliance needs to beforged between the public and privatesectors in South Asia for the promotionof general as well as technical andvocational education. The South Asiancountries need to set up tripartite councilsinvolving government, private sector andlabour unions to identify technical needsand to design relevant trainingprogrammes.
(8) An enabling environment must becreated for the promotion ofentrepreneurship in South Asia. To thatend, investment in infrastructure oftransportation, telecommunication andpower generation needs to be accelerated,along with appropriate organisational andmanagement structure.
To prevent amismatch betweentraining andemployment, amarket-orientedplanning approachhas to be adopted

Education, Skill-training and Employment in South Asia 107
(9) ICT should be promoted foremployment generation, and not only forthe urban elite. South Asia must close the
digital divide between the rich and thepoor and use the potential of ICT for thevast majority of South Asians.
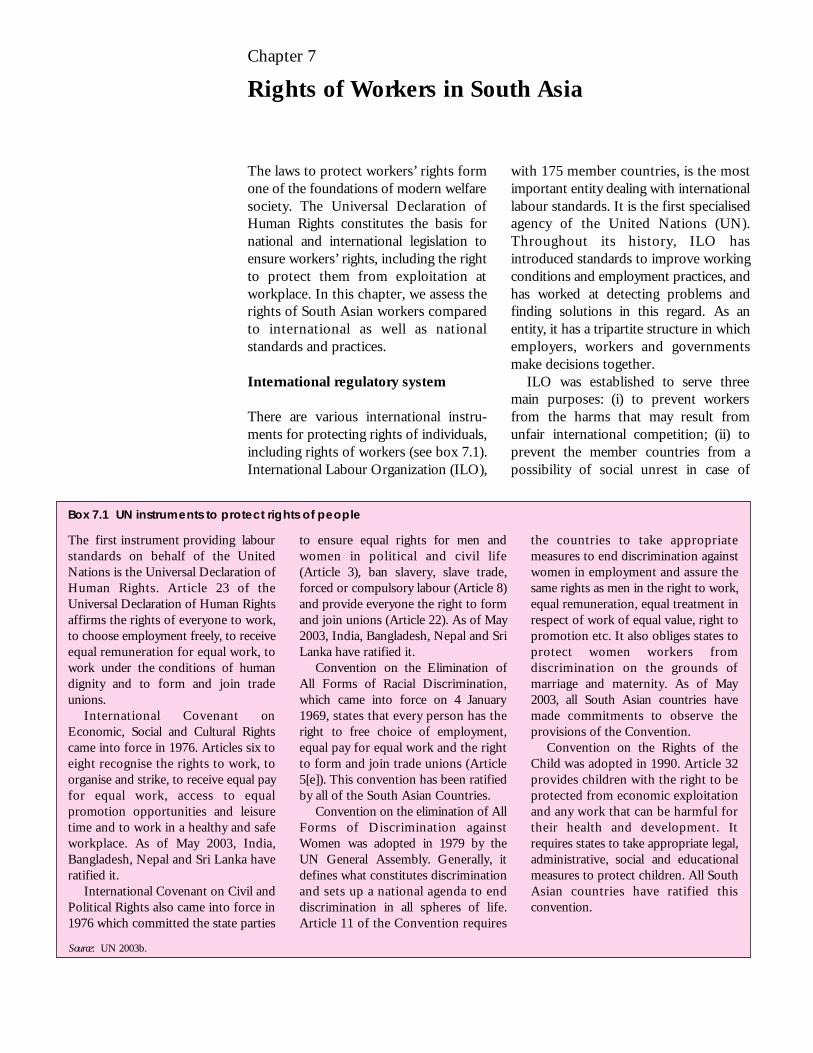
108 Human Development in South Asia 2003
The laws to protect workers’ rights formone of the foundations of modern welfaresociety. The Universal Declaration ofHuman Rights constitutes the basis fornational and international legislation toensure workers’ rights, including the rightto protect them from exploitation atworkplace. In this chapter, we assess therights of South Asian workers comparedto international as well as nationalstandards and practices.
International regulatory system
There are various international instru-ments for protecting rights of individuals,including rights of workers (see box 7.1).International Labour Organization (ILO),
with 175 member countries, is the mostimportant entity dealing with internationallabour standards. It is the first specialisedagency of the United Nations (UN).Throughout its history, ILO hasintroduced standards to improve workingconditions and employment practices, andhas worked at detecting problems andfinding solutions in this regard. As anentity, it has a tripartite structure in whichemployers, workers and governmentsmake decisions together.
ILO was established to serve threemain purposes: (i) to prevent workersfrom the harms that may result fromunfair international competition; (ii) toprevent the member countries from apossibility of social unrest in case of
Chapter 7
Rights of Workers in South Asia
The first instrument providing labourstandards on behalf of the UnitedNations is the Universal Declaration ofHuman Rights. Article 23 of theUniversal Declaration of Human Rightsaffirms the rights of everyone to work,to choose employment freely, to receiveequal remuneration for equal work, towork under the conditions of humandignity and to form and join tradeunions.
International Covenant onEconomic, Social and Cultural Rightscame into force in 1976. Articles six toeight recognise the rights to work, toorganise and strike, to receive equal payfor equal work, access to equalpromotion opportunities and leisuretime and to work in a healthy and safeworkplace. As of May 2003, India,Bangladesh, Nepal and Sri Lanka haveratified it.
International Covenant on Civil andPolitical Rights also came into force in1976 which committed the state parties
Box 7.1 UN instruments to protect rights of people
to ensure equal rights for men andwomen in political and civil life(Article 3), ban slavery, slave trade,forced or compulsory labour (Article 8)and provide everyone the right to formand join unions (Article 22). As of May2003, India, Bangladesh, Nepal and SriLanka have ratified it.
Convention on the Elimination ofAll Forms of Racial Discrimination,which came into force on 4 January1969, states that every person has theright to free choice of employment,equal pay for equal work and the rightto form and join trade unions (Article5[e]). This convention has been ratifiedby all of the South Asian Countries.
Convention on the elimination of AllForms of Discrimination againstWomen was adopted in 1979 by theUN General Assembly. Generally, itdefines what constitutes discriminationand sets up a national agenda to enddiscrimination in all spheres of life.Article 11 of the Convention requires
the countries to take appropriatemeasures to end discrimination againstwomen in employment and assure thesame rights as men in the right to work,equal remuneration, equal treatment inrespect of work of equal value, right topromotion etc. It also obliges states toprotect women workers fromdiscrimination on the grounds ofmarriage and maternity. As of May2003, all South Asian countries havemade commitments to observe theprovisions of the Convention.
Convention on the Rights of theChild was adopted in 1990. Article 32provides children with the right to beprotected from economic exploitationand any work that can be harmful fortheir health and development. Itrequires states to take appropriate legal,administrative, social and educationalmeasures to protect children. All SouthAsian countries have ratified thisconvention.
Source: UN 2003b.
Rights of Workers in South Asia 109
workers’ revolution caused bydeteriorating working conditions; and (iii)to remedy any unacceptable workingconditions of the growing industrialworkforce.
In practice, ILO formulates policiesand programmes to protect and promotebasic human rights at work, improveworking conditions and enhanceemployment opportunities. To attainthese objectives, ILO establishesinternational standards through itsinstruments, monitors their implement-ation and supports its members throughtechnical assistance/cooperation when-ever it is necessary.
The instruments of ILO consist of itsConventions, Recommendations andDeclarations. The implementation ofConventions are monitored andsupervised by regular ILO bodies such asthe Committee of Experts on theApplication of Conventions andRecommendations (CEACR),1 and theConference Committee on theApplication of Conventions andRecommendations (CCACR). 2 Withregard to technical assistance, thegoverning body of ILO identifies theareas of priority every year.
ILO instruments for International Labour Law
ILO instruments of labour standards canbe found in its numerous Conventionsand Recommendations.3 ILO Conven-tions carry the legal status of internationaltreaties. They are flexible in natureallowing the countries to create laws andimplement standards conforming to theneeds of their individual societies.However, the government, which ratifiesa convention, has to agree to all of thearticles comprising the Convention.
The Organisation has adopted morethan 180 Conventions and 185Recommendations covering a broad rangeof subjects. In 1998, the Governing Bodyof ILO had decided that seven (whichlater increased to eight) Conventionsshould be considered as fundamental to
the rights at work, and should be ratifiedand implemented by all 175 members ofthe Organisation. This has been codifiedinto written form by the Declaration4 onFundamental Principles and Rights atWork and its follow-up.
ILO Declaration on Fundamental Principlesand Rights at Work, and its follow-up
The work on the Declaration began in1994, on the 75th anniversary of ILO, withdiscussions on the mandate and missionof ILO in the twenty-first century. Afterthe conference, the ILO governing bodyformed a working party on the ‘SocialDimension of the Liberalisation ofInternational Trade’ to analyse the socialimpact of globalisation. On the 87 th
Session of the International LabourConference (ILC), the ‘Declaration onFundamental Principles and Rights atWork’ was proposed. Consequently, theDeclaration was adopted in June 1998committing ILO members to respect,promote and realise the rights of workersand employers to freedom of associationand collective bargaining, and to worktowards the elimination of all forms offorced or compulsory labour, theabolition of child labour and theelimination of discrimination inemployment or occupation. TheDeclaration defines seven of the ILOConventions as Core Labour Standards.Later, the Convention relating to theworst forms of child labour was includedas the eighth core labour standard.
The Declaration also includes a follow-up, aimed at helping countries throughmonitoring and supervision of ILO. Thefollow up mechanism requires all membercountries that have not ratified one ormore of the core Conventions to prepareand submit reports, including actionstaken by governments to promote theprinciples of the core standards.
Eight of the ILO Conventions whichare declared as Core or FundamentalPrinciples are (see Annex 7.1 for detaileddescription of these Conventions):
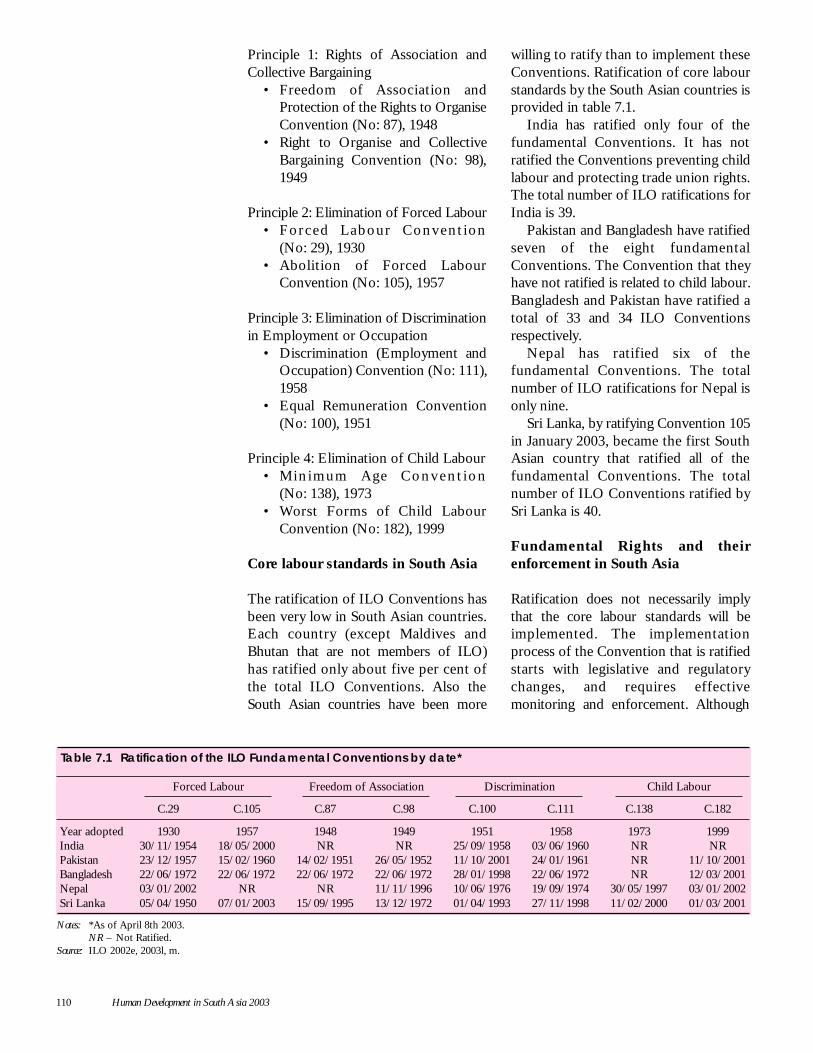
110 Human Development in South Asia 2003
Principle 1: Rights of Association andCollective Bargaining
• Freedom of Association andProtection of the Rights to OrganiseConvention (No: 87), 1948
• Right to Organise and CollectiveBargaining Convention (No: 98),1949
Principle 2: Elimination of Forced Labour• Forced Labour Conven t ion
(No: 29), 1930• Abolition of Forced Labour
Convention (No: 105), 1957
Principle 3: Elimination of Discriminationin Employment or Occupation
• Discrimination (Employment andOccupation) Convention (No: 111),1958
• Equal Remuneration Convention(No: 100), 1951
Principle 4: Elimination of Child Labour• Min imum Age C o n v e n t i o n
(No: 138), 1973• Worst Forms of Child Labour
Convention (No: 182), 1999
Core labour standards in South Asia
The ratification of ILO Conventions hasbeen very low in South Asian countries.Each country (except Maldives andBhutan that are not members of ILO)has ratified only about five per cent ofthe total ILO Conventions. Also theSouth Asian countries have been more
willing to ratify than to implement theseConventions. Ratification of core labourstandards by the South Asian countries isprovided in table 7.1.
India has ratified only four of thefundamental Conventions. It has notratified the Conventions preventing childlabour and protecting trade union rights.The total number of ILO ratifications forIndia is 39.
Pakistan and Bangladesh have ratifiedseven of the eight fundamentalConventions. The Convention that theyhave not ratified is related to child labour.Bangladesh and Pakistan have ratified atotal of 33 and 34 ILO Conventionsrespectively.
Nepal has ratified six of thefundamental Conventions. The totalnumber of ILO ratifications for Nepal isonly nine.
Sri Lanka, by ratifying Convention 105in January 2003, became the first SouthAsian country that ratified all of thefundamental Conventions. The totalnumber of ILO Conventions ratified bySri Lanka is 40.
Fundamental Rights and theirenforcement in South Asia
Ratification does not necessarily implythat the core labour standards will beimplemented. The implementationprocess of the Convention that is ratifiedstarts with legislative and regulatorychanges, and requires effectivemonitoring and enforcement. Although
Table 7.1 Ratification of the ILO Fundamental Conventions by date*
Forced Labour Freedom of Association Discrimination Child Labour
C.29 C.105 C.87 C.98 C.100 C.111 C.138 C.182
Year adopted 1930 1957 1948 1949 1951 1958 1973 1999India 30/11/1954 18/05/2000 NR NR 25/09/1958 03/06/1960 NR NRPakistan 23/12/1957 15/02/1960 14/02/1951 26/05/1952 11/10/2001 24/01/1961 NR 11/10/2001Bangladesh 22/06/1972 22/06/1972 22/06/1972 22/06/1972 28/01/1998 22/06/1972 NR 12/03/2001Nepal 03/01/2002 NR NR 11/11/1996 10/06/1976 19/09/1974 30/05/1997 03/01/2002Sri Lanka 05/04/1950 07/01/2003 15/09/1995 13/12/1972 01/04/1993 27/11/1998 11/02/2000 01/03/2001
Notes: *As of April 8th 2003.NR – Not Ratified.
Source: ILO 2002e, 2003l, m.
Rights of Workers in South Asia 111
India, Pakistan, Bangladesh and Sri Lankahave created fairly extensive frameworksfor the protection of their workers, theformal coverage of the workers has beenminuscule—not more than 10 per cent(except in Sri Lanka). This has been dueto the minimum-size restrictions appliedon the establishments in order to benefitfrom these laws,5 as well as the exclusionof the agricultural sector. Unfortunately,the predominance of informal sector andincreasing flexibility of labour in theregion has worsened the situation.
Some of the labour legislation in SouthAsian countries, particularly in India,Pakistan and Bangladesh and partly inSri Lanka, date back to the colonialperiod.6 At the time of independence in1947, India and Pakistan had inherited anumber of labour related legislations fromthe British. Later, in 1971, Bangladeshinherited a number of laws from Pakistanincluding those inherited from the British.
Principle 1. Freedom of association and collectivebargaining
According to ILO, freedom of associationand collective bargaining are crucialelements of long-term competitivenessand sustained development of a country.7
All the South Asian countries (exceptBhutan and Maldives) recognise the rightto freedom of association and collectivebargaining of their workers. However,they limit these rights by excluding somegroups, mainly workers of ExportProcessing Zones (EPZs) in India,Pakistan, Bangladesh and Sri Lanka, andgovernment servants in India andPakistan from the coverage of theselegislation. In addition, the rights getlimited by declaring particular industriesas essential services (in India, Pakistan,Bangladesh, Nepal and Sri Lanka) inorder to prevent strikes. India, Pakistanand Bangladesh have almost a similarbackground in providing trade unionrights. Pakistan and Bangladesh haveanother common factor that impactsnegatively on the right to organise, strikeand collective bargaining: both these
countries have been subjected to martiallaw several times after theirindependence. Therefore, trade unionactivities are significantly curtailed inPakistan and Bangladesh.
Over the past ten years, the Committeeon Freedom of Association of ILO hasreceived several complaints regarding theviolations of trade union rights. Theallegations included: in India, murdersand/or disappearances of trade unionistsand the limitation to freedom ofdemonstration; in Pakistan, arrests anddetentions; and in Bangladesh, restrictionon freedom of movement.8 Denial of civilliberties to public sector workers has beenobserved in India and Nepal, anti-uniondiscriminations in Bangladesh and India,and restrictions on the right to strike inPakistan. The limitations to the rights offreedom of association and collectivebargaining have also resulted fromdiscrepancies between national laws andthe Conventions (see box 7.2).
An assessment of the status ofimplementation of core principle one inSouth Asia is given below:
INDIA: Although India has not ratifiedthe fundamental Convention on thefreedom of association, the right tofreedom of association in trade unions isguaranteed in Article 19 of the IndianConstitution.9 In addition, the rights ofthe industrial workers are defined andprotected, and the discrimination againstunion members and organisers isforbidden by the Trade Unions Act of1926.10 The union membership is notlimited only to formal sector workers.However, unionisation in the informalsector is not common.11 In the formalsector, trade union rights are highlyrespected and employers may bepenalised if they discriminate againstemployees regarding trade unionactivities. Outside the formal sector, theenforcement of laws and collectivebargaining is almost non-existent.12 Wagesare set and disputes settled throughcollective bargaining in the unionisedindustrial sectors only. The rules
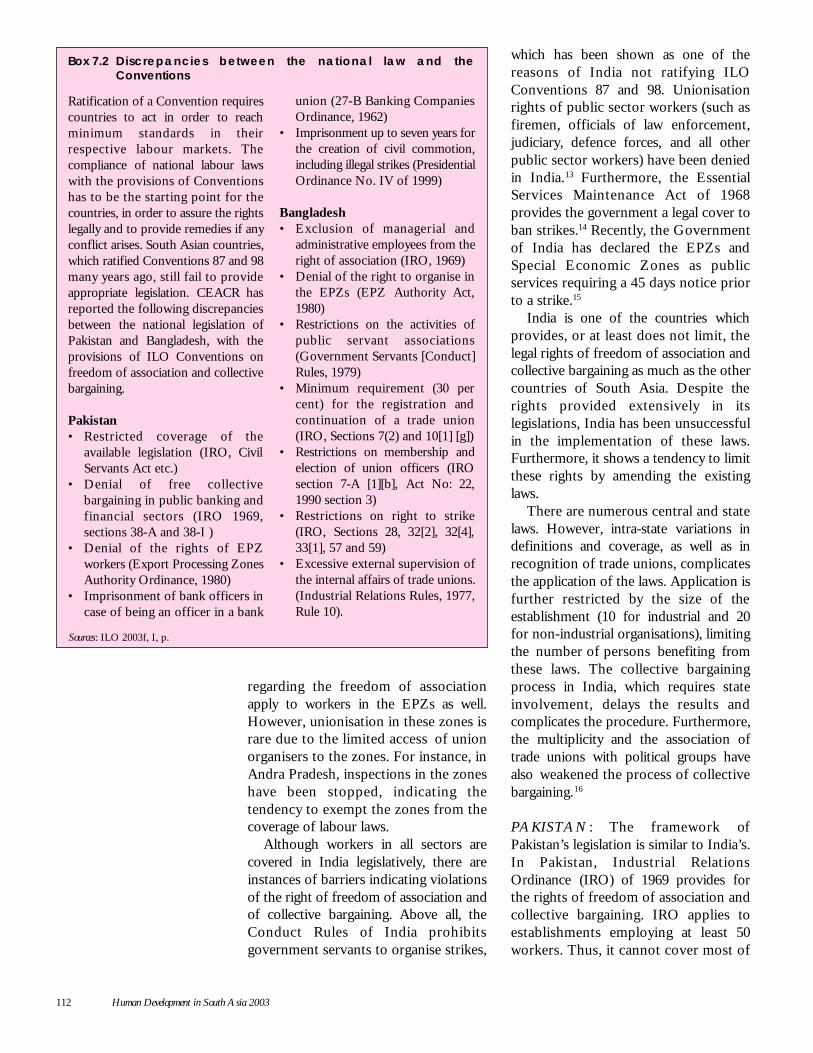
112 Human Development in South Asia 2003
regarding the freedom of associationapply to workers in the EPZs as well.However, unionisation in these zones israre due to the limited access of unionorganisers to the zones. For instance, inAndra Pradesh, inspections in the zoneshave been stopped, indicating thetendency to exempt the zones from thecoverage of labour laws.
Although workers in all sectors arecovered in India legislatively, there areinstances of barriers indicating violationsof the right of freedom of association andof collective bargaining. Above all, theConduct Rules of India prohibitsgovernment servants to organise strikes,
which has been shown as one of thereasons of India not ratifying ILOConventions 87 and 98. Unionisationrights of public sector workers (such asfiremen, officials of law enforcement,judiciary, defence forces, and all otherpublic sector workers) have been deniedin India.13 Furthermore, the EssentialServices Maintenance Act of 1968provides the government a legal cover toban strikes.14 Recently, the Governmentof India has declared the EPZs andSpecial Economic Zones as publicservices requiring a 45 days notice priorto a strike.15
India is one of the countries whichprovides, or at least does not limit, thelegal rights of freedom of association andcollective bargaining as much as the othercountries of South Asia. Despite therights provided extensively in itslegislations, India has been unsuccessfulin the implementation of these laws.Furthermore, it shows a tendency to limitthese rights by amending the existinglaws.
There are numerous central and statelaws. However, intra-state variations indefinitions and coverage, as well as inrecognition of trade unions, complicatesthe application of the laws. Application isfurther restricted by the size of theestablishment (10 for industrial and 20for non-industrial organisations), limitingthe number of persons benefiting fromthese laws. The collective bargainingprocess in India, which requires stateinvolvement, delays the results andcomplicates the procedure. Furthermore,the multiplicity and the association oftrade unions with political groups havealso weakened the process of collectivebargaining. 16
PAKISTAN : The framework ofPakistan’s legislation is similar to India’s.In Pakistan, Industrial RelationsOrdinance (IRO) of 1969 provides forthe rights of freedom of association andcollective bargaining. IRO applies toestablishments employing at least 50workers. Thus, it cannot cover most of
Box 7.2 Discrepancies between the national law and theConventions
Ratification of a Convention requirescountries to act in order to reachminimum standards in theirrespective labour markets. Thecompliance of national labour lawswith the provisions of Conventionshas to be the starting point for thecountries, in order to assure the rightslegally and to provide remedies if anyconflict arises. South Asian countries,which ratified Conventions 87 and 98many years ago, still fail to provideappropriate legislation. CEACR hasreported the following discrepanciesbetween the national legislation ofPakistan and Bangladesh, with theprovisions of ILO Conventions onfreedom of association and collectivebargaining.
Pakistan• Restricted coverage of the
available legislation (IRO, CivilServants Act etc.)
• Denial of free collectivebargaining in public banking andfinancial sectors (IRO 1969,sections 38-A and 38-I )
• Denial of the rights of EPZworkers (Export Processing ZonesAuthority Ordinance, 1980)
• Imprisonment of bank officers incase of being an officer in a bank
union (27-B Banking CompaniesOrdinance, 1962)
• Imprisonment up to seven years forthe creation of civil commotion,including illegal strikes (PresidentialOrdinance No. IV of 1999)
Bangladesh• Exclusion of managerial and
administrative employees from theright of association (IRO, 1969)
• Denial of the right to organise inthe EPZs (EPZ Authority Act,1980)
• Restrictions on the activities ofpublic servant associations(Government Servants [Conduct]Rules, 1979)
• Minimum requirement (30 percent) for the registration andcontinuation of a trade union(IRO, Sections 7(2) and 10[1] [g])
• Restrictions on membership andelection of union officers (IROsection 7-A [1][b], Act No: 22,1990 section 3)
• Restrictions on right to strike(IRO, Sections 28, 32[2], 32[4],33[1], 57 and 59)
• Excessive external supervision ofthe internal affairs of trade unions.(Industrial Relations Rules, 1977,Rule 10).
Sources: ILO 2003f, I, p.
Rights of Workers in South Asia 113
the workers, especially those working inthe informal sector. The railway anddefence workers’ rights are denied, andthe agricultural and educational workersare not included in the scope of thisordinance. IRO also excludes the workersat supervisory levels and those who earnmore than a predetermined amount. All ofthese limitations are against the provisionsof ILO Conventions. The governmentannounced IRO 2002 in October 2002.The new IRO further curtails rights byallowing the government to end a strikethat has lasted for more than 15 days (30days previously), and decreasing thepenalties for the anti-union actions.
The Essential Services ManagementAct of 1952 was the first hurdle in thehistory of the unionisation process ofPakistan. It restricts the freedom ofassociation and collective bargainingrights of various groups of workers. Forinstance, workers in hospitals and invarious civil and defence services cannotform unions. Employees of PakistanInternational Airlines (PIA), PakistanTelevision Corporation and the CivilAviation Authority (CAA), as well asworkers in postal, teaching, electric supplyand radio stations can form unions butcannot join a strike.
The workers in the EPZs are alsodenied their trade union rights inPakistan. Export Processing ZonesAuthority Ordinance (EPZAO) of 1980and Export Processing Zone Rules(EPZR) of 1982 exempt the workers inEPZs from the provisions of IRO.Workers in EPZs cannot establish tradeunions, bargain collectively or organise astrike.17
BANGLADESH: The Constitution ofBangladesh provides for the freedom ofassembly and association.18 In addition,Industrial Ordinance of 1969 provides forthe freedom of association and allowsstrikes and lockouts. However, it alsogives the government authority toprohibit the action if the strike lasts morethan 30 days.19
Coverage of workers as well as tradeunion participation is very low inBangladesh. According to theInternational Confederation of FreeTrade Union’s (ICFTU) report regardingthe core labour standards in Bangladesh,in 2000, the total number of trade unionsin the country was 5450, and only1.8 million out of five million formalsector workers—or out of 58 millionlabour force—were unionised. Thereasons behind the low participation arethe inadequacies of the enforcementinstitutions in which violations remainpending for years, the weak informationsystems at the factory level, and thepolitical abduction of the tradeunionists.20
Unionisation rights of workers arelimited for some groups in Bangladesh(against C87 and C98). For example,public servants, teachers and nurses,workers in EPZs, workers in co-operatives, security personnel andworkers at the Rural ElectrificationBoard, and Security Printing andOrdnance factories are prohibited fromjoining trade unions. The minimum limitto establish a trade union is 30 per centof the workforce of the establishment andregistration of the trade union isobligatory.
The right to strike has not beendefined by the law specifically. There areserious constraints on the rights to strike,since the government has the right to bana strike under the provisions of EssentialServices Ordinance, and since 75 per centof the workers’ commitment is necessaryfor a strike.
In 1992, the government had made acommitment to end the restrictionsregarding freedom of association in EPZsby 1997, and to include them in all labourlegislations by 2000. However, thegovernment did not implement this until2000, despite threats from USA andCanada of removing Bangladesh’s tradeprivilege under the Generalised System ofPreferences. 21 Recently, the Governmentof Bangladesh has announced that the
The reasons behindthe low participationin unions areinadequacies of theenforcementinstitutions
114 Human Development in South Asia 2003
zone workers will be allowed to formunions from January 2004.
SRI LANKA : According to ICFTU,violations of trade union rights arecommon in Sri Lanka, especially in FreeTrade Zones (FTZs). The Government’sBoard of Investments (BOI) managesFTZs and discourages trade unionactivities and collective bargaining.Industrial Disputes Act (Amendment) of1999 has provisions on protecting anti-unionism acts such as prohibitingemployers from interfering in trade unionactivities and requiring recognition of theworkers’ rights by employers, and alsoforbidding employers from firing aworker because of trade union activities.However, there have been variouscomplaints of anti-union activities,especially in FTZs. Recently, theEmployment and Industrial Relations Bill,establishing the preconditions forcollective bargaining in line with ILOstandards, has been proposed in Sri Lanka(box 7.3).
NEPAL: Article 12 of the Constitutionof Nepal provides the right to freedomof association for all citizens. But rightsto unionise and collective bargaining areprovided in the Labour Act 1992 andTrade Union Act of 1993. Organisationswith 10 or more employees are coveredby legislation, and the government hasthe right to stop a strike or suspend tradeunion activities. A strike is legal if 60 percent of the members vote in favour of it,but is prohibited for essential services. Inpractice, the implementation of these lawsis rare. Nepal is in the process ofamending the Police and Military Act tocomply with the Conventions. ItsMinistry of Labour has formed aTechnical Committee, and a NationalPlan of Action has already beenformulated to initiate the ratification ofthe core standards. In 2002, the ongoingterrorism by Maoist guerrillas caused thedeclaration of state of emergency in thecountry. This has curtailed trade unionactivities.
MALDIVES AND BHUTAN: Maldivesand Bhutan are not members of ILO.However, Maldives has committed tocomply with the internationallyrecognised core labour standards in theMinisterial Conferences of WTO over1996-2001.
An ICFTU report of 2003 indicatedthat there were no trade unions inMaldives. Neither the right to form orjoin trade unions nor the right to strike isrecognised in practice. There is norecognition of collective bargaining rights,and wages are set by bilateral contractsbetween employees and employers in theprivate sector. In Bhutan, trade unionismis not permitted and does not appear toexist.22
Principle 2. Elimination of all forms ofDiscrimination
In India, the existence of equalremuneration Act (1976) does notprovide women a means of protectionfrom discriminative wages.23 Estimationof Human Development Report (HDR) 2003has shown that women workers generallyearn lower than their male colleagues (seeChapter 5) . Caste and ethnicdiscrimination is also common in India.In order to provide a remedy for thedisadvantaged castes and ethnic groups,the government offers affirmative actionin employment (hiring quotas and specialtraining programmes), and other benefitssuch as special development funds. TheGovernment of India has reserved threeper cent of jobs in the public sector forthe disabled. However, a caste-baseddiscrimination is widely known to exist inIndia.
There is discrimination based on genderand religion in Pakistan. Lack of education,especially for girls in Pakistan, causes defacto discrimination in access toemployment; women do not receive equaltreatment with their male counterparts interms of pay, working conditions,promotion etc. 24 The two per cent quotafor the disabled persons in public andprivate employment is not fulfilled most
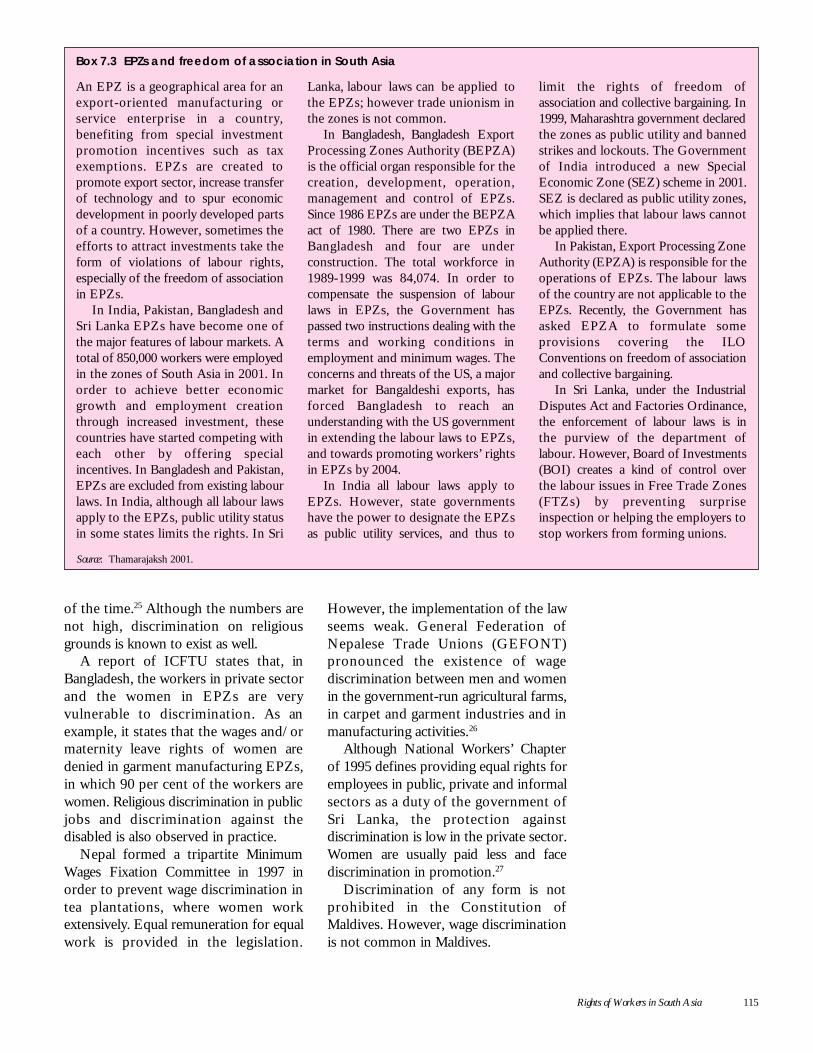
Rights of Workers in South Asia 115
of the time.25 Although the numbers arenot high, discrimination on religiousgrounds is known to exist as well.
A report of ICFTU states that, inBangladesh, the workers in private sectorand the women in EPZs are veryvulnerable to discrimination. As anexample, it states that the wages and/ormaternity leave rights of women aredenied in garment manufacturing EPZs,in which 90 per cent of the workers arewomen. Religious discrimination in publicjobs and discrimination against thedisabled is also observed in practice.
Nepal formed a tripartite MinimumWages Fixation Committee in 1997 inorder to prevent wage discrimination intea plantations, where women workextensively. Equal remuneration for equalwork is provided in the legislation.
However, the implementation of the lawseems weak. General Federation ofNepalese Trade Unions (GEFONT)pronounced the existence of wagediscrimination between men and womenin the government-run agricultural farms,in carpet and garment industries and inmanufacturing activities.26
Although National Workers’ Chapterof 1995 defines providing equal rights foremployees in public, private and informalsectors as a duty of the government ofSri Lanka, the protection againstdiscrimination is low in the private sector.Women are usually paid less and facediscrimination in promotion.27
Discrimination of any form is notprohibited in the Constitution ofMaldives. However, wage discriminationis not common in Maldives.
An EPZ is a geographical area for anexport-oriented manufacturing orservice enterprise in a country,benefiting from special investmentpromotion incentives such as taxexemptions. EPZs are created topromote export sector, increase transferof technology and to spur economicdevelopment in poorly developed partsof a country. However, sometimes theefforts to attract investments take theform of violations of labour rights,especially of the freedom of associationin EPZs.
In India, Pakistan, Bangladesh andSri Lanka EPZs have become one ofthe major features of labour markets. Atotal of 850,000 workers were employedin the zones of South Asia in 2001. Inorder to achieve better economicgrowth and employment creationthrough increased investment, thesecountries have started competing witheach other by offering specialincentives. In Bangladesh and Pakistan,EPZs are excluded from existing labourlaws. In India, although all labour lawsapply to the EPZs, public utility statusin some states limits the rights. In Sri
Box 7.3 EPZs and freedom of association in South Asia
Lanka, labour laws can be applied tothe EPZs; however trade unionism inthe zones is not common.
In Bangladesh, Bangladesh ExportProcessing Zones Authority (BEPZA)is the official organ responsible for thecreation, development, operation,management and control of EPZs.Since 1986 EPZs are under the BEPZAact of 1980. There are two EPZs inBangladesh and four are underconstruction. The total workforce in1989-1999 was 84,074. In order tocompensate the suspension of labourlaws in EPZs, the Government haspassed two instructions dealing with theterms and working conditions inemployment and minimum wages. Theconcerns and threats of the US, a majormarket for Bangaldeshi exports, hasforced Bangladesh to reach anunderstanding with the US governmentin extending the labour laws to EPZs,and towards promoting workers’ rightsin EPZs by 2004.
In India all labour laws apply toEPZs. However, state governmentshave the power to designate the EPZsas public utility services, and thus to
limit the rights of freedom ofassociation and collective bargaining. In1999, Maharashtra government declaredthe zones as public utility and bannedstrikes and lockouts. The Governmentof India introduced a new SpecialEconomic Zone (SEZ) scheme in 2001.SEZ is declared as public utility zones,which implies that labour laws cannotbe applied there.
In Pakistan, Export Processing ZoneAuthority (EPZA) is responsible for theoperations of EPZs. The labour lawsof the country are not applicable to theEPZs. Recently, the Government hasasked EPZA to formulate someprovisions covering the ILOConventions on freedom of associationand collective bargaining.
In Sri Lanka, under the IndustrialDisputes Act and Factories Ordinance,the enforcement of labour laws is inthe purview of the department oflabour. However, Board of Investments(BOI) creates a kind of control overthe labour issues in Free Trade Zones(FTZs) by preventing surpriseinspection or helping the employers tostop workers from forming unions.
Source: Thamarajaksh 2001.
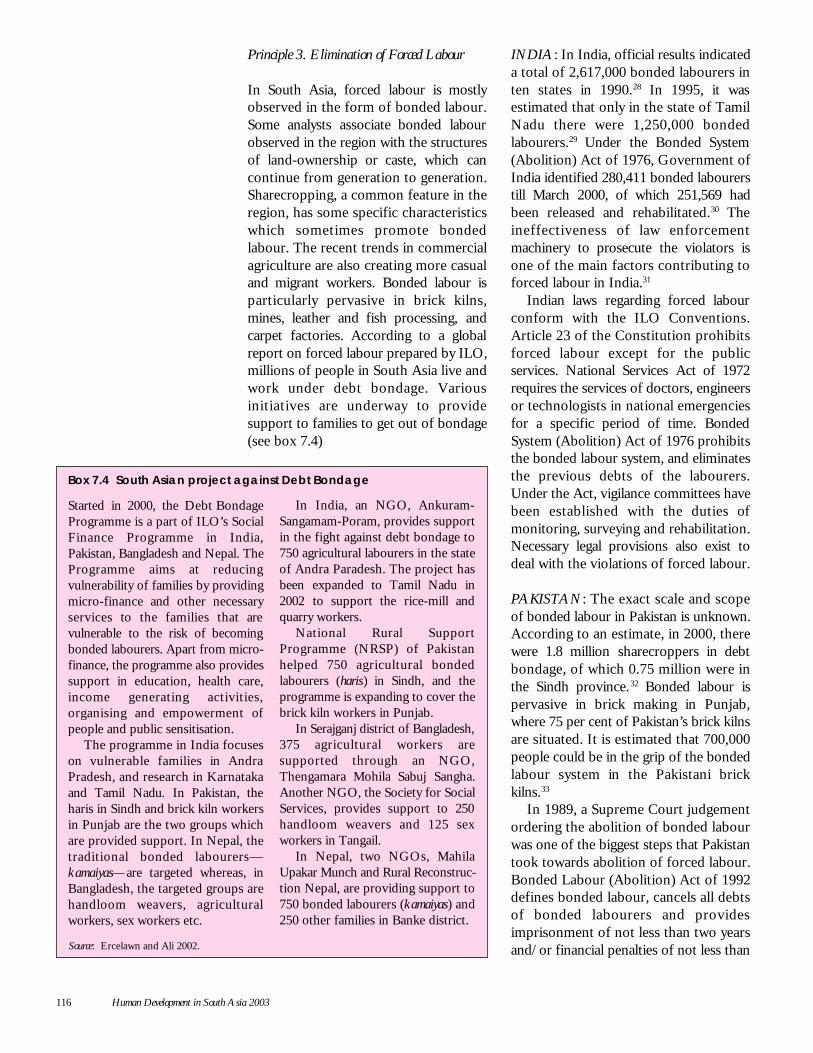
116 Human Development in South Asia 2003
Principle 3. Elimination of Forced Labour
In South Asia, forced labour is mostlyobserved in the form of bonded labour.Some analysts associate bonded labourobserved in the region with the structuresof land-ownership or caste, which cancontinue from generation to generation.Sharecropping, a common feature in theregion, has some specific characteristicswhich sometimes promote bondedlabour. The recent trends in commercialagriculture are also creating more casualand migrant workers. Bonded labour isparticularly pervasive in brick kilns,mines, leather and fish processing, andcarpet factories. According to a globalreport on forced labour prepared by ILO,millions of people in South Asia live andwork under debt bondage. Variousinitiatives are underway to providesupport to families to get out of bondage(see box 7.4)
INDIA: In India, official results indicateda total of 2,617,000 bonded labourers inten states in 1990.28 In 1995, it wasestimated that only in the state of TamilNadu there were 1,250,000 bondedlabourers.29 Under the Bonded System(Abolition) Act of 1976, Government ofIndia identified 280,411 bonded labourerstill March 2000, of which 251,569 hadbeen released and rehabilitated.30 Theineffectiveness of law enforcementmachinery to prosecute the violators isone of the main factors contributing toforced labour in India.31
Indian laws regarding forced labourconform with the ILO Conventions.Article 23 of the Constitution prohibitsforced labour except for the publicservices. National Services Act of 1972requires the services of doctors, engineersor technologists in national emergenciesfor a specific period of time. BondedSystem (Abolition) Act of 1976 prohibitsthe bonded labour system, and eliminatesthe previous debts of the labourers.Under the Act, vigilance committees havebeen established with the duties ofmonitoring, surveying and rehabilitation.Necessary legal provisions also exist todeal with the violations of forced labour.
PAKISTAN: The exact scale and scopeof bonded labour in Pakistan is unknown.According to an estimate, in 2000, therewere 1.8 million sharecroppers in debtbondage, of which 0.75 million were inthe Sindh province. 32 Bonded labour ispervasive in brick making in Punjab,where 75 per cent of Pakistan’s brick kilnsare situated. It is estimated that 700,000people could be in the grip of the bondedlabour system in the Pakistani brickkilns.33
In 1989, a Supreme Court judgementordering the abolition of bonded labourwas one of the biggest steps that Pakistantook towards abolition of forced labour.Bonded Labour (Abolition) Act of 1992defines bonded labour, cancels all debtsof bonded labourers and providesimprisonment of not less than two yearsand/or financial penalties of not less than
Box 7.4 South Asian project against Debt Bondage
Started in 2000, the Debt BondageProgramme is a part of ILO’s SocialFinance Programme in India,Pakistan, Bangladesh and Nepal. TheProgramme aims at reducingvulnerability of families by providingmicro-finance and other necessaryservices to the families that arevulnerable to the risk of becomingbonded labourers. Apart from micro-finance, the programme also providessupport in education, health care,income generating activities,organising and empowerment ofpeople and public sensitisation.
The programme in India focuseson vulnerable families in AndraPradesh, and research in Karnatakaand Tamil Nadu. In Pakistan, theharis in Sindh and brick kiln workersin Punjab are the two groups whichare provided support. In Nepal, thetraditional bonded labourers—kamaiyas—are targeted whereas, inBangladesh, the targeted groups arehandloom weavers, agriculturalworkers, sex workers etc.
In India, an NGO, Ankuram-Sangamam-Poram, provides supportin the fight against debt bondage to750 agricultural labourers in the stateof Andra Paradesh. The project hasbeen expanded to Tamil Nadu in2002 to support the rice-mill andquarry workers.
National Rural SupportProgramme (NRSP) of Pakistanhelped 750 agricultural bondedlabourers (haris) in Sindh, and theprogramme is expanding to cover thebrick kiln workers in Punjab.
In Serajganj district of Bangladesh,375 agricultural workers aresupported through an NGO,Thengamara Mohila Sabuj Sangha.Another NGO, the Society for SocialServices, provides support to 250handloom weavers and 125 sexworkers in Tangail.
In Nepal, two NGOs, MahilaUpakar Munch and Rural Reconstruc-tion Nepal, are providing support to750 bonded labourers (kamaiyas) and250 other families in Banke district.
Source: Ercelawn and Ali 2002.
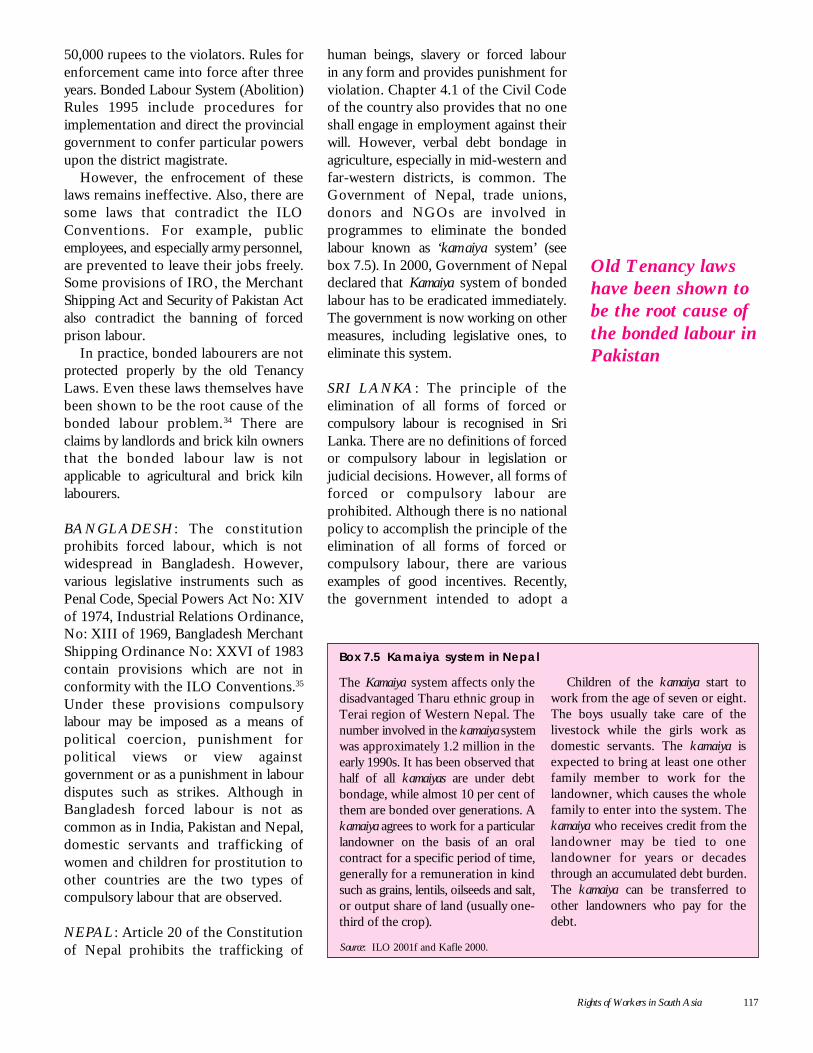
Rights of Workers in South Asia 117
50,000 rupees to the violators. Rules forenforcement came into force after threeyears. Bonded Labour System (Abolition)Rules 1995 include procedures forimplementation and direct the provincialgovernment to confer particular powersupon the district magistrate.
However, the enfrocement of theselaws remains ineffective. Also, there aresome laws that contradict the ILOConventions. For example, publicemployees, and especially army personnel,are prevented to leave their jobs freely.Some provisions of IRO, the MerchantShipping Act and Security of Pakistan Actalso contradict the banning of forcedprison labour.
In practice, bonded labourers are notprotected properly by the old TenancyLaws. Even these laws themselves havebeen shown to be the root cause of thebonded labour problem. 34 There areclaims by landlords and brick kiln ownersthat the bonded labour law is notapplicable to agricultural and brick kilnlabourers.
BANGLADESH : The constitutionprohibits forced labour, which is notwidespread in Bangladesh. However,various legislative instruments such asPenal Code, Special Powers Act No: XIVof 1974, Industrial Relations Ordinance,No: XIII of 1969, Bangladesh MerchantShipping Ordinance No: XXVI of 1983contain provisions which are not inconformity with the ILO Conventions.35
Under these provisions compulsorylabour may be imposed as a means ofpolitical coercion, punishment forpolitical views or view againstgovernment or as a punishment in labourdisputes such as strikes. Although inBangladesh forced labour is not ascommon as in India, Pakistan and Nepal,domestic servants and trafficking ofwomen and children for prostitution toother countries are the two types ofcompulsory labour that are observed.
NEPAL: Article 20 of the Constitutionof Nepal prohibits the trafficking of
human beings, slavery or forced labourin any form and provides punishment forviolation. Chapter 4.1 of the Civil Codeof the country also provides that no oneshall engage in employment against theirwill. However, verbal debt bondage inagriculture, especially in mid-western andfar-western districts, is common. TheGovernment of Nepal, trade unions,donors and NGOs are involved inprogrammes to eliminate the bondedlabour known as ‘kamaiya system’ (seebox 7.5). In 2000, Government of Nepaldeclared that Kamaiya system of bondedlabour has to be eradicated immediately.The government is now working on othermeasures, including legislative ones, toeliminate this system.
SRI LANKA : The principle of theelimination of all forms of forced orcompulsory labour is recognised in SriLanka. There are no definitions of forcedor compulsory labour in legislation orjudicial decisions. However, all forms offorced or compulsory labour areprohibited. Although there is no nationalpolicy to accomplish the principle of theelimination of all forms of forced orcompulsory labour, there are variousexamples of good incentives. Recently,the government intended to adopt a
Box 7.5 Kamaiya system in Nepal
The Kamaiya system affects only thedisadvantaged Tharu ethnic group inTerai region of Western Nepal. Thenumber involved in the kamaiya systemwas approximately 1.2 million in theearly 1990s. It has been observed thathalf of all kamaiyas are under debtbondage, while almost 10 per cent ofthem are bonded over generations. Akamaiya agrees to work for a particularlandowner on the basis of an oralcontract for a specific period of time,generally for a remuneration in kindsuch as grains, lentils, oilseeds and salt,or output share of land (usually one-third of the crop).
Children of the kamaiya start towork from the age of seven or eight.The boys usually take care of thelivestock while the girls work asdomestic servants. The kamaiya isexpected to bring at least one otherfamily member to work for thelandowner, which causes the wholefamily to enter into the system. Thekamaiya who receives credit from thelandowner may be tied to onelandowner for years or decadesthrough an accumulated debt burden.The kamaiya can be transferred toother landowners who pay for thedebt.
Source: ILO 2001f and Kafle 2000.
Old Tenancy lawshave been shown tobe the root cause ofthe bonded labour inPakistan
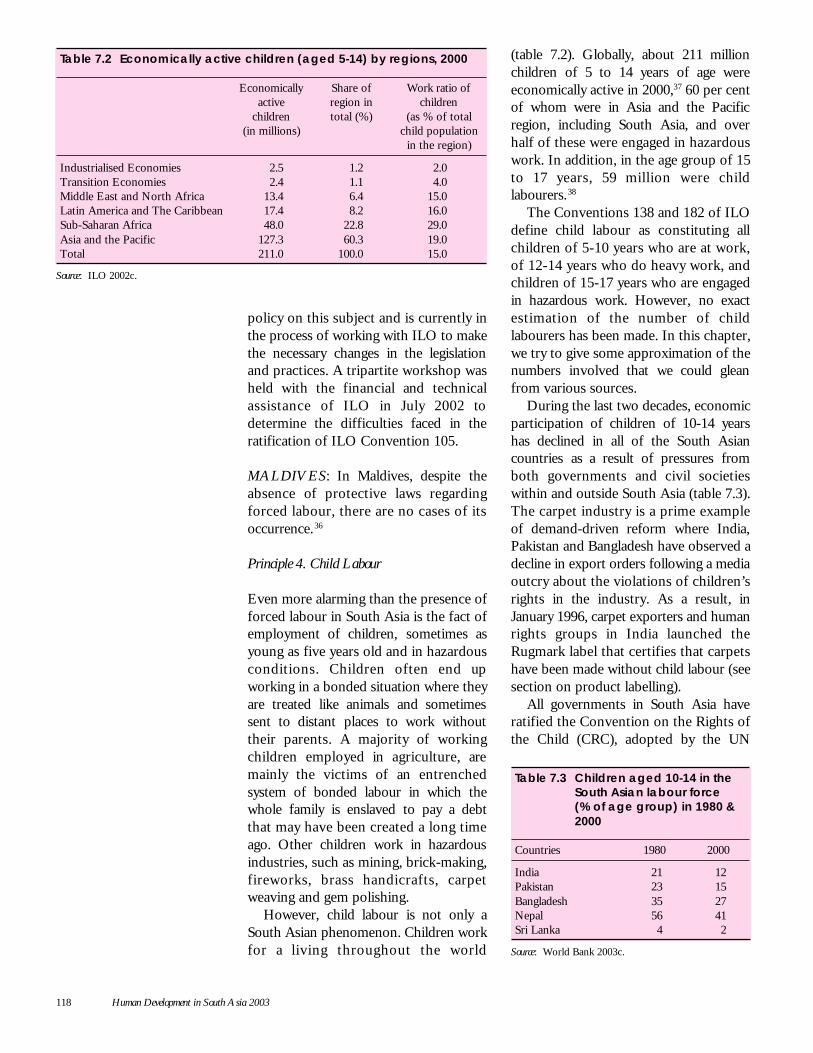
118 Human Development in South Asia 2003
policy on this subject and is currently inthe process of working with ILO to makethe necessary changes in the legislationand practices. A tripartite workshop washeld with the financial and technicalassistance of ILO in July 2002 todetermine the difficulties faced in theratification of ILO Convention 105.
MALDIVES: In Maldives, despite theabsence of protective laws regardingforced labour, there are no cases of itsoccurrence. 36
Principle 4. Child Labour
Even more alarming than the presence offorced labour in South Asia is the fact ofemployment of children, sometimes asyoung as five years old and in hazardousconditions. Children often end upworking in a bonded situation where theyare treated like animals and sometimessent to distant places to work withouttheir parents. A majority of workingchildren employed in agriculture, aremainly the victims of an entrenchedsystem of bonded labour in which thewhole family is enslaved to pay a debtthat may have been created a long timeago. Other children work in hazardousindustries, such as mining, brick-making,fireworks, brass handicrafts, carpetweaving and gem polishing.
However, child labour is not only aSouth Asian phenomenon. Children workfor a living throughout the world
(table 7.2). Globally, about 211 millionchildren of 5 to 14 years of age wereeconomically active in 2000,37 60 per centof whom were in Asia and the Pacificregion, including South Asia, and overhalf of these were engaged in hazardouswork. In addition, in the age group of 15to 17 years, 59 million were childlabourers.38
The Conventions 138 and 182 of ILOdefine child labour as constituting allchildren of 5-10 years who are at work,of 12-14 years who do heavy work, andchildren of 15-17 years who are engagedin hazardous work. However, no exactestimation of the number of childlabourers has been made. In this chapter,we try to give some approximation of thenumbers involved that we could gleanfrom various sources.
During the last two decades, economicparticipation of children of 10-14 yearshas declined in all of the South Asiancountries as a result of pressures fromboth governments and civil societieswithin and outside South Asia (table 7.3).The carpet industry is a prime exampleof demand-driven reform where India,Pakistan and Bangladesh have observed adecline in export orders following a mediaoutcry about the violations of children’srights in the industry. As a result, inJanuary 1996, carpet exporters and humanrights groups in India launched theRugmark label that certifies that carpetshave been made without child labour (seesection on product labelling).
All governments in South Asia haveratified the Convention on the Rights ofthe Child (CRC), adopted by the UN
Table 7.2 Economically active children (aged 5-14) by regions, 2000
Economically Share of Work ratio ofactive region in children
children total (%) (as % of total(in millions) child population
in the region)
Industrialised Economies 2.5 1.2 2.0Transition Economies 2.4 1.1 4.0Middle East and North Africa 13.4 6.4 15.0Latin America and The Caribbean 17.4 8.2 16.0Sub-Saharan Africa 48.0 22.8 29.0Asia and the Pacific 127.3 60.3 19.0Total 211.0 100.0 15.0
Source: ILO 2002c.
Table 7.3 Children aged 10-14 in theSouth Asian labour force(% of age group) in 1980 &2000
Countries 1980 2000
India 21 12Pakistan 23 15Bangladesh 35 27Nepal 56 41Sri Lanka 4 2
Source: World Bank 2003c.
Rights of Workers in South Asia 119
General Assembly, which sets theminimum standards for children’s rights.Some governments are now devisingstricter child labour regulations. Butresults thus far are generally poor, due tolack of effective implementation andmonitoring.
INDIA: In India, except for hazardoussectors39 defined by the Child Labour(Prohibition and Regulation) Act of 1986,child labour is legal. Children can worksix hours daily for six days a week. Thereis no minimum age for employment.Primary school education has becomecompulsory since 2001. Forced andbonded labour of children is banned. But,in general, implementation of the Act isvery poor, and children are found inhazardous sectors and occupations.40 ILOestimates that there are at least 44 millionchild workers in India, but thegovernment estimates only 11 million.41
PAKISTAN : The minimum age foremployment has been defined by variouslaws in Pakistan. The national minimumage is 14, which conforms to therequirement of C138. Children Pledgingof Labour Act (1933)42 prohibits theagreements pledging the labour ofchildren and employment of childrenunder the age of 15, except in cases inwhich they are paid a reasonable wage.Factories Act of 193443 prohibits the workof children in factories under the age of14 and decrees a fine of Rs. 500 for theviolators. Employment of Children Act(Amendment) of 1991 prohibitsemployment of children under the age of14 in workshops or listed manufacturingsectors such as carpet weaving,construction and building industry etc.But family-based enterprises are excluded.
In reality, however, child labour iswidespread in Pakistan. According to anestimate by the government in 1996,3.3 million children were economicallyactive. However, several NGOs havequoted a much higher figure. The HumanRights Commission of Pakistan (HRCP)has estimated the number to be between
11 to 12 million, with at least half of thembeing under the age of 10.
BANGLADESH: In Bangladesh, theprinciple of the abolition of child labouris recognised in the constitution andlegislation. National legislation has notestablished a minimum age in general, butBangladesh Export Processing ZonesAuthority (BEPZA) has restricted theminimum age to 14 for employment inEPZs.
The hazardous sectors are defined andthe age limit is provided in nationallegislations of Bangladesh. The minimumage for these jobs complies with C182.Factories Rules (1979) and Employmentof Children Act (1938) 44 list theoperations which constitute hazardouswork.45
Official statistics of child workers aged5 to 14 years was estimated to be6.3 million. Eighty-three per cent of allworking children were found in ruralareas.46 Since 1995, the government hasbeen trying to eliminate child labourthrough the ILO-InternationalProgramme on the Elimination of ChildLabour (IPEC), and 76 ActionProgrammes have been implementedsuccessfully through governmentagencies, employers’ organisations, tradeunions and NGOs in Bangladesh. About50,000 children and their familiesbenefited from these programmes.Government is also working with theUnited States Agency for InternationalDevelopment (USAID) on theelimination of child labour in hazardouswork. The project is titled as Eradicationof Hazardous Child Labour inBangladesh, and aims at providing Non-Formal Education and SkillsDevelopment Training for 10,000working children, and micro-credit for5,000 parents of child labour in Dhakaand Chittagong metropolitan areas.
NEPAL: Nepal is the country that hasthe highest percentage share of childlabour within the region. The number ofworking children was 2.6 million in 1997,
The results of childlabour regulationsare generally poordue to lack ofeffectiveimplementation andmonitoring
120 Human Development in South Asia 2003
of which 127,000 were found in the worstforms of child labour.47
SRI LANKA: According to IPEC, in1999, there were 475,531 economicallyactive children of 5-14 years old in SriLanka. These children were mainlyworking in domestic service, coconutfibre production, brick making, fishing,cigarette rolling, street vending and infarming. The worst form of childlabour—child prostitution—is alsocommon in Sri Lanka. According togovernment sources, there were around30,000 victims in 1991.
MALDIVES: There is no compulsoryeducation and requirement of minimumage for employment in Maldives.Although numbers are not available, childlabour is widespread in agriculture andfishing.
Trafficking of children
Another shocking problem in South Asiais the sexual exploitation of children forprofit. Child prostitution has become aglobal phenomenon as the most inhumanface of increased cross-border mobilityof people. But, in South Asia, this has aspecial import as it is mostly an outcomeof poverty.
The available research indicates thatthe number of children involved intrafficking for the purpose of prostitution,within and outside South Asia, hasincreased in recent years. In India, thetrafficking of children takes place mostlywithin the country: the children fromKarnataka, Mahrashtra, West Bengal andTamil Nadu are brought to Mumbai,Calcutta and Delhi. The estimates of thechildren trafficked for prostitution varybetween 25,000 to 500,000, of whicharound five per cent are from theneighbouring countries, such as Nepaland Bangladesh.
Pakistan is one of the receivingcountries of the region. The childrenbrought from Bangladesh and India work
in farming and fishing and in prostitutionin Pakistan. There is no exact data on thechildren trafficked for prostitution.
In Bangladesh, child traffickingoccurred both within and outside thecountry. Bangladeshi children are usuallytrafficked for prostitution, forced orbonded labour, marriage, and for the saleof organs. Between 1993 and 1997,13,320 children were trafficked out ofBangladesh.
Many children are trafficked toKathmandu, Nepal every year. Thesechildren work in manufacturing,sweatshops, and hotels, or as domesticservants and in prostitution.Approximately, 5000 children leave theirfamilies due to trafficking or labourmigration. Nepal is also a sendingcountry. Most of the children traffickedout of Nepal end up in India to work onconstruction sites, brick kilns, teaplantations, and in manufacturing andprostitution. It is estimated that around5000 to 7000 girls are trafficked fromNepal to India every year just forprostitution.
The network of child trafficking is wellorganised in the region. Rather thankidnapping, children are promised goodwages, education or marriage. Childrentrafficked from India and Nepal are morelikely to belong to lower castes andclasses. Poverty, lack of food and security,and poor educational backgrounds arefactors contributing to child traffickingin the region. Being a victim of sexualabuse also increases their chances ofbeing trafficked in India, Bangladesh andNepal. It is also suggested thatglobalisation, which increased the demandfor cheap labour, has also led to anincrease in the numbers of children beingtrafficked.
Because of the regional dimension ofthe problem, as most trafficking takesplace within the region, this has receivedthe attention of the policy makers inSouth Asia and SAARC has been engagedin recent years to combat this problemwithin a regional framework (box 7.6).
Child prostitutionhas become a globalphenomenon as themost inhuman faceof increased cross-border mobility ofpeople
Rights of Workers in South Asia 121
Various alternative ways of eliminatingchild labour have emerged during the lastdecade, the most notable of these beingworkplace monitoring and productlabelling. Voluntary agreements,supported by technical assistance andother measures, like product labelling andcodes of conduct for MultinationalEnterprises (MNE) operating indeveloping countries, have proven to bebetter and more supportive actions thancomplete bans or trade sanctions.Following are some of the voluntaryefforts aiming to eliminate child labourfrom South Asia:
Work place monitoring in Bangladesh andPakistan
The International Programme on theElimination of Child Labour (IPEC) hasbeen using monitoring as a tool in itsprojects since 1996. Two projects in theSouth Asia region, namely, Child LabourVerification and Monitoring System inGarment Factories in Bangladesh andElimination of Child Labour in the SoccerBall Industry in Sialkot, Pakistan, havebeen very successful in achieving results.
In 1993 and 1994, Bangladesh garmentmanufacturing sector faced the threat oflosing its export volume and earnings.Harkin Bill,48 which was adopted in theUnited States threatened to boycottBangladeshi products due to extensive useof child labour. The BangladeshGarments Manufacturers’ and Exporters’Association (BGMEA) then signed aMemorandum of Understanding (MoU)with the ILO and the United NationsChildren’s Fund (UNICEF) in 1995. ILOwas responsible for verifying andmonitoring the presence of children intextile and garment factories, UNICEFfor school attendance of children in non-formal education (NFE) centres. Theproject was focused on the informalsector for about 1800 garment factoriesin Dhaka and 400 in Chittagong. Thechildren removed from workplace werecompensated with a stipend if they wereonly receiving education in NFE Centres.
From July 1995 to September 2000, atotal of 27,320 children were identifiedand withdrawn from the factories. Thepercentages of factories employingchildren had a notable decline from43.5 per cent in 1995 to five per cent in2000. This has demonstrated that UNagencies, government, employers andNGOs can work together effectively. Theproject has shown that this partnershipcan be used in other countries as well.The programme was replicated in severalcountries including Pakistan (box 7.7).
Workplace monitoring in Pakistan hasbeen introduced in soccer ball industry,surgical instruments industry and thecarpet-weaving sectors. The programme,Elimination of Child Labour in the SoccerBall Industry, was based on the AtlantaAgreement signed in 1997 by the SialkotChamber of Commerce and Industry(SCCI), UNICEF and ILO. It targetedchildren under the age of 14 who wereworking in the industry, not enrolled inprimary schools, or still in school butwhose work interfered with theireducation. Both internal and externalmonitoring units were established tomonitor 1000 stitching centres once everyfive weeks. All the registered stitchingcentres were free from child labour at the
Box 7.6 SAARC initiative to combat child trafficking
Member countries of the South AsianAssociation for Regional Cooperation(SAARC) put the issue of child andwomen trafficking into their agendaas a priority issue in 1996. TheRawalpindi Resolution of 1996committed the countries to combatinter and intra-country trafficking ofchildren and women. In 1997, MaleDeclaration expressed the need for aregional convention on childtrafficking in South Asia, whilemember states promised to improveregional coordination of efforts tostop child trafficking. The foundationof the Convention has been laid bythe SAARC meeting in Colombo,
1998. After consultations theConvention on Preventing andCombating Trafficking in Womenand Children for Prostitution hasbeen adopted by the membercountries in 2002. The Conventiondefines a person below 18 years ofage as a child and requires membersto take necessary measures forcombating trafficking regionally. Thelegal framework covering the issueexists in all South Asian countries.However, these are limited orcomplicated. Furthermore, lack ofenforcement is a serious issue in theregion.
Source: Tumlin 2000 and Sharma 1999.
122 Human Development in South Asia 2003
end of the first phase that ended in 1999.The second phase of the project hasstarted in 2000. The current programmehas two components, Prevention andMonitoring Programme and SocialProtection and Rehabilitation Pro-gramme. Under the former, 360,002monitoring visits were carried out.Establishments of non-formal educationcentres, village and family educationcommittees and training are some otheractivities provided under the SocialProtection and Rehabilitation Pro-gramme. The exact number of childreninvolved is not known. The PakistanCarpet Manufacturers and ExportersAssociation (PCMEA) estimates it to bearound 20,000 to 30,000, while HumanRights Commission of Pakistan providesa larger figure of 500,000.49
Product labeling in South Asia
During the decade of 1990s, awarenessabout child labour in export industriesincreased and the consumers in developedcountries demanded a means of guaranteethat the products they were importingfrom developing countries were notproduced by children. Thus labellinginitiatives got started. In South Asia, thelabelled products are mainly hand-knottedcarpets and garments.
Rugmark is the famous initiativedealing with product labelling to eliminatechild labour from the hand-knottedcarpets industry in South Asia. It is aninitiative of a number of consumers andhumanitarian organisations. It started in1994 when the European consumersbecame aware of the use of child labourin the production of carpets. It hasfoundations in India, Pakistan and Nepal.The carpet producing sites weremonitored to guarantee that all thecarpets were being produced withoutchild labour. It is a voluntary effort and itis open to every producer or exporterwho wants to comply with the standardson child labour.
Care & Fare is an initiative of a tradeassociation of carpet importers and
retailers in Germany. Instead of labellingeach carpet, the entire stock of the retaileris labelled. It started in 1994 and hasmember dealers in India, Pakistan andNepal. Every member retailer has to paya levy to be used in the rehabilitation ofchildren who had been working in theindustry. Also, the members who do notobey the rules are subject to penalties. In1997, there were six schools built by Care& Fare in India, Pakistan and Nepal,where along with education, free luncheswere provided.
STEP was another small programmeaiming at the elimination of child labourfrom the carpet manufacturing in Indiaand Nepal. STEP also does not haveindividual carpet labelling, but it hasmembers who are carpet traders. Thereare two on-site monitors in India andNepal.
The Double Income Project (DIP) wasfounded in 1995 in Zurich. It labels thetextile and garment products produced byfactories in Kenya and India andmarketed in Switzerland. Themanufacturers have to pay levies, whichare used for the welfare of the factory’sworkers or for the education of children,who would otherwise be in theworkforce.50
Impact of globalization on workers’rights
Human Development in South Asia 2001documented the social consequences ofglobalisation in South Asia. The previouschapters of this report have alsounderscored the point that globalisationhas not led to gains in employment inSouth Asia as compared to growth ratesof GDP and labour force. During the lastdecade, when the countries wereintegrating fast with the global economy,there had been a trend to move awayfrom large enterprises, stable work forcesand work systems toward flexibleproduction processes, and flexibleemployment and payments. Thisflexibility and informality of labourmarkets have lowered labour standards
Flexibility andinformality of labourmarkets havelowered labourstandards
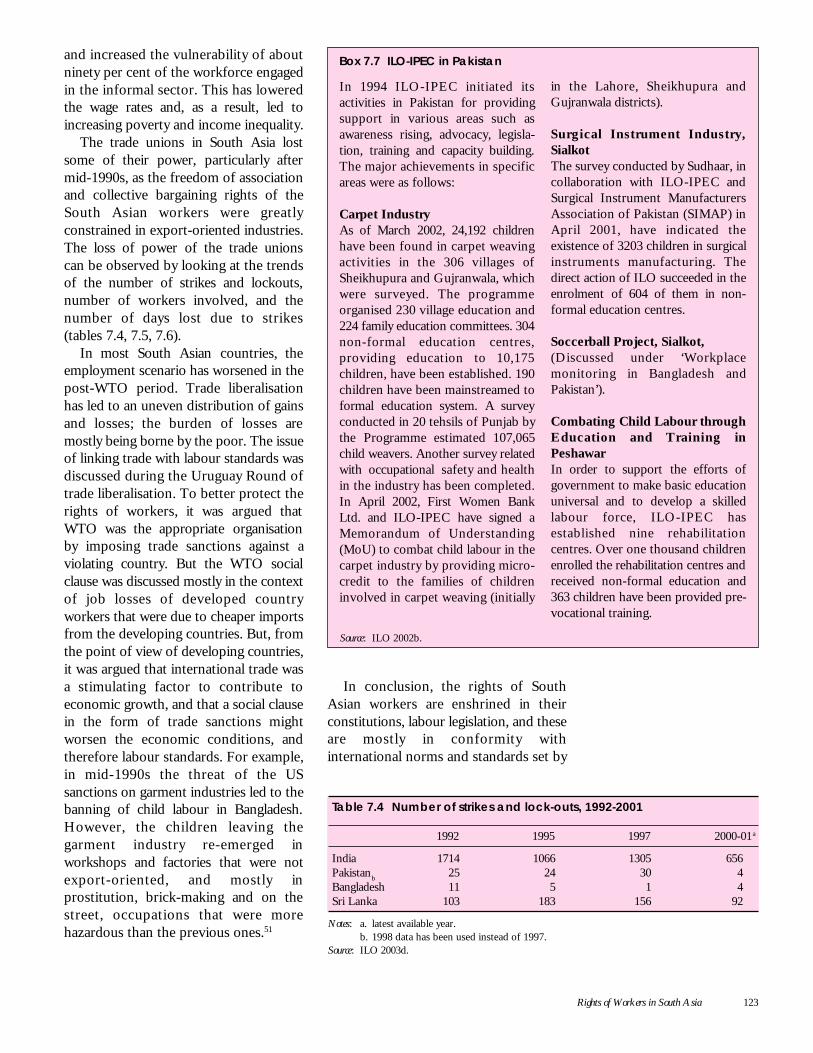
Rights of Workers in South Asia 123
and increased the vulnerability of aboutninety per cent of the workforce engagedin the informal sector. This has loweredthe wage rates and, as a result, led toincreasing poverty and income inequality.
The trade unions in South Asia lostsome of their power, particularly aftermid-1990s, as the freedom of associationand collective bargaining rights of theSouth Asian workers were greatlyconstrained in export-oriented industries.The loss of power of the trade unionscan be observed by looking at the trendsof the number of strikes and lockouts,number of workers involved, and thenumber of days lost due to strikes(tables 7.4, 7.5, 7.6).
In most South Asian countries, theemployment scenario has worsened in thepost-WTO period. Trade liberalisationhas led to an uneven distribution of gainsand losses; the burden of losses aremostly being borne by the poor. The issueof linking trade with labour standards wasdiscussed during the Uruguay Round oftrade liberalisation. To better protect therights of workers, it was argued thatWTO was the appropriate organisationby imposing trade sanctions against aviolating country. But the WTO socialclause was discussed mostly in the contextof job losses of developed countryworkers that were due to cheaper importsfrom the developing countries. But, fromthe point of view of developing countries,it was argued that international trade wasa stimulating factor to contribute toeconomic growth, and that a social clausein the form of trade sanctions mightworsen the economic conditions, andtherefore labour standards. For example,in mid-1990s the threat of the USsanctions on garment industries led to thebanning of child labour in Bangladesh.However, the children leaving thegarment industry re-emerged inworkshops and factories that were notexport-oriented, and mostly inprostitution, brick-making and on thestreet, occupations that were morehazardous than the previous ones.51
Box 7.7 ILO-IPEC in Pakistan
In 1994 ILO-IPEC initiated itsactivities in Pakistan for providingsupport in various areas such asawareness rising, advocacy, legisla-tion, training and capacity building.The major achievements in specificareas were as follows:
Carpet IndustryAs of March 2002, 24,192 childrenhave been found in carpet weavingactivities in the 306 villages ofSheikhupura and Gujranwala, whichwere surveyed. The programmeorganised 230 village education and224 family education committees. 304non-formal education centres,providing education to 10,175children, have been established. 190children have been mainstreamed toformal education system. A surveyconducted in 20 tehsils of Punjab bythe Programme estimated 107,065child weavers. Another survey relatedwith occupational safety and healthin the industry has been completed.In April 2002, First Women BankLtd. and ILO-IPEC have signed aMemorandum of Understanding(MoU) to combat child labour in thecarpet industry by providing micro-credit to the families of childreninvolved in carpet weaving (initially
in the Lahore, Sheikhupura andGujranwala districts).
Surgical Instrument Industry,SialkotThe survey conducted by Sudhaar, incollaboration with ILO-IPEC andSurgical Instrument ManufacturersAssociation of Pakistan (SIMAP) inApril 2001, have indicated theexistence of 3203 children in surgicalinstruments manufacturing. Thedirect action of ILO succeeded in theenrolment of 604 of them in non-formal education centres.
Soccerball Project, Sialkot,(Discussed under ‘Workplacemonitoring in Bangladesh andPakistan’).
Combating Child Labour throughEducation and Training inPeshawarIn order to support the efforts ofgovernment to make basic educationuniversal and to develop a skilledlabour force, ILO-IPEC hasestablished nine rehabilitationcentres. Over one thousand childrenenrolled the rehabilitation centres andreceived non-formal education and363 children have been provided pre-vocational training.
Source: ILO 2002b.
In conclusion, the rights of SouthAsian workers are enshrined in theirconstitutions, labour legislation, and theseare mostly in conformity withinternational norms and standards set by
Table 7.4 Number of strikes and lock-outs, 1992-2001
1992 1995 1997 2000-01a
India 1714 1066 1305 656Pakistan
b25 24 30 4
Bangladesh 11 5 1 4Sri Lanka 103 183 156 92
Notes: a. latest available year.b. 1998 data has been used instead of 1997.
Source: ILO 2003d.
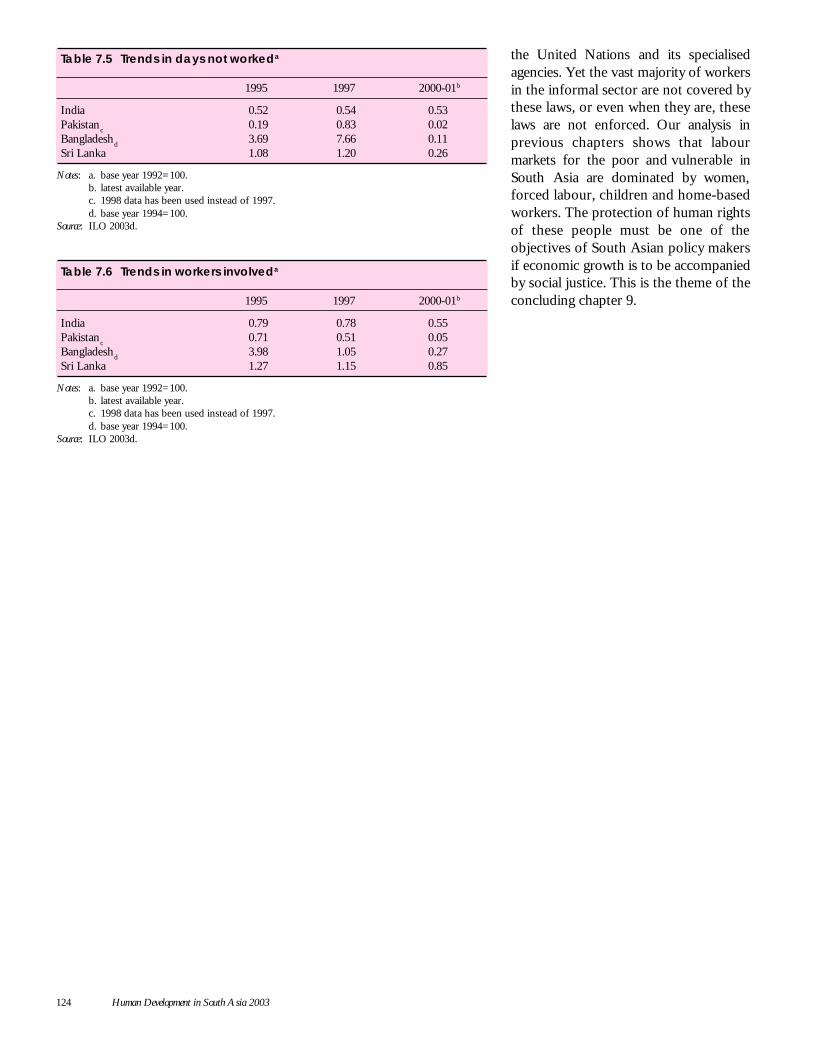
124 Human Development in South Asia 2003
the United Nations and its specialisedagencies. Yet the vast majority of workersin the informal sector are not covered bythese laws, or even when they are, theselaws are not enforced. Our analysis inprevious chapters shows that labourmarkets for the poor and vulnerable inSouth Asia are dominated by women,forced labour, children and home-basedworkers. The protection of human rightsof these people must be one of theobjectives of South Asian policy makersif economic growth is to be accompaniedby social justice. This is the theme of theconcluding chapter 9.
Table 7.5 Trends in days not workeda
1995 1997 2000-01b
India 0.52 0.54 0.53Pakistan
c0.19 0.83 0.02
Bangladeshd
3.69 7.66 0.11Sri Lanka 1.08 1.20 0.26
Notes: a. base year 1992=100.b. latest available year.c. 1998 data has been used instead of 1997.d. base year 1994=100.
Source: ILO 2003d.
Table 7.6 Trends in workers involveda
1995 1997 2000-01b
India 0.79 0.78 0.55Pakistan
c0.71 0.51 0.05
Bangladeshd
3.98 1.05 0.27Sri Lanka 1.27 1.15 0.85
Notes: a. base year 1992=100.b. latest available year.c. 1998 data has been used instead of 1997.d. base year 1994=100.
Source: ILO 2003d.
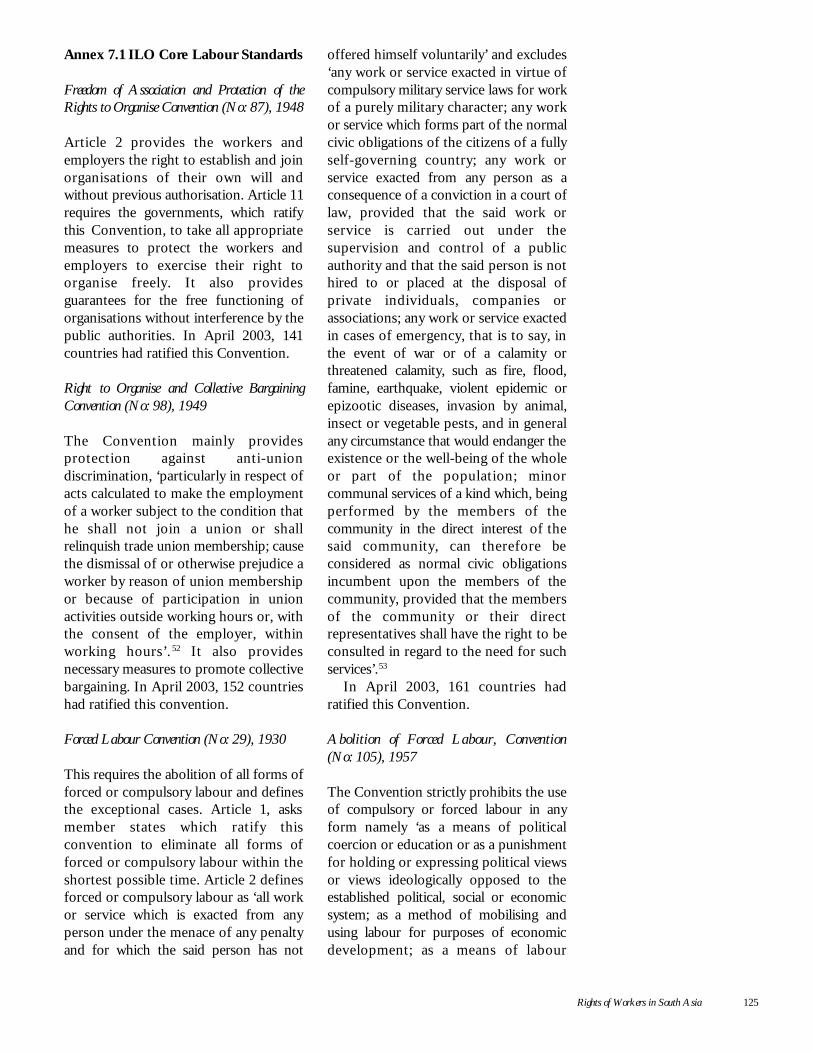
Rights of Workers in South Asia 125
Annex 7.1 ILO Core Labour Standards
Freedom of Association and Protection of theRights to Organise Convention (No: 87), 1948
Article 2 provides the workers andemployers the right to establish and joinorganisations of their own will andwithout previous authorisation. Article 11requires the governments, which ratifythis Convention, to take all appropriatemeasures to protect the workers andemployers to exercise their right toorganise freely. It also providesguarantees for the free functioning oforganisations without interference by thepublic authorities. In April 2003, 141countries had ratified this Convention.
Right to Organise and Collective BargainingConvention (No: 98), 1949
The Convention mainly providesprotection against anti-uniondiscrimination, ‘particularly in respect ofacts calculated to make the employmentof a worker subject to the condition thathe shall not join a union or shallrelinquish trade union membership; causethe dismissal of or otherwise prejudice aworker by reason of union membershipor because of participation in unionactivities outside working hours or, withthe consent of the employer, withinworking hours’. 52 It also providesnecessary measures to promote collectivebargaining. In April 2003, 152 countrieshad ratified this convention.
Forced Labour Convention (No: 29), 1930
This requires the abolition of all forms offorced or compulsory labour and definesthe exceptional cases. Article 1, asksmember states which ratify thisconvention to eliminate all forms offorced or compulsory labour within theshortest possible time. Article 2 definesforced or compulsory labour as ‘all workor service which is exacted from anyperson under the menace of any penaltyand for which the said person has not
offered himself voluntarily’ and excludes‘any work or service exacted in virtue ofcompulsory military service laws for workof a purely military character; any workor service which forms part of the normalcivic obligations of the citizens of a fullyself-governing country; any work orservice exacted from any person as aconsequence of a conviction in a court oflaw, provided that the said work orservice is carried out under thesupervision and control of a publicauthority and that the said person is nothired to or placed at the disposal ofprivate individuals, companies orassociations; any work or service exactedin cases of emergency, that is to say, inthe event of war or of a calamity orthreatened calamity, such as fire, flood,famine, earthquake, violent epidemic orepizootic diseases, invasion by animal,insect or vegetable pests, and in generalany circumstance that would endanger theexistence or the well-being of the wholeor part of the population; minorcommunal services of a kind which, beingperformed by the members of thecommunity in the direct interest of thesaid community, can therefore beconsidered as normal civic obligationsincumbent upon the members of thecommunity, provided that the membersof the community or their directrepresentatives shall have the right to beconsulted in regard to the need for suchservices’.53
In April 2003, 161 countries hadratified this Convention.
Abolition of Forced Labour, Convention(No: 105), 1957
The Convention strictly prohibits the useof compulsory or forced labour in anyform namely ‘as a means of politicalcoercion or education or as a punishmentfor holding or expressing political viewsor views ideologically opposed to theestablished political, social or economicsystem; as a method of mobilising andusing labour for purposes of economicdevelopment; as a means of labour
126 Human Development in South Asia 2003
discipline; as a punishment for havingparticipated in strikes and as a means ofracial, social, national or religiousdiscrimination’ (ILOLEX). In April 2003,159 countries had ratified thisConvention.
Discrimination (Employment and Occupation)Convention (No: 111), 1958
The Convention calls for a national policyto eliminate discrimination based on race,colour, sex, religion, political opinion,national extraction or social origin inaccess to employment, training andworking conditions. It also requires thestates to promote equal opportunity andtreatment. In April 2003, 158 countrieshad ratified this Convention.
Equal Remuneration Convention (No: 100),1951
The Convention calls for equal pay formen and women for work of equal value.Article 2, asks member states toappropriate their national laws orregulations; legally established orrecognised machinery for wagedetermination; collective agreementsbetween employers and workers; or acombination of these various means toensure the application to all workers theprinciple of equal remuneration for menand women for work of equal value.
In April 2003, 160 countries hadratified this Convention.
Minimum Age Convention (No: 138), 1973
The Convention defines the minimumage of admission to employment as the
age of completion of the compulsoryeducation, provided that it is not less than15 years. The minimum age for thedeveloping countries is 14 years. Itpermits the employment or work ofpersons 13 to 15 years of age on lightwork—the work not harmful to thehealth and development of the child andnot affecting attendance to schoolnegatively. Article 8 permits artisticperformances but requires time limits forthe work of the child. In April 2003, 124countries had ratified this Convention.
Worst Forms of Child Labour Convention(No: 182), 1999
The Convention requires the immediateand effective measures to secure theprohibition and elimination of the worstforms of child labour. Article 2, defineschildren as all persons under the age of18. The worst forms of child labour aredefined as ‘all forms of slavery orpractices similar to slavery, such as thesale and trafficking of children, debtbondage and serfdom and forced orcompulsory labour, including forced orcompulsory recruitment of children foruse in armed conflict; the use, procuringor offering of a child for prostitution, forthe production of pornography or forpornographic performances; the use,procuring or offering of a child for illicitactivities, in particular for the productionand trafficking of drugs as defined in therelevant international treaties; workwhich, by its nature or the circumstancesin which it is carried out, is likely to harmthe health, safety or morals of children’.54
Population Growth, Employment and Emigration 127
In this chapter, we explore one furthersolution to the problems of unemploy-ment and underemployment being facedby so many populous countries in SouthAsia. The conventional approachcontained in most of the academic andpolicy work on employment focuses onthe policies directed at these varioussectors of the domestic economy that canhelp absorb additional workers. Thisapproach has also been adopted in thepreceding chapters of this report, exceptin chapter 4, where we discussedinternational trade policies. In thischapter, however, we offer the view thatSouth Asia’s populous countries mustconsider emigration as one of the possiblesolutions to the persistent problems ofunemployment and underemployment.These problems will be around for a whileeven if the region manages to attain ahigh level of GDP growth. Althoughfertility in the countries of the region hasdeclined at rates not anticipated by mostpolicymakers, demographic inertia willensure that the ranks of the workforcewill continue to increase. For the nexttwo decades, South Asia will add over500 million new entrants to its alreadyvery large pool of people seekingproductive employment.
In making the suggestion thatemigration could serve to provide a safetyvalve, we are mindful of the conventionalwisdom that holds that one type ofmigration—the departure of skilledworkers—can inflict heavy damage on thelabour-exporting country. This line ofthinking that goes under the name of‘brain drain’ needs to be described andthen countered before we make the casethat the large and populous countries ofSouth Asia should seriously viewpopulation as an asset to be developed tomaximise the return from it.
Emigration as a safety valve
We begin by asking three questions:
• Is brain drain bad for the developingworld, or does it provide benefits tothe labour exporting countries that aregreater than the cost to the society oflosing trained workers?
• What is the importance of remittancessent in by workers for thedevelopment—both economic andsocial but sometimes also political—oftheir homelands?
• How can the benefits of migration bemaximised?
We address these questions below.
The brain drain: Is it all that bad?
The ‘brain drain’ argument goes back tothe early days of development economicsas a new discipline. It was then arguedthat the developing world was deficientin many things needed for promotingeconomic development. Capital andhuman skills were identified as two ofthe more important shortages that neededto be overcome. The term ‘human capital’had still to gain common currency. It wassuggested that it would be an extremelyperverse development if either capital orhuman skills began to flow in theopposite directions—from developing todeveloped countries rather than the otherway around. ‘Capital flight’ and ‘braindrain,’ therefore, earned bad names in theearly days of development economics.
A number of serious economists anddevelopment practitioners spent timecalculating the extent of loss to thedeveloping world as a result of braindrain. These analysts put their faith insimple cost-benefit analysis. The cost of
Chapter 8
Population Growth, Employment andEmigration1
South Asia’spopulous countriesshould seriouslyconsider emigrationas one of thepossible solutions tothe persistentproblems ofunemployment andunderemployment
128 Human Development in South Asia 2003
developing human skills was calculated byadding expenditures by the public sectoron schools and the financial commit-ments made by the parents in educatingtheir children. More sophisticatedanalyses included not only direct costs byparents on fees, books, transport, etc., butalso the opportunity cost to them of thetime their children were spending inschool. While the public sector treatededucation as a public good—somethingto be undertaken since there were largeexternalities associated with it—parentswere considered to be more conscious ofcost-benefit calculations. Even if suchcalculations were done implicitly, theparents had in their minds a rough notionof the present value of the stream offuture incomes that would result fromeducation and weighed it against the costof providing it. If the ratio was palpablypositive, parents were prepared to makethe needed investment in education.
Relying on this kind of arithmetic, thepeople who worried about thephenomenon of brain drain could providereasonable quantification of theassociated costs. The assumption was thatpeople, by leaving the country that hadspent precious resources on giving themeducation and imparting them withmarketable skills, were causing ameasurable loss to the society. Thebenefit cost ratio was effectively zero forthe migrant’s homeland and infinite forthe host country. Brain drain, in otherwords, left zero benefits for the poorlabour exporting country while providinginfinite benefits to the country receivingthe migrant and playing host to him. It isnot too difficult to understand why themovement of skilled people fromdeveloping to developed countries wasregarded as such a perverse event.
But is it really perverse? Are there nobenefits to the labour exporting countriesto mitigate, if not balance and outweigh,the costs associated with developing theskills carried by the migrants to the hostcountries? We argue that the concernsabout brain drain are based on staticanalysis. The assumption is that once a
skilled or semi-skilled person leaves, heor she does not pay back anything to thehomeland. However, as we review theway the various diasporas, which formedin the developed world by the citizens ofthe developing world, interacted with thehomelands, the argument based on zerobenefit to the exporting country does nothold ground. It needs to be revised toaccommodate all the benefits that flowto the homelands from the diasporacommunities. We will look below at threesuch benefits—remittances, foreign directinvestment and contribution to the socialmodernisation of the homeland.
Diasporas help in developing their homelands
The diasporas formed by the migrants inthe developed countries have a longhistory of support for their homelands.The most significant examples of this arethe Jewish and Chinese diasporas. TheJewish presence in the United States hasbeen tremendously successful for thestate of Israel. A lot of capital flows on aregular basis from the United States toIsrael through public as well as privatechannels. For decades, Israel has been thelargest recipient of official developmentassistance (ODA) from the United States.Even though the amount of total ODAas a proportion of American GDP hasdeclined over time, its flow to Israel hasbeen protected by the country’s manyfriends in the Congress. The importanceattached to Israel as a recipient ofAmerican foreign aid is the result of theenormous political clout the Jewishcommunity now has in Washington. TheAmerican Jewish community has alsoprovided Israel with material supportthrough private channels. Several Jewishowned firms in the United States haveformed alliances with firms in Israel. Thiswas particularly the case in the IT sector.2
The role played by the Jewish diaspora inAmerica will be hard to replicate by othercommunities of foreigners living andworking in developed countries.
The assistance provided by the Chineseliving abroad to the development of their
Population Growth, Employment and Emigration 129
homeland is more typical of thebehaviour of developing countries’diasporas. The older developingcountries’ diasporas have involvedthemselves in helping the developmentof their home countries in three phases.Sending remittances to the families in thehomeland is the first phase, followed byforeign direct investment sponsored bythe diasporas and, finally, as the membersof the diasporas acquire wealth, byassisting non-government organisationsdoing charity work in the countries oforigin. Each of these different types ofcapital flows from the diasporas to thehomelands is briefly reviewed below.
REMITTANCES: Remittances in theearly years of the formation of thediasporas are usually large. Workers tendto save a significant proportion of theirincomes and remit to their homelands thebulk of their savings. During this earlyperiod, links with the homeland arestrong. There is an inverse relationshipbetween the proportion remitted and theanticipated time of stay in the country.The large communities of constructionworkers imported by the Middle East inthe late seventies and the eighties mostlyfrom South Asia—in particular fromPakistan—had very large rates of savingsand substantial proportions of savingswere sent back home. For instance, theworkers from Pakistan in the Middle Eastdid not expect to stay for more than fiveyears in the countries in which they wereworking. They saved between 60 to 70per cent of their gross incomes andremitted back 70 to 80 per cent of theirsavings. Both the rates of saving and theproportion of savings remitted declinesignificantly with the length of stay. Asmigrants throw roots into the soil of thehost country and develop families of theirown, the amounts they can afford to sendback home declines, particularly in termsof the proportion of total earnings.
The channel of transmission typicallyused for remittances depends on twothings. First, on the level of education ofthe migrant workforce. And, second, on
the openness of the financial sector. Thechannels used range from the formalbanking system to the ‘hundi or huwalasystems’ as used by the South Asianworkers. For well-educated migrants, whobelong to the countries with openfinancial systems, the preferred channelfor transmission is the formal bankingsystem. However, semi-skilled andunskilled workers tend to avoid theformal system even where they are open.In open systems, they are likely to optfor semi-formal systems. For instance, theState Bank of Pakistan has estimated that80 to 90 per cent of the remittances sentby the Pakistanis working in the MiddleEast—most of whom are semi-literate—flows through a combination of formaland informal channels. The Bank’s reportidentifies the system as a combination ofofficially sanctioned retail moneychangers,foreign exchange companies, andhundiwalas (money couriers). For themigrants sending back money to thecountries with closed financial system, theonly available choice is to work with theinformal system.
The remittances sent back by thedeveloping countries’ citizens working inEurope and North America nowconstitute a significant proportion of totalexternal savings received by the labourexporting nations. For example, in 2002,2.5 per cent of South Asia’s GDP camefrom workers’ remittances (see chapter 4,table 4.10). However, it appears that theseamounts represent only a fraction of thetotal resource transfer made by thediasporas. The State Bank of Pakistanreport cited above estimates that Pakistanreceives $8-10 billion a year in the formof remittances, of which only one billiondollars flows came in through formalchannels in the late 1990s. But thedifference between total flows, and flowsthrough formal channels, is not uniqueto Pakistan. In 1996, Mexico is estimatedto have received $6.7 billion from itscitizens working in the United States,57 per cent more than the amountrecognised as having come throughformal channels.
Workers tend to savea significantproportion of theirincomes and remitback to theirhomelands the bulkof their savings
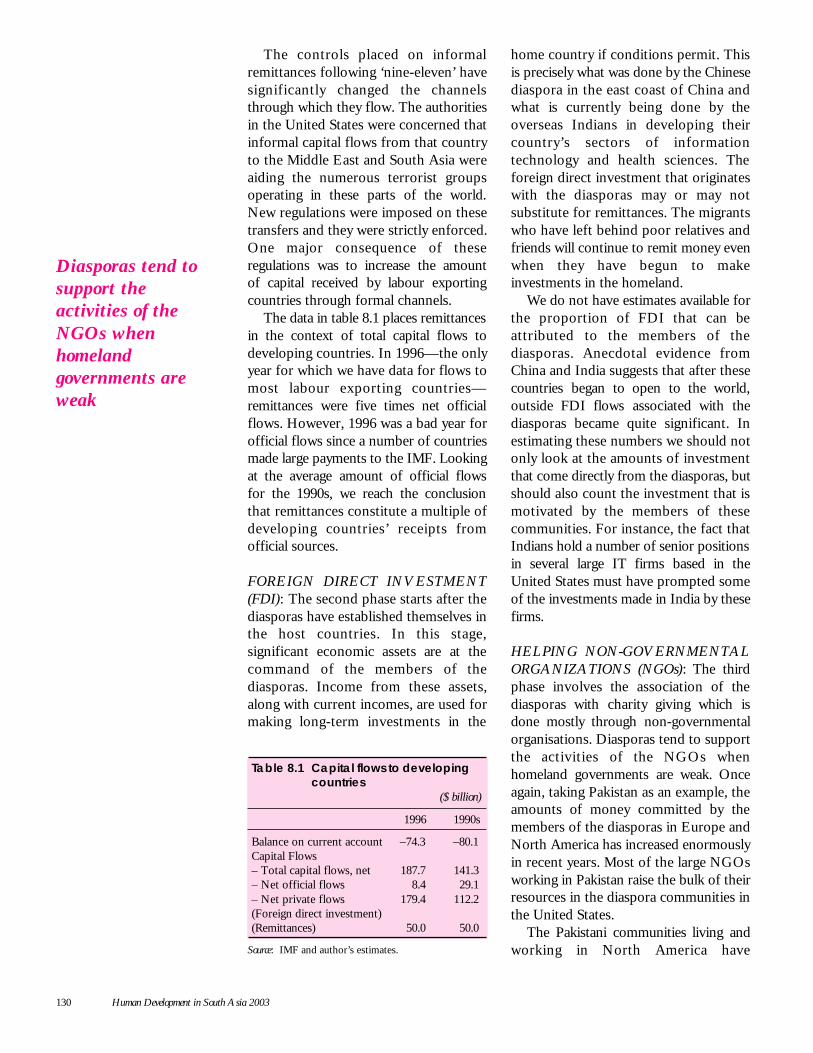
130 Human Development in South Asia 2003
The controls placed on informalremittances following ‘nine-eleven’ havesignificantly changed the channelsthrough which they flow. The authoritiesin the United States were concerned thatinformal capital flows from that countryto the Middle East and South Asia wereaiding the numerous terrorist groupsoperating in these parts of the world.New regulations were imposed on thesetransfers and they were strictly enforced.One major consequence of theseregulations was to increase the amountof capital received by labour exportingcountries through formal channels.
The data in table 8.1 places remittancesin the context of total capital flows todeveloping countries. In 1996—the onlyyear for which we have data for flows tomost labour exporting countries—remittances were five times net officialflows. However, 1996 was a bad year forofficial flows since a number of countriesmade large payments to the IMF. Lookingat the average amount of official flowsfor the 1990s, we reach the conclusionthat remittances constitute a multiple ofdeveloping countries’ receipts fromofficial sources.
FOREIGN DIRECT INVESTMENT(FDI): The second phase starts after thediasporas have established themselves inthe host countries. In this stage,significant economic assets are at thecommand of the members of thediasporas. Income from these assets,along with current incomes, are used formaking long-term investments in the
home country if conditions permit. Thisis precisely what was done by the Chinesediaspora in the east coast of China andwhat is currently being done by theoverseas Indians in developing theircountry’s sectors of informationtechnology and health sciences. Theforeign direct investment that originateswith the diasporas may or may notsubstitute for remittances. The migrantswho have left behind poor relatives andfriends will continue to remit money evenwhen they have begun to makeinvestments in the homeland.
We do not have estimates available forthe proportion of FDI that can beattributed to the members of thediasporas. Anecdotal evidence fromChina and India suggests that after thesecountries began to open to the world,outside FDI flows associated with thediasporas became quite significant. Inestimating these numbers we should notonly look at the amounts of investmentthat come directly from the diasporas, butshould also count the investment that ismotivated by the members of thesecommunities. For instance, the fact thatIndians hold a number of senior positionsin several large IT firms based in theUnited States must have prompted someof the investments made in India by thesefirms.
HELPING NON-GOVERNMENTALORGANIZATIONS (NGOs): The thirdphase involves the association of thediasporas with charity giving which isdone mostly through non-governmentalorganisations. Diasporas tend to supportthe activities of the NGOs whenhomeland governments are weak. Onceagain, taking Pakistan as an example, theamounts of money committed by themembers of the diasporas in Europe andNorth America has increased enormouslyin recent years. Most of the large NGOsworking in Pakistan raise the bulk of theirresources in the diaspora communities inthe United States.
The Pakistani communities living andworking in North America have
Table 8.1 Capital flows to developingcountries
($ billion)
1996 1990s
Balance on current account –74.3 –80.1Capital Flows– Total capital flows, net 187.7 141.3– Net official flows 8.4 29.1– Net private flows 179.4 112.2(Foreign direct investment)(Remittances) 50.0 50.0
Source: IMF and author’s estimates.
Diasporas tend tosupport theactivities of theNGOs whenhomelandgovernments areweak
Population Growth, Employment and Emigration 131
established a number of organisations thatare now actively engaged in providingeducation and health services to thecitizens of their homeland. Some of thisactivity is associated with the professionalorganisations that are now well established.The Association of Pakistani Physicians inNorth America (APPNA) is by far themost successful professional organisationin the United States and Canada. TheAPPNA has established an NGO calledAPPNA-Sehat (health) that is activelyengaged in providing basic health care andprimary education to the people living inPakistan’s impoverished northern areas.
There are many other examples of thesupport provided by the diasporasthrough NGOs for the social develop-ment of homelands. The Filipinosresident in the United States have ‘villagetwinning’ arrangements when peoplefrom one particular village come togetherto provide assistance to the people livingin the places of their origin. TheSalvadoreans and Mexicans in the UnitedStates are similarly engaged.
Each of the three phases has differentdevelopment impacts. In the first phase,when diasporas are sending money backto the homeland mostly throughremittances, development gains come tothe government through the availabilityof untied foreign flows to finance balanceof payments deficits. There is also benefitto the families supported by remittances.The bulk of these remittances is investedin small businesses or is used forimproving the level of social developmentof the members of the families that havestayed behind. In the second phase, whensignificant proportions of capital flowsfrom the diasporas go to the homelandsin the form of foreign direct investment,there is an even greater assurance ofbenefits to the society. This is also thecase when the diasporas support NGOactivities in their homelands.
Maximising the benefits of migration
Looking at the benefit of migration in adynamic sense—the approach suggested
in our discussion of the phenomenon ofbrain drain—it is possible to drawconclusions different from those whoworry about brain drain. Large developingcountries such as those in South Asia thathave had high rates of population growthhave an opportunity that could beexploited for their benefit. They haveyoung populations that can be educatedand trained to yield a supply of workersthat is much greater than the rate at whichthey could be productively employed athome. In such a situation, it isadvantageous for them to plan to obtainthe maximum benefits that can accruefrom large populations.
Public policy should be directed,therefore, at developing human capital foruse both at home and abroad. Publicpolicy should also aim to maximise thereturns from the capital flows thatoriginate with the diasporas. Govern-ments are sometimes tempted to forcethe flow of remittances into the channelsit controls. Attempts to make people sendremittances through public sector bankscan be counter-productive. One reasonwhy in closed financial systems peopleturn to informal channels for transmittingmoney to the homeland is the fear ofexcessive government interference. Infinal analysis, it is more open economiesthat will draw benefits from the diasporascreated by their citizens in Europe andNorth America.
Demographic asymmetry
For the first time in human history,demographic developments in two partsof the globe—in developed anddeveloping countries—are moving inopposite directions. Fertility has collapsedin Europe, North America and Japan—the regions of the world in which incomesper capita of the population now exceed$25,000. Fertility rates have also—andquite unexpectedly—declined in manyparts of the developing world.Demographers from around the worldmet in March 2002 at the United Nations‘to discuss and celebrate the surprising
Public policy shouldbe directed atdeveloping humancapital for use bothat home and abroad
132 Human Development in South Asia 2003
finding that the world’s population hasnot grown as fast as had been feared.Just a few years ago the expectation wasthat the planet would have 10 billionpeople by the end of the 21st century.Now it looks as if the true figure will benine billion, up from six billion’ at thebeginning of the century.3
Reductions in fertility in many poorand middle income countries areoccurring at income levels much lowerthan those at which today’s rich countriesturned the demographic corner. Threethings may have contributed toquickening the pace of fertility decline.One is improved levels of schooling—educated families tend to have fewerchildren. Education is spreading muchfaster among the populations of thedeveloping world than was generallyexpected. Another is that children arenow more likely to survive than they werein the past, which allows families to haveonly the number of children they want.Finally, the countries in which fertilitydropped most were those that providedeasy access to contraceptives. In the1960s, virtually everywhere in thedeveloping world women had, on average,six children. Today the rate is closer tothree in Bangladesh, Egypt, thePhilippines and Peru. An average fertilityrate of 2.2 children per woman bringsthe population to the level of‘replacement.’ This is the level at whichpopulation does not increase, but onlyreplaces itself. A number of developingcountries are reaching this point. Someof them have gone beyond to the sub-replacement level where women producefewer children than needed to keep thepopulation from declining.
One demographer who has studied thechanges in the levels of fertility acrossthe globe has termed this phenomenon‘population implosion’ contrasting it withthe fears of population explosion thatoccupied so many development eco-nomists and development practitionersnot too long ago. According to him:‘Simply put, the era of the worldwide‘population explosion,’ the only
demographic era within living memory, iscoming to a close…In place of thepopulation explosion, a new era ofdemographic trends—each historicallyunprecedented in its own right—is poisedto reshape, and recast, the world’spopulation profile over the comingquarter century.’4
While there will be a fairly sharpreduction in the size of the population inthe developed world in the next fiftyyears, ‘demographic inertia’—the fact thatfertility rates were fairly high not so longago and will, therefore, continue to feedpopulation growth—will ensure a steadyincrease in population size in most partsof the developing world. For severaldecades to come, the number of peopleentering the reproductive age will be largeenough to sustain a growing population.Consequently, the centre of gravity of theworld’s population, already located in thedeveloping world, will move deeper intoit in the next quarter century. Thiscontinuing shift has produced what wewould like to term the phenomenon of‘demographic asymmetry’ in the world—a phenomenon which will see populationdeclines among most rich countries andcontinuing increase in most developingcountries.
These marked differences in fertilitytrends not only ensure different rates ofpopulation growth in developed anddeveloping countries, they also mean verydifferent age profiles of the populationsin these two parts of the world.Populations in developing countries arevery young—for most of them, peopleunder the age of 20 account from two-fifths to more than one-half of the totalpopulation. On the other hand,populations in developed parts of theworld are ageing rapidly. The populationstructure in most of the developing worldretains its pyramidal shape. In manydeveloped countries, it has lost this shape,becoming more of a cylinder than apyramid. In some of them, the structuremay be moving towards a ‘reversepyramid.’ In rich countries, the fastestgrowing segment of the population is that
Population Growth, Employment and Emigration 133
of the ‘senior citizens,’ those over the ageof 65 years.
The enormous differences in thedemographic profiles of developed anddeveloping countries will profoundlyaffect the way these two parts of theworld will interact with one another. Thisis the main purpose of this chapter—toexplore how both developed anddeveloping countries could benefit fromthe window of opportunity that hasopened for a number of populousdeveloping countries. Some of thesecountries are in South Asia.
Trends in global population have beencarefully analysed by internationalagencies, governments in both developedand developing countries, developmenteconomists and demographers. 5 It isworth repeating some basic facts aboutdemographic change across the globe toplace the discussion in proper context.Most of these facts are well known:
– As a consequence of sweepingreductions in mortality, worldpopulation nearly quadrupled in just100 years, increasing from 1.6billion in 1900 to about six billionin 2000.
– However, there have been equallysweeping declines in the rate offertility in many parts of the world.Without these changes in fertility,world population today would havebeen nine billion rather than sixbillion. As a result of these changes,world population will increase toonly 7.8 billion by 2025. It is likelyto stabilise at nine billion by the endof the century.
– Fertility levels for the world fell bymore than 40 per cent in the lasthalf century—a decline equivalentto over two births per woman perlifetime. Fertility will continue todecline in the coming years; morerapidly in developing countries sincein many parts of the developedworld, it has already dropped belowthe replacement level (see below).
– As a result of declines in fertility, anumber of countries have arrived at‘sub-replacement’ levels. A sub-replacement level means that thecurrent population is not havingenough children to replace itself.This development is not confinedto developed countries, however.The largest concentration of sub-replacement population now is inEast Asia—not only in Japan, Asia’smost developed country, but inseveral other less prosperouscountries. China has seen a sharpreduction in fertility levels in recentdecades. It is now close to reachingthe stage at which fertility will onlybe at the replacement level. Later,the Chinese population may alsobegin to decline.
– While fertility is declining indeveloping countries as well,demographic inertia will continue toincrease their populations forseveral decades to come. As shownin table 8.2, the combinedpopulation of developing countriesis likely to increase by 35 per centin the next 25 years, implying agrowth rate of 1.2 per cent a year.As against this, developed countrieswill see only a minuscule increase intheir population in this 25-yearperiod—of only four per cent orless than 0.2 per cent a year. All ofthis small increase will occur in theUnited States where the populationwill continue to grow because ofmigration into the country andhigher rates of fertility among themigrants settling in America.However, even in the United Statesrestrictions on migration followingthe terrorist attacks of 11 September2001 may slow down the rate ofpopulation increase.
– The growth in world population willdecline steadily from 1.6 per cent ayear in 1980-99 to 1.1 per cent in1999-2015. The rate of populationincrease will also decline in poor
While fertility isdeclining indeveloping countriesas well,demographic inertiawill continue toincrease theirpopulations forseveral decades tocome
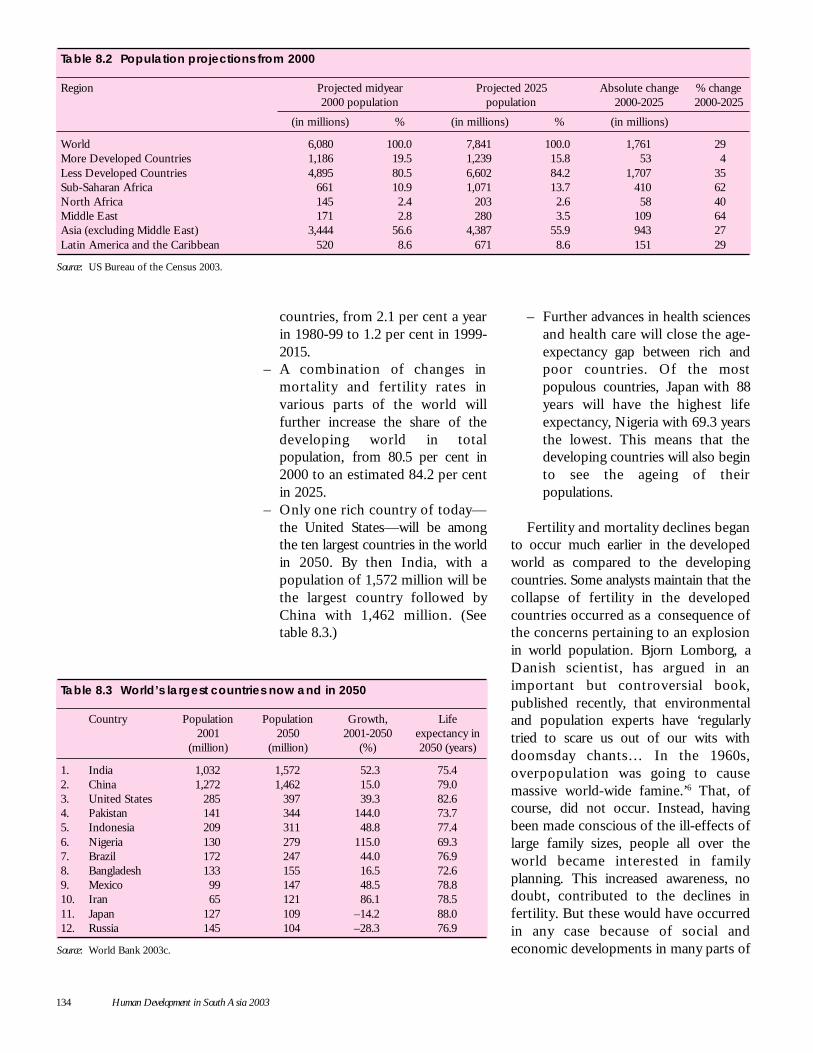
134 Human Development in South Asia 2003
countries, from 2.1 per cent a yearin 1980-99 to 1.2 per cent in 1999-2015.
– A combination of changes inmortality and fertility rates invarious parts of the world willfurther increase the share of thedeveloping world in totalpopulation, from 80.5 per cent in2000 to an estimated 84.2 per centin 2025.
– Only one rich country of today—the United States—will be amongthe ten largest countries in the worldin 2050. By then India, with apopulation of 1,572 million will bethe largest country followed byChina with 1,462 million. (Seetable 8.3.)
– Further advances in health sciencesand health care will close the age-expectancy gap between rich andpoor countries. Of the mostpopulous countries, Japan with 88years will have the highest lifeexpectancy, Nigeria with 69.3 yearsthe lowest. This means that thedeveloping countries will also beginto see the ageing of theirpopulations.
Fertility and mortality declines beganto occur much earlier in the developedworld as compared to the developingcountries. Some analysts maintain that thecollapse of fertility in the developedcountries occurred as a consequence ofthe concerns pertaining to an explosionin world population. Bjorn Lomborg, aDanish scientist, has argued in animportant but controversial book,published recently, that environmentaland population experts have ‘regularlytried to scare us out of our wits withdoomsday chants… In the 1960s,overpopulation was going to causemassive world-wide famine.’6 That, ofcourse, did not occur. Instead, havingbeen made conscious of the ill-effects oflarge family sizes, people all over theworld became interested in familyplanning. This increased awareness, nodoubt, contributed to the declines infertility. But these would have occurredin any case because of social andeconomic developments in many parts of
Table 8.2 Population projections from 2000
Region Projected midyear Projected 2025 Absolute change % change2000 population population 2000-2025 2000-2025
(in millions) % (in millions) % (in millions)
World 6,080 100.0 7,841 100.0 1,761 29More Developed Countries 1,186 19.5 1,239 15.8 53 4Less Developed Countries 4,895 80.5 6,602 84.2 1,707 35Sub-Saharan Africa 661 10.9 1,071 13.7 410 62North Africa 145 2.4 203 2.6 58 40Middle East 171 2.8 280 3.5 109 64Asia (excluding Middle East) 3,444 56.6 4,387 55.9 943 27Latin America and the Caribbean 520 8.6 671 8.6 151 29
Source: US Bureau of the Census 2003.
Table 8.3 World’s largest countries now and in 2050
Country Population Population Growth, Life2001 2050 2001-2050 expectancy in
(million) (million) (%) 2050 (years)
1. India 1,032 1,572 52.3 75.42. China 1,272 1,462 15.0 79.03. United States 285 397 39.3 82.64. Pakistan 141 344 144.0 73.75. Indonesia 209 311 48.8 77.46. Nigeria 130 279 115.0 69.37. Brazil 172 247 44.0 76.98. Bangladesh 133 155 16.5 72.69. Mexico 99 147 48.5 78.810. Iran 65 121 86.1 78.511. Japan 127 109 –14.2 88.012. Russia 145 104 –28.3 76.9
Source: World Bank 2003c.
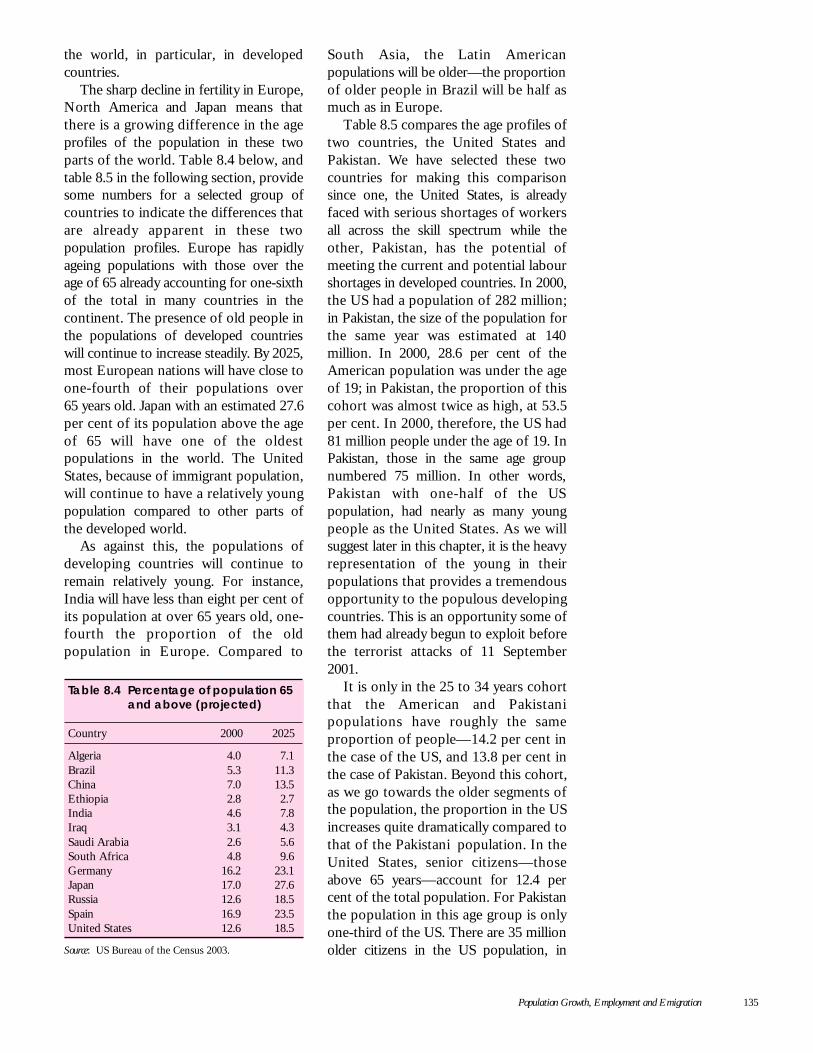
Population Growth, Employment and Emigration 135
the world, in particular, in developedcountries.
The sharp decline in fertility in Europe,North America and Japan means thatthere is a growing difference in the ageprofiles of the population in these twoparts of the world. Table 8.4 below, andtable 8.5 in the following section, providesome numbers for a selected group ofcountries to indicate the differences thatare already apparent in these twopopulation profiles. Europe has rapidlyageing populations with those over theage of 65 already accounting for one-sixthof the total in many countries in thecontinent. The presence of old people inthe populations of developed countrieswill continue to increase steadily. By 2025,most European nations will have close toone-fourth of their populations over65 years old. Japan with an estimated 27.6per cent of its population above the ageof 65 will have one of the oldestpopulations in the world. The UnitedStates, because of immigrant population,will continue to have a relatively youngpopulation compared to other parts ofthe developed world.
As against this, the populations ofdeveloping countries will continue toremain relatively young. For instance,India will have less than eight per cent ofits population at over 65 years old, one-fourth the proportion of the oldpopulation in Europe. Compared to
South Asia, the Latin Americanpopulations will be older—the proportionof older people in Brazil will be half asmuch as in Europe.
Table 8.5 compares the age profiles oftwo countries, the United States andPakistan. We have selected these twocountries for making this comparisonsince one, the United States, is alreadyfaced with serious shortages of workersall across the skill spectrum while theother, Pakistan, has the potential ofmeeting the current and potential labourshortages in developed countries. In 2000,the US had a population of 282 million;in Pakistan, the size of the population forthe same year was estimated at 140million. In 2000, 28.6 per cent of theAmerican population was under the ageof 19; in Pakistan, the proportion of thiscohort was almost twice as high, at 53.5per cent. In 2000, therefore, the US had81 million people under the age of 19. InPakistan, those in the same age groupnumbered 75 million. In other words,Pakistan with one-half of the USpopulation, had nearly as many youngpeople as the United States. As we willsuggest later in this chapter, it is the heavyrepresentation of the young in theirpopulations that provides a tremendousopportunity to the populous developingcountries. This is an opportunity some ofthem had already begun to exploit beforethe terrorist attacks of 11 September2001.
It is only in the 25 to 34 years cohortthat the American and Pakistanipopulations have roughly the sameproportion of people—14.2 per cent inthe case of the US, and 13.8 per cent inthe case of Pakistan. Beyond this cohort,as we go towards the older segments ofthe population, the proportion in the USincreases quite dramatically compared tothat of the Pakistani population. In theUnited States, senior citizens—thoseabove 65 years—account for 12.4 percent of the total population. For Pakistanthe population in this age group is onlyone-third of the US. There are 35 millionolder citizens in the US population, in
Table 8.4 Percentage of population 65and above (projected)
Country 2000 2025
Algeria 4.0 7.1Brazil 5.3 11.3China 7.0 13.5Ethiopia 2.8 2.7India 4.6 7.8Iraq 3.1 4.3Saudi Arabia 2.6 5.6South Africa 4.8 9.6Germany 16.2 23.1Japan 17.0 27.6Russia 12.6 18.5Spain 16.9 23.5United States 12.6 18.5
Source: US Bureau of the Census 2003.
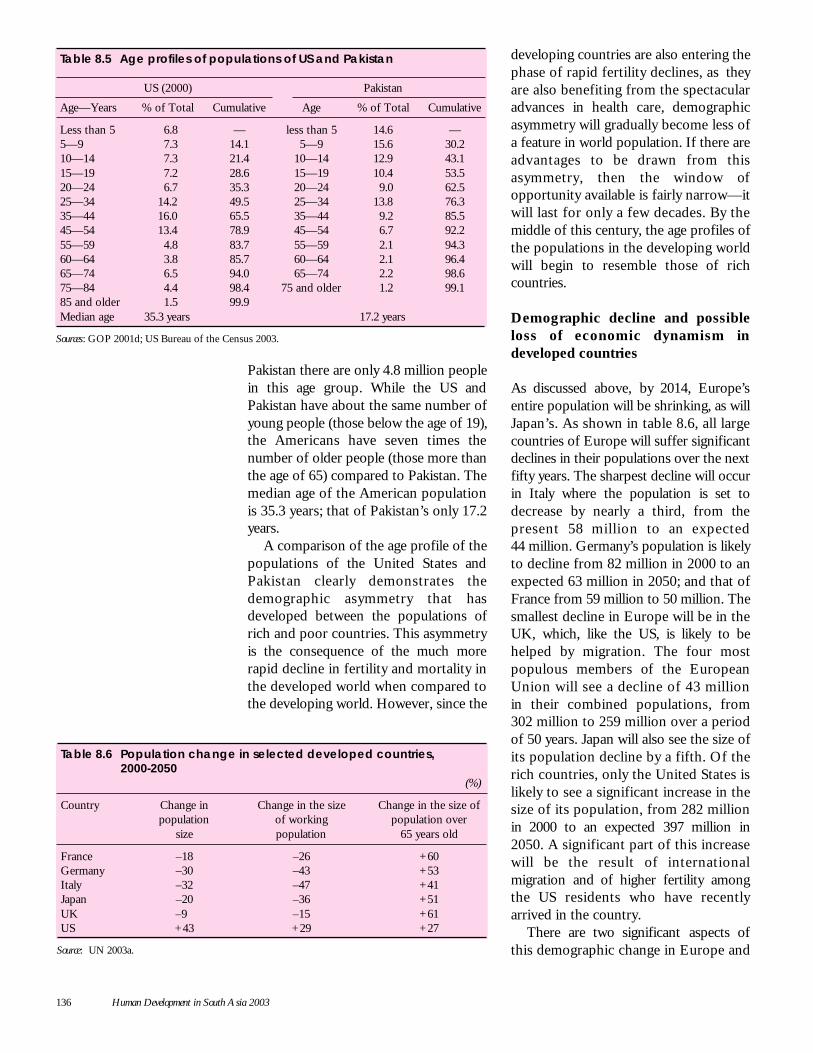
136 Human Development in South Asia 2003
Pakistan there are only 4.8 million peoplein this age group. While the US andPakistan have about the same number ofyoung people (those below the age of 19),the Americans have seven times thenumber of older people (those more thanthe age of 65) compared to Pakistan. Themedian age of the American populationis 35.3 years; that of Pakistan’s only 17.2years.
A comparison of the age profile of thepopulations of the United States andPakistan clearly demonstrates thedemographic asymmetry that hasdeveloped between the populations ofrich and poor countries. This asymmetryis the consequence of the much morerapid decline in fertility and mortality inthe developed world when compared tothe developing world. However, since the
developing countries are also entering thephase of rapid fertility declines, as theyare also benefiting from the spectacularadvances in health care, demographicasymmetry will gradually become less ofa feature in world population. If there areadvantages to be drawn from thisasymmetry, then the window ofopportunity available is fairly narrow—itwill last for only a few decades. By themiddle of this century, the age profiles ofthe populations in the developing worldwill begin to resemble those of richcountries.
Demographic decline and possibleloss of economic dynamism indeveloped countries
As discussed above, by 2014, Europe’sentire population will be shrinking, as willJapan’s. As shown in table 8.6, all largecountries of Europe will suffer significantdeclines in their populations over the nextfifty years. The sharpest decline will occurin Italy where the population is set todecrease by nearly a third, from thepresent 58 million to an expected44 million. Germany’s population is likelyto decline from 82 million in 2000 to anexpected 63 million in 2050; and that ofFrance from 59 million to 50 million. Thesmallest decline in Europe will be in theUK, which, like the US, is likely to behelped by migration. The four mostpopulous members of the EuropeanUnion will see a decline of 43 millionin their combined populations, from302 million to 259 million over a periodof 50 years. Japan will also see the size ofits population decline by a fifth. Of therich countries, only the United States islikely to see a significant increase in thesize of its population, from 282 millionin 2000 to an expected 397 million in2050. A significant part of this increasewill be the result of internationalmigration and of higher fertility amongthe US residents who have recentlyarrived in the country.
There are two significant aspects ofthis demographic change in Europe and
Table 8.5 Age profiles of populations of US and Pakistan
US (2000) Pakistan
Age—Years % of Total Cumulative Age % of Total Cumulative
Less than 5 6.8 — less than 5 14.6 —5—9 7.3 14.1 5—9 15.6 30.210—14 7.3 21.4 10—14 12.9 43.115—19 7.2 28.6 15—19 10.4 53.520—24 6.7 35.3 20—24 9.0 62.525—34 14.2 49.5 25—34 13.8 76.335—44 16.0 65.5 35—44 9.2 85.545—54 13.4 78.9 45—54 6.7 92.255—59 4.8 83.7 55—59 2.1 94.360—64 3.8 85.7 60—64 2.1 96.465—74 6.5 94.0 65—74 2.2 98.675—84 4.4 98.4 75 and older 1.2 99.185 and older 1.5 99.9Median age 35.3 years 17.2 years
Sources: GOP 2001d; US Bureau of the Census 2003.
Table 8.6 Population change in selected developed countries,2000-2050
(%)
Country Change in Change in the size Change in the size ofpopulation of working population over
size population 65 years old
France –18 –26 +60Germany –30 –43 +53Italy –32 –47 +41Japan –20 –36 +51UK –9 –15 +61US +43 +29 +27
Source: UN 2003a.
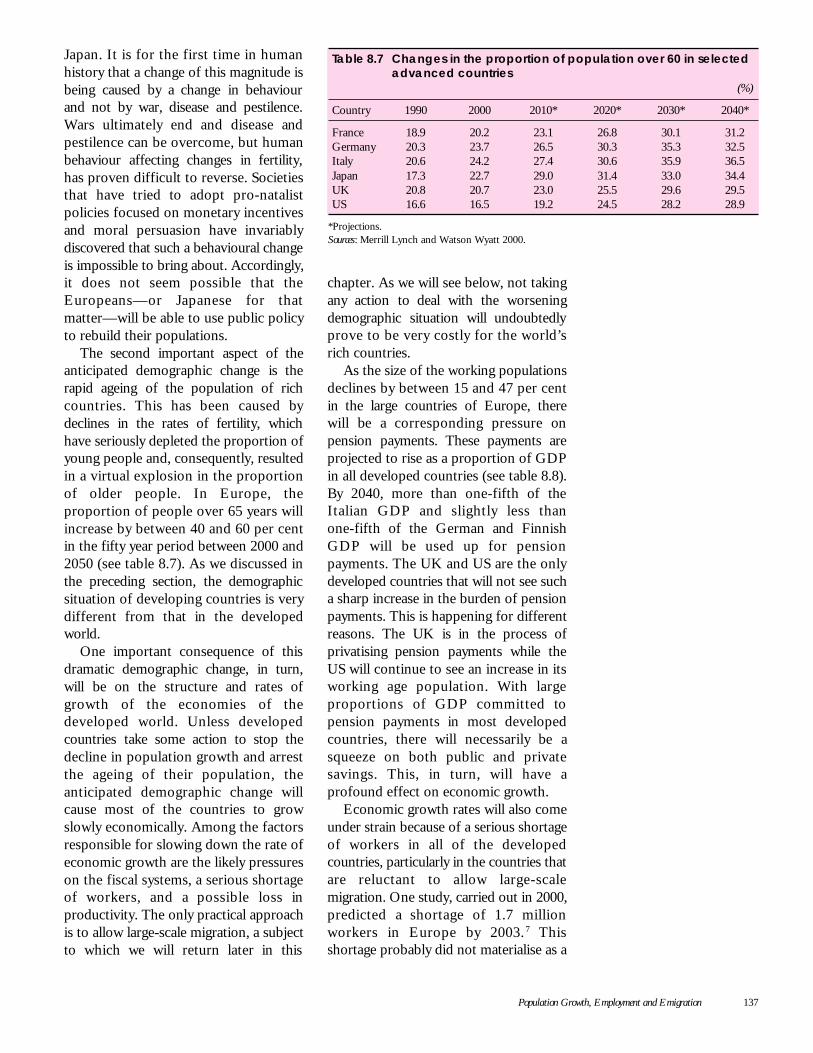
Population Growth, Employment and Emigration 137
Japan. It is for the first time in humanhistory that a change of this magnitude isbeing caused by a change in behaviourand not by war, disease and pestilence.Wars ultimately end and disease andpestilence can be overcome, but humanbehaviour affecting changes in fertility,has proven difficult to reverse. Societiesthat have tried to adopt pro-natalistpolicies focused on monetary incentivesand moral persuasion have invariablydiscovered that such a behavioural changeis impossible to bring about. Accordingly,it does not seem possible that theEuropeans—or Japanese for thatmatter—will be able to use public policyto rebuild their populations.
The second important aspect of theanticipated demographic change is therapid ageing of the population of richcountries. This has been caused bydeclines in the rates of fertility, whichhave seriously depleted the proportion ofyoung people and, consequently, resultedin a virtual explosion in the proportionof older people. In Europe, theproportion of people over 65 years willincrease by between 40 and 60 per centin the fifty year period between 2000 and2050 (see table 8.7). As we discussed inthe preceding section, the demographicsituation of developing countries is verydifferent from that in the developedworld.
One important consequence of thisdramatic demographic change, in turn,will be on the structure and rates ofgrowth of the economies of thedeveloped world. Unless developedcountries take some action to stop thedecline in population growth and arrestthe ageing of their population, theanticipated demographic change willcause most of the countries to growslowly economically. Among the factorsresponsible for slowing down the rate ofeconomic growth are the likely pressureson the fiscal systems, a serious shortageof workers, and a possible loss inproductivity. The only practical approachis to allow large-scale migration, a subjectto which we will return later in this
chapter. As we will see below, not takingany action to deal with the worseningdemographic situation will undoubtedlyprove to be very costly for the world’srich countries.
As the size of the working populationsdeclines by between 15 and 47 per centin the large countries of Europe, therewill be a corresponding pressure onpension payments. These payments areprojected to rise as a proportion of GDPin all developed countries (see table 8.8).By 2040, more than one-fifth of theItalian GDP and slightly less thanone-fifth of the German and FinnishGDP will be used up for pensionpayments. The UK and US are the onlydeveloped countries that will not see sucha sharp increase in the burden of pensionpayments. This is happening for differentreasons. The UK is in the process ofprivatising pension payments while theUS will continue to see an increase in itsworking age population. With largeproportions of GDP committed topension payments in most developedcountries, there will necessarily be asqueeze on both public and privatesavings. This, in turn, will have aprofound effect on economic growth.
Economic growth rates will also comeunder strain because of a serious shortageof workers in all of the developedcountries, particularly in the countries thatare reluctant to allow large-scalemigration. One study, carried out in 2000,predicted a shortage of 1.7 millionworkers in Europe by 2003. 7 Thisshortage probably did not materialise as a
Table 8.7 Changes in the proportion of population over 60 in selectedadvanced countries
(%)
Country 1990 2000 2010* 2020* 2030* 2040*
France 18.9 20.2 23.1 26.8 30.1 31.2Germany 20.3 23.7 26.5 30.3 35.3 32.5Italy 20.6 24.2 27.4 30.6 35.9 36.5Japan 17.3 22.7 29.0 31.4 33.0 34.4UK 20.8 20.7 23.0 25.5 29.6 29.5US 16.6 16.5 19.2 24.5 28.2 28.9
*Projections.Sources: Merrill Lynch and Watson Wyatt 2000.
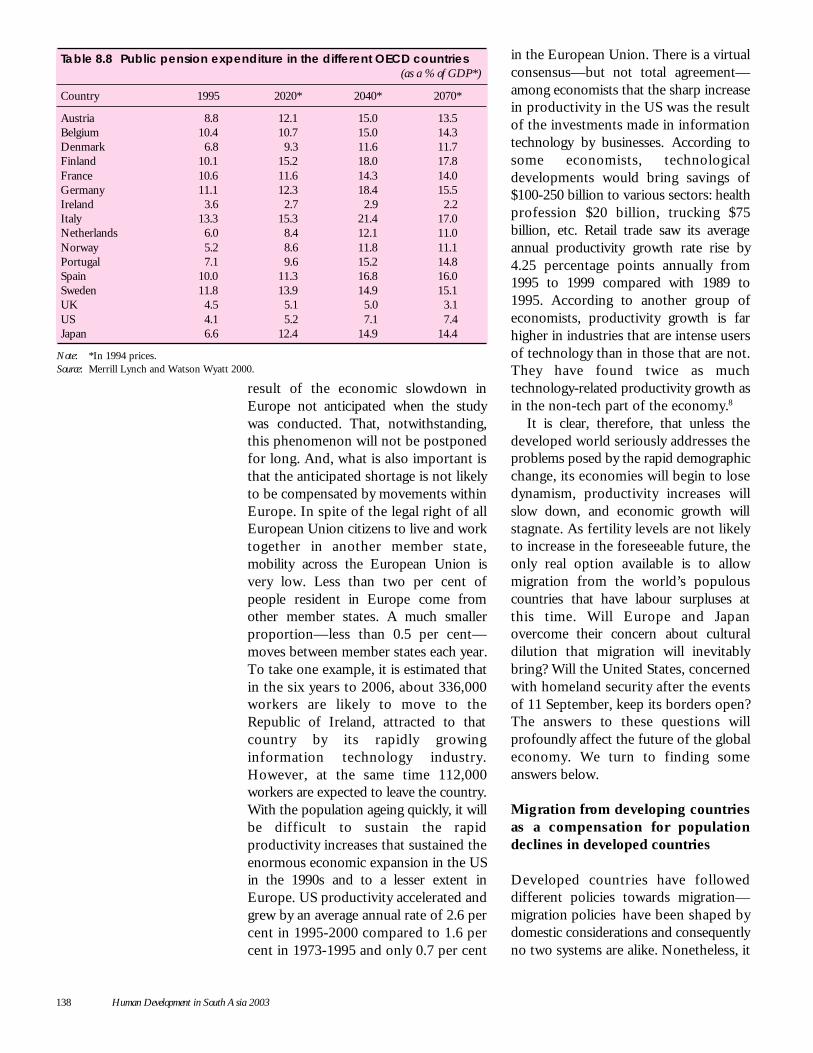
138 Human Development in South Asia 2003
result of the economic slowdown inEurope not anticipated when the studywas conducted. That, notwithstanding,this phenomenon will not be postponedfor long. And, what is also important isthat the anticipated shortage is not likelyto be compensated by movements withinEurope. In spite of the legal right of allEuropean Union citizens to live and worktogether in another member state,mobility across the European Union isvery low. Less than two per cent ofpeople resident in Europe come fromother member states. A much smallerproportion—less than 0.5 per cent—moves between member states each year.To take one example, it is estimated thatin the six years to 2006, about 336,000workers are likely to move to theRepublic of Ireland, attracted to thatcountry by its rapidly growinginformation technology industry.However, at the same time 112,000workers are expected to leave the country.With the population ageing quickly, it willbe difficult to sustain the rapidproductivity increases that sustained theenormous economic expansion in the USin the 1990s and to a lesser extent inEurope. US productivity accelerated andgrew by an average annual rate of 2.6 percent in 1995-2000 compared to 1.6 percent in 1973-1995 and only 0.7 per cent
in the European Union. There is a virtualconsensus—but not total agreement—among economists that the sharp increasein productivity in the US was the resultof the investments made in informationtechnology by businesses. According tosome economists, technologicaldevelopments would bring savings of$100-250 billion to various sectors: healthprofession $20 billion, trucking $75billion, etc. Retail trade saw its averageannual productivity growth rate rise by4.25 percentage points annually from1995 to 1999 compared with 1989 to1995. According to another group ofeconomists, productivity growth is farhigher in industries that are intense usersof technology than in those that are not.They have found twice as muchtechnology-related productivity growth asin the non-tech part of the economy.8
It is clear, therefore, that unless thedeveloped world seriously addresses theproblems posed by the rapid demographicchange, its economies will begin to losedynamism, productivity increases willslow down, and economic growth willstagnate. As fertility levels are not likelyto increase in the foreseeable future, theonly real option available is to allowmigration from the world’s populouscountries that have labour surpluses atthis time. Will Europe and Japanovercome their concern about culturaldilution that migration will inevitablybring? Will the United States, concernedwith homeland security after the eventsof 11 September, keep its borders open?The answers to these questions willprofoundly affect the future of the globaleconomy. We turn to finding someanswers below.
Migration from developing countriesas a compensation for populationdeclines in developed countries
Developed countries have followeddifferent policies towards migration—migration policies have been shaped bydomestic considerations and consequentlyno two systems are alike. Nonetheless, it
Table 8.8 Public pension expenditure in the different OECD countries(as a % of GDP*)
Country 1995 2020* 2040* 2070*
Austria 8.8 12.1 15.0 13.5Belgium 10.4 10.7 15.0 14.3Denmark 6.8 9.3 11.6 11.7Finland 10.1 15.2 18.0 17.8France 10.6 11.6 14.3 14.0Germany 11.1 12.3 18.4 15.5Ireland 3.6 2.7 2.9 2.2Italy 13.3 15.3 21.4 17.0Netherlands 6.0 8.4 12.1 11.0Norway 5.2 8.6 11.8 11.1Portugal 7.1 9.6 15.2 14.8Spain 10.0 11.3 16.8 16.0Sweden 11.8 13.9 14.9 15.1UK 4.5 5.1 5.0 3.1US 4.1 5.2 7.1 7.4Japan 6.6 12.4 14.9 14.4
Note: *In 1994 prices.Source: Merrill Lynch and Watson Wyatt 2000.
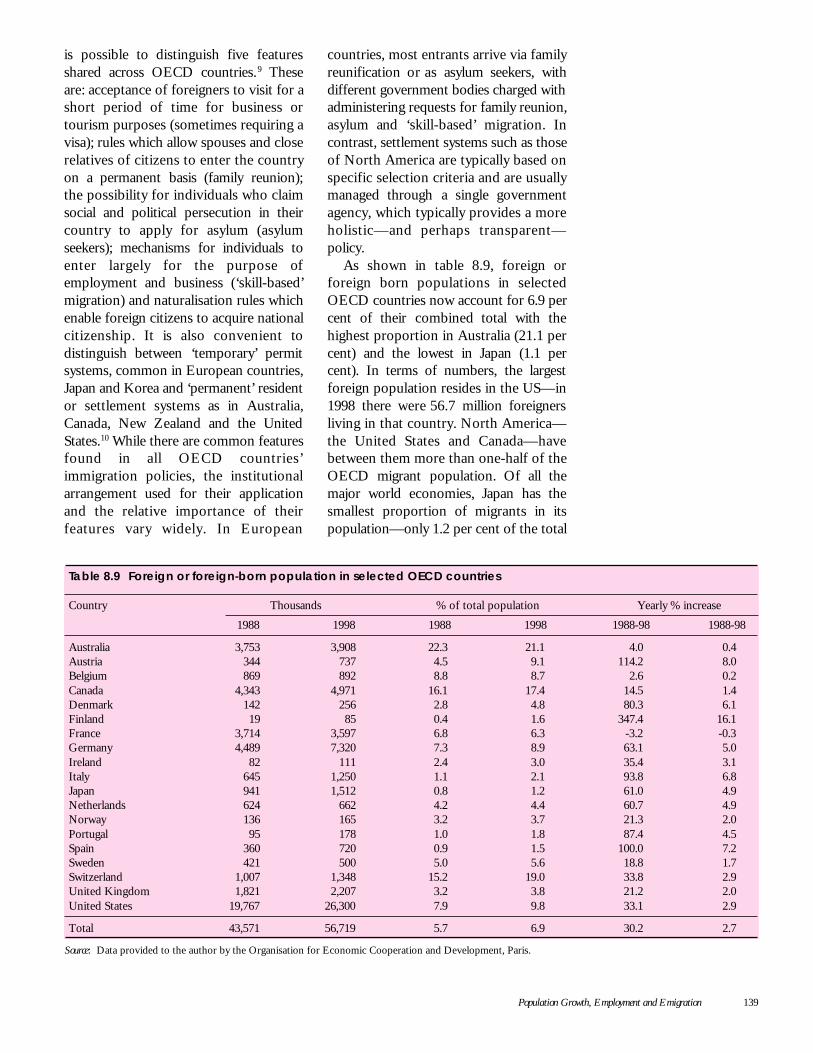
Population Growth, Employment and Emigration 139
is possible to distinguish five featuresshared across OECD countries.9 Theseare: acceptance of foreigners to visit for ashort period of time for business ortourism purposes (sometimes requiring avisa); rules which allow spouses and closerelatives of citizens to enter the countryon a permanent basis (family reunion);the possibility for individuals who claimsocial and political persecution in theircountry to apply for asylum (asylumseekers); mechanisms for individuals toenter largely for the purpose ofemployment and business (‘skill-based’migration) and naturalisation rules whichenable foreign citizens to acquire nationalcitizenship. It is also convenient todistinguish between ‘temporary’ permitsystems, common in European countries,Japan and Korea and ‘permanent’ residentor settlement systems as in Australia,Canada, New Zealand and the UnitedStates.10 While there are common featuresfound in all OECD countries’immigration policies, the institutionalarrangement used for their applicationand the relative importance of theirfeatures vary widely. In European
countries, most entrants arrive via familyreunification or as asylum seekers, withdifferent government bodies charged withadministering requests for family reunion,asylum and ‘skill-based’ migration. Incontrast, settlement systems such as thoseof North America are typically based onspecific selection criteria and are usuallymanaged through a single governmentagency, which typically provides a moreholistic—and perhaps transparent—policy.
As shown in table 8.9, foreign orforeign born populations in selectedOECD countries now account for 6.9 percent of their combined total with thehighest proportion in Australia (21.1 percent) and the lowest in Japan (1.1 percent). In terms of numbers, the largestforeign population resides in the US—in1998 there were 56.7 million foreignersliving in that country. North America—the United States and Canada—havebetween them more than one-half of theOECD migrant population. Of all themajor world economies, Japan has thesmallest proportion of migrants in itspopulation—only 1.2 per cent of the total
Table 8.9 Foreign or foreign-born population in selected OECD countries
Country Thousands % of total population Yearly % increase
1988 1998 1988 1998 1988-98 1988-98
Australia 3,753 3,908 22.3 21.1 4.0 0.4Austria 344 737 4.5 9.1 114.2 8.0Belgium 869 892 8.8 8.7 2.6 0.2Canada 4,343 4,971 16.1 17.4 14.5 1.4Denmark 142 256 2.8 4.8 80.3 6.1Finland 19 85 0.4 1.6 347.4 16.1France 3,714 3,597 6.8 6.3 -3.2 -0.3Germany 4,489 7,320 7.3 8.9 63.1 5.0Ireland 82 111 2.4 3.0 35.4 3.1Italy 645 1,250 1.1 2.1 93.8 6.8Japan 941 1,512 0.8 1.2 61.0 4.9Netherlands 624 662 4.2 4.4 60.7 4.9Norway 136 165 3.2 3.7 21.3 2.0Portugal 95 178 1.0 1.8 87.4 4.5Spain 360 720 0.9 1.5 100.0 7.2Sweden 421 500 5.0 5.6 18.8 1.7Switzerland 1,007 1,348 15.2 19.0 33.8 2.9United Kingdom 1,821 2,207 3.2 3.8 21.2 2.0United States 19,767 26,300 7.9 9.8 33.1 2.9
Total 43,571 56,719 5.7 6.9 30.2 2.7
Source: Data provided to the author by the Organisation for Economic Cooperation and Development, Paris.
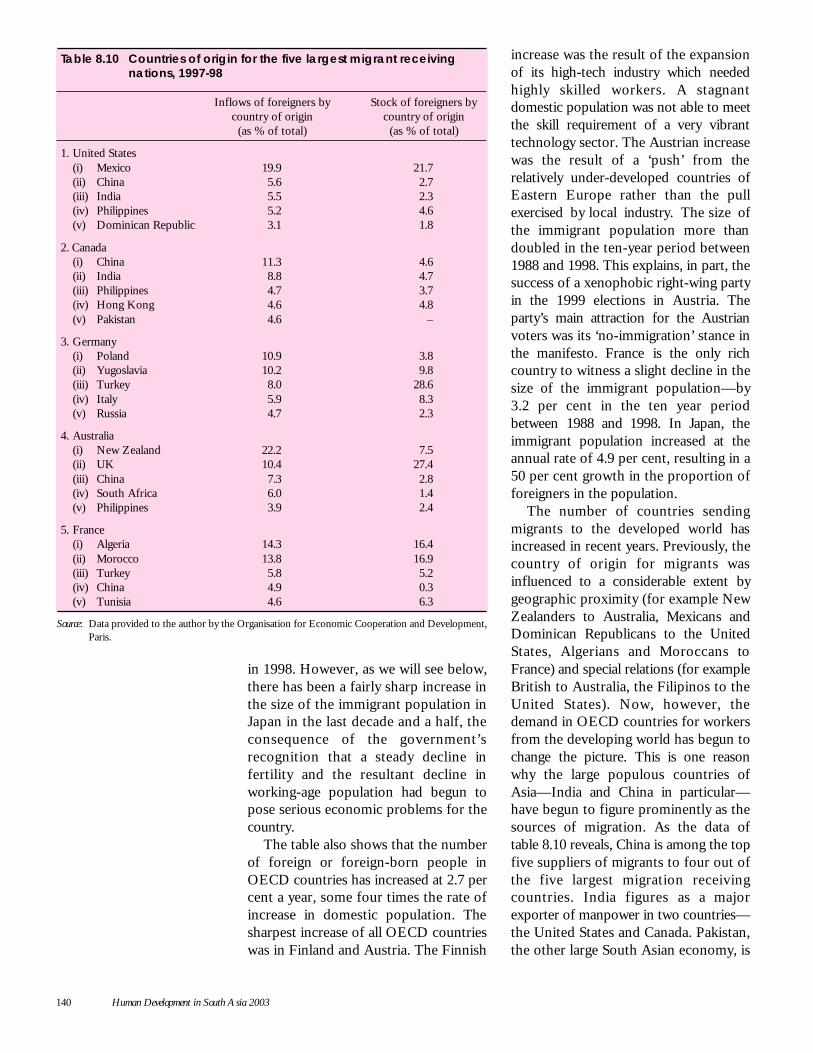
140 Human Development in South Asia 2003
in 1998. However, as we will see below,there has been a fairly sharp increase inthe size of the immigrant population inJapan in the last decade and a half, theconsequence of the government’srecognition that a steady decline infertility and the resultant decline inworking-age population had begun topose serious economic problems for thecountry.
The table also shows that the numberof foreign or foreign-born people inOECD countries has increased at 2.7 percent a year, some four times the rate ofincrease in domestic population. Thesharpest increase of all OECD countrieswas in Finland and Austria. The Finnish
increase was the result of the expansionof its high-tech industry which neededhighly skilled workers. A stagnantdomestic population was not able to meetthe skill requirement of a very vibranttechnology sector. The Austrian increasewas the result of a ‘push’ from therelatively under-developed countries ofEastern Europe rather than the pullexercised by local industry. The size ofthe immigrant population more thandoubled in the ten-year period between1988 and 1998. This explains, in part, thesuccess of a xenophobic right-wing partyin the 1999 elections in Austria. Theparty’s main attraction for the Austrianvoters was its ‘no-immigration’ stance inthe manifesto. France is the only richcountry to witness a slight decline in thesize of the immigrant population—by3.2 per cent in the ten year periodbetween 1988 and 1998. In Japan, theimmigrant population increased at theannual rate of 4.9 per cent, resulting in a50 per cent growth in the proportion offoreigners in the population.
The number of countries sendingmigrants to the developed world hasincreased in recent years. Previously, thecountry of origin for migrants wasinfluenced to a considerable extent bygeographic proximity (for example NewZealanders to Australia, Mexicans andDominican Republicans to the UnitedStates, Algerians and Moroccans toFrance) and special relations (for exampleBritish to Australia, the Filipinos to theUnited States). Now, however, thedemand in OECD countries for workersfrom the developing world has begun tochange the picture. This is one reasonwhy the large populous countries ofAsia—India and China in particular—have begun to figure prominently as thesources of migration. As the data oftable 8.10 reveals, China is among the topfive suppliers of migrants to four out ofthe five largest migration receivingcountries. India figures as a majorexporter of manpower in two countries—the United States and Canada. Pakistan,the other large South Asian economy, is
Table 8.10 Countries of origin for the five largest migrant receivingnations, 1997-98
Inflows of foreigners by Stock of foreigners bycountry of origin country of origin
(as % of total) (as % of total)
1. United States(i) Mexico 19.9 21.7(ii) China 5.6 2.7(iii) India 5.5 2.3(iv) Philippines 5.2 4.6(v) Dominican Republic 3.1 1.8
2. Canada(i) China 11.3 4.6(ii) India 8.8 4.7(iii) Philippines 4.7 3.7(iv) Hong Kong 4.6 4.8(v) Pakistan 4.6 –
3. Germany(i) Poland 10.9 3.8(ii) Yugoslavia 10.2 9.8(iii) Turkey 8.0 28.6(iv) Italy 5.9 8.3(v) Russia 4.7 2.3
4. Australia(i) New Zealand 22.2 7.5(ii) UK 10.4 27.4(iii) China 7.3 2.8(iv) South Africa 6.0 1.4(v) Philippines 3.9 2.4
5. France(i) Algeria 14.3 16.4(ii) Morocco 13.8 16.9(iii) Turkey 5.8 5.2(iv) China 4.9 0.3(v) Tunisia 4.6 6.3
Source: Data provided to the author by the Organisation for Economic Cooperation and Development,Paris.
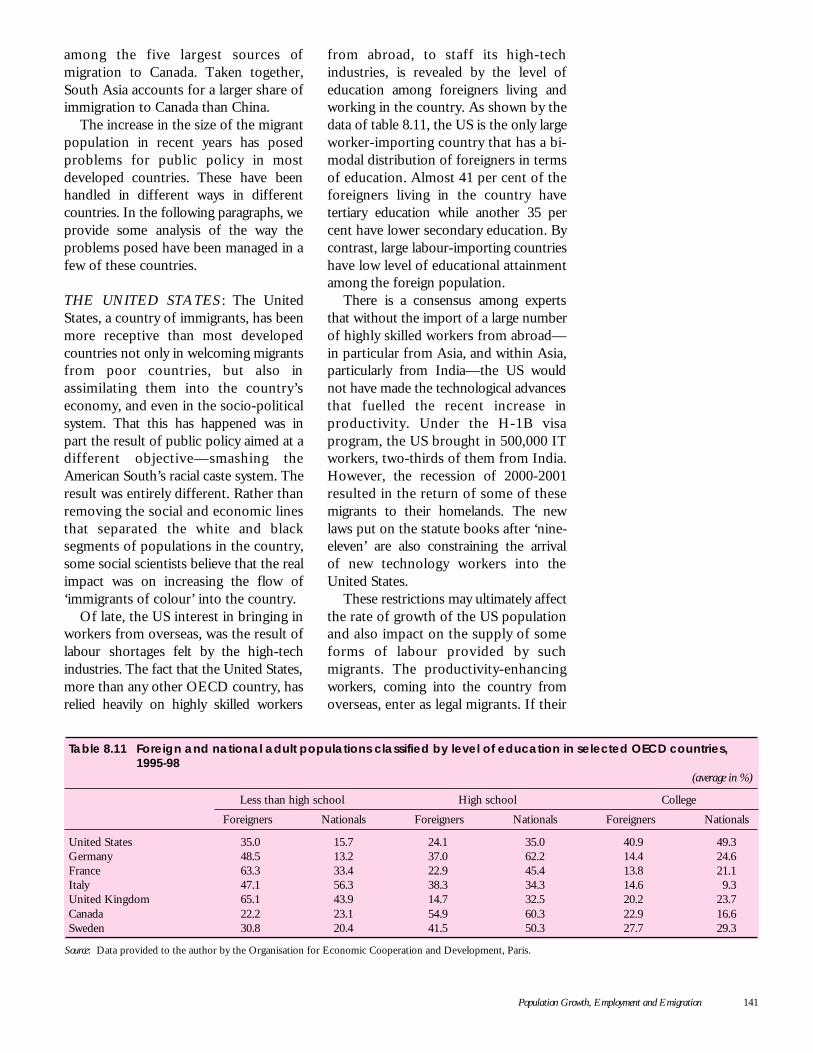
Population Growth, Employment and Emigration 141
among the five largest sources ofmigration to Canada. Taken together,South Asia accounts for a larger share ofimmigration to Canada than China.
The increase in the size of the migrantpopulation in recent years has posedproblems for public policy in mostdeveloped countries. These have beenhandled in different ways in differentcountries. In the following paragraphs, weprovide some analysis of the way theproblems posed have been managed in afew of these countries.
THE UNITED STATES : The UnitedStates, a country of immigrants, has beenmore receptive than most developedcountries not only in welcoming migrantsfrom poor countries, but also inassimilating them into the country’seconomy, and even in the socio-politicalsystem. That this has happened was inpart the result of public policy aimed at adifferent objective—smashing theAmerican South’s racial caste system. Theresult was entirely different. Rather thanremoving the social and economic linesthat separated the white and blacksegments of populations in the country,some social scientists believe that the realimpact was on increasing the flow of‘immigrants of colour’ into the country.
Of late, the US interest in bringing inworkers from overseas, was the result oflabour shortages felt by the high-techindustries. The fact that the United States,more than any other OECD country, hasrelied heavily on highly skilled workers
from abroad, to staff its high-techindustries, is revealed by the level ofeducation among foreigners living andworking in the country. As shown by thedata of table 8.11, the US is the only largeworker-importing country that has a bi-modal distribution of foreigners in termsof education. Almost 41 per cent of theforeigners living in the country havetertiary education while another 35 percent have lower secondary education. Bycontrast, large labour-importing countrieshave low level of educational attainmentamong the foreign population.
There is a consensus among expertsthat without the import of a large numberof highly skilled workers from abroad—in particular from Asia, and within Asia,particularly from India—the US wouldnot have made the technological advancesthat fuelled the recent increase inproductivity. Under the H-1B visaprogram, the US brought in 500,000 ITworkers, two-thirds of them from India.However, the recession of 2000-2001resulted in the return of some of thesemigrants to their homelands. The newlaws put on the statute books after ‘nine-eleven’ are also constraining the arrivalof new technology workers into theUnited States.
These restrictions may ultimately affectthe rate of growth of the US populationand also impact on the supply of someforms of labour provided by suchmigrants. The productivity-enhancingworkers, coming into the country fromoverseas, enter as legal migrants. If their
Table 8.11 Foreign and national adult populations classified by level of education in selected OECD countries,1995-98
(average in %)
Less than high school High school College
Foreigners Nationals Foreigners Nationals Foreigners Nationals
United States 35.0 15.7 24.1 35.0 40.9 49.3Germany 48.5 13.2 37.0 62.2 14.4 24.6France 63.3 33.4 22.9 45.4 13.8 21.1Italy 47.1 56.3 38.3 34.3 14.6 9.3United Kingdom 65.1 43.9 14.7 32.5 20.2 23.7Canada 22.2 23.1 54.9 60.3 22.9 16.6Sweden 30.8 20.4 41.5 50.3 27.7 29.3
Source: Data provided to the author by the Organisation for Economic Cooperation and Development, Paris.
142 Human Development in South Asia 2003
numbers decline—as they have in recentmonths—it is because of the slowdownin the economy and the bursting of thetechnology bubble. Once the economyrevives, these skill shortages will reappearand, it seems, that the US will continueto attract people from abroad—mostlyfrom parts of the developing world thathave the ability to produce highly trainedworkers.
JAPAN: Japan has resolutely kept outforeigners, except for a spate of Koreanimmigrants in the 1920s and 1930s whosedescendants are still being discriminatedagainst. Recognising that the sharpdecline in the size of the country’spopulation in the next fifty years will haveprofound implications for the dynamismof the domestic economy, there was talkin 2001 of admitting 500,000 Koreanseach year. Nonetheless, the Japaneseremained worried about the impact ontheir culture of the infusion of such alarge number of foreigners into thecountry. Consequently, even if half amillion Koreans were allowed into thecountry, they would be brought in on thestrict understanding that they will not stayfor more than five years, to be replacedby a fresh batch of migrants. If Japansucceeded—and there are serious doubtsthat it would—it will be the only majorworker-short country to make such aprocess work.
UNITED KINGDOM : Before theterrorists’ attack of 11 September 2001,several other skill-short developedcountries were also following the USstrategy. The UK authorities, recognisingthat they too faced serious shortages ofworkers in several skill areas, began toencourage migration to their country inthe late 1990s. In a study completed in2001, Reed, UK recruitment specialist,warned that shortage of skilled staff couldthreaten the growth prospects ofthousands of enterprises. The survey of550 organisations found that 72 per centof them had experienced skill shortages,up from 57 per cent six months ago. The
service sector was short of skills by 82per cent, 20 per cent more than in 1999;the retail sector had a shortage of 70 percent and manufacturing of 61 per cent.11
In response to findings such as these, thegovernment sought to import not onlyhighly skilled workers for its rapidlyexpanding high-tech industries, it alsointroduced a programme to bring intemporary workers to help in agricultureduring summer months.
Britain had joined a number of otherindustrial countries in increasing itsdependence on the IT pools of workersavailable in the developing world—inparticular India. Jack Straw, homeminister in Prime Minister Tony Blair’sfirst administration, described the Britishmove as ‘incremental changes—not a rootand branch upheaval of immigration law’during a visit to Gujarat, India in 2000.Barbara Roche, immigration minister inthe same administration, wanted a‘grown-up debate’ on the issue. ‘In thepast we have thought purely aboutimmigration control. We need to thinkabout immigration management,’ shesuggested. As a part of this strategy, theUK government, in September 2000,eased conditions for investing in thecountry from outside the EU, byremoving a minimum of £1 millioninvestment threshold.12
GERMANY: A commission appointedby the German government under thechairmanship of Rita Sussmuth, from theopposition Christian Democratic Union,recommended in July 2001 that thecountry break with ingrained anti-foreigntradition by embracing the idea ofimmigration and accepting up to 20,000foreigners annually as new permanentresidents. The 21 member panel urgedthe government to maintain the country’sprosperity by attracting as many as 50,000skilled foreign workers annually using acombination of permanent residence andtemporary visas. The numbers proposedby the commission were quite modestgiven the dire demographic projectionsposed by the country’s ageing population
Population Growth, Employment and Emigration 143
and declining birth rate. According to oneprojection, Germany’s population isprojected to fall from 82 million in 2000to some 60 million in 2050, with theworkforce shrinking even moredramatically from 41 million to 26million. Some industry groups haveargued that Germany needs as many as aquarter million immigrant workers a yearto meet the economy’s needs.13
Germany overcame labour shortages inthe period immediately after World Warby importing ‘guest workers,’ mostly fromcountries in Southern Europe, particularlyTurkey. It now has 7.3 million foreignersin the country but their treatment,according to a 2001 report issued by theCouncil of Europe, which monitorshuman rights on the continent, ‘shouldcause deep concern.’ Tellingly, even thechildren of Turkish guest workers, whohave lived in Germany for decades, arereferred to as foreigners. This attitude willhave to change if Germany is to useimmigration as a way for solving its grimdemographic problem. Among thoseseeking employment in foreign countries,Germany is not a favoured destination. Atemporary ‘green card’ programmelaunched in 2000 for attracting workersin the high-tech sector and soldaggressively to the skilled workers inSouth Asia was able to fill only 8,000 of20,000 available slots.
Before the terrorists’ attack on the USin which some of the alleged perpetratorshad prepared their mission while living inGermany, there were reasons to hope thatthe German attitude towards immigrationwould change. A number of reforms wereintroduced in 2000 aimed at the nation’santiquated ethnicity-based citizenshiplaws. Children of foreigners born inGermany could obtain citizenship, and itis now easier for long time residents tobe nationalised. This attitude may changeonce again as a result of the involvementof foreigners living in Germany in theterrorists’ attack on America.
NORTHERN EUROPE: In keeping withtheir general approach towards social
policy, the countries of northern Europewere more accommodating of foreigners.For a number of decades, a steady streamof migrants has moved into these countriesforming fairly large communities offoreign-born citizens. Unfortunately,most of these communities found itdifficult to fully assimilate in the hostcountries. This created considerableresentment which is now beginning to bereflected in electoral politics. Even before11 September ‘many white Europeanshad deep running concerns that theircountries were involuntarily becomingmulticultural as guest workers andrefugees, mostly Muslim, establishedthemselves in residence. There are about15 million Muslims in Europe, makingIslam the largest non-Christian religion.’14
But 11 September added to the worriesof the European citizenry. We willillustrate this growing antipathy towardsforeigners by drawing upon the recentexperience of two countries in northernEurope—Denmark and the Netherlands.
Denmark is one of the countriesknown for its tolerance of foreigners.Foreigners account for six per cent ofthe country’s population—300,000 out of5.3 million. However, the publicsentiment against immigrants changeddramatically after the terrorist attacks of11 September. A great deal of resentmentwas directed against Muslim immigrants.Nearly 70 per cent of the immigrantpopulation in the country is Muslim. Ananti-immigrant party won 12 per cent ofthe vote in parliamentary elections inNovember 2001, nearly doubling itsshowing from the previous elections. ‘Itscampaign posters featured a picture of ayoung blond girl and the slogan: ‘Whenshe retires, Denmark will have a Muslimmajority,’ proclaimed the poster.15
Similar xenophobic sentiment nowprevails in the Netherlands, anothercountry that, up until recently, had a goodrecord in assimilating foreigners. InMarch, in the Dutch city of Rotterdam, abranch of the xenophobic LivableNetherlands party won 17 of 45 seats onthe local council, attracting more votes
144 Human Development in South Asia 2003
than any of the three parties in thenational coalition that governs thecountry. In the Netherlands, a countrywith a rich multi-ethnic texture and800,000 Muslims out of a population of16 million, ‘nearly 50 per cent of thecountry’s young people want no moreMuslim immigration, according to anopinion poll for the weekly publicationNieuwe Revu.’16
The post-11 September concernsunderscored a paradox that has beenapparent through European politics foryears. The continent needs foreignworkers to gird an ageing workforce butis queasy about accepting them, especiallyif they are Muslim. ‘There is this fear fornational identity combined with a fear ofMuslims that has fuelled this debate onimmigration,’ said Jan Niessen, directorof the Migration Policy Group, a researchorganisation in Brussels.17
It would appear, therefore, in mostlabour short countries of Europe—andnow also in the United States—anti-foreign sentiment may begin tooverwhelm the economic necessity forbringing in more migrants. The events of11 September 2001 are too recent to tellwhether xenophobic sentiments willoverride economic imperatives. If theterrorist threat abates, it is possible thateconomic compulsions will once againprevail and the dynamics embedded inthe phenomenon of demographicasymmetry will become dominant featuresof the global economic and socialprogress.
Developing countries: Turning largepopulations into economic assets
A subtle but profound change was takingplace in the relations between developedand developing countries before terroristsstruck America on 11 September 2001.Migration has shaped, in many significantways, social, political and cultural relationsbetween the developed and developingparts of the world. In broad terms, it ispossible to identify four trends in the waypeople have moved from developing to
developed countries. The first wave ofmigration occurred during colonial times,when a small number of people left theirhomes to seek employment in variouscountries of Europe which had colonisedmuch of Africa, Asia and Latin America.Most of this migration was from Africaand Asia; very little of it occurredbetween Latin America and SouthernEurope—to Portugal and Spain.
There has been, in recent years, a largeincrease in the flow of people from theworld’s impoverished nations to theworld’s rich countries. This developmentwas the result of both push and pullfactors. Push was always there as povertyand population pressures in developingcountries sent hundreds of thousands ofpeople in a desperate search for jobswherever those could be found. In thenineteenth and early parts of thetwentieth century, this search often endedin Western Europe and North America.Migration at that time was relatively easy,unhindered by the rigours of visa regimesthat were progressively tightened overtime. Many of the diasporas formed inthe West by the citizens of the developingworld can be traced back to those days.Migration in those early days was betweenthe countries that had strong cultural,social or political ties. This explains theformation of the large Mexican diasporain the United States. As shown in thedata presented in table 8.10 above, morethan one-fifth of the foreign bornpopulation in the United States is ofMexican origin. Similarly, more than athird of the foreign population in Franceis from two North African countries—Algeria and Morocco—with whom thecountry has deep social, cultural andpolitical relations going back to severaldecades. In Australia, one-third of theforeign population comes from thedeveloped countries—Britain and NewZealand—with whom there has been anassociation going back to the originalsettlement of the country.
The second wave of migrationcoincided with the de-colonisation of Asiaand Africa by Europe. This happened at
Migration hasshaped in manysignificant wayssocial, political andcultural relationsbetween thedeveloped anddeveloping parts ofthe world
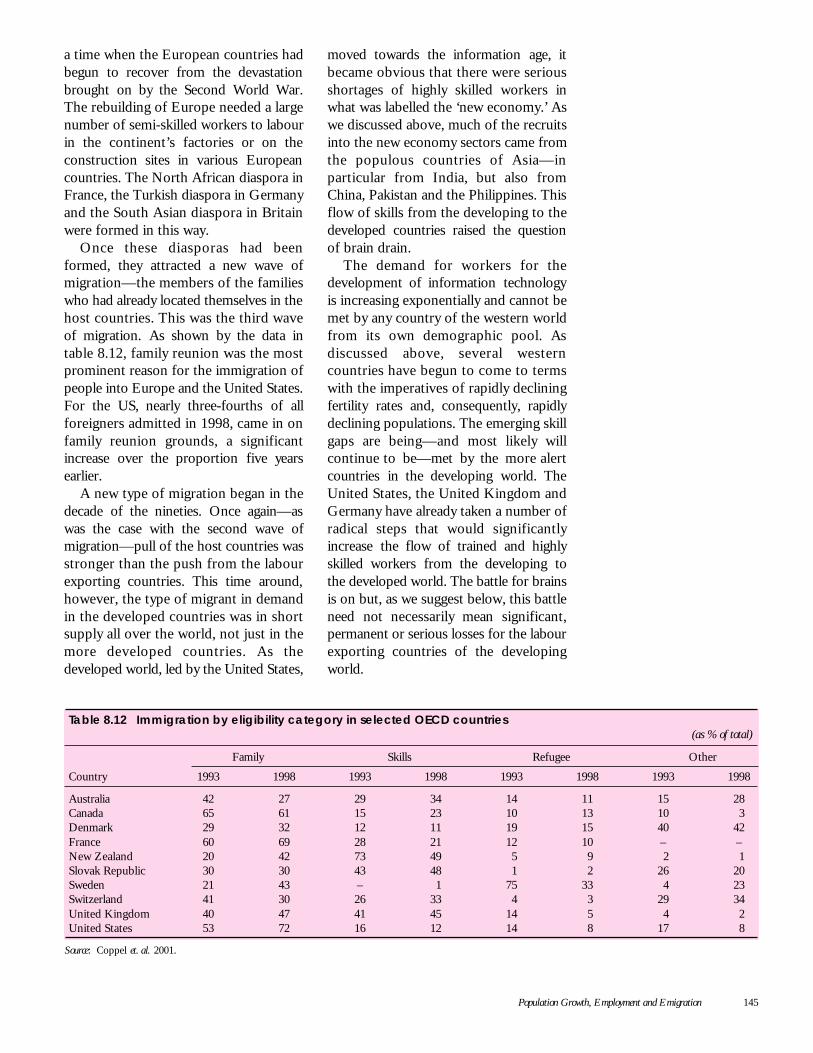
Population Growth, Employment and Emigration 145
a time when the European countries hadbegun to recover from the devastationbrought on by the Second World War.The rebuilding of Europe needed a largenumber of semi-skilled workers to labourin the continent’s factories or on theconstruction sites in various Europeancountries. The North African diaspora inFrance, the Turkish diaspora in Germanyand the South Asian diaspora in Britainwere formed in this way.
Once these diasporas had beenformed, they attracted a new wave ofmigration—the members of the familieswho had already located themselves in thehost countries. This was the third waveof migration. As shown by the data intable 8.12, family reunion was the mostprominent reason for the immigration ofpeople into Europe and the United States.For the US, nearly three-fourths of allforeigners admitted in 1998, came in onfamily reunion grounds, a significantincrease over the proportion five yearsearlier.
A new type of migration began in thedecade of the nineties. Once again—aswas the case with the second wave ofmigration—pull of the host countries wasstronger than the push from the labourexporting countries. This time around,however, the type of migrant in demandin the developed countries was in shortsupply all over the world, not just in themore developed countries. As thedeveloped world, led by the United States,
Table 8.12 Immigration by eligibility category in selected OECD countries(as % of total)
Family Skills Refugee Other
Country 1993 1998 1993 1998 1993 1998 1993 1998
Australia 42 27 29 34 14 11 15 28Canada 65 61 15 23 10 13 10 3Denmark 29 32 12 11 19 15 40 42France 60 69 28 21 12 10 – –New Zealand 20 42 73 49 5 9 2 1Slovak Republic 30 30 43 48 1 2 26 20Sweden 21 43 – 1 75 33 4 23Switzerland 41 30 26 33 4 3 29 34United Kingdom 40 47 41 45 14 5 4 2United States 53 72 16 12 14 8 17 8
Source: Coppel et. al. 2001.
moved towards the information age, itbecame obvious that there were seriousshortages of highly skilled workers inwhat was labelled the ‘new economy.’ Aswe discussed above, much of the recruitsinto the new economy sectors came fromthe populous countries of Asia—inparticular from India, but also fromChina, Pakistan and the Philippines. Thisflow of skills from the developing to thedeveloped countries raised the questionof brain drain.
The demand for workers for thedevelopment of information technologyis increasing exponentially and cannot bemet by any country of the western worldfrom its own demographic pool. Asdiscussed above, several westerncountries have begun to come to termswith the imperatives of rapidly decliningfertility rates and, consequently, rapidlydeclining populations. The emerging skillgaps are being—and most likely willcontinue to be—met by the more alertcountries in the developing world. TheUnited States, the United Kingdom andGermany have already taken a number ofradical steps that would significantlyincrease the flow of trained and highlyskilled workers from the developing tothe developed world. The battle for brainsis on but, as we suggest below, this battleneed not necessarily mean significant,permanent or serious losses for the labourexporting countries of the developingworld.
146 Human Development in South Asia 2003
Conclusion
This chapter on migration and its impacton development, particularly onemployment, argues that the asymmetricdemographic developments in the world’srich and poor countries offer a uniqueset of opportunities to both sets ofnations. However, for the full realisationof benefits, public policy specificallyaimed at the attainment of this objectiveis required. For several more decades, thedecline in the proportion of the young inthe populations of developed countriescan be balanced by imparting the youngin the developing world with the neededskills to work in the labour-short andskill-short sectors in rich countries. Thesesectors are commonly associated withwhat is now generally described as the‘new economy.’
The benefits to developing countriesof migration are realised in many differentways. For the unskilled and semi-skilledworker, migration reduces pressure onland and other labour-intensive activitiesin which most of these people areengaged. As was recognised half a centuryago by development economists such asArthur Lewis, migration brings benefitsto both the labour exporting and labourimporting parts of the economy. Lewisdeveloped his argument to explain whymigration of workers from rural to urbanareas brought benefits to developingeconomies. The same argument can bemade for migrations involving peoplemoving from developing to developedcountries.
Such a flow of people from thedeveloping to developed countries neednot produce the phenomenon of ‘braindrain’ with all its associated negativeconnotations. Fears about brain drain donot seem to be justified and should notbe used to place difficulties in the way ofthe people intending to migrate. Lookingat the flow from a dynamic perspective—rather than the static framework in whichthe brain drain argument was originallydeveloped—we come to the conclusionthat migration can be a Pareto-optimal
solution for all parties involved. Properlymanaged, it can—in fact, it already has—produce great benefits for both labourexporting and importing countries.
Benefits to the labour-importingcountries accrue because of the skill gap-filling function migration provides in therelatively new, knowledge-intensivesectors of the economy. It is correct toassert that the boom in the Americaneconomy in the 1990s was made possible,in part, by the sharp increase inproductivity that was witnessed in the1995-2000 period. This productivityincrease, in turn, was made possible bythe application of informationtechnology. Carrying this line of argumenta bit further, it is legitimate to argue thatwithout the contribution made by a largenumber of people brought in fromcountries such as India, which had anabundant supply of trained workers, theIT sector in America would not havegrown as rapidly as it did, and would nothave made the recognised contribution toproductivity increases. Migration from thedeveloping world, in other words, provedgreatly beneficial for the United States.
Following this line of thinking, anumber of developed countries hadbegun to formulate plans for importingpeople with appropriate skills from laboursurplus countries in the developing world.The United States took the lead byputting into place several programmes forfacilitating the flow of migrants fromdeveloping countries that had a surplusof workers with needed skills. Severalother developed countries—Germany,Japan, and UK among them—followedthe example set by the United States.However, the terrorists’ attack on11 September 2001 dramatically changedthe environment. Once again, the UnitedStates took the lead as it began to tightenthe controls on immigration. Otherdeveloped countries followed. However,‘11 September’ happened while theAmerican economy was in recession. Thetechnology sector had seen its bubbleburst and thousands of enterprises thathad created an almost insatiable demand
Fears about braindrain do not seem tobe justified andshould not be usedto place difficultiesin the way of thepeople intending tomigrate
Population Growth, Employment and Emigration 147
for skilled foreign workers went out ofbusiness. Suddenly, the demand forimported labour evaporated. Will thissituation change as the American,European and Japanese economies beginto recover?
‘11 September’ notwithstanding, thedynamics embedded in the phenomenonof demographic asymmetry will remain.As the economies of the developed worldgain in strength, the demand for skilledworkers will inevitably increase. It canonly be fully met through migration. If
migration is inhibited, because ofconcerns pertaining to homeland security,economies will suffer. A choice will haveto be made by policy-makers in thesecountries, whether they wish to continueimporting a large number of people fromthe developing world or prepared totolerate economic stagnation—or, at best,a very low rate of economic growth—inorder to preserve their cultures andensure a modicum of security for theircitizens.
148 Human Development in South Asia 2003
‘What we need today is to combine the creativeenergies unleashed by capitalism with the socialobjectives of human development. In such apragmatic combination of efficiency and equitylies the viability of future models of development.’
Mahbub ul Haq1
Since the first report of this Centre,published in 1997, we have beenconsistently advocating for people-centred development policies. So in thisconcluding chapter, as well as throughoutthis report, we have built on our previousanalyses and policy prescriptions, with aparticular focus on the employmentchallenge in South Asia.
The founde r of th i s Cen t r e ,Dr Mahbub ul Haq, kept remindingpolicy makers that growth in itself mightnot lead to people’s welfare unless thepattern of growth, its character anddistribution were focused on impactingthe majority of people. For sustainableand equitable economic growth, a linkbetween growth and human lives has tobe created consciously through deliberatepublic policy, as this link may not exist inthe automatic working of the markets insocieties with unequal distribution ofincome, assets, and political andeconomic power. This is particularly truein the context of South Asia where halfthe population (in four large countries) isilliterate and one-third lives in poverty.
Economic growth has the potential togenerate employment if the growth takesplace as a result of increased investmentin both private and public sectors, isbased on labour-intensive patterns ofproduction, is focused on agriculture andrural areas where most of the SouthAsians live and work, and if it uses thepotential of all the labour force includingwomen and other minority groups. In
short, economic growth, to beemployment generating, has to beconcerned with equity between men andwomen, urban and rural areas, andbetween workers in the formal as well asinformal sectors. South Asia fails to fulfilthese conditions on several counts:
• Public expenditure is being curtailed,especially in the sectors that provideemployment to the majority of peoplewho are engaged in the informalsector, in small-scale manufacturingand services. Public investment incritical infrastructure development,essential for promoting privateinvestment, is being curtailed.
• Private sector has yet to fill up theemployment vacuum left by theshrinking public sector. Privatesector—guided by profit motive—cannot be relied upon to promoteemployment in order to attain socialobjectives.
• Growth in South Asia has often beenaccompanied by greater use of labour-displacing technology, the pattern ofdevelopment that is not determined bydomestic resource endowment. Thistechnology choice has improved theproductivity of a narrow range ofworkers in the highly-skilled upper endof the employment ladder.
• The systems of education and traininghave not improved the capability ofthe majority of the population in SouthAsia. Education system has also failedto prepare workers for the competitivejob market in a globalised world. Inaddition there is a large disparitybetween educational attainments offemale and male students.
• South Asian economies work underconditions of surplus labour whereunderemployment, unpaid family
Chapter 9
Towards Growth with Employment and HumanDevelopment
Growth in itselfmight not lead topeople’s welfareunless the pattern ofgrowth, itscharacter anddistribution werefocused on theirimpact on themajority of people
Towards Growth with Employment and Human Development 149
labour and informal sector dominate.Under these conditions, economicgrowth may take place withoutimproving the volume and conditionsof employment.
Our analysis has shown that theeconomic policies pursued in the regionduring the last decade and a half haveincreased income inequality betweenurban and rural areas and betweendifferent income groups within theseregions. Across the region, employmentgrowth has not kept pace with thepopulation growth. In most countries,there has been stagnation or increase inthe levels of poverty. There has also beena relative decline in the growth ofmanufacturing, especially in the small-scale sector, except in Sri Lanka. Low-productivity agriculture and servicesectors have become the last resort forthe unemployed and underemployed.Finally, in all the countries, the quality ofemployment appears to have deteriorated,with an increase in casual and part-timework.
By analysing the experiences of 69countries, UNDP Human DevelopmentReport of 1996 came to the conclusionthat growth in employment opportunitiesis strongly correlated with both GDPgrowth and improvement in humandevelopment. A one percentage pointincrease in the average annual GDP percapita growth rate was associated with anincrease of 0.18 percentage point in theemployment growth rate. Similarly, a onepercentage point reduction in HDI (i.e.,improvement in human development)was associated with a 0.09 percentagepoint increase in the growth rate ofemployment opportunities. These resultsshowed that the expansion ofemployment opportunities depends oneconomic growth and improvement ofhuman capabilities.2
But income growth does notautomatically translate into employmentopportunities, as we have mentionedearlier. Supportive policies, both nationaland international, are essential to making
this happen. These policies should notonly include those that seek to improveproductivity through quality educationand skill training, but also those that worktowards creating an enabling macro-economic and trade environment.
Improvements in productivity arenecessary for growth in GDP and wages.But productivity increase due to adoptionof new technology will adversely impacton low skilled employment. Productivitycould also rise by eliminating lowproductivity jobs—such gains come at theexpense of employment, as is often thecase with IMF stabilisation policies. Butthe policies in some developing countries,such as in China and South Korea, haveshown that high growth rates of overthree per cent, and a growth patternpromoting sectors with high employmentpotential, can both create jobs as well asimprove productivity. This strategy workseven better when it is combined withrapid improvement in the skills of people.
The report has analysed in detail theimpact of South Asia’s economic policies,especially policies of trade and financialliberalisation, in the context of the hugebacklog of unemployed and under-employed labour force, and the slowdownof global economy. In this chapter, wealso explore some policy imperatives thatare critical in making employment themain vehicle for equitable and sustainableeconomic growth with commensuratepoverty reduction. The challenge is todevelop policies and strategies that wouldmake employment generation an explicitconcern and outcome of the economicdevelopment process. This would requirea rethinking of macroeconomic policiesof the recent past towards more activestate interventions in supporting labour-intensive growth pattern. As we keep onreminding our readers, the humandevelopment agenda is a progressive one.It calls for effective governmentintervention to address the issues ofgrowth, employment generation andpoverty reduction. Thus we assert thatthere is an urgent need in South Asia fora comprehensive macroeconomic, trade
Effective governmentinterventions areneeded to addressthe issues of growth,employmentgeneration andpoverty reduction
150 Human Development in South Asia 2003
and social development framework thatrecognises the crucial role of governmentsin promoting pro-poor economic growthand job-creating infrastructure develop-ment. We believe that the policies forgrowth combined with employmentgeneration and human developmentshould be based on at least five principles.These are:
i) Employment-intensive growthpattern
ii) Improved programmes ofeducation and skill training
iii) Reduction of gender gaps ineducation, skill training andemployment
iv) Protection of workers’ rights,including the rights of workers ininformal sector and EPZs, and
v) Equitable trade policies—developing countries should beenabled to earn their way out ofpoverty.
Employment-intensive growth pattern
The pattern of economic growth followedin South Asia in the 1990s had dependedon the reduction of public investment andhad expected private investment toincrease as a result of deregulation,privatisation and financial incentivesprovided to the private sector. However,while the implementation of these policieshas raised economic growth, it has failedto reduce unemployment andunderemployment despite increasedemployment opportunities in sectors suchas ICT and EPZs. All the governmentsin the region now recognise thatemployment generation has been a majorfailure of the economic policies pursuedso far. Increasing employment generationis now an explicit concern in most policydocuments in South Asia. Yet these policydocuments still continue to focus onfurther privatisation, deregulation andreduction of fiscal deficits, the policiesthat have so far failed to link growth withemployment. South Asian countriesneeded to implement economic reform
programmes. But the question is, shouldnot these reform programmes be moreconcerned with job creation and povertyreduction?
To raise economic growth withemployment is not an impossible task.Some of the East Asian countries havedone it with success. For example, Chinain the 1980s adopted an export-ledgrowth strategy that led to an annualincrease in urban employment by 3.5 percent and rural employment by 2.5 percent. As a result of liberalisation, muchof the urban employment happened inthe private sector; in the rural areas,expansion of townships and villageenterprises provided the bulk of new jobs.The phenomenal increase in both outputand employment in China in the 1980swas due to a policy of promoting labour-intensive manufacturing industries. Thegovernment played an active role inhelping workers to develop skills foremployment in these sectors.3
In order to link economic growth tojob creation, South Asia needs to focuson five critical areas:
a) INCREASE EMPLOYMENT-INTENSIVE PUBLIC INVEST-MENT PROGRAMMES: When theworld economy is experiencing aslowdown, it is important at this stagenot to get obsessed with reduction ofbudget deficit. Even in the USA, thefocus these days is on providingincentives to generate growth andemployment. Unless more jobs arecreated, there will not be an adequatedemand for goods produced. InSouth Asia, reduction of budgetdeficits should not lead to reductionof productive public investment.Also, deficit reduction should not beat the expense of infrastructure needsof agriculture and rural development,and social sector programmes suchas education and health. But mostgovernments find it easier to cutthese expenditures first instead oftackling the more important task ofcutting the non-development
In South Asia,reduction of budgetdeficits should notlead to reduction ofproductive publicinvestment
Towards Growth with Employment and Human Development 151
expenditure such as on military andalso by increasing tax revenue bycombating corruption.
b) REVITALISE AGRICULTUREWITH FOCUS ON SMALLFARMER: Since agriculture remainsthe most important employer inSouth Asia, the impact of tradeliberalisation on agriculture has beenparticularly negative on ruralemployment. Because of under-employment and unpaid familylabour, open unemployment may nothave increased much across theregion. Yet the rise in the absolutenumber of people in poverty in SouthAsia shows the magnitude of humandeprivation in the region. In HumanDevelopment in South Asia 2002, weargued that the long-term goals ofagricultural growth and ruraldevelopment, with employmentgeneration and poverty alleviation,could only be achieved by improvingagricultural productivity throughincreased investments in research byprotecting livelihood and foodsecurity through employmentgeneration, and by revitalising ruraldevelopment. To improve the abilityof the agricultural sector to providelivelihoods, the specific measuressuggested in that report include:
(i) continuing, and even expanding,some degree of price supportoperations to ensure stableoutput prices for the cultivatorsof important crops
(ii) expansion of public agriculturalextension activities, which havedeclined in all countries
(iii) variable tariff on agriculturaloutput, to smoothen the volatilityof world prices for domesticcultivators
(iv) reversing the policy of cuttingsubsidies to small farmers, and
(v) protecting the rights of smallfarmers in international tradenegotiations.
c) PROTECT SMALL PRODUCERSOF MANUFACTURED GOODSFROM ADVERSE EFFECTS OFTRADE LIBERALISATION: Tradeliberalisation policies have led to anexpansion in exports in certainsectors of each South Asian country.But these have also led to a net lossof employment because of the effectsof import competition on domesticproducers, especially employment-intensive small-scale producers. It isimperative to counter some of theadverse effects of trade liberalisationon employment. Governments needto take some special measures,including providing marketingassistance and some degree ofprotection, for small-scale producerscompeting with large multinationalproducers; and ensure adequateinfrastructure facilities, especially forsmall producers. It is possible to usethe existing WTO provisions in orderto ensure some degree of protectionto industries that are consideredimportant from the employmentperspective.
d) REVIVE DIRECTED CREDIT TOSMALL-SCALE PRODUCERS :Government-sponsored directedcredit to encourage industrial andagricultural development in the earlyyears of independent South Asia, hascreated the foundation of today’sSouth Asian economic structure. Butthat system of directed credit failedto perform either efficiently orequitably; banks were burdened withnon-performing loans, and most ofthe credit went to influential people.But the current financial liberalisationhas had a negative impact on theemployment generation potential ofagriculture and small-scale producersin manufacturing and services. In thiscontext, it is important to revive thesystem of directed credit, which hasbeen reduced or removed across theregion, in order to ensure the viabilityof small-scale producers, who are
Governments shouldprovide some specialmeasures, includingmarketing assistanceand some degree ofprotection, forsmall-scaleproducers competingwith largemultinationalproducers
152 Human Development in South Asia 2003
unable to access other capital marketsfor finance.
e) PROTECT SOCIAL SECTORBUDGET FROM CUTS: The SouthAsian countries are implementingfiscal policies without restructuringthe pattern of expenditure that isheavy on military and other non-development expenditure. Even inthe 1990s, when the expenditure onsocial services was being reduced,overall public expenditure continuedto be high. And that trend continuestoday.
Improved programme of educationand skill training
Education and skill-training is the mostimportant component of humandevelopment. Knowledge and technologyrule today’s global economy. DespiteIndia’s success in providing highly-skilledICT professionals within and outside thecountry, South Asia, as a region, producesvery few people with technical skills toproduce goods and services of goodquality and productivity to compete in theglobal market place. The region needs toimprove both the quantity and quality ofeducation at each level, from primary,secondary, to tertiary levels. This is criticalfor adapting to the changing needs of aglobalised economy.
To improve productivity and wages ofall workers, a sustained investment in skillimprovement in new technologies isessential. Creation of employment-intensive industries has to be matched byimprovement in productivity andtechnology. The South Asian countriesneed to upgrade the skills of theirworkers, as well as shift the compositionof output from low-skilled to skill-intensive products. This means that muchmore needs to be done at the technicaland professional levels. This is where theprivate sector could most fruitfullycontribute.
The policies for education, researchand development, and industrial policies
should be matched to lead toemployment-intensive growth pattern.The successful East Asian economieshave combined economic growth policieswith employment generation by linkingeducation and training to industrial andagricultural development policies. Thesecountries invested heavily on thedevelopment of human capabilities—from primary and secondary education totechnical skill development, to researchand development and in-service trainingby adequate financial allocation to theseprogrammes (see box 6.1). Drawing onthat experience, we have suggested somepolicies for promoting education andtraining for employment in chapter 6. Buthere we would like to underscore thepoint that the South Asian countries needto invest beyond education and trainingin other components of humandevelopment, which are just as importantfor building a healthy and productivelabour force. South Asia’s workers notonly need jobs, they need minimumaccess to health, nutrition and drinkingwater, as well as an enabling socio-political environment to exercise theirhuman rights.
Reduction of gender gaps in education,skill-training and employment
After four world conferences on women,fraught with ideas and recommendations,but lacking in action, women in today’sworld still remain greatly disadvantagedcompared to men in many areas,particularly those which would give themeconomic independence and social status.This is truer for the developing than thedeveloped world, and in South Asia, it isimbedded in the patriarchal structure ofsocieties. Human Development in South Asia2000 focused on this issue. The reportidentified four areas as most critical forachieving equality of South Asian womenwith men. These are:
a) building women’s capabilities throughclosing gender gaps in education andtraining
South Asia’s workersnot only need jobs,they need minimumaccess to health,nutrition anddrinking water, aswell as an enablingsocio-politicalenvironment toexercise theirhuman rights
Towards Growth with Employment and Human Development 153
b) improving opportunities for womento earn income and to participate indecision-making
c) ensuring legal justice to women; andd) strengthening institutional machinery
to ensure implementation of genderempowerment policies.
Many of the policy imperativessuggested in that report are still relevanttoday. These are:
• There must be legislative action toimprove women’s economicopportunities at least on threefronts:
a) to abolish discriminatory practiceswherever and in whatever form theyexist
b) to initiate and enforce legislation onminimum quota for women’s publicservice jobs. The principle ofaffirmative action must be appliedand practised here. It is no longeracceptable that the already existingminimum quota in some countriescannot be filled by women becausethey do not have requiredqualifications. As we have seen in thisreport, there are more educatedwomen who are unemployed thanuneducated ones, which means thatdiscrimination against women isgreater where qualifications are equalto or exceed that of males, and
c) international commitments to protectwomen’s rights must be honoured,including the rights of the informalsector workers.
• Minimum wage level, the same forwomen and men, must beestablished and enforced in theformal as well informal andagricultural sectors.
• Job creation for women must bemade a priority for povertyalleviation and for agricultural andrural development.
• Women’s capability must beenhanced through provision ofquality education and training.Women must be enabled to moveout of gender-segregated occu-pations. The increased involve-ment of women in the IT sector,in India particularly, shows thatthis could be done with propereducation and training pro-grammes.
• Micro credit facilities in South Asiahave been linked to women’seconomic and social empower-ment. All the countries are nowproviding micro credit throughboth public and non-governmentalagencies. Women form the largestnumber of borrowers. What isneeded is to make these moreeffective vehicles for income andjob creation.
The overall goal of both economic policyand social policy should be to create moreproductive employment for both womenand men. As long as employmentconditions remain adverse in theaggregate, social policy cannot achievevery much. This is where a paradigm shiftin the current economic orthodoxy isrequired. The goals of poverty reduction,human development and women’sempowerment cannot be achieved in anyframework that bypasses the majority ofSouth Asian people.
Protection of workers’ rights
We have argued in this report that boththe volume of employment and theconditions of employment are determinedby factors other than labour marketpolicies themselves. In fact, policies thatare addressed specifically to the labourmarket alone can be irrelevant or evencounterproductive if the macroeconomicand trade policies generate opposingtendencies. For example, if the demandfor labour is low because the economy isoperating in an unemployment
The goals of povertyreduction withhuman developmentand women’sempowermentcannot be achievedin the frameworkthat bypasses themajority of SouthAsia’s people
154 Human Development in South Asia 2003
equilibrium with unutilised capacity, orbecause of the pattern of technology usedfor enhancing competitiveness, then newemployment generation will depend onthe economic policies which address theseissues directly. Similarly, attempts toimprove labour’s bargaining position onlythrough legislation are likely to be muchless effective in contexts of labour surplusand low demand, in which individualemployers do not see additional profitsto be gained through increasedemployment. Yet there is a tendencyamong South Asian policy makers toattempt to deal with macroeconomicemployment outcomes throughmicroeconomic changes, includingchanges in legislation which effectivelyreduce the rights of workers.
A central policy issue is that of strikingthe right balance between the concernsof economic efficiency and social equity.A fundamental principle that should guidethe policy makers is the strict respect forthe maintenance of basic levels of socialwelfare and labour standards. Thisprinciple should not be seen as ahindrance to economic efficiency butrather as upholding of workers’ basicrights.
In South Asia, the ratification of ILOcore labour standards, particularly of theeight core ILO Conventions, has beenvery low. Sri Lanka is the only countrythat has ratified all eight Conventions.Pakistan and Bangladesh have ratifiedseven, Nepal has ratified six and Indiahas ratified four. But mere ratificationdoes not automatically mean that therights of workers will be protected in acountry. The enforcement of the ratifiedlaws has not been the top priority ofgovernments. The laws regarding freedomof association and collective bargainingapply only to 10 per cent of workers whoare in the formal, organised sector. Theother 90 per cent of South Asian workersin the informal sector and in the export-processing zones are outside these legalprotections (except workers in EPZs inIndia). Also, whenever there is adiscrepancy between national laws and
international conventions, national lawsprevail. Laws against forced labour, childlabour and gender discrimination areviolated every day in South Asiancountries. It is the civil societies in SouthAsia that work on behalf of these victimsagainst the violators.
On the basis of our analysis inchapter 7, we have come to theconclusion that South Asian governmentsmust play a much more effective role inratifying all the core ILO Conventionsand ensure their implementation. Severalinitiatives by civil society andgovernments under the regional umbrella(SAARC) have been addressing theseissues, particularly of forced labour, childlabour and trafficking of girls. Yet it istrue that unless alternative approaches arefound to provide sustaining wages toadults with provision of social services,such as education, health and foodsecurity, no amount of legislation wouldsolve the problem of child labour andother forms of exploitation. Civilisedsocieties can only survive if they provideacceptable levels of social security andhuman rights to their people.
Equitable trade policies
Globalisation, through movement ofgoods, services, people and informationacross national boundaries, has resultedin the opening up of economies andsocieties. But this process has not beenaccompanied by a correspondingreduction of poverty or improvement inhuman security. Trade liberalisation hasincreased free movement of capital, andwhile information and communication aregetting freer, movement of labour isrestricted. Trade, especially of goods ofparticular interest to developing countries,is not fully liberalised. In South Asia,during the period of rapid globalisation,poverty has risen in some countries orremained unchanged in others, leading toan increase in the absolute number ofpeople in poverty, which now stands atabout half a billion. The benefits ofeconomic growth that have taken place
A central policyissue is that ofstriking the rightbalance between theconcerns ofeconomic efficiencyand social equity
Towards Growth with Employment and Human Development 155
in South Asia, have been enjoyed by asmall minority of urban educated class.
For macroeconomic policy, this meansmuch more than just promotingeconomic growth. Employmentgeneration must be built into the macroand micro policies across the board inagricultural, industrial and trade policies.In the area of trade, South Asia is facinga very inequitable implementation ofWTO rules.
Developing countries had expected togain from WTO rules in three key areas:agriculture, textiles and services. Underthe Agreement of Agriculture (AoA),agriculture was brought under thepurview of multilateral trading system.The objective of the Agreement onTextiles and Clothing (ATC) was to phasequota-based regime of Multi FiberArrangement (MFA), and integratetextiles and clothing within the generalWTO rules. The General Agreement onTrade in Services (GATS) was consideredas a first step towards the eventualliberalisation of trade in services.
It was expected that, as a result of AoAand ATC, increased market access foragricultural produce and textile andclothing goods from developing countrieswould allow these countries to takeadvantages of cheap labour to increaseexports. Also, as GATS covers a hugerange of services, including export ofskilled and unskilled labour, developingcountries with abundant supply ofunskilled labour would benefit from sucha system. But these expectations were notborne out in reality as developedcountries continued with their high levelsof agricultural subsidies, plus tariff andnon-tariff barriers and quotas againstdeveloping countries’ labour-intensivemanufactured goods. There has also notbeen any meaningful liberalisation in theservices sector that would have helped inthe export of low-skilled labour fromdeveloping to developed countries. Thedemographic asymmetry betweendeveloped and developing countriesmight eventually lead to such migrationof people as we have explored in
chapter 8. But at the moment, thetendency seems to be to restrict suchmovement in light of the current securityconcerns of developed countries.
South Asia’s employment problemshave been exacerbated by the WTO rules.There has not been any meaningful accessin the key areas where they have acomparative advantage, such as textilesand agriculture. Services have beenliberalised in sectors of primary interestto developed countries, for example, intelecommunication and financial services.So far, the positive impact of AoA, ATCand GATS upon the developingeconomics of South Asia has beensignificantly less than expected.
• Impact on agriculture: OECDsubsidies to their agricultural sector in1998-2001 have increased by about 9per cent over the 1986-88 level. AoArules to reduce subsidy by 36 per centhas not been enforced in developedcountries. As a matter of fact, therecent meeting (September 2003) inCancun, Mexico, ended without anydecision on this topic. As a result,commodity prices are on a steadydecline. For small and marginalfarmers, who are in majority in SouthAsia, crop diversification is not anoption, as they do not have capital andtechnology to move out of theirtraditional crops. And, of course, foodsecurity is their main concern.
• Impact of ATC: A review of ATCimplementation shows that theintegration programmes of the US, EUand Canada have not beenimplemented in keeping with theobjective of progressive elimination ofquota restrictions. Even with theimplementation of stage programmes,the large bulk of quota carried overfrom MFA will remain in place (seechapter 4). Also, even after the phasingout of quota in 2005 (2008 forBangladesh), significant trade barrierswould still remain in developedcountries on their imports of textilesand clothing. There are also various
South Asia’semploymentproblems have beenexacerbated byWTO rules
156 Human Development in South Asia 2003
disguised trade barriers (anti-dumping,rules of origin etc.) imposed ondeveloping countries’ manufacturedgoods. A significant portion ofmanufacturing output is produced bysmall and medium-sized enterprises inthe informal and semi-formal sectors.These units are characterised by lowlabour and factor productivity. In acompetitive trading environment, theseget hit the hardest, causingunemployment and poverty.
• Till now, GATS has not beensuccessful in liberalising trade inservices, especially in export of servicesof low-skilled workers. Severalimpediments stand in the way,including unfulfilled commitments ofdeveloped countries and various otherconditions and limitations to free tradein services.
The implementation of AoA, ATC andGATS is extremely important for SouthAsia’s growth and employment. Theresults of the recently held WTO meetingin Cancun clearly show that to expectequity in an international economicsystem, dominated by powerful countries,is not realistic in the near future. TheDoha round of trade negotiations is notgoing to be completed by the WTOdeadline of January 2005 for reachingagreement on eliminating global tradebarriers. The World Bank estimates thata new round of market opening wouldraise global output between $290 billionand $520 billion, and lift some 144 millionpeople out of poverty by 2015. An IMFpaper shows that ending agriculturalprotectionism alone would add $100billion to global growth.4 Yet powerfulinterests have stood in the way of therealisation of these opportunities.
The farmers in South Asia willcontinue to suffer as a result of the hugefarm subsidies in developed countries thatcould not be resolved at Cancun. Ofcourse, the extent of suffering will dependon the policies of governments. Forexample, the farmers in Pakistan are morelikely to suffer than those of other South
Asian countries, since most of theagricultural subsidies in Pakistan havebeen drastically reduced as a result ofIMF pressure.5
The days of mutuality of interestsbetween developed and developingcountries are gone. And ethics have neverplayed a big role in internationalcommerce. Yet, for the developingcountries, WTO is their only hope. Thusit is incumbent on the WTO not to forceunfair rules on the developing countries.The WTO should become a fairinstitution for ensuring food andemployment security. WTO must ensurethat trade helps to create—not destroy—jobs, and that the South Asian countriesare allowed to protect the livelihoods oftheir poor from the cheaper, and highlysubsidised, imports from the developedcountries. In short, the WTO must ensurethat trade is rooted in the principles ofequity and fair play among nations.
* * *
The analysis in the report leads to threemain conclusions about the South Asianemployment challenge:
i) The persistent inability of theworkplace to absorb workersproductively can be attributed to thefailure of governments in the region.This has happened on two importantaccounts. First, the governments didnot adopt job creation as an explicitpolicy commitment. And, second, thegovernments failed to improve thehuman development condition of themajority of people.
ii) Another failure has been on the partof multilateral organisations workingin the region. We contend that theirefforts for improving the livelihoodsof South Asians were often notbacked by adequate financialresources, and their overall countrydevelopment policy frameworkfocused more on GDP growth andbalancing budgets rather thanreduction of poverty.
WTO shouldbecome a fairinstitution forensuring food andemployment security
Towards Growth with Employment and Human Development 157
iii) Finally, some blame for the persistentproblems of unemployment andunderemployment in the developingworld has to be placed at the door ofthe developed world. The richcountries have failed in theirpromises of assisting development in
the poorer countries. They have notdelivered on their global commitmentto allocate 0.7 per cent of theirbudgets for providing assistance todeveloping countries, and have notencouraged true liberalisation of theworld economy.

158 Human Development in South Asia 2003
Notes 159
Notes
Chapter 1
1 This chapter is contributed by Shahid JavedBurki.
2 MHHDC 1999, p. 28.3 MHHDC 1998, p. 2.4 MHHDC 2000, p. 3.5 Hurt 2003, p. 4.6 Watkins 2003, p. 12.
Chapter 2
1 Calculated as weighed average of South Asiancountries for the year 1995 from ILO sources.
2 ILO 2003a.3 Ibid.4 Unemployment rates are in usual status.
Source: Bahandari et al. 20035 See for example ILO 2001h, 2003a.6 Visaria 1998.7 Majid 2001.
Chapter 3
1 Edited version of a paper prepared by JayatiGhosh for this report.
2 See, inter alia, Serven and Solimano 1994 andUNCTAD 1998c.
3 It has further been argued Ghosh 2002b. thatbroader aspects of what is now called socialpolicy can also serve the important purpose ofsocial legitimisation of macroeconomicstrategies and processes within developingcountries.
4 The implications of such a process foreconomic conditions facing women workers isconsidered in Ghosh 2001a, b.
5 Of course, it has been argued that this canrepresent a positive diversification ofconsumption away from food grain that isassociated with higher living standards. But itis usually the case that aggregate food grainconsumption does not decline because ofindirect consumption of grain (for example,through meat and poultry products that requirefeed). In any case, the overall decline incalorific consumption (covering all foodproducts) suggests that the optimisticconclusion may not be valid.
6 Easterly 2001.7 UNDP 2003.8 Majid 2000.
9 Ibid.10 Anwar 2001.11 Muqtada 2003.12 Centre for Policy Development 2001.13 World Bank 2002b, p. 10.14 GOS 2002b. p. 4.15 GEFONT 2001.16 Prennushi 1999.17 NASSCOM 1999.18 Chandrasekhar 2000.19 Probe Team 1999.20 Chandrasekhar 2000.21 Vijaybhaskar et al. 2000.
Chapter 4
1 Based on background paper prepared byParthapratim Pal.
2 Sri Lanka had a historically high trade/GDPratio because of the importance of plantationcrops such as tea, coffee and rubber in itseconomy.
3 WTO 2001e, p. 16.4 ILO 2003a.5 ADB 2003b.6 World Bank 1995.7 WTO 2001a.8 Ghose 2000.9 See, for example, Krugman 1994; Rodrik 2000;
and Stiglitz 2002.10 However, as Dev 2000 argues the landless
labourers gain only if real wages increase. Butempirical research on South Asian countriesshow that typically wages rise only with a lagof say two or three years. It may also happenthat real wages do not increase.
11 Bhattacharyya and Parthapratim 2000.12 Patnaik 2003.13 See India’s notification to WTO, in WTO
2001b.14 See the recent US Farm Bill. Also the French
President has obtained a commitment toincrease farm spending at the EU Summit inOctober 2002.
15 Gibson et al. 2001.16 WTO 2000b.17 Data on Bangladesh, India and Pakistan are
from WTO Trade Policy Review of thosecountries. Sri Lanka’s data are from GOS 2000.
18 WTO 2001d.19 For a more detailed analysis of implementation
problems of ATC, see WTO 2001c,d.20 Kheir El-Din 2002.
160 Human Development in South Asia 2003
21 WTO 2002.22 Bhattacharya 2003.23 According to Spinanger 1998, in developed
countries, tariff rates on textile and clothingproducts are about three to five times higherthan tariffs on industrial goods.
24 Srinivasan 2002.25 India has recently lost a case in the WTO
Dispute Settlement Body (DSB), challengingthe WTO consistency of US Rules of OriginPolicy. The panel found that India had failedto establish that the US measures areinconsistent with the WTO Agreement onRules of Origin.
26 WTO 2000a.27 Chandrasekhar and Ghosh 2002a.28 Bacchetta and Bora 2003.29 WTO 2000c, p. 3.30 In some countries like India, some sectors
were even protected from competition fromdomestic big industries. This was done byimposing maximum possible investment limitsper firm in certain industries.
31 ILO 2003a, reports that more than 90 per centof labour force work in informal sector inIndia and Nepal. In Pakistan, two-third ofthose involved in non-agricultural sector arein informal economy.
32 Nambiar et. al. 1999.33 World Bank 2000.34 See www.nasscom.org for recent figures
Chapter 5
1 ILO 2002g.2 There is an inconsistency between the increase
in the overall rate of informal sector in SouthAsia and the decrease in informal sectoremployment in individual countries. Althoughself-employment in non-agricultural sector hasincreased for the region, it has decreased forIndia and Pakistan and increased only forBangladesh. Informal sector employment hasalso increased for Iran, which was included inthe South Asian countries.
3 Mehrotra, S. and M. Biggeri 2002.4 Coir fibre industry is characterised by two
distinct components. In traditional and labourintensive white coir industry more than 60 percent of the employed are women while inmodern, mechanised and export orientedbrown coir fibre industry, only ten per cent ofthe employed are women. The inconsistencybetween data in the text (60-90 per cent) anddata in the box (ten per cent) for Sri Lankaarises due to this reason.
5 UNDP 2003.6 Discussion in this section has benefited from
Ghosh, J. 2003b.7 Pant, D. and D. Pradhan 2002.
8 Ghosh, J. 2003b.9 Studies are cited in Ghosh, J. 2003b.
Chapter 6
1 See table 5 of Human Development Indicatorsfor South Asia.
2 See tables 3, and 5 of Human DevelopmentIndicators for South Asia.
3 ESCAP 2001.4 Richards 2002.5 Tessaring 19906 Rehman 1997.7 Richards 2002.8 UNESCO 1995.9 Tan 1993.10 Masri 1999.11 Johnson 2000.12 Robinson 1999.13 IAMR 2001.14 ILO 1999b.15 Indiamart 2003.16 GOI 2002a.17 Sharma 2000.18 Majid 2000.19 Ghose 1997.20 Alam 1988.21 Research by HDC staff.22 Almas 1998.23 SME India 2003.24 Richards 2002.25 EU 2000.26 NBIA 2003.27 World Bank 2001.28 UN 1994.29 UNDP 1998.30 Entrepreneurship Development Institute 2003.31 Wolcott and Goodman 2002.32 ADBI 2001.33 Skyte 2000.34 Rajghatta 2001.
Chapter 7
1 CEACR examines the country reports on theratified and/or selected unratified conventionsof the individual governments since 1927. Thecommittee consists of 20 independent personsspecialised in the field from all parts of theworld. The members meet each year andprepare a report for each government. If agovernment is not fully applying a ratification,the Committee addresses a comment to thegovernment in the form of observation ordirect request.
2 CCACR consists of more than 150 membersfrom workers’, employers’ and governmentsrepresentatives. CCACR examines anddiscusses the report of CEACR and other
Notes 161
individual cases. The Committee may askgovernments to make a statement to theconference committee or to submit a writtenstatement, if they do not fully apply a ratifiedconvention.
3 Conventions are international treaties creatingobligations for the countries, regardless of theireconomic or social status, that ratify them. Byratification countries agree to apply itsprovisions and embrace the internationalsupervision. On the other hand,Recommendations do not create obligationsbut rather provide guidelines for action andthey are usually dealing with the same subjectsas Conventions. They are not subject toratification and are developed “to help providedirection for national policy and action in thehope that international practice will developand thus allow the consideration and adoptionof a Convention to follow”.
Conventions are adopted within aninstitutional framework by the two-thirdsmajority of the voters i.e. representatives ofthe governments, employers and workers.Some of them may include flexibility clausesthat can be seen in the form of option tochoose the extent of the obligation, scope orthe methods of the action. Source: ILO 2003band TSSA 2000.
4 The Declaration is an addendum for the ILOstandards. By adopting a Declaration themembers recognise and reassure theirobligation to work towards achieving thespecific goals mentioned in the ILOConstitution. Adopting of a Declaration alsobinds ILO to provide assistance to membercountries to achieve the goals.
5 Anant et al. 1999.6 With regard to the core labour standards, India
and Pakistan have two common inherited Acts,namely, Trade Unions Act of 1926 and theIndustrial Disputes Act of 1947, regulating thetrade unions and the system of collectivebargaining. Children (Pledging of Labour) Actof 1933 is common in all the three countries(Pakistan, Bangladesh and India). TheEmployment of Children Act, 1938 is commonto Bangladesh and India, and the IndustrialRelations Ordinance of 1969 is common toBangladesh and Pakistan. Anant et al. 1999and ILO 2003n.
7 ILO 2000d, p25.8 Ibid.9 ICFTU 2002a.10 The Act provides for the registration of trade
unions and defines the registration procedures,rights and liabilities of registered trade unions,power to make regulations, and penalties andprocedures.
11 ICFTU 2002a.12 Ibid.13 Ibid.
14 This created an open window for the misusageof the legislation in some states. For example,in Gujarat 450 teachers were arrested and toldto return their duty.
15 ICFTU 2003a.16 Anant et al. 1999.17 ICFTU 2003a.18 ILO 2003n.19 Ibid.20 Anant et al. 199921 Generalised system of Preferences (GSP) is
one of the two commercial programmesoffering concessions in tariff’s paid to its tradepartners. Specific products from developingcountries may enter U.S. duty free under thisprogramme. However, it is conditioned uponthe observance of internationally recognisedcore labour standards in their respective labourmarkets.
22 Sinha 2003.23 ICFTU 2002a.24 ICFTU 2002b.25 Ibid.26 ILO 2003e.27 Global Unions, World Confederation of
Labour and European Trade UnionsConfederation 2002.
28 ILO 2001f.29 Ibid.30 ILO 2003g31 Ibid.32 Erclawn and Nauman 2001.33 Ibid.34 Soomro 2002a,b.35 ILO 2003h.36 ICFTU 2003b.37 ILO 2002d.38 ILO 2002c, d. Since this age group is above
the minimum age for entry into employment,they are necessarily involved in worst formsof child labour.
39 Hazardous sectors are railways, carpet weaving,cement manufacturing, building andconstruction, cloth printing, dyeing andweaving, matches, explosives and fire works,cigarette making, printing and solderingprocesses in electronics industries. ICFTU2002a.
40 The main sectors using child labour areagriculture, hand knotted carpets, gem stonepolishing, brass and base metal articles, glassand glassware, footwear, textiles, fireworks,bidi, cigarettes, domestic service and sportinggoods.
41 ICFTU 2002a.42 Inherited from the British Colonial Rule.43 Inherited from the British Colonial Rule.44 Inherited from the British Colonial Rule.45 According to Chapter 8, Rule 83 of the
Factories Rules, 1979, hazardous operationsconsidered as worst forms of child labour areglass manufacturing; grinding or glazing of
162 Human Development in South Asia 2003
metals; generation of gas from dangerouspetroleum; tanning of raw hides; compressedhydrogen or oxygen; manufacture of chromicacid; potassium; sodium operations; etc.Similarly, Employment of Children Act, 1938,lists the hazardous operations as bidi-making,carpet-weaving, cement manufacture, includingbagging of cement, cloth-printing; dying andweaving, manufacture of matches, explosivesand fireworks, mica-cutting and splitting,shellac manufacture, soap manufacture,tanning and wool cleaning.
46 ILO 2003r.47 Gilligan 2003.48 Harkin Bill emerged in 1992 in U.S. Congress.
It suggested the prohibition of the imports ofspecific goods produced in other countrieswith the use of child labour.
49 Dogar 2001; Vahapassi 2001.50 Hilowitz 1997.51 World Bank 2000.52 ILO 2003k.53 Ibid.54 Ibid.
Chapter 8
1 This chapter draws heavily on the work doneby Shahid Javed Burki as a part of his ongoingwork on Asymmetric Demographic Develop-ment. Some of the work was sponsored by theInter-American Development Bank, Inter-American Dialogue, and Canadian Inter-national Development Agency. Burkicontinues to work in this area, and expect topublish more on this subject.
2 For an account of the way the AmericanJewish community has kept in touch withIsrael see Silverman and Kaufman 2002.
3 The New York Times. 2002, p. A26.4 Eberstadt 2001, pp. 42-53.5 Detailed global population projections are
available from a number of sources butperhaps the two most authoritative of theseare the U.S. Bureau of Census and the UnitedNations Population Division. The CensusBureau’s latest outlook is available onlinethrough its International Data Base. TheUnited Nations Population Divisionprojections are published biennially.
6 Lomborg 2001.7 Bokestein and Diamantopoulu 2001, p. 17.8 Leisman 2001, p. A3.9 Coppel et al. 2001.10 For a more detailed classification see Garson
and Thoreau 1999.11 Taylor 2000.12 Merchant 2000, p. 7.13 Finn 2000, pp. A1 & A10.14 Finn 2002, pp. A1 & A11.15 Ibid.16 Ibid.17 Ibid.
Chapter 9
1 Haq 1993.2 UNDP 1996.3 Ibid.4 As quoted in World Bank 2003d.5 Ahmad 2003.
References 163
References
ADB (Asian Development Bank). 1999a. ‘Womenin Sri Lanka: Country Briefing Paper’. Availableat http://www.adb.org/Documents/Books/Country_Briefing_Papers/default.asp.
. 1999b. ‘Women in Nepal: CountryBriefing Paper’. Available at http://www.a d b . o r g / D o c u m e n t s / B o o k s /Country_Briefing_Papers/Women_in_Nepal/women_nepal.pdf.
. 2000. ‘Women in Pakistan: CountryBriefing Paper’. Available at http://w w w . a d b . o r g / D o c u m e n t s / B o o k s /Country_Briefing_Papers/default.asp.
. 2001a. ‘Women in the Republic ofMaldives: Country Briefing Paper’. Available athttp://www.adb.org/Documents/Books/Country_Briefing_Papers/default.asp.
. 2001b. ‘Women in Bangladesh: CountryBriefing Paper’. Available at http://www.a d b . o r g / D o c u m e n t s / B o o k s /C o u n t r y _ B r i e f i n g _ P a p e r s /Women_in_Bangladesh /women_ban.pdf.
. 2002a. ‘Asian Development BankIndicators: Population and Human ResourceTrends and Challenges 2002’. Available athttp://www.adb.org.
. 2002b. Poverty in Pakistan: Issues, Causesand Institutional Responses. Manila.
. 2003a. Asian Development Outlook 2003.Manila.
. 2003b. Official Website. Available athttp://www.adb.org.
ADBI. 2001. ‘ICT strategies for developingcountries. Executive Summary’. Available athttp://www.adbi.org/PDF/ess/ES39.pdf.
Agrawal, P. and P. Saibaba. 2001. ‘TRIPS andIndia’s Pharmaceuticals Industry’. Economicand Political Weekly. 29 September.
Ahmad, A. 2003. ‘WTO kills farmers’. The Nation.18 September. Islamabad.
Ajwad, M.I. and P. Kurukulasuriya. 2002. ‘Ethnicand Gender Wage Disparities in Sri Lanka’.World Bank Policy Research Working Paper #2859. Available at http://econ.worldbank.org.
Alam, M. 1988. ‘A comparative evaluation of majorspecial employment creation schemes inBangladesh’. Asian Employment ProgrammeWorking Papers. New Delhi: ILO/ARTEP.
Alexander, I. and E. Antonio. 1999. ‘The Role ofRegulatory Reform and Growth: Lessons fromLatin America.’ Paper Prepared for TIPSAnnual Forum, 19-22 September,Johannesburg.
Almas, Z. 1998. ‘Self-employment scheme’. TheNews. 21 December. Islamabad.
Amin, N. 2002. ‘The informal sector in Asia fromthe Decent Work Perspective’. ILO WorkingPaper on Informal Economy # 4. Available ath t t p : / / w w w . i l o . o r g / p u b l i c / e n g l i s h /employment/infeco/publ.htm#asia2.
Anant, T., K. Sundaram and S. Tendulkar. 1999.Employment and Labour in South Asia. South AsiaMultidisciplinary Advisory Team (SAAT), NewDelhi: International Labour Office.
Anker, R. 1997. ‘Theories of OccupationalSegregation by Sex: An Overview’. InternationalLabour Review , 136(3): 315-339. Geneva:International Labour Office.
Anton, M. and D. Sagarike. 2002. ‘Sri LankaCountry Report’. Available at http:www.itcilo.it/english/actrav/telearn/global/ilo/frame/epzsri.htm. Obtained on 15thNovember 2002.
Anwar, T. 2001. Impact of globalisation andliberalization on growth, employment and poverty: Acase study of Pakistan. Mimeo.
Aslam, N. 2001. ‘Role of Micro Credit inEconomic Revival and Poverty Alleviation’.Journal of the Institute of Bankers Pakistan, March2001. Karachi: The Times Press (Pvt.) Ltd.
Bacchetta, M. and B. Bora. 2003. ‘Industrial TariffLiberalization and Doha Development Agenda’.Geneva: WTO. Available at http://www.wto.org.
Bachhetta, M. and M. Janson 2003. ‘Adjusting toTrade Liberalization: The Role of Policy,Institutions and WTO Disciplines’. WTOSpecial Study # 7. Geneva: WTO.
Bajaj, M. 1999. ‘Invisible Workers, VisibleContribution: A Study of Homebased WomenWorkers in Five Sectors across South Asia’.Available at http://wiego.org/papers/mbwiego.pdf.
Barton, J.H. 2001. ‘Differentiated Pricing ofPatented Products’, WHO Commission onMacroeconomics and Health. Mimeo. Availableat http://cmhealth.org/cmh_papers andreports.htm.
Bhagwati, J. 1998. ‘Trade and Wages: A MalignRelationship?’. In S.M. Collins (ed.), Imports,Exports, and the American Worker. WashingtonD.C.: Brookings).
Bhandari, L., M. Bordoloi, and A. Dubey. 2003.‘Benefits of Investing in Youth’. Available athttp://www.indicus.net.
164 Human Development in South Asia 2003
Bhattacharya, D. 2003. Textile Quota Phase Out: TheFinal Countdown. Dhaka: Centre for PolicyDialogue.
Bhattacharyya, B. and M.D. Gupta. 2001. ‘Anti-dumping: Road to Reforms’. Focus WTO 3(1),May-June 2001. New Delhi: Indian Institute ofForeign Trade.
. 2002. ‘Shaping the WTO Anti-dumpingAgreement: A Developing CountryPerspective’. Foreign Trade Review 36(3-4).October 2001-March 2002. New Delhi: IndianInstitute of Foreign Trade.
Bhattacharyya, B. and P. Parthaparatim. 2000.‘Food Security in India in the Context ofAgreement on Agriculture’. In B. Bhattacharyya(ed.), Seattle and Beyond: The Unfinished Agenda.New Delhi: Indian Institute of Foreign Trade.
BICC (Bonn International Centre for Conversion).2003. Conversion Survey 2003: Global Disarmament,Demilitarization and Demobilization. Oxford:Oxford University Press.
Bokestein, F. and A. Diamantopoulu. 2001.‘Workers without Frontiers’. Financial Times, 29January. London.
BYST (Bharatiya Yuva Shakti Trust). 2003. OfficialWebsite. Available at http://www.bystonline.org.
CBS (Central Bank of Sri Lanka). 2001. AnnualReport 2000. Colombo.
Centre for Policy Development. 2001. Changes andChallenges: A Review of Bangladesh’s Development2000. Dhaka: University Press Limited.
Chanda, R. 1999. Movement of Natural Persons andTrade in Services: Liberalising Temporary Movementof Labour under The Gats. New Delhi: ICRIER.
. 2002. ‘Movement of Natural Persons andthe GATS Major Trade Policy Impediments’.In Hoekman, Mattoo and English (eds.),Development, Trade and WTO: A Handbook .Washington D.C.: The World Bank.
Chandrasekhar, C.P. 2000. ICT in a developing countrycontext: An Indian case study. Background Paperfor Human Development Report 2001. NewYork: UNDP.
Chandrasekhar, C.P. and J. Ghosh. 2000. ‘Patentsand the Multinational Drug Industry’. Availableat http://www.macroscan.net.
. 2002a. ‘The Continuing Paradox ofWorld Manufacturing Employment’. Availableat http://www.macroscan.net.
. 2002b. The Market that Failed: A Decade ofNeoliberal Economic Reforms in India. New Delhi:Leftword Press.
Chang, H. 2002. Kicking Away the Ladder—Development Strategy in Historical Perspective .London: Anthem Press.
Chettri, P.B. 2000. ‘Youth unemployment inNepal’. Paper presented at ILO/DANIDASymposium on the South Asian Employers’ andtheir Organisations in Promoting YouthEmployment. 9-11 May. Bangalore.
Committee for Asian Women. 2001. ‘Struggling tobe Heard: Asian Women in Informal Work’.Available at http://www.cleanclothes.org/campaign/01-11_inf_lab.htm.
Coppel, J., J.C. Dumont and I. Visco. 2001. ‘Trendsin Immigration and Economic Consequences’.OECD Economics Department Workingpapers, No. 284. Available at http://econpapers.hhs.se/paper/oedoecdec/284.htm.
CSRF (Corporate Social Responsibility Forum).2003. Official Website. Available at http://www.iblf.org/.
CUTS. 1997. ‘TRIPs and Pharmaceuticals:Implications for India’. CUTS Briefing Paper.
Dev, M. 2000. ‘Economic Liberalisation andEmployment in South Asia’. ZEF DiscussionPapers on Development Policy. Available atht tp ://www.zef .de/download/zef_dp/zef_dp29-00.pdf.
Dogar, N. 2001. ‘Workplace Monitoring as a Toolfor Combating Child Labour: PakistanExperience’. In Asian Regional Meeting on theWorst Forms of Child Labour, Jakarta,Indonesia and Dhaka, Bangladesh 2000.Bangkok: ILO.
Easterly, W. 2001. ‘The political economy ofgrowth without development: A case study ofPakistan’. Paper for the Analytical Narrativesof Growth Project, Kennedy School ofGovernment, Harvard University.
Eberstadt, N. 2001. ‘The population implosion’.Foreign Policy. March/April 2001. WashingtonD.C.
Elder S. and L. J. Johnson. 1999. ‘Sex-SpecificLabour Market Indicators: What they show’.International Labour Review 138(4): 431-447.Geneva: International Labour Office.
Entrepreneurship Development Institute. 2003. ‘AVision Materialized: The Creation of EDI’.Available at http://www.ediindia.org.
Erclawn, A. and K. Ali. 2002. Debt Bondage inPakistan: Making Law Matter. Kathmandu: ILO.
Erclawn, A. and M. Nauman. 2001. Bonded Labourin Pakistan. Geneva: ILO.
ESCAP (Economic and Social Commission forAsia and the Pacific). 2001. Summary of meetingpaper # 1 on the social development situation andprospects of Asia and Pacific into the twenty-firstcentury.
EU (European Union). 2000. ‘Towards EnterpriseEurope: Work Programme for enterprise policy2000-5’. Commission Staff Working Paper. Brussels.
FAO (Food and Agriculture Organisation). 2001.FAO STAT. CD-ROM.
. 2002. FAO STAT. Available at http://www.faostat.fao.org/default.htm.
Feldman, M.P. and J. Francis. 2001. ‘Entrepreneursand the Formation of Industrial Clusters’.Revised version of presentation to conferenceon Complexity and Industrial Clusters—Dynamics,Models, National Cases. 19-20 June. Milan.
References 165
Finn, P. 2001. ‘German panel moves to boostimmigration’. The Washington Post . 5 January.Washington D.C.
. 2002. ‘A turn from tolerance: Anti-immigrant movement in Europe reflects post-September 11 views on Muslims’. TheWashington Post. 29 March. Washington D.C.
Garson, J.P. and C. Thoreau. 1999. ‘Typologie desmigrationes et analyse de l’integration’. In P.Dewitt (ed.), Immigration et integration: l’etat, l’etardes saviors, editions de la Decouvert. Paris.
GEFONT (General Federation of Nepalese TradeUnions). 2001. Labour Force and Employment inNepal. Kathmandu: General Federation ofNepalese Trade Unions and National LabourAcademy.
GEM (Global Entrepreneurship Monitor). 2001.GEM India report. Bangalore. Indian Institute ofManagement.
Gernigon, B.A. Odero and H. Guido. 2000. ‘ILOPrincipals Concerning Collective Bargaining’.International Labour Review, 139 (1): 33-57.Geneva: ILO.
Ghose, A.K. 1997. Employment in Nepal: Prospectsand Policies. New Delhi: ILO.
. 2000. ‘Trade Liberalization andManufacturing Employment’. EmploymentPaper 2000/3, Geneva: ILO.
. 2001. ‘Global Economic Inequality andInternational Trade’. Employment Paper No.2001/12. Geneva: ILO.
Ghosh, J. 1999a. ‘Macroeconomic trends andfemale employment : India in the Asiancontext’. In T.S. Papola and Alakh N. Sharma(eds.), Gender and Employment in India . NewDelhi: Vikas Publishing House.
. 1999b. Trends in economic participation andpoverty of women in the Asia-Pacific region. Bangkok:UN-ESCAP. also available at website http://www.macroscan.com.
. 2001a. ‘Urban Indian women in informalemployment: Macro trends in the 1990s’. In A.Kundu and A.N. Sharma (eds.), Informal Sectorin India: Problems and Policies . New Delhi:Institute for Human Development.
. 2001b. ‘Globalisation, export-orientedemployment for women and social policy: Acase study of India’. UNRISD DiscussionPaper. Also published in Social Scientist, 2002.
. 2002a. ‘Macroeconomic Reforms and aLabour Policy Framework for India’. Availableat http://www.networkideas.org.
. 2002b. ‘Social policy in Indiandevelopment’. In T. Mkandawire (ed.), SocialPolicy. Geneva: UNRISD. (forthcoming).
. 2002c. ‘The Enron Saga’. Available athttp:// www.macroscan.net.
. 2003a. ‘Whatever happened to FarmEmployment?’. Available at http://www.macroscan.net).
. 2003b. Export-oriented Employment forWomen and Social Policy: A Case Study of India.Mimeo.
Ghosh, J., and C.P., Chandrasekhar. 2001. Crisis asConquest: Learning from East Asia. New Delhi:Orient Longman.
Gibson, P., J. Wainio, D. Whitley, and M. Bohman.2001. ‘Profiles of Tariffs in Global AgriculturalMarkets’. Market and Trade EconomicsDivision, Economic Research Service, USDAReport No. 796.
Gilligan, B. 2003. Child Labour in Nepal:Understanding and Confronting its Determinants.Florence: Innocenti Research Centre. Availableat http://www.ucw-project.org/resources/pdf/nepal/childlabour_nepal.pdf.
Global Unions, World Confederation of Labourand European Trade Union Confederation.2002. ‘Report on the observance of core labourstandards in Sri Lanka’. Available at http//www.icftu.org.
GOI (Government of India). Various issues.National Accounts Statistics. Central StatisticsOrganisation. New Delhi.
. Various issues. National Sample Survey .New Delhi.
. 1991. Census of India 1991. Available athttp://www.censusindia.net.
. 2001. Census of India 2001. New Delhi.
. 2002a. ‘Impact of globalization on Indianeconomy particularly on employment and howto meet the challenges’. 38th Session of IndianLabour Conference. New Delhi: Ministry ofLabour.
. 2002b. Report of Special Group onTargeting Ten Million EmploymentOpportunities per year over Tenth Plan Period.Planning Commission. Available at http://planningcommission.nic.in.
. 2003a. Economic Survey 2002-03. Ministryof Finance. New Delhi.
. 2003b. ‘Ministry of Labour AnnualReport 2002-03’. Available at http: //www.labour.nic.in.
Goldar, B. 2002. ‘Trade Liberalization andManufacturing Employment: The Case ofIndia’. Employment Paper No. 2002/34.Geneva: ILO.
Golub, S.S. 1997. ‘International Labor Standardsand International Trade’. InternationalMonetary Fund Working Paper # WP/97/37.
GOM (Government of Maldives). 2002. ‘Yearbookof Maldives 2002’. Available at http:// www.planning.gov.mv/yrb2002/statcd/Yearbook/Emp01.htm.
GON (Government of Nepal). 2001. ‘NepalLabour Force Survey 1998/99’. Available athttp://www.cbs.gov.np/hhold_survey/nlfs_tables.htm.
GOP (Government of Pakistan). 2000. Convention182 . Ministry for Labour, Manpower andOverseas Pakistanis. Islamabad.
166 Human Development in South Asia 2003
. 2001a. Labour Force Survey 1999-2000 .Federal Bureau of Statistics. Islamabad.
. 2001b. National Policy and Plan of Actionfor the Abolition of Bonded Labour and Rehabilitationof Freed Bonded Labourers. Ministry for Labour,Manpower and Overseas Pakistanis. Islamabad.
. 2001c. Statistical Yearbook 2001. Ministryfor Labour, Manpower and Overseas Pakistanis.Islamabad.
. 2001d. Economic Survey 2000-2001 .Economic Adviser’s Wing, Finance Division.Islamabad.
. 2002a. Education Sector Reforms. ActionPlan. Islamabad.
. 2002b. ILO Convention 100 in Perspective.Ministry of Labour, Manpower and OverseasPakistanis. Islamabad.
. 2003. Pakistan 2003. Statistical Pocket Book .Islamabad: Federal Bureau of Statistics.
GOS (Government of Sri Lanka). 2000. TextileStatistics of Sri Lanka 2000. Available at http://www.statistics.gov.lk/textile/contents.htm.
. 2002a. Quarterly Report of the Sri LankaLabour Force Survey, 2002 Second Quarter .Department of Census and Statistics. Availableonline at http://www.statistics.gov.lk/samplesurvey/qlf_2002.pdf.
. 2002b. Regaining Sri Lanka: Vision forGrowth. Colombo.
Gothoshar, S. 2001. ‘Women Workers in InformalEconomy in Asia’. Available at Committee forAsian Women Web Site http://caw.jinbo.net/index5.php.
Grameen. 2003. Website available at http://www.grameen-info.org/.
Gulati, A. 1998. ‘Indian Agriculture in an OpenEconomy’. In I.J. Ahluwalia and I.M.D. Little,India’s Economic Reforms and Development: Essaysfor Manmohan Singh.
Haq, K. 1996. ‘Toward Gender Equality’. Paperpresented at the State of the World ForumConference. San Francisco.
Haq, M. 1993. ‘Social and cultural dimensions ofchange’. In Uner Kirdar and Leonard Silk (eds.),A World Fit for People. New York UniversityPress.
Hermida, A. 2002. ‘Mobile Money Spinner forWomen’. Available at http://news.bbc.co.uk/1/low/technology/2254231.stm.
Hilowitz, J. 1997. ‘Social Labeling to Combat ChildLabour: Some Considerations’. InternationalLabour Review 136(2): 173-19. Geneva.
Hoekman, B. 1995. ‘Trade Laws and Institutions:Good Practices and the World TradeOrganization’. World Bank Discussion Paper282. Washington D.C.
. 1996. ‘Assessing the General Agreementon Trade in Services’. In W. Martin and L.A.Winters (eds.), The Uruguay Round and theDeveloping Economies. Cambridge: CambridgeUniversity Press.
Humblet, M., and M. Zarka-Martres. 2002. ‘ILOStandards Policy’. In International LabourStandards: A Global Approach . Malta:International Labour Office.
Hurt, H. III. 2003. ‘A path to helping the poor,and his investors’. The New York Times. 10August. New York.
Hussain, I. 2003. ‘Banking and Financial SectorReforms’. Speech addressed at PakistanDevelopment Forum, 12-14 May. Islamabad.Available at http://lnweb18.worldbank.org/sar/sa.nsf/Attachments/PDF2003-SBP/$File/SBP.pdf.
IAMR (Institute of Applied Manpower Research).2001. An evaluation of vocational education scheme ofUGC. IAMR Report No. 8/2000. New Delhi.
ICFTU (International Confederation of Free TradeUnions). 2000. ‘Internationally Recognised CoreLabour Standards in Bangladesh’. Available athttp://www.icftu.org.
. 2002a. ‘Internationally Recognised CoreLabour Standards in India’. Available at: http://www.icftu.org.
. 2002b. ‘Internationally Recognised CoreLabour Standards in Pakistan’. Available athttp://www.icftu.org.
. 2003a. ‘Annual Survey of Violations ofTrade Union Rights’. Available at ICFTU website http//www.icftu.org/survey.
. 2003b. ‘Internationally Recognised CoreLabour Standards in Maldives’. Available athttp://www.icftu.org.
ICFTU-APRO (International Confederation ofFree Trade Unions-Asian Pacific RegionalOrganisation). 2002. Regional Survey on WorkingConditions of Women Workers in Asia and Pacific.Mimeo.
ICRA (Indian Credit Rating Agency). 1999. TheIndian Pharmaceutical Industry Report. Delhi: IndianCredit Rating Agency.
ILO (International Labour Organisation). 1995.World Employment Report 1995 . Geneva:International Labour Office.
. 1997. World Labour Report 1997-98:Industrial Relations, Democracy and Social Stability.Geneva: International Labour Office.
. 1998. World Employment Report 1998-99:Employability in the Global Economy How TrainingMatters. Geneva: International Labour Office.
. 1999a. Key Indicators of Labour Market1999. CD-ROM. Geneva: International LabourOrganisation.
. 1999b. Skills in Asia and the Pacific: WhyTraining Matters. Geneva: International LabourOffice.
. 2000a. A Partnership of Equals. Geneva:Bureau for Gender Equality.
. 2000b. ‘Compilation of Annual Reportsby ILO: India, Pakistan, Bangladesh, Nepal, andSri Lanka’. Available at http://www.ilo.org/public/english/standards/index.htm.
References 167
. 2000c. World Labour Report 2000: IncomeSecurity and Social Protection in a Changing World.Geneva: International Labour Office.
. 2000d. ‘Your Voice at Work: GlobalReport under the Follow-up to the ILODeclaration on Fundamental Principles andRights at Work’. Available at http://www.ilo.org/declaration.
. 2001a. ‘Compilation of Annual Reportsby ILO: India, Pakistan, Bangladesh, Nepal, andSri Lanka’. Available at http://www.ilo.org/public/english/standards/index.htm.
. 2001b. Key Indicators of Labour Market2001-2002 . CD-ROM. Geneva: InternationalLabour Organisation.
. 2001c. Key Indicators of Labour Market2001-2002 . Geneva: International LabourOffice.
. 2001d. Moving Ahead Towards theElimination of the Worst Forms of Child Labour. InAsian Regional Meeting on the Worst Formsof Child Labour, Phuket, Thailand 1999.Bangkok: ILO.
. 2001e. Social Security: A NewConsensus. Geneva: International LabourOffice.
. 2001f. Stopping Forced Labour: Global Reportunder the Follow-up to the ILO Declaration onFundamental Principles and Rights at Work .Geneva: ILO.
. 2001g. World Employment Report 2001: Lifeat Work in the Information Economy. Geneva:International Labour Office.
. 2001h. Meeting the Youth EmploymentChallenge . Geneva: International LabourOrganisation.
. 2002a. ‘Compilation of Annual Reportsby ILO: India, Pakistan, Bangladesh, Nepal, andSri Lanka’. Available at http://www.ilo.org/public/english/standards/index.htm.
. 2002b. ‘ILO-IPEC: Achievements ofILO-IPEC in Pakistan 2002’. ILO News andViews 2(2): 13-16. Geneva: ILO.
. 2002c. A Future without Child Labour:Global Report under the Follow-up to the ILODeclaration on Fundamental Principles and Rights atWork. Geneva: ILO.
. 2002d. Every Child Counts: New GlobalEstimates on Child Labour. Geneva: ILO.
. 2002e. International Labour Standards: AGlobal Approach . Malta: International LabourOffice.
. 2002f. The World of Work: TheMagazine of the ILO. No. 45, December 2002.Geneva: SRO-Kundig SA.
. 2002g. Women and Men in the InformalEconomy: A Statistical Picture . Geneva:International Labour Office. Also available athttp://wiego.org/papers/ilo_gender.pdf.
. 2002h. Yearbook of Labour Statistics 2002.Geneva: International Labour Office.
. 2003a. Global Employment Trends 2003 .Geneva: International Labour Office.
. 2003b. ‘International Labour Law’.Available at http://www.ilo.org.
. 2003c. ‘Poverty Reduction in Pakistan:The Strategic Impact of Macro andEmployment Policies’. Paper presented atEmployment Poverty Nexus on 15 April 2003.ILO Regional Office for Asia and Pacific.Islamabad.
. 2003d. LABORSTA: InternationalLabour Statistics Database. Available at http://laborsta.ilo.org.
. 2003e. ‘Committee of Experts on theApplication of Conventions andRecommendations Individual ObservationConcerning Convention No. 100 in Nepal’.Available at http://www.ilo.org/ilolex.
. 2003f. ‘Committee of Experts on theApplication of Conventions andRecommendations Individual ObservationConcerning Convention No. 87 in Bangladesh’.Available at http://www.ilo.org/ilolex.
. 2003g. ‘Committee of Experts on theApplication of Conventions andRecommendations Individual ObservationConcerning Convention No. 29 in India’.Available at http://www.ilo.org/ilolex.
. 2003h. ‘Committee of Experts on theApplication of Conventions andRecommendations Individual ObservationConcerning Convention No. 105 inBangladesh’. Available at http://www.ilo.org/ilolex.
. 2003i. ‘Committee of Experts on theApplication of Conventions andRecommendations Individual ObservationConcerning Convention No. 87 in Pakistan’.Available at http://www.ilo.org/ilolex.
. 2003j. ‘Compilation of Annual Reportsby ILO: India, Pakistan, Bangladesh, Nepal, andSri Lanka’. Available at http://www.ilo.org/public/english/standards/index.htm.
. 2003k. ‘ILOLEX: Database onInternational Labour Standards’. Available athttp://www.ilo.org/ilolex/english/index.htm.
. 2003l. ‘International Labour Standards:Ratifications of Fundamental Conventions’.Available at http://www.webfusion.ilo.org/public/db/standards/normes/appl/
. 2003m. ‘International Labour Standards:Ratifications of the ILO Conventions’.Available at http://www.webfusion.ilo.org/public/db/standards/normes
. 2003n. ‘NATLEX: Database of NationalLaws on Labour, Social Security and RelatedHuman Rights’. Available at http://natlex.ilo.org.
. 2003o. Time for Equality at Work: GlobalReport under the Follow-up to the ILO Declaration onFundamental Principles and Rights at Work .Geneva: International Labour Office.
168 Human Development in South Asia 2003
. 2003p. ‘Committee of Experts on theApplication of Conventions andRecommendations Individual ObservationConcerning Convention No. 98 in Pakistan’.Available at http://www.ilo.org/ilolex.
. 2003r. ‘Review of Annual Reports underthe follow-up to the ILO Declaration onFundamental Principles and Rights at Work-2003’. Available at http://www.ilo.org/public/eng l i sh/s tandards/dec l/pub l/rev iew/index.htm.
IMF (International Monetary Fund). 2001.International Financial Statistics. Washington D.C.
. 2003. Official Website. Available athttp://www.imf.org.
Indiamart. 2003. Official Website. Available athttp://www.indiamart.com/.
IRC (Innocenti Research Centre). 2003.‘Understanding Children’s Work: An Inter-Agency Research Cooperation Project’.Available at http://www.ucw-project.org.
Irfan, M. 2000. ‘Youth employment andunemployment in Pakistan—An overview of1990s’. Paper in Promoting Youth Employment9-11 May. Bangalore.
Irfan, M. 2001. ‘Poverty in South Asia.’ Paperpresented at the Sixteenth Annual GeneralMeeting and Conference. 22-24 January 2001,Islamabad. Pakistan Institute of DevelopmentEconomics.
Ishikawa, T. 1993. Growth, human development andeconomic policies in Japan: 1955-93. New York:UNDP.
Johnson, A.H. 2000. Changing skill for a changingworld. New Zealand: Wellington. Available athttp://www.fulbright.org.nz/voices/axford/docs/johnsona.pdf.
Joshi, G. 2000. Privatisation in South Asia. SouthAsia Multidisciplinary Advisory Team, ILO.New Delhi: ILO.
. 2002. ‘Overview of competitiveness,productivity, and job quality in South AsianGarment Industry’. In G. Joshi (ed.), GarmentIndustry in South Asia: Rags or Riches? New Delhi:International Labour Organisation.
Kafle, P. 2000. ‘Girls in Kamaiya Families’.Available at http://www.cwa.tnet.co.th/vol16-2/contents1.htm.
Kathuria, S., W. Martin, and, A. Bharadwaj. 2000.‘Implications for South Asian Countries ofAbolishing the Multifibre Arrangement’. WorldBank Working Paper Series 2721. Washington:World Bank.
Kelegama, S., and R. Epaarachchi. 2002. ‘GarmentIndustry in Sri Lanka’. In G. Joshi (ed.), GarmentIndustry in South Asia: Rags or Riches? New Delhi:International Labour Organisation.
Kheir-El-Din, H. 2002. ‘Implementing theAgreement on Textiles and Clothing’. InHoekman, Mattoo and English (eds.),Development, Trade and WTO: A Handbook .Washington DC: The World Bank.
Khundker, N. 2002. ‘Garment Industry inBangladesh’. In G. Joshi (ed.), Garment Industryin South Asia: Rags or Riches? New Delhi:International Labour Organisation.
Kingdom of Bhutan. 2001a. ‘Gender Pilot Study:Executive Summary’. Available at http://www.pcs.gov.bt/publications/gender.
. 2001b. Convention on the Elimination of AllForms of Discrimination Against Women: Report ofthe Kingdom of Bhutan Combined Initial 1st, 2nd and3rd periodic Reports . Available at http://www.pcs .gov .b t/publ i ca t ion/Gender/Convention/gender.pdf.
Krugman, P. 1994. ‘Does Third World GrowthHurt First World Prosperity?’. HarvardBusiness Review, July-August 1994.
Krugman, P. and R. Lawrence. 1994. ‘Trade, Jobs,and Wages’. Scientific American, April 1994.
Kucera, D. 2002. ‘Core Labour Standards andForeign Direct Investment’. International LabourReview 141(1-2): 173-19. Geneva.
Kuriyan, V. 2002. ‘No problems here: The success,complacency and suspicion in the Indiandiamond industry’. The diamond and humansecurity project Occasional Paper # 7. Availableat http://action.web.ca/home/pac/attach/india_e.pdf.
Laird, S. 2002. ‘Market Access Issues and theWTO: An Overview’. In Hoekman, Mattoo andEnglish (eds.), Development, Trade and WTO: AHandbook. Washington DC: The World Bank.
Lakhman, W.D. 2000. ‘Problems of youthunemployment in Sri Lanka with specialreference to the role of employers in promotingyouth employment’. Paper presented atDANIDA, Bangalore. ILO.
Lee, E. 1996. ‘Globalisation and Employment: IsAnxiety Justified?’. International Labour Review135(5): 173-19. Geneva.
. 1997. ‘Globalization and LabourStandards: A Review of Issues’. InternationalLabour Review 136(2): 173-19. Geneva.
Lee, J.W. 1993. Economic Growth and Humandevelopment in the Republic of Korea, 1945-92. NewYork: UNDP.
Lee, M.K. 1990. Technical/vocational education system:A comparison of Pakistan and South Korea .Islamabad: ILO.
Leisman, S. 2001. ‘Productivity gains extendbeyond technology area’. The Wall Street Journal.January 9. New York.
Lieten, G.K. 2001. ‘Child Labour in South Asia’.Paper presented at IDPAD InternationalConference on Child Labour in South Asia. 15-17 October 2001. New Delhi.
Lomborg, B. 2001. The Skeptical Environmentalist:Measuring the Real State of the World. New York:Cambridge University Press.
Merrill Lynch and Watson Wyatt. 2000. ‘FinancialTimes Survey: European Pensions Provision’.The Financial Times. 10 November. London.
References 169
Majid, N. 2000. ‘Pakistan: Employment, output andproductivity’. Issues in DevelopmentDiscussion Paper No. 33. Geneva: ILO.
. 2001. ‘The Working Poor in DevelopingCountries’. International Labour Review 140(3):271-293. Geneva: International Labour Office.
Manandhar, N. 2001. ‘Social Security in Nepal’.Available at http://www.labournepal.org/labourissues/socialsecurityinnepal.html.
Manjur, A. 2002. ‘Garment Industry in Pakistan’.In G. Joshi (ed.), Garment Industry in South Asia:Rags or Riches? New Delhi: International LabourOrganisation.
Maskus, K.E. 1997. ‘Should Core Labor StandardsBe Imposed Through International TradePolicy’. Paper prepared for World Bank.Available at http://www.cid.harvard.edu/cidtrade/issues/laborpaper.html.
Masri, M.W. 1999. ‘The changing demands of the21st century’. Keynote address for the SecondInternational Congress on Technical andVocational Education, UNESCO 26-30 April.Seoul.
Masum, M. 2000. ‘Promoting youth employmentin Bangladesh: selected issues’. Paper presentedat DANIDA, Bangalore. ILO.
Mehrotha, S. and M. Biggeri. 2002. ‘SocialProtection in the Informal Economy: HomeBased Women Workers and OutsourcedManufacturing in Asia’. Innocenti WorkingPaper No. 97. Florence: UNICEF InnocentiResearch Centre.
Mehrotra, N.N. 1989. ‘Patents Act andTechnological Self-Reliance: The IndianPharmaceutical Industry’. Economic andPolitical Weekly, 13 May.
Merchant, K. 2000. ‘Immigration reforms to tackleskills gap’. The Financial Times. 10 September.London.
MHHDC (Mahbub ul Haq Human DevelopmentCentre). 1997. Human Development in South Asia1997. Islamabad: Oxford University Press.
. 1998. Human Development in South Asia1998. Islamabad: Oxford University Press.
. 1999. Human Development in South Asia1999. Karachi: Oxford University Press.
. 2000. Human Development in South Asia2000. Karachi: Oxford University Press.
. 2002. Human Development in South Asia2001. Karachi: Oxford University Press.
. 2003. Human Development in South Asia2002. Karachi: Oxford University Press.
Moore, M. 2002. ‘How Trade LiberalisationImpacts Employment’, Speech to theInternational Labour Organization, 18 March2002. Geneva.
Muqtada, M. 2003. Promotion of employment and decentwork in Bangladesh: Macroeconomic and labour policyconsiderations. Geneva: ILO. Mimeo.
Muqtada, M., A. Singh and M.A. Rashid. 2002.Bangladesh: Economic and Social Challenges ofGlobalisation . Dhaka: University Press Limited.
Nadvi, K. and G. Halder. 2002. ‘The Dynamics ofInter-Linked Clusters: The Surgical InstrumentSector of Sialkot, Pakistan and Tuttlingen,Germany’. IDS Working Paper Series . Sussex:University of Sussex, Institute of DevelopmentStudies.
Nambiar, R.G., R.G. Mungekar, and G.A. Tadas.1999. ‘Is Import Liberalisation HurtingDomestic Industry and Employment?’.Economic and Political Weekly, Special Articles13 February.
NASSCOM (National Association of Software andServices Companies). 1999. NASSCOM-McKinsey Report 1999. Available at http://www.nasscom.org.
NBIA (National Business Incubation Association).2003. Official website http://www.nbia.org.
Nepal South Asia Centre, 1998. Nepal HumanDevelopment Report 1998 . Kathmandu: NepalSouth Asia Centre.
OPPI (Organisation of Pharmaceutical Producersof India). 2003. ‘Employment in thePharmaceutical Industry’. Available at http://www.indiaoppi.com/employment chart.htm.
Pal, P. 2002. ‘Implementation Issues of theAgreement on Agriculture and its Implicationsfor Developing Countries’. Available at http://www.networkideas.org and http://www.kisanwatch.org.
Pant, D., and D. Pradhan 2002. ‘Garment Industryin Nepal’. In G. Joshi (ed.), Garment Industry inSouth Asia: Rags or Riches? New Delhi:International Labour Organisation.
Patnaik, U. 2003. ‘Employment and Poverty amongIndia’s Neighbours’. Available at http://www.macroscan.net.
PILER (Pakistan Institute of Labour Educationand Research), 2001. Mitigation and Abolition ofBonded Labour: Policy, Law and Economy inPakistan. Karachi: PILER.
Prennushi, G. 1999. Nepal: Poverty at the turn of theTwenty-first century . IDP Report No 174. TheWorld Bank.
Probe Team. 1999. Public Report on Basic Educationin India. New Delhi: Oxford University Press.
Purani, K. 2000. A research report on Gujaratmodel of entrepreneurial innovation: A studyof Surat diamond industry. Ahmedabad.
Rajghatta, C. 2001. The Horse that Flew . USA:Harper Collins.
Rao, R. 1999. ‘Social Clauses- Here to Stay’.Available at http://www.globalpolicy.org/socecon/labor/soclrao1.htm.
Rehman, A. 1997. Dialogue on The Challenge ofTechnical and Vocational Education for HumanResource Development Policy-Planning-Strategy .Dacca.
Richards, P. 2002. Towards an employment strategyframework for Sri Lanka. Geneva: ILO.
Richards, P., J. Ishikawa, and M. Lyubova. 2002.Towards an employment strategy framework for SriLanka. Geneva: ILO. Mimeo.
170 Human Development in South Asia 2003
Robinson, C. 1999. Leading Change in TET. Manila:Columbo Plan Staff College.
Rodrik, D. 1997. Has Globalization Gone Too Far?Washington D.C.: Institute for InternationalEconomics.
. 1999. The New Global Economy andDeveloping Countries: Making Openness Work .Washington, D.C.: Overseas DevelopmentCouncil.
. 2000. ‘Institutions for High QualityGrowth: What They Are and How to AcquireThem’. NBER Working Paper # 7540.Cambridge: National Bureau of EconomicResearch.
Rosa, K. 1995. Women of South Asia. Colombo:Friedrich Ebert Stiftung (FES) and GalaAcademic Press.
Rubin, H.A. 1999. Global Software Economics. NewYork: Hunter College Department of ComputerScience.
Scherer, F.M., and J. Wattal. 2001. ‘Post-TRIPSOptions for Access to Patented Medicines inDeveloping Countries’. ICRIER Working Paper# 62.
Sen, A. 2002. ‘Agriculture, employment andpoverty: Recent trends in rural India’. In V.K.Ramachandran and M. Swaminathan (eds.),Agarian Studies. New Delhi: Tulika Books.
Sen, G. 1999. ‘Gendered Labour markets andGlobalisation in Asia’. Paper presented at theAsian Regional Policy Dialogue, 24-26November 1999, Bangkok. United NationsConference on Trade and Development andUnited Nations Development Programme.
Serven, L. and A. Solimano. 1994. Striving for Growthafter Adjustment: The Role of Capital Formation .World Bank: Washington D.C.
Shafaeddin, S.M. 2002. ‘The Impact of China’sAccession to WTO on The Exports ofDeveloping Countries’. UNCTAD DiscussionPaper # 160.
Sharma, A. 2000. ‘Small is beautiful: Nepaleseeconomy can benefit from Small and mediumscale enterprises. But are we paying attention?’.The National News Magazine. 29 September–19October. Available at www.nepalnews.com.
Sharma, A.N., R. Mamgain and V. Parasar. 2000.‘Youth employment in India: role of employerand the government in its promotion’. Paperpresented at DANIDA, Bangalore. ILO.
Sharma, S. 2001. ‘Child Bonded Labour, Nepal’.In Asian Regional Meeting on the Worst Formsof Child Labour, Phuket, Thailand 1999.Bangkok: ILO.
Silverman R.E. and J. Kaufman. 2002. ‘For U.S.Jews a trip to Israel is suddenly a wrenchingexperience’. The Wall Street Journal, 3 April. NewYork.
Singh, A. 1989. ‘Third World Competition and De-Industrialization in Advanced Countries’.Cambridge Journal of Economics , 13:103-120.Cambridge: Cambridge University Press.
. 1990. ‘Southern Competition, LabourStandards and Industrial Development in theNorth and the South’. In S. Herzenberg andJ.F. Perez-Lopez (eds.), Labour Standards andDevelopment in the Global Economy . USDepartment of Labour, Washington D.C.
Sinha, P. 2003. Preparing Unions in South Asiafor the 21st Century. Available at http://fesportal.fes.de/pls/portal30/docs/FOLDER/WORLDWIDE/GEWERKSCHAFTEN/BERICHTE/UNIONS.HTML. [Retrieved on15 March 2003].
Sipon, A. 2001. ‘Meeting the global challenges intechnical and vocational education: TheMalaysian experience’. Address at UNESCOTVET Asia Pacific Conference 26-28 March.Adelaide.
Skyte, P. 2000. ‘Opening address to UNI ICTforum’. Available at www.union-network.org/UNIsite/Sectors/IBITS/ICT/9ICTforum/Peter_skyte.
SME India. 2003. Small Scale Industries Sector TaxConcessions. Available at http://www.smeindia.com/ssitaxconcessions.htm.
Sood. A. 2003. Voluntary Self-regulation versusMandatory Legislative Schemes for ImplementingLabour Standards: An Issues Paper on the NewRegulatory. Regime. Jaipur: CUTS Centre forInternational Trade, Economics &Environment.
Soomro, A.G. 2002a. ‘Tenancy Laws Root-Causeof Bonded Labour’. The Dawn . Karachi.
. 2002b. ‘Implementation of the BondedLabour Laws in Sindh: Problems andProspects’. Paper presented at the ILO-MOLNational Seminar on Bonded Labour,Hyderabad. Ministry for Labour, Manpowerand Overseas Pakistanis.
Spinanger, D. 1998. ‘Textiles Beyond the MFAPhase-Out’. University of Warwick Centre Forthe Study of Globalization and Regionalization(CSGR) Working Paper No. 13/98. Warwick:CSGR.
Srinivas, H. 2003. ‘Observations of FiveDevelopment Programmes in South Asia’.Available at http://www.gdrc.org/icm/govern/ppp-9.html.
Srinivasan, S. 2000. ‘Pharmaceuticals, WTO andSeattle Round’. Economic and Political Weekly,29 January-4 February 2000.
Srinivasan, T.N. 2002. ‘Developing Countries andthe Multilateral Trading System After Doha’.Available at: http://www.publicpolicies.org/Research/TN%C2%A0Srinivasan-pres.pdf.
Stern, R.M. 2002. ‘Quantifying Barriers to Tradein Services’. In Hoekman, Mattoo and English(eds.), Development, Trade and WTO: A Handbook.Washington D.C.: The World Bank.
Stiglitz, J. 2002. Globalization and its Discontents.London: Allen Lane.
Suzuki, N. and S. Ghayur. 2003. ‘Globalisation isNot Inclusive of People, Lets Us make It: A
References 171
Trade Union Perspective’. Paper presented atthe Eighteenth Annual General Meeting andConference. 13th-15th January 2003, Islamabad.Pakistan Institute of Development Economics.
Tan, E.A. 1993. ‘Privatisation of Education andTraining: Why and How?’. In M. Muqtada andA. Hildeman (eds.), Labour Markets and HRplanning in Asia. Islamabad: UNDP/ ILO AsianRegional Team for Employment Promotion(ARTEP).
Taylor, R. 2000. ‘Shortages of skilled staff threatenbusiness growth’. The Financial Times , 19October. London.
Tessaring, M. 1990. ‘Experiences in the field ofeducated unemployment—A global view’. In S.Ghayur & M.A. Hashmi (eds.), EducatedUnemployment . Islamabad: Friedrich EbertStiftung.
Thamarajaksh, R. 2001. ‘Promotion of SocialDialogue in EPZ’s in South Asia: Synthesis ofCountry Experiences’. In A.S. Obreai, A.Sivananthiran and C.S. Venkata Ratham (eds.),Labour Issues in EPZ’s in South Asia: Role of SocialDialogue. New Delhi: ILO.
The New York Times. 2002. ‘The population slowdown’. 28 March. New York.
TSSA (Transport Salaried Staff’s Association).2000. ‘International Labour Standards’.Available at http://www.tssa.org.uk/advice/gen/int01.pdf.
Tudawe, I. 2001. ‘Chronic poverty anddevelopment policy in Sri Lanka: Overviewstudy’. Chronic Poverty Research CentreWorking Paper #9.
Tumlin, K.C. 2001. ‘Trafficking in Children: ARegional Overview’. In Asian Regional Meetingon the Worst Forms of Child Labour, Jakarta,Indonesia and Dhaka, Bangladesh 2000. Bangkok:ILO.
Turnell, S. 2001. ‘Core Labour Standards and WTO’.Available at http://www.econ.mq.edu.au/research/2001.
U.S. Bureau of Census. 2003. InternationalDatabase. Available at http://www.census.gov.
UN (United Nations). 1994. ‘Report of the SAARCworkshop to formulate a collective position forthe World Summit for Social Development’.Available at http://www.un.org/documents/ga/conf166/aconf166-5.htm.
. 2001a. World Population Prospects: The 2000Revision. Volume I: Comprehensive Tables. Populationdivision . New York: UN.
. 2001b. World Population Prospects: The 2000Revision. Volume II. Population division. New York:UN.
. 2001c. World Public Sector Report. NewYork: UN.
. 2002. Economic and Social Survey of Asiaand the Pacific 2002, Economic Prospects: Preparingfor Recovery. New York: United Nations.
. 2003a. World Population Prospects: 2002Revision . Available at http://esa.un.org/unpp.
. 2003b. Official website. Available athttp://www.un.org.
UNCTAD (United Nations Conference on Tradeand Development). 1998a. Scope of expandingexports of developing countries. Geneva.
. 1998b. World Investment Report 1998 .Geneva: United Nations.
. 1998c. Trade and Development Reports.Geneva.
. 1999. Preparing for Future Multilateral TradeNegotiations: Issues and Research Needs from aDevelopment Perspective. Geneva: United Nations.
UNCTAD and WHO (World HealthOrganisation). 1998. International Trade in HealthServices: A Development Perspective . Geneva:UNCTAD.
UNDP (United Nations DevelopmentProgramme). 1992. Human Development Report1992. New York: Oxford University Press.
. 1995. Human Development Report 1995 .New York: Oxford University Press.
. 1996. Human Development Report 1996 .New York: Oxford University Press.
. 1998a. Sri Lanka Human DevelopmentReport 1998 . Colombo. Available at http://www.undp.org.
. 1998b. Nepal Human Development Report1998. Kathmandu: Nepal South Asia Centre.
. 1998c. Human Development Report 1998.New York: Oxford University Press.
. 1999. Human Development Report 1999 .New York: Oxford University Press.
. 2000. Human Development Report 2000 .New York: Oxford University Press.
. 2001a. Human Development Report 2001.New York: Oxford University Press.
. 2001b. Maldives Human Development Report2000. Available at http://www.undp.org.
. 2002. Human Development Report 2002 .New York: Oxford University Press.
. 2003. Human Development Report 2003 .New York: Oxford University Press.
UNESCO (United Nations Educational, Scientificand Cultural Organisation). 1995. Nationalprofiles in technical and vocational education in Asiaand the Pacific: Bangladesh. Bangkok.
. 1998. Statistical Yearbook 1998. Paris.
. 2000a. Education for all 2000 Assessment:Statistical Document. Paris.
. 2000b. Education for All: Status & Trends.Paris.
. 2001a. Address by Director General,UNESCO at a special session on Global DigitalDivide Initiative on the annual meeting of theWorld Economic Forum 29th January. Davos,Switzerland.
. 2001b. The Quality of Learning. Paris.
. 2002. Education for All: Is the World onTrack? Paris.
. 2003. UNESCO Statistics Database.Available at http://portal.unesco.org/uis/
172 Human Development in South Asia 2003
TEMPLATE/html/HTMLTables/education/gerner_primary.htm.
UNICEF. 2002. State of the World’s Children 2003.New York.
UNIFEM (United Nations Development Fund forWomen). 2000. Progress of World’s Women 2000.Available at http://www.undp.org/unifem/progressww/2000/.
Unni, J. 2000. ‘Women in the Informal Sector inSouth Asia: A Review of Evidence’.Background Paper for Regional PolicyWorkshop on Women in the Informal Sectorin South Asia: Creating an EnablingEnvironment. 18-20 October 2000. Availableat http://wiego.org/papers/unni.pdf.
Unni, J. and U. Rani. 2000. ‘Women in InformalEmployment in India’. Paper presented at TheInternational Association for FeministEconomics Conference, 15-17 August 2000,Istanbul. Available at http://wiego.org/main/publi1.shtml.
Vahapassi, A.E.E. 2001. ‘Workplace Monitoring inAsia to Combat Child Labour’. In Asian RegionalMeeting on the Worst Forms of Child Labour, Jakarta,Indonesia and Dhaka, Bangladesh 2000. Bangkok:ILO.
Varma, S. 2001. ‘WTO Agreement on Textiles andClothing: Impact on India’s Textiles andClothing Industry’. In G.K. Chadha (ed.), WTOand the Indian Economy. New Delhi: IndianEconomic Association.
Vijayabaskar, M. 2002. ‘Garment Industry in India’.In G. Joshi (ed.), Garment Industry in South Asia:Rags or Riches? New Delhi: International LabourOrganisation.
Vijaybhaskar et al. 2000. ‘What happens to formalemployment in the Indian software industry’.Paper presented at 42nd Annual Conference ofIndian Society of Labour Economics.Conference Issue of Indian Journal of LabourEconomics .
Visaria, P. 1998. ‘Unemployment among youth inIndia: level, nature and policy implication’.Employment and training papers no: 36.Geneva: International Labour Office.
Watkins, K. 2003. ‘Reducing poverty starts withfairer trade’. Financial Times. 21 June. London.
World Bank. 1993. East Asian Miracle. Washington:Oxford University Press.
. 1995. World Development Report 1995. NewYork: Oxford University Press.
. 1996. Nepal Living Standards Survey 1995-96 . Available at http://wbln1018.worldbank.org/sar/sa.nsf.
. 1997. World Development Indicators 1997.Washington D.C.
. 2000. Global Economic Prospects and theDeveloping Countries 2001. Washington D.C.
. 2001. ‘BDS for small enterprises:Guiding principles for donor intervention’.Washington: World Bank Committee of donoragencies for small enterprise development.
Available at http://www.sedonors.org/html/bds_guidelines.html.
. 2002a. ‘Poverty in South Asia’. Availableat http://lnweb18.worldbank.org/sar/sa.nsf.
. 2002b. Connecting to Growth: Sri Lanka’sPoverty Reduction Strategy. Washington D.C.
. 2002c. Global Economic Prospects 2002 .Washington D.C.
. 2002d. Poverty and Vulnerability in SouthAsia. Washington D.C.
. 2002e. World Development Indicators 2002.Washington, DC.
. 2003a. ‘Addressing Child Labor in SouthAsia’. Available at http://lnweb18.worldbank.org/sar/sa.nsf.
. 2003b. Global Development Finance 2003.Washington D.C.
. 2003c. World Development Indicators 2003.Washington D.C.
. 2003d. World Development Indicators2003. CD-ROM.
. 2003e. ‘WTO Trade Talks: Commentary’.DevNews Media Centre, 16 September.Available at http://www.worldbank.org.
Whalley, J. 1999. ‘Notes on Textiles and Apparelin the Next Trade Round’. Paper presented atthe Conference on Developing Countries in theNext WTO Trade Round, 5-6 November.Harvard University.
WHO (World Health Organisation). 2000.‘National Profile on Women, Health andDevelopment’. In S. Gopalan and M. Shiva(eds.), National Profile on Women, Health andDevelopment . New Delhi: World HealthOrganisation.
Wolcott, P. and Goodman S.E. 2002. Is theelephant learning to dance? Available at http://mosaic.unomaha.edu/India_2003.pdf.
Wood, A. 1994. North-South Trade, Employment andInequality: Changing Fortunes in a Skill-DrivenWorld. Oxford: Oxford University Press.
. 1995. ‘How trade hurt unskilled workers’.Journal of Economic Perspectives, 9(3): 57-80.
WTO (World Trade Organisation). 1998. TradePolicy Review India: Report by theGovernment. Document Number WT/TPR/G/33. Available at http://www.wto.org.
. 2000a. Trade Policy Review Bangladesh:Report by the Government. DocumentNumber WT/TPR/G/68.
. 2000b. Agricultural Trade Performance byDeveloping Countries 1990-98. WTO DocumentNumber G/AG/NG/S/6. Available at http://www.wto.org.
. 2000c. Committee on Agriculture: specialsession negotiating proposals and othersubmissions: Proposal on Market Access byCuba, Dominican Republic, El Salvador, Haiti,Honduras, Kenya, India, Nigeria, Pakistan, SriLanka, Uganda and Zimbabwe. Documentnumber G/AG/NG/W/37. Available at http://www.wto.org.
References 173
. 2001a. ‘Market Access: UnfinishedBusiness: Post-Uruguay Round Inventory andIssues’. Available at http://www.wto.org.
. 2001b. Committee On Agriculture:Special Session Negotiating Proposals AndOther Submissions: India—ProposalsDocument Number G/AG/NG/W/102.Available at http://www.wto.org.
. 2001c. Council for Trade in Goods:Second Major Review of the Implementationof the Agreement on Textiles and Clothing bythe Council for Trade in Goods—Communication from Uruguay. DocumentNumber G/C/W/325. Available at http://www.wto.org.
. 2001d. Council for Trade in Goods:Second Major Review of the Implementationof the Agreement on Textiles and Clothing bythe Council for Trade in Goods—Communication from Uruguay. Document
Number G/C/W/304. Available at http://www.wto.org.
. 2001e. Trade Policy Review Pakistan:Report by the Government. DocumentNumber WT/TPR/G/95. Available at http://www.wto.org.
. 2001f. Trade Policy Review Pakistan:Report by the Secretariat. Document NumberWT/TPR/S/95. Available at http://www.wto.org.
. 2002. Trade Policy Review India: Reportby the Government. Document Number WT/TPR/G/100. Available at http://www.wto.org.
Yongding, Y. and B. Zhang. 2000. The ResearchReport on China’s Entry into WTO: The Analysis ofthe China’s Industries . Social SciencesDocumentation Publish House.

174 Human Development in South Asia 2003
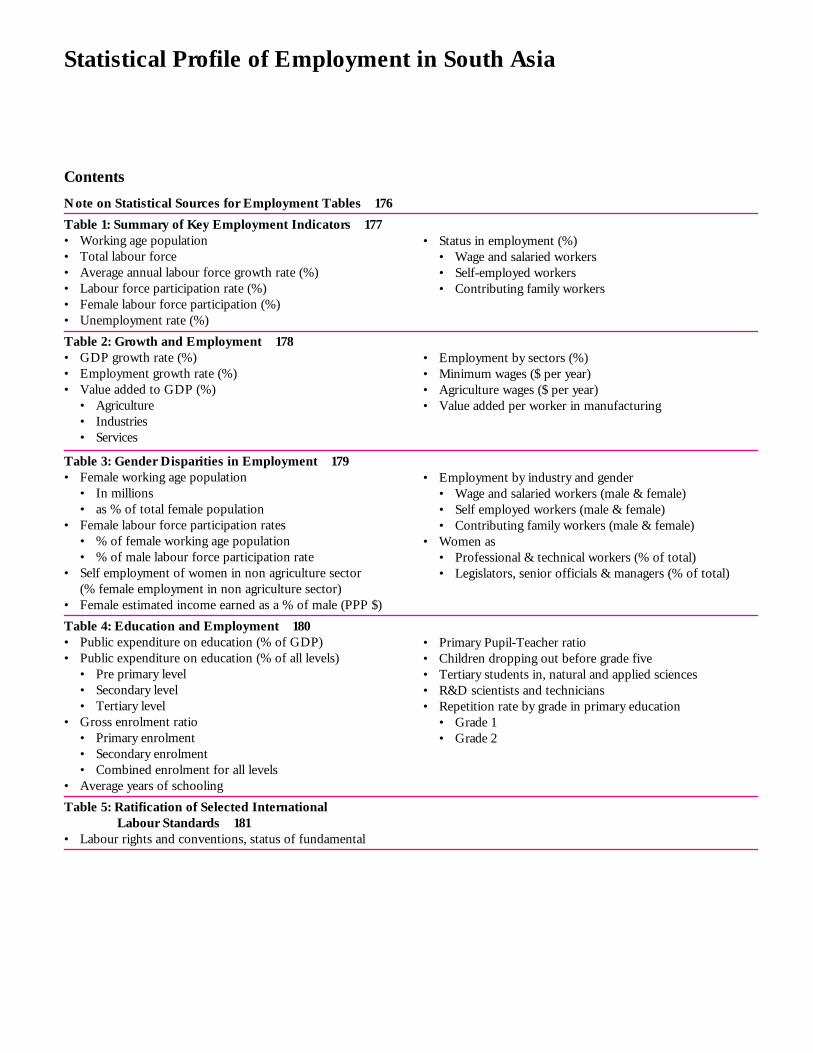
Statistical Profile of Employment in South Asia 175
Note on Statistical Sources for Employment Tables 176
Table 1: Summary of Key Employment Indicators 177• Working age population• Total labour force• Average annual labour force growth rate (%)• Labour force participation rate (%)• Female labour force participation (%)• Unemployment rate (%)
Table 2: Growth and Employment 178• GDP growth rate (%)• Employment growth rate (%)• Value added to GDP (%)
• Agriculture• Industries• Services
Table 3: Gender Disparities in Employment 179• Female working age population
• In millions• as % of total female population
• Female labour force participation rates• % of female working age population• % of male labour force participation rate
• Self employment of women in non agriculture sector(% female employment in non agriculture sector)
• Female estimated income earned as a % of male (PPP $)
Table 4: Education and Employment 180• Public expenditure on education (% of GDP)• Public expenditure on education (% of all levels)
• Pre primary level• Secondary level• Tertiary level
• Gross enrolment ratio• Primary enrolment• Secondary enrolment• Combined enrolment for all levels
• Average years of schooling
Table 5: Ratification of Selected InternationalLabour Standards 181
• Labour rights and conventions, status of fundamental
• Status in employment (%)• Wage and salaried workers• Self-employed workers• Contributing family workers
Contents
Statistical Profile of Employment in South Asia
• Employment by sectors (%)• Minimum wages ($ per year)• Agriculture wages ($ per year)• Value added per worker in manufacturing
• Employment by industry and gender• Wage and salaried workers (male & female)• Self employed workers (male & female)• Contributing family workers (male & female)
• Women as• Professional & technical workers (% of total)• Legislators, senior officials & managers (% of total)
• Primary Pupil-Teacher ratio• Children dropping out before grade five• Tertiary students in, natural and applied sciences• R&D scientists and technicians• Repetition rate by grade in primary education
• Grade 1• Grade 2
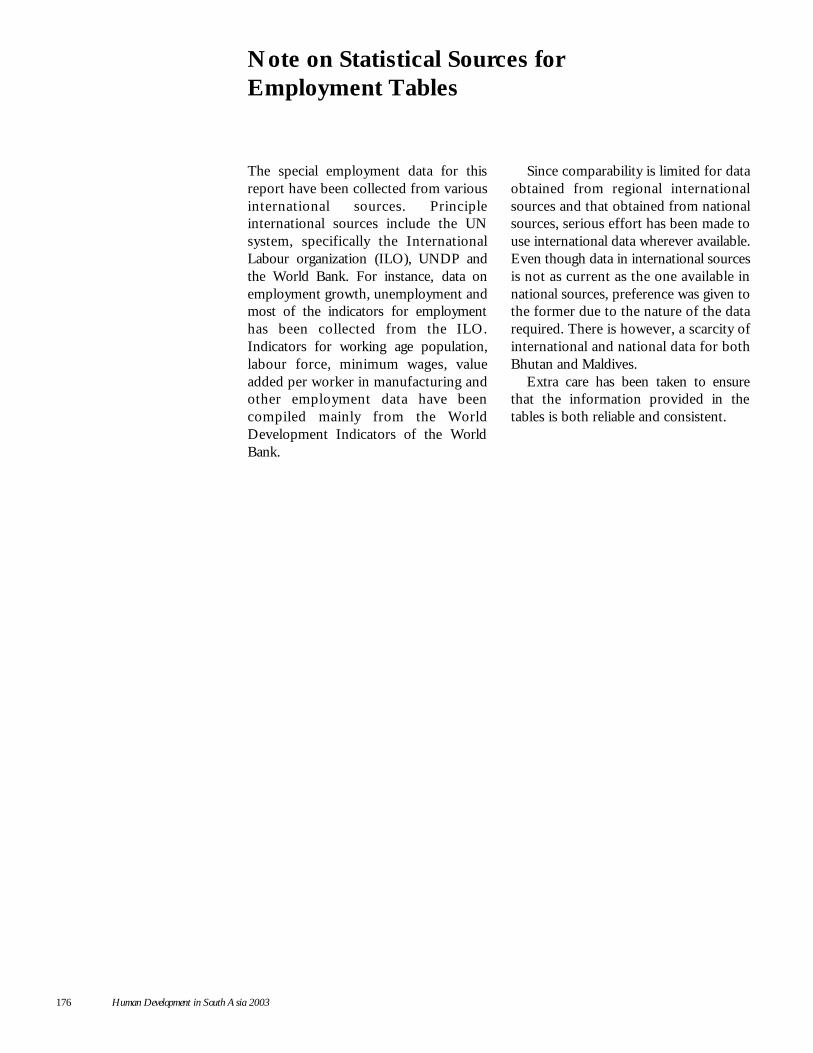
176 Human Development in South Asia 2003
Note on Statistical Sources forEmployment Tables
The special employment data for thisreport have been collected from variousinternational sources. Principleinternational sources include the UNsystem, specifically the InternationalLabour organization (ILO), UNDP andthe World Bank. For instance, data onemployment growth, unemployment andmost of the indicators for employmenthas been collected from the ILO.Indicators for working age population,labour force, minimum wages, valueadded per worker in manufacturing andother employment data have beencompiled mainly from the WorldDevelopment Indicators of the WorldBank.
Since comparability is limited for dataobtained from regional internationalsources and that obtained from nationalsources, serious effort has been made touse international data wherever available.Even though data in international sourcesis not as current as the one available innational sources, preference was given tothe former due to the nature of the datarequired. There is however, a scarcity ofinternational and national data for bothBhutan and Maldives.
Extra care has been taken to ensurethat the information provided in thetables is both reliable and consistent.
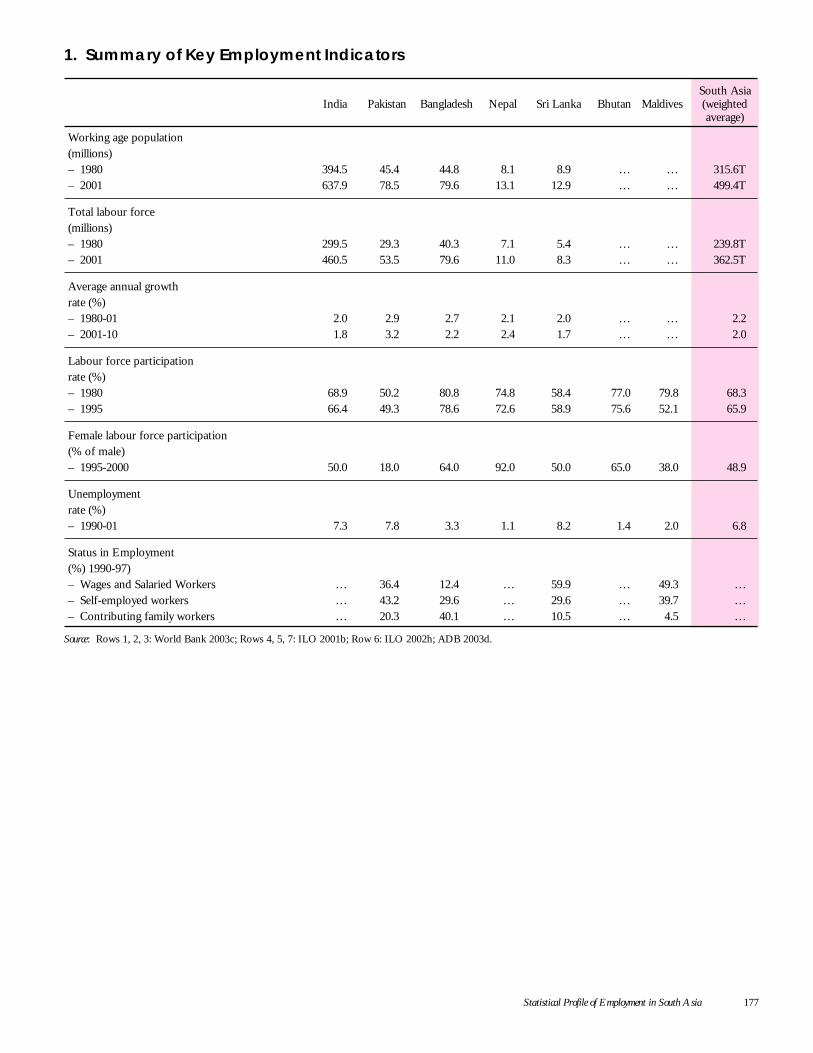
Statistical Profile of Employment in South Asia 177
1. Summary of Key Employment Indicators
South AsiaIndia Pakistan Bangladesh Nepal Sri Lanka Bhutan Maldives (weighted
average)
Working age population(millions)– 1980 394.5 45.4 44.8 8.1 8.9 … … 315.6T– 2001 637.9 78.5 79.6 13.1 12.9 … … 499.4T
Total labour force(millions)– 1980 299.5 29.3 40.3 7.1 5.4 … … 239.8T– 2001 460.5 53.5 79.6 11.0 8.3 … … 362.5T
Average annual growthrate (%)– 1980-01 2.0 2.9 2.7 2.1 2.0 … … 2.2– 2001-10 1.8 3.2 2.2 2.4 1.7 … … 2.0
Labour force participationrate (%)– 1980 68.9 50.2 80.8 74.8 58.4 77.0 79.8 68.3– 1995 66.4 49.3 78.6 72.6 58.9 75.6 52.1 65.9
Female labour force participation(% of male)– 1995-2000 50.0 18.0 64.0 92.0 50.0 65.0 38.0 48.9
Unemploymentrate (%)– 1990-01 7.3 7.8 3.3 1.1 8.2 1.4 2.0 6.8
Status in Employment(%) 1990-97)– Wages and Salaried Workers … 36.4 12.4 … 59.9 … 49.3 …– Self-employed workers … 43.2 29.6 … 29.6 … 39.7 …– Contributing family workers … 20.3 40.1 … 10.5 … 4.5 …
Source: Rows 1, 2, 3: World Bank 2003c; Rows 4, 5, 7: ILO 2001b; Row 6: ILO 2002h; ADB 2003d.
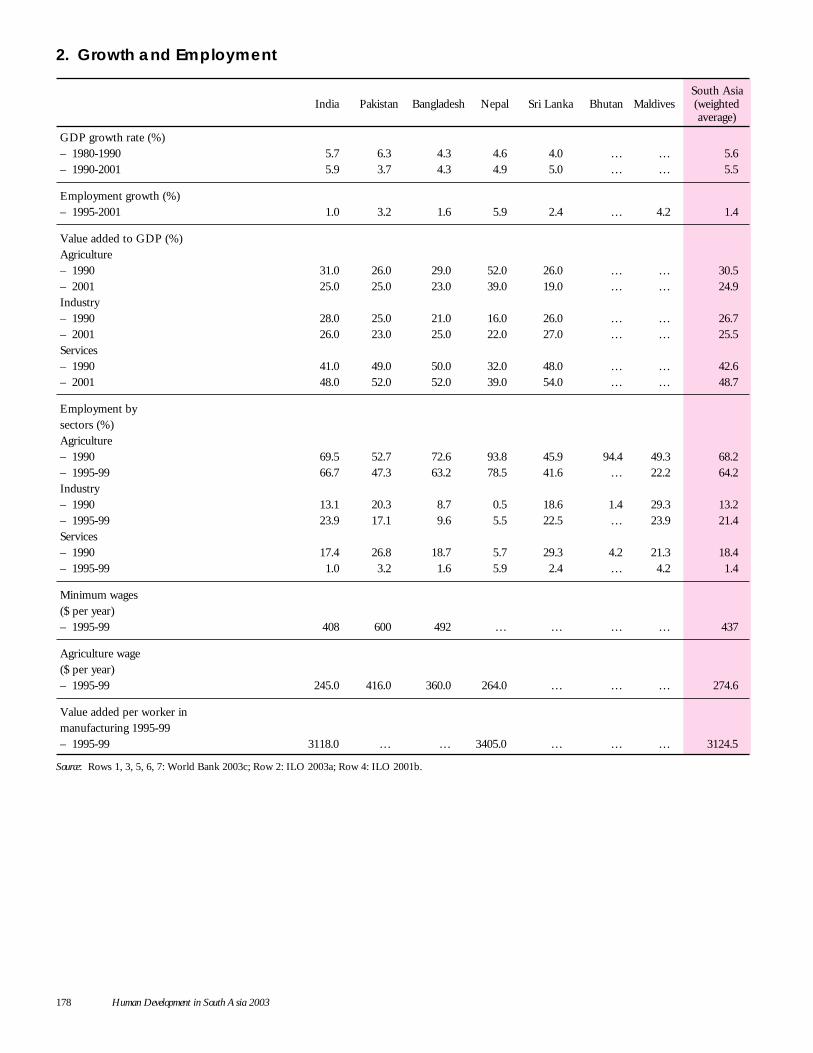
178 Human Development in South Asia 2003
2. Growth and Employment
South AsiaIndia Pakistan Bangladesh Nepal Sri Lanka Bhutan Maldives (weighted
average)
GDP growth rate (%)– 1980-1990 5.7 6.3 4.3 4.6 4.0 … … 5.6– 1990-2001 5.9 3.7 4.3 4.9 5.0 … … 5.5
Employment growth (%)– 1995-2001 1.0 3.2 1.6 5.9 2.4 … 4.2 1.4
Value added to GDP (%)Agriculture– 1990 31.0 26.0 29.0 52.0 26.0 … … 30.5– 2001 25.0 25.0 23.0 39.0 19.0 … … 24.9Industry– 1990 28.0 25.0 21.0 16.0 26.0 … … 26.7– 2001 26.0 23.0 25.0 22.0 27.0 … … 25.5Services– 1990 41.0 49.0 50.0 32.0 48.0 … … 42.6– 2001 48.0 52.0 52.0 39.0 54.0 … … 48.7
Employment bysectors (%)Agriculture– 1990 69.5 52.7 72.6 93.8 45.9 94.4 49.3 68.2– 1995-99 66.7 47.3 63.2 78.5 41.6 … 22.2 64.2Industry– 1990 13.1 20.3 8.7 0.5 18.6 1.4 29.3 13.2– 1995-99 23.9 17.1 9.6 5.5 22.5 … 23.9 21.4Services– 1990 17.4 26.8 18.7 5.7 29.3 4.2 21.3 18.4– 1995-99 1.0 3.2 1.6 5.9 2.4 … 4.2 1.4
Minimum wages($ per year)– 1995-99 408 600 492 … … … … 437
Agriculture wage($ per year)– 1995-99 245.0 416.0 360.0 264.0 … … … 274.6
Value added per worker inmanufacturing 1995-99– 1995-99 3118.0 … … 3405.0 … … … 3124.5
Source: Rows 1, 3, 5, 6, 7: World Bank 2003c; Row 2: ILO 2003a; Row 4: ILO 2001b.
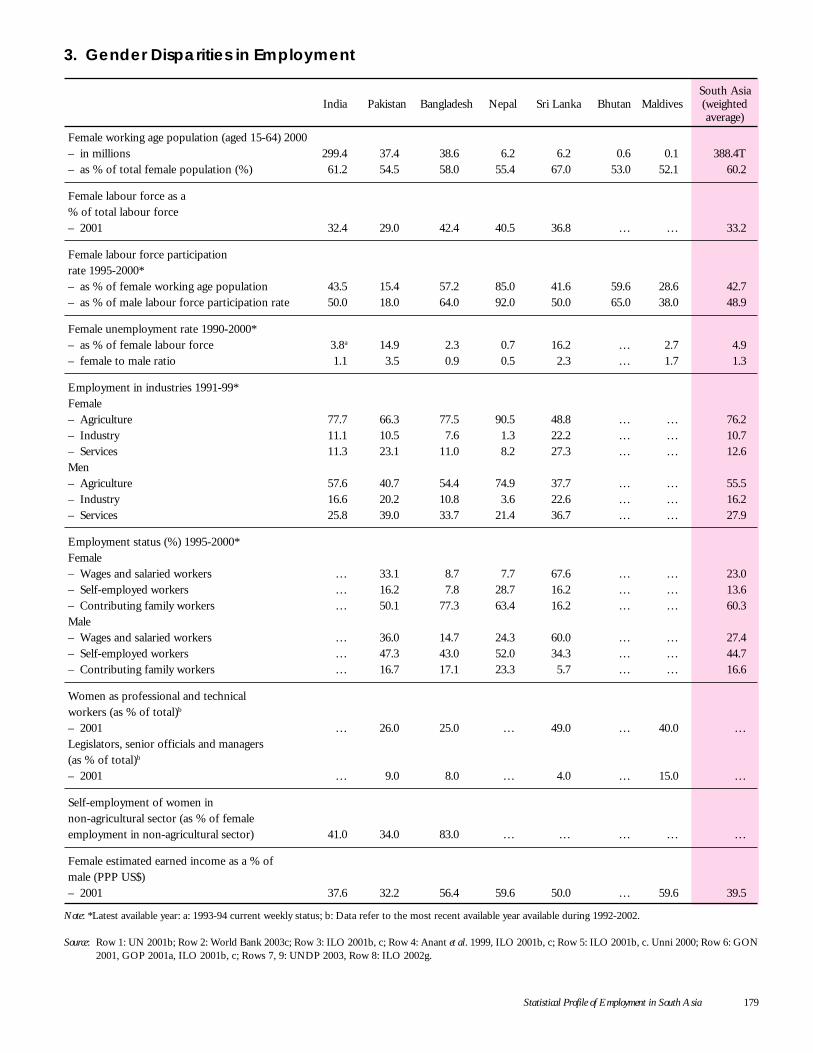
Statistical Profile of Employment in South Asia 179
3. Gender Disparities in Employment
South AsiaIndia Pakistan Bangladesh Nepal Sri Lanka Bhutan Maldives (weighted
average)
Female working age population (aged 15-64) 2000– in millions 299.4 37.4 38.6 6.2 6.2 0.6 0.1 388.4T– as % of total female population (%) 61.2 54.5 58.0 55.4 67.0 53.0 52.1 60.2
Female labour force as a% of total labour force– 2001 32.4 29.0 42.4 40.5 36.8 … … 33.2
Female labour force participationrate 1995-2000*– as % of female working age population 43.5 15.4 57.2 85.0 41.6 59.6 28.6 42.7– as % of male labour force participation rate 50.0 18.0 64.0 92.0 50.0 65.0 38.0 48.9
Female unemployment rate 1990-2000*– as % of female labour force 3.8a 14.9 2.3 0.7 16.2 … 2.7 4.9– female to male ratio 1.1 3.5 0.9 0.5 2.3 … 1.7 1.3
Employment in industries 1991-99*Female– Agriculture 77.7 66.3 77.5 90.5 48.8 … … 76.2– Industry 11.1 10.5 7.6 1.3 22.2 … … 10.7– Services 11.3 23.1 11.0 8.2 27.3 … … 12.6Men– Agriculture 57.6 40.7 54.4 74.9 37.7 … … 55.5– Industry 16.6 20.2 10.8 3.6 22.6 … … 16.2– Services 25.8 39.0 33.7 21.4 36.7 … … 27.9
Employment status (%) 1995-2000*Female– Wages and salaried workers … 33.1 8.7 7.7 67.6 … … 23.0– Self-employed workers … 16.2 7.8 28.7 16.2 … … 13.6– Contributing family workers … 50.1 77.3 63.4 16.2 … … 60.3Male– Wages and salaried workers … 36.0 14.7 24.3 60.0 … … 27.4– Self-employed workers … 47.3 43.0 52.0 34.3 … … 44.7– Contributing family workers … 16.7 17.1 23.3 5.7 … … 16.6
Women as professional and technicalworkers (as % of total)b
– 2001 … 26.0 25.0 … 49.0 … 40.0 …Legislators, senior officials and managers(as % of total)b
– 2001 … 9.0 8.0 … 4.0 … 15.0 …
Self-employment of women innon-agricultural sector (as % of femaleemployment in non-agricultural sector) 41.0 34.0 83.0 … … … … …
Female estimated earned income as a % ofmale (PPP US$)– 2001 37.6 32.2 56.4 59.6 50.0 … 59.6 39.5
Note: *Latest available year: a: 1993-94 current weekly status; b: Data refer to the most recent available year available during 1992-2002.
Source: Row 1: UN 2001b; Row 2: World Bank 2003c; Row 3: ILO 2001b, c; Row 4: Anant et al. 1999, ILO 2001b, c; Row 5: ILO 2001b, c. Unni 2000; Row 6: GON2001, GOP 2001a, ILO 2001b, c; Rows 7, 9: UNDP 2003, Row 8: ILO 2002g.
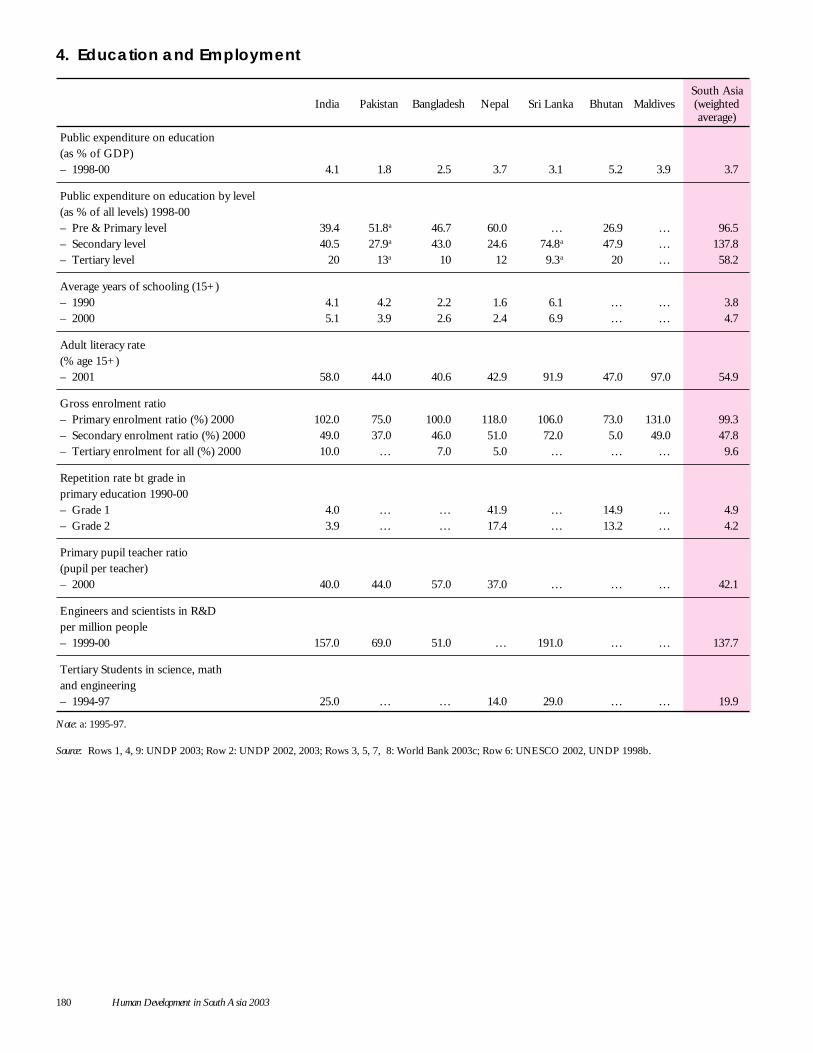
180 Human Development in South Asia 2003
4. Education and Employment
South AsiaIndia Pakistan Bangladesh Nepal Sri Lanka Bhutan Maldives (weighted
average)
Public expenditure on education(as % of GDP)– 1998-00 4.1 1.8 2.5 3.7 3.1 5.2 3.9 3.7
Public expenditure on education by level(as % of all levels) 1998-00– Pre & Primary level 39.4 51.8a 46.7 60.0 … 26.9 … 96.5– Secondary level 40.5 27.9a 43.0 24.6 74.8a 47.9 … 137.8– Tertiary level 20 13a 10 12 9.3a 20 … 58.2
Average years of schooling (15+)– 1990 4.1 4.2 2.2 1.6 6.1 … … 3.8– 2000 5.1 3.9 2.6 2.4 6.9 … … 4.7
Adult literacy rate(% age 15+)– 2001 58.0 44.0 40.6 42.9 91.9 47.0 97.0 54.9
Gross enrolment ratio– Primary enrolment ratio (%) 2000 102.0 75.0 100.0 118.0 106.0 73.0 131.0 99.3– Secondary enrolment ratio (%) 2000 49.0 37.0 46.0 51.0 72.0 5.0 49.0 47.8– Tertiary enrolment for all (%) 2000 10.0 … 7.0 5.0 … … … 9.6
Repetition rate bt grade inprimary education 1990-00– Grade 1 4.0 … … 41.9 … 14.9 … 4.9– Grade 2 3.9 … … 17.4 … 13.2 … 4.2
Primary pupil teacher ratio(pupil per teacher)– 2000 40.0 44.0 57.0 37.0 … … … 42.1
Engineers and scientists in R&Dper million people– 1999-00 157.0 69.0 51.0 … 191.0 … … 137.7
Tertiary Students in science, mathand engineering– 1994-97 25.0 … … 14.0 29.0 … … 19.9
Note: a: 1995-97.
Source: Rows 1, 4, 9: UNDP 2003; Row 2: UNDP 2002, 2003; Rows 3, 5, 7, 8: World Bank 2003c; Row 6: UNESCO 2002, UNDP 1998b.
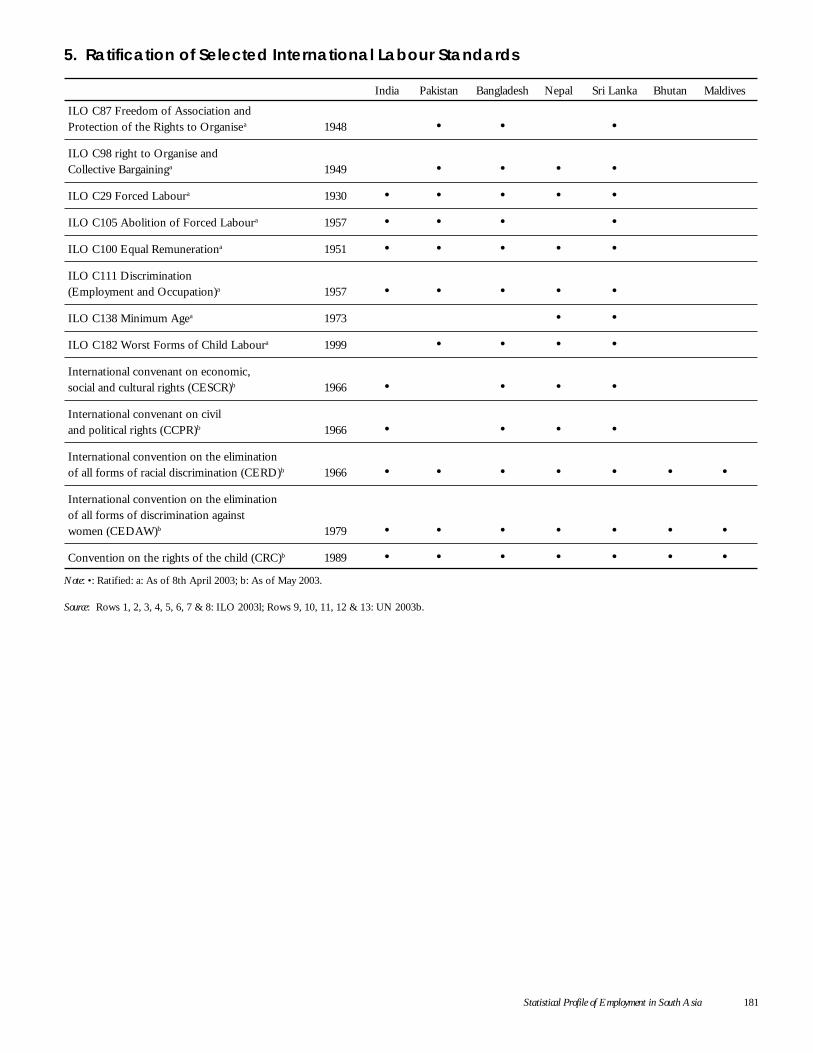
Statistical Profile of Employment in South Asia 181
5. Ratification of Selected International Labour Standards
India Pakistan Bangladesh Nepal Sri Lanka Bhutan Maldives
ILO C87 Freedom of Association andProtection of the Rights to Organisea 1948 • • •
ILO C98 right to Organise andCollective Bargaininga 1949 • • • •
ILO C29 Forced Laboura 1930 • • • • •
ILO C105 Abolition of Forced Laboura 1957 • • • •
ILO C100 Equal Remunerationa 1951 • • • • •
ILO C111 Discrimination(Employment and Occupation)a 1957 • • • • •
ILO C138 Minimum Agea 1973 • •
ILO C182 Worst Forms of Child Laboura 1999 • • • •
International convenant on economic,social and cultural rights (CESCR)b 1966 • • • •
International convenant on civiland political rights (CCPR)b 1966 • • • •
International convention on the eliminationof all forms of racial discrimination (CERD)b 1966 • • • • • • •
International convention on the eliminationof all forms of discrimination againstwomen (CEDAW)b 1979 • • • • • • •
Convention on the rights of the child (CRC)b 1989 • • • • • • •Note: •: Ratified: a: As of 8th April 2003; b: As of May 2003.
Source: Rows 1, 2, 3, 4, 5, 6, 7 & 8: ILO 2003l; Rows 9, 10, 11, 12 & 13: UN 2003b.

182 Human Development in South Asia 2003
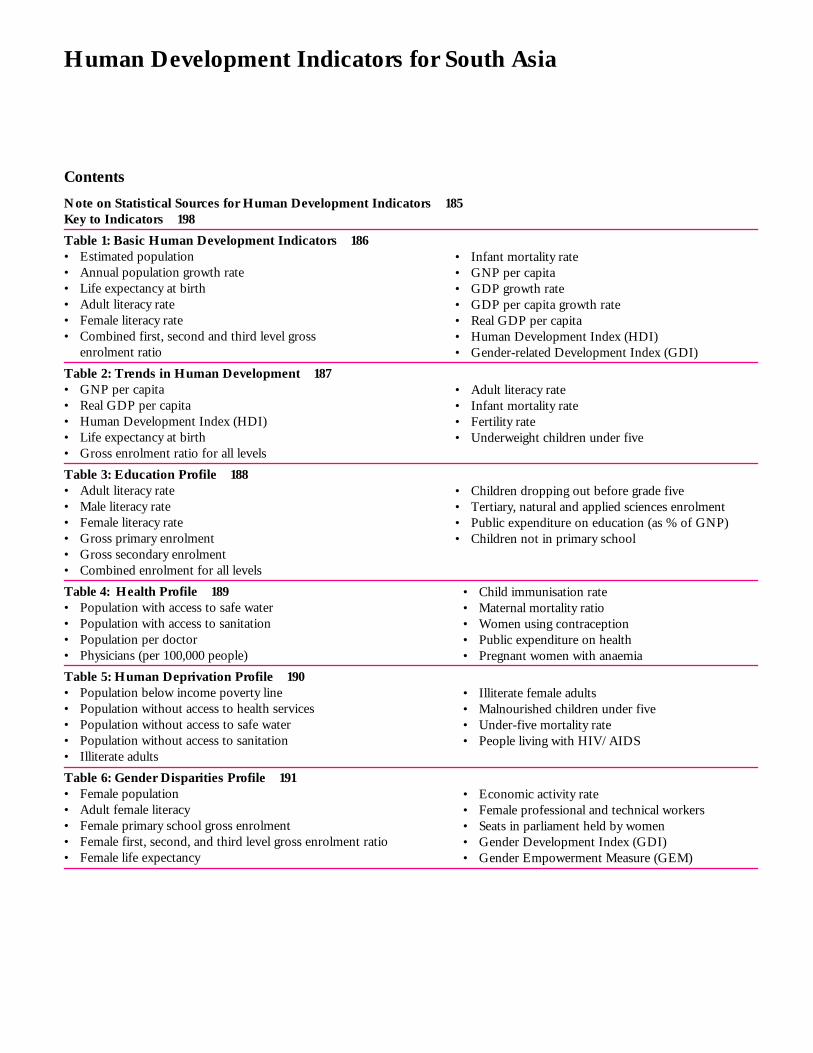
Human Development Indicators for South Asia 183
Contents
Note on Statistical Sources for Human Development Indicators 185Key to Indicators 198
Table 1: Basic Human Development Indicators 186• Estimated population• Annual population growth rate• Life expectancy at birth• Adult literacy rate• Female literacy rate• Combined first, second and third level gross
enrolment ratio
Table 2: Trends in Human Development 187• GNP per capita• Real GDP per capita• Human Development Index (HDI)• Life expectancy at birth• Gross enrolment ratio for all levels
Table 3: Education Profile 188• Adult literacy rate• Male literacy rate• Female literacy rate• Gross primary enrolment• Gross secondary enrolment• Combined enrolment for all levels
Table 4: Health Profile 189• Population with access to safe water• Population with access to sanitation• Population per doctor• Physicians (per 100,000 people)
Table 5: Human Deprivation Profile 190• Population below income poverty line• Population without access to health services• Population without access to safe water• Population without access to sanitation• Illiterate adults
Table 6: Gender Disparities Profile 191• Female population• Adult female literacy• Female primary school gross enrolment• Female first, second, and third level gross enrolment ratio• Female life expectancy
• Infant mortality rate• GNP per capita• GDP growth rate• GDP per capita growth rate• Real GDP per capita• Human Development Index (HDI)• Gender-related Development Index (GDI)
• Adult literacy rate• Infant mortality rate• Fertility rate• Underweight children under five
• Children dropping out before grade five• Tertiary, natural and applied sciences enrolment• Public expenditure on education (as % of GNP)• Children not in primary school
• Illiterate female adults• Malnourished children under five• Under-five mortality rate• People living with HIV/AIDS
• Economic activity rate• Female professional and technical workers• Seats in parliament held by women• Gender Development Index (GDI)• Gender Empowerment Measure (GEM)
• Child immunisation rate• Maternal mortality ratio• Women using contraception• Public expenditure on health• Pregnant women with anaemia
Human Development Indicators for South Asia
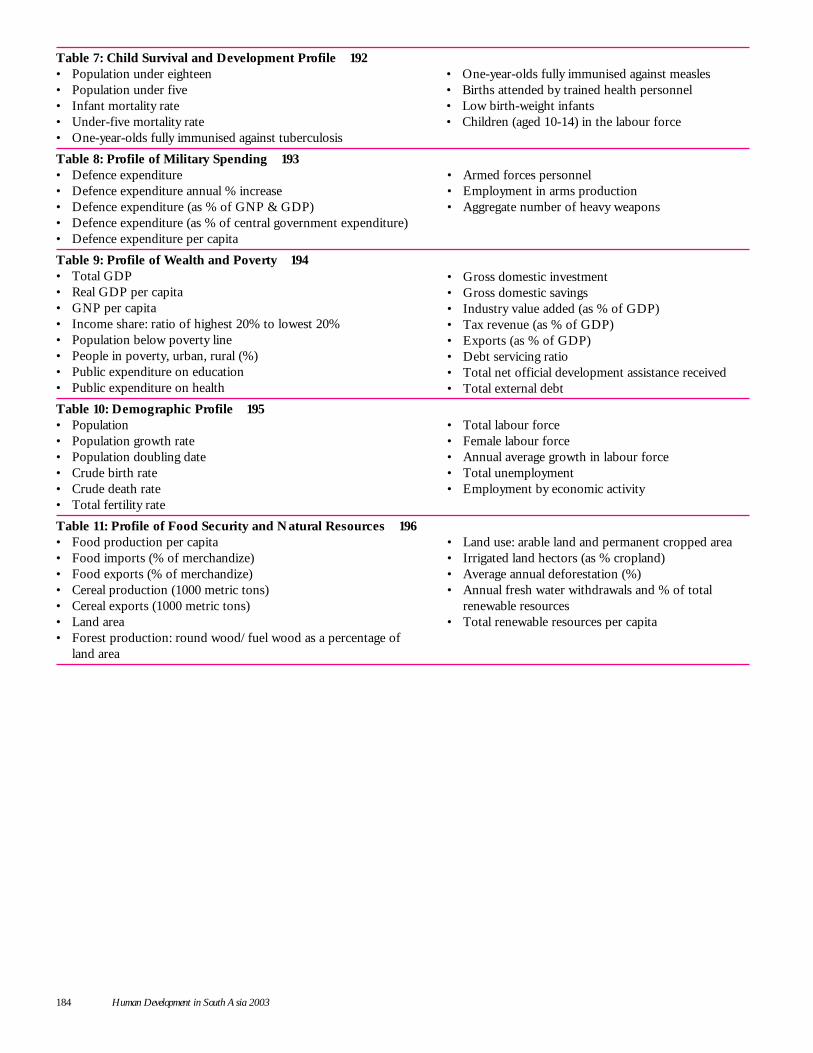
184 Human Development in South Asia 2003
Table 7: Child Survival and Development Profile 192• Population under eighteen• Population under five• Infant mortality rate• Under-five mortality rate• One-year-olds fully immunised against tuberculosis
Table 8: Profile of Military Spending 193• Defence expenditure• Defence expenditure annual % increase• Defence expenditure (as % of GNP & GDP)• Defence expenditure (as % of central government expenditure)• Defence expenditure per capita
Table 9: Profile of Wealth and Poverty 194• Total GDP• Real GDP per capita• GNP per capita• Income share: ratio of highest 20% to lowest 20%• Population below poverty line• People in poverty, urban, rural (%)• Public expenditure on education• Public expenditure on health
Table 10: Demographic Profile 195• Population• Population growth rate• Population doubling date• Crude birth rate• Crude death rate• Total fertility rate
Table 11: Profile of Food Security and Natural Resources 196• Food production per capita• Food imports (% of merchandize)• Food exports (% of merchandize)• Cereal production (1000 metric tons)• Cereal exports (1000 metric tons)• Land area• Forest production: round wood/fuel wood as a percentage of
land area
• Armed forces personnel• Employment in arms production• Aggregate number of heavy weapons
• Gross domestic investment• Gross domestic savings• Industry value added (as % of GDP)• Tax revenue (as % of GDP)• Exports (as % of GDP)• Debt servicing ratio• Total net official development assistance received• Total external debt
• One-year-olds fully immunised against measles• Births attended by trained health personnel• Low birth-weight infants• Children (aged 10-14) in the labour force
• Total labour force• Female labour force• Annual average growth in labour force• Total unemployment• Employment by economic activity
• Land use: arable land and permanent cropped area• Irrigated land hectors (as % cropland)• Average annual deforestation (%)• Annual fresh water withdrawals and % of total
renewable resources• Total renewable resources per capita
Human Development Indicators for South Asia 185
Note on Statistical Sources for HumanDevelopment Indicators
The human development data presentedin these annex tables have been collectedwith considerable effort from variousinternational and national sources. For themost part, standardized internationalsources have been used, particularly theUN system and the World Bank databank. The UNDP and World Bankoffices made their resources available tous for this Report.
Countries in the indicator tables arearranged in descending order accordingto population size. While most data havebeen taken from international sources,national sources have been used whereinternational data have been sparse. Suchdata have to be used with some cautionas their international comparability is stillto be tested.
Several limitations remain regardingcoverage, consistency, and comparabilityof data across time and countries. Thedata series presented here will be refinedover time, as more accurate andcomparable data become available. Inparticular, policy-makers are invited tonote the following deficiencies in thecurrently available statistical series and toinvest sufficient resources to remedythese shortfalls:
(a) Generally the latest data are notavailable for several indicators. Somestatistical indicators date back ten
years or more. Analysis of the currenteconomic and social situation isgreatly handicapped in the absence ofup-to-date data.
(b) Time series are often missing foreven the most basic data aspopulation growth, adult literacy, orenrolment ratios. An effort must bemade to build consistent time seriesfor some of the important indicators.
(c) In certain critical areas, reliable dataare extremely scarce: for instance, foremployment, income distribution,public expenditure on social services,military debt, foreign assistance forhuman priority areas, etc.
(d) Information regarding the activitiesof NGOs in social sectors remainsfairly sparse.
It is time for policy-makers to make asignificant investment in the collectionand analysis of up-to-date, reliable, andconsistent indicators for social and humandevelopment. If development is to betargeted at the people, a great deal ofeffort must be invested in determiningthe true condition of these people.
It is hoped that the various gaps visiblein this annex will persuade national andinternational agencies to invest moreresources and energy in investigatinghuman development profiles.
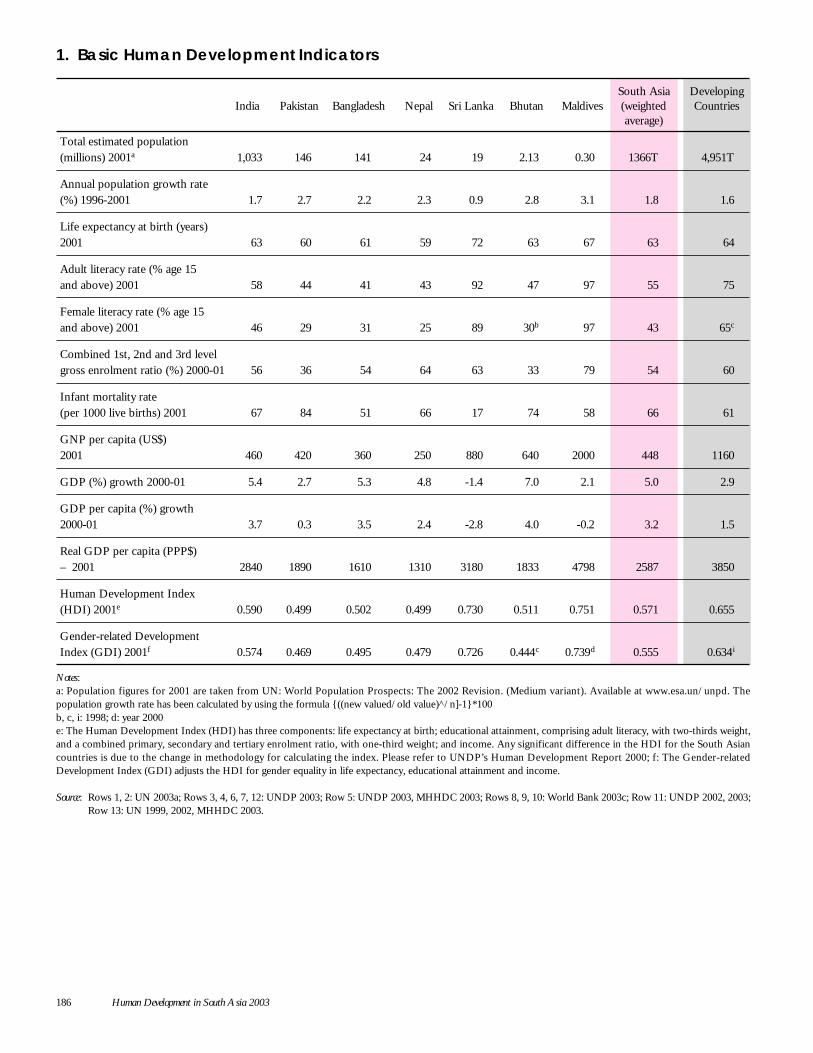
186 Human Development in South Asia 2003
1. Basic Human Development Indicators
South Asia DevelopingIndia Pakistan Bangladesh Nepal Sri Lanka Bhutan Maldives (weighted Countries
average)
Total estimated population(millions) 2001a 1,033 146 141 24 19 2.13 0.30 1366T 4,951T
Annual population growth rate(%) 1996-2001 1.7 2.7 2.2 2.3 0.9 2.8 3.1 1.8 1.6
Life expectancy at birth (years)2001 63 60 61 59 72 63 67 63 64
Adult literacy rate (% age 15and above) 2001 58 44 41 43 92 47 97 55 75
Female literacy rate (% age 15and above) 2001 46 29 31 25 89 30b 97 43 65c
Combined 1st, 2nd and 3rd levelgross enrolment ratio (%) 2000-01 56 36 54 64 63 33 79 54 60
Infant mortality rate(per 1000 live births) 2001 67 84 51 66 17 74 58 66 61
GNP per capita (US$)2001 460 420 360 250 880 640 2000 448 1160
GDP (%) growth 2000-01 5.4 2.7 5.3 4.8 -1.4 7.0 2.1 5.0 2.9
GDP per capita (%) growth2000-01 3.7 0.3 3.5 2.4 -2.8 4.0 -0.2 3.2 1.5
Real GDP per capita (PPP$)– 2001 2840 1890 1610 1310 3180 1833 4798 2587 3850
Human Development Index(HDI) 2001e 0.590 0.499 0.502 0.499 0.730 0.511 0.751 0.571 0.655
Gender-related DevelopmentIndex (GDI) 2001f 0.574 0.469 0.495 0.479 0.726 0.444c 0.739d 0.555 0.634i
Notes:a: Population figures for 2001 are taken from UN: World Population Prospects: The 2002 Revision. (Medium variant). Available at www.esa.un/unpd. Thepopulation growth rate has been calculated by using the formula {((new valued/old value)^/n]-1}*100b, c, i: 1998; d: year 2000e: The Human Development Index (HDI) has three components: life expectancy at birth; educational attainment, comprising adult literacy, with two-thirds weight,and a combined primary, secondary and tertiary enrolment ratio, with one-third weight; and income. Any significant difference in the HDI for the South Asiancountries is due to the change in methodology for calculating the index. Please refer to UNDP’s Human Development Report 2000; f: The Gender-relatedDevelopment Index (GDI) adjusts the HDI for gender equality in life expectancy, educational attainment and income.
Source: Rows 1, 2: UN 2003a; Rows 3, 4, 6, 7, 12: UNDP 2003; Row 5: UNDP 2003, MHHDC 2003; Rows 8, 9, 10: World Bank 2003c; Row 11: UNDP 2002, 2003;Row 13: UN 1999, 2002, MHHDC 2003.
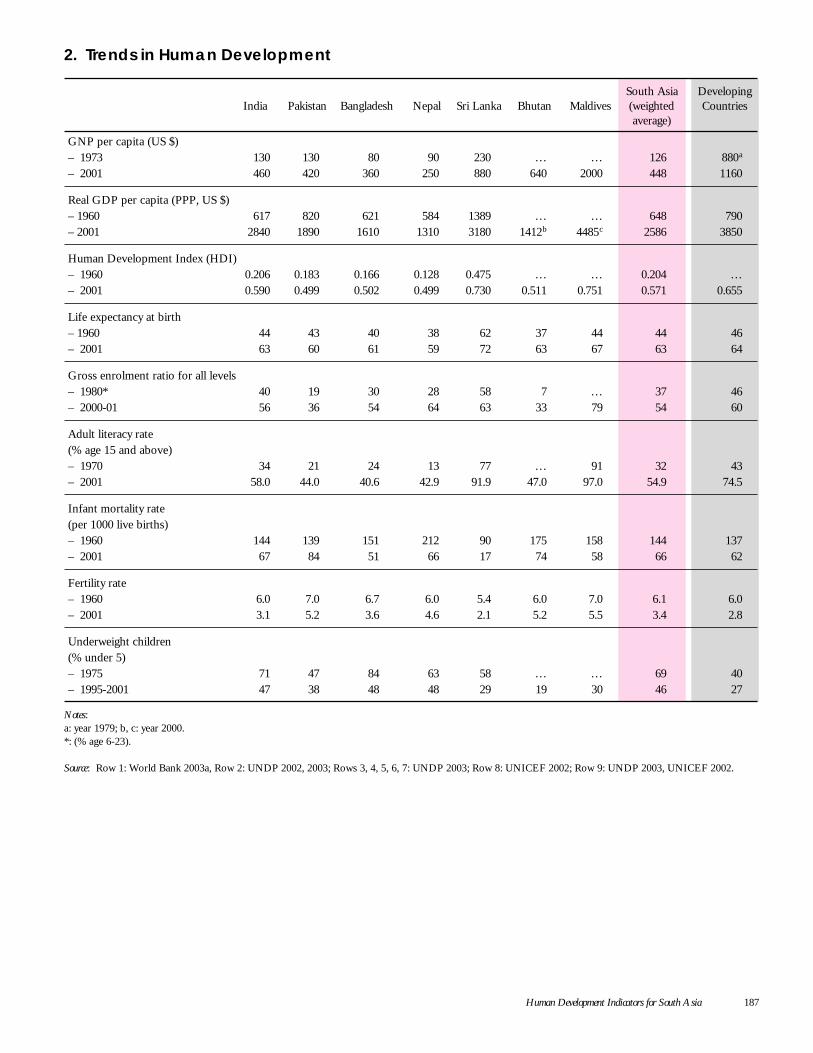
Human Development Indicators for South Asia 187
2. Trends in Human Development
South Asia DevelopingIndia Pakistan Bangladesh Nepal Sri Lanka Bhutan Maldives (weighted Countries
average)
GNP per capita (US $)– 1973 130 130 80 90 230 … … 126 880a
– 2001 460 420 360 250 880 640 2000 448 1160
Real GDP per capita (PPP, US $)– 1960 617 820 621 584 1389 … … 648 790– 2001 2840 1890 1610 1310 3180 1412b 4485c 2586 3850
Human Development Index (HDI)– 1960 0.206 0.183 0.166 0.128 0.475 … … 0.204 …– 2001 0.590 0.499 0.502 0.499 0.730 0.511 0.751 0.571 0.655
Life expectancy at birth– 1960 44 43 40 38 62 37 44 44 46– 2001 63 60 61 59 72 63 67 63 64
Gross enrolment ratio for all levels– 1980* 40 19 30 28 58 7 … 37 46– 2000-01 56 36 54 64 63 33 79 54 60
Adult literacy rate(% age 15 and above)– 1970 34 21 24 13 77 … 91 32 43– 2001 58.0 44.0 40.6 42.9 91.9 47.0 97.0 54.9 74.5
Infant mortality rate(per 1000 live births)– 1960 144 139 151 212 90 175 158 144 137– 2001 67 84 51 66 17 74 58 66 62
Fertility rate– 1960 6.0 7.0 6.7 6.0 5.4 6.0 7.0 6.1 6.0– 2001 3.1 5.2 3.6 4.6 2.1 5.2 5.5 3.4 2.8
Underweight children(% under 5)– 1975 71 47 84 63 58 … … 69 40– 1995-2001 47 38 48 48 29 19 30 46 27
Notes:a: year 1979; b, c: year 2000.*: (% age 6-23).
Source: Row 1: World Bank 2003a, Row 2: UNDP 2002, 2003; Rows 3, 4, 5, 6, 7: UNDP 2003; Row 8: UNICEF 2002; Row 9: UNDP 2003, UNICEF 2002.
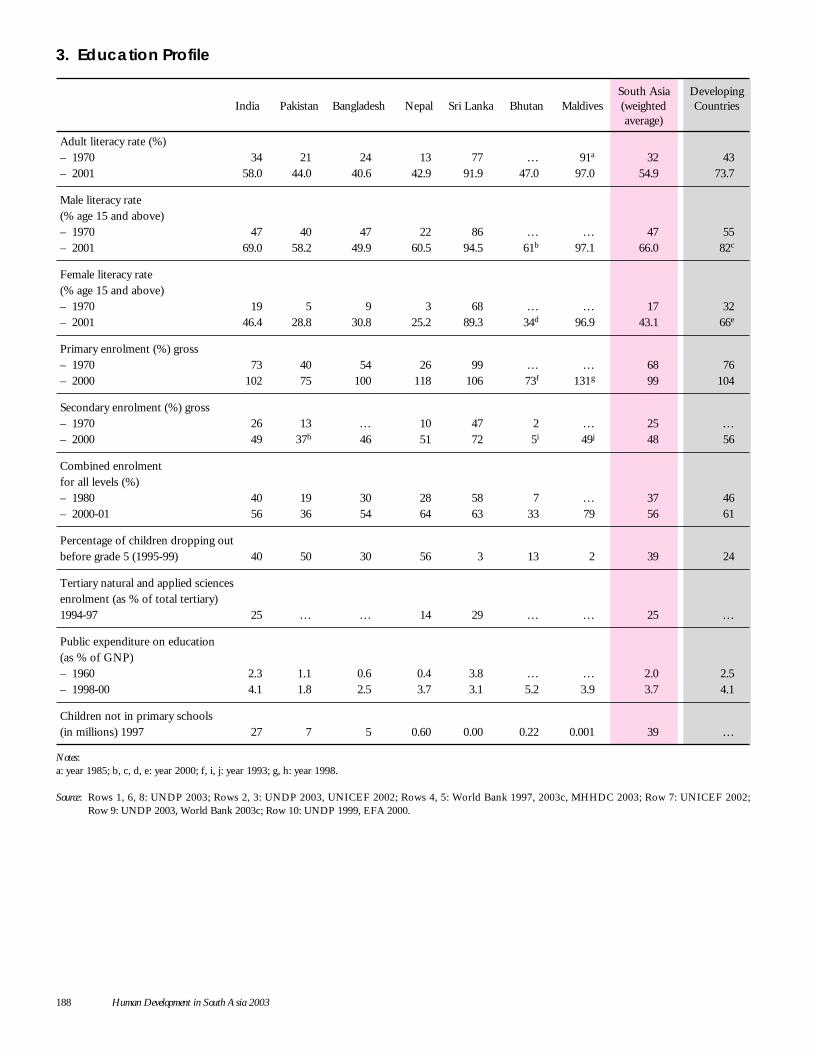
188 Human Development in South Asia 2003
3. Education Profile
South Asia DevelopingIndia Pakistan Bangladesh Nepal Sri Lanka Bhutan Maldives (weighted Countries
average)
Adult literacy rate (%)– 1970 34 21 24 13 77 … 91a 32 43– 2001 58.0 44.0 40.6 42.9 91.9 47.0 97.0 54.9 73.7
Male literacy rate(% age 15 and above)– 1970 47 40 47 22 86 … … 47 55– 2001 69.0 58.2 49.9 60.5 94.5 61b 97.1 66.0 82c
Female literacy rate(% age 15 and above)– 1970 19 5 9 3 68 … … 17 32– 2001 46.4 28.8 30.8 25.2 89.3 34d 96.9 43.1 66e
Primary enrolment (%) gross– 1970 73 40 54 26 99 … … 68 76– 2000 102 75 100 118 106 73f 131g 99 104
Secondary enrolment (%) gross– 1970 26 13 … 10 47 2 … 25 …– 2000 49 37h 46 51 72 5i 49j 48 56
Combined enrolmentfor all levels (%)– 1980 40 19 30 28 58 7 … 37 46– 2000-01 56 36 54 64 63 33 79 56 61
Percentage of children dropping outbefore grade 5 (1995-99) 40 50 30 56 3 13 2 39 24
Tertiary natural and applied sciencesenrolment (as % of total tertiary)1994-97 25 … … 14 29 … … 25 …
Public expenditure on education(as % of GNP)– 1960 2.3 1.1 0.6 0.4 3.8 … … 2.0 2.5– 1998-00 4.1 1.8 2.5 3.7 3.1 5.2 3.9 3.7 4.1
Children not in primary schools(in millions) 1997 27 7 5 0.60 0.00 0.22 0.001 39 …
Notes:a: year 1985; b, c, d, e: year 2000; f, i, j: year 1993; g, h: year 1998.
Source: Rows 1, 6, 8: UNDP 2003; Rows 2, 3: UNDP 2003, UNICEF 2002; Rows 4, 5: World Bank 1997, 2003c, MHHDC 2003; Row 7: UNICEF 2002;Row 9: UNDP 2003, World Bank 2003c; Row 10: UNDP 1999, EFA 2000.
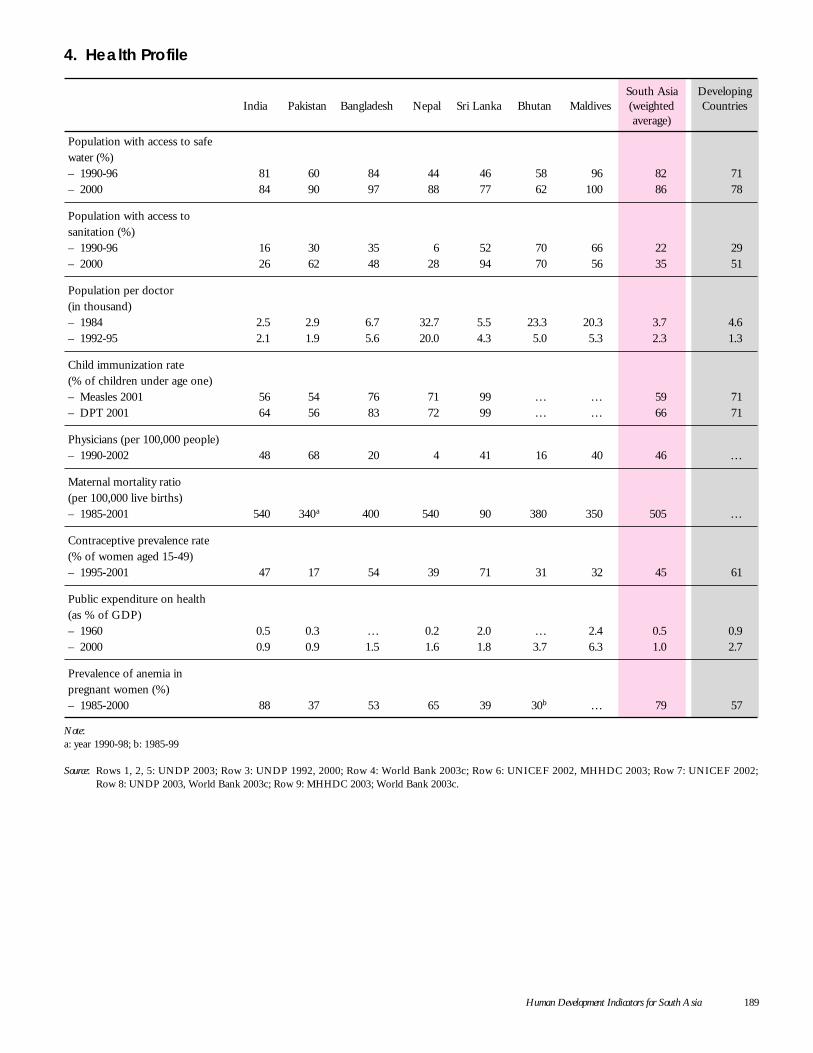
Human Development Indicators for South Asia 189
4. Health Profile
South Asia DevelopingIndia Pakistan Bangladesh Nepal Sri Lanka Bhutan Maldives (weighted Countries
average)
Population with access to safewater (%)– 1990-96 81 60 84 44 46 58 96 82 71– 2000 84 90 97 88 77 62 100 86 78
Population with access tosanitation (%)– 1990-96 16 30 35 6 52 70 66 22 29– 2000 26 62 48 28 94 70 56 35 51
Population per doctor(in thousand)– 1984 2.5 2.9 6.7 32.7 5.5 23.3 20.3 3.7 4.6– 1992-95 2.1 1.9 5.6 20.0 4.3 5.0 5.3 2.3 1.3
Child immunization rate(% of children under age one)– Measles 2001 56 54 76 71 99 … … 59 71– DPT 2001 64 56 83 72 99 … … 66 71
Physicians (per 100,000 people)– 1990-2002 48 68 20 4 41 16 40 46 …
Maternal mortality ratio(per 100,000 live births)– 1985-2001 540 340a 400 540 90 380 350 505 …
Contraceptive prevalence rate(% of women aged 15-49)– 1995-2001 47 17 54 39 71 31 32 45 61
Public expenditure on health(as % of GDP)– 1960 0.5 0.3 … 0.2 2.0 … 2.4 0.5 0.9– 2000 0.9 0.9 1.5 1.6 1.8 3.7 6.3 1.0 2.7
Prevalence of anemia inpregnant women (%)– 1985-2000 88 37 53 65 39 30b … 79 57
Note:a: year 1990-98; b: 1985-99
Source: Rows 1, 2, 5: UNDP 2003; Row 3: UNDP 1992, 2000; Row 4: World Bank 2003c; Row 6: UNICEF 2002, MHHDC 2003; Row 7: UNICEF 2002;Row 8: UNDP 2003, World Bank 2003c; Row 9: MHHDC 2003; World Bank 2003c.
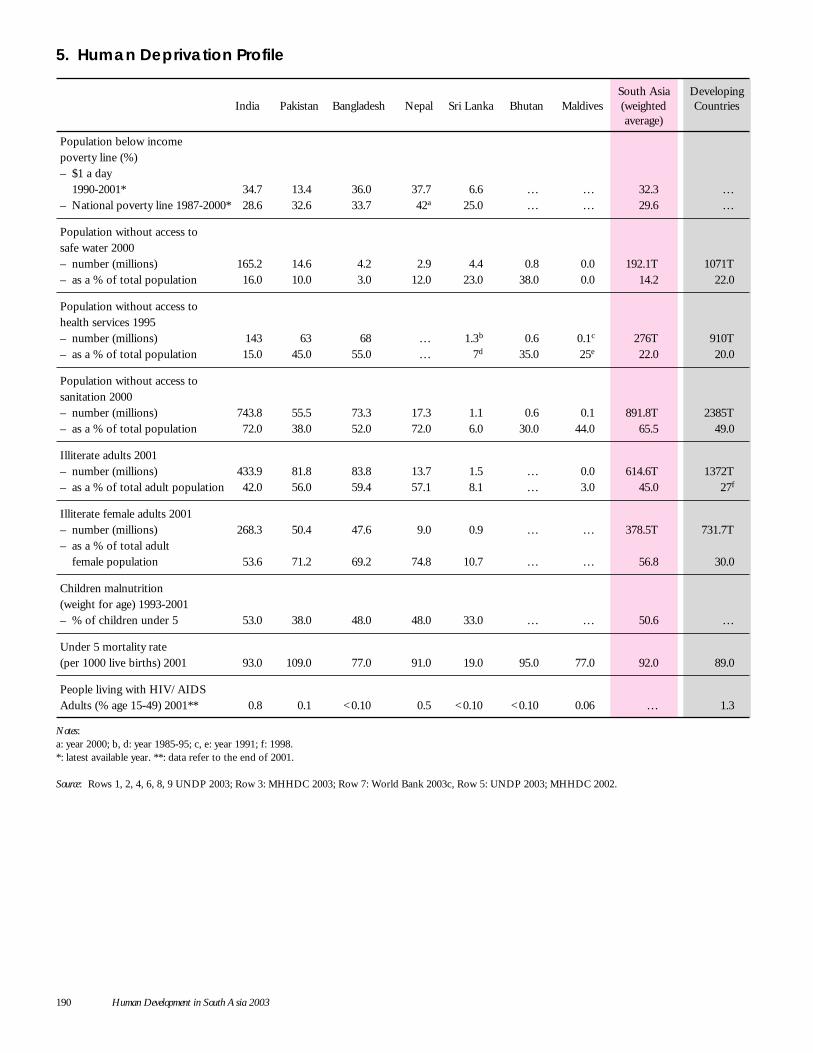
190 Human Development in South Asia 2003
5. Human Deprivation Profile
South Asia DevelopingIndia Pakistan Bangladesh Nepal Sri Lanka Bhutan Maldives (weighted Countries
average)
Population below incomepoverty line (%)– $1 a day
1990-2001* 34.7 13.4 36.0 37.7 6.6 … … 32.3 …– National poverty line 1987-2000* 28.6 32.6 33.7 42a 25.0 … … 29.6 …
Population without access tosafe water 2000– number (millions) 165.2 14.6 4.2 2.9 4.4 0.8 0.0 192.1T 1071T– as a % of total population 16.0 10.0 3.0 12.0 23.0 38.0 0.0 14.2 22.0
Population without access tohealth services 1995– number (millions) 143 63 68 … 1.3b 0.6 0.1c 276T 910T– as a % of total population 15.0 45.0 55.0 … 7d 35.0 25e 22.0 20.0
Population without access tosanitation 2000– number (millions) 743.8 55.5 73.3 17.3 1.1 0.6 0.1 891.8T 2385T– as a % of total population 72.0 38.0 52.0 72.0 6.0 30.0 44.0 65.5 49.0
Illiterate adults 2001– number (millions) 433.9 81.8 83.8 13.7 1.5 … 0.0 614.6T 1372T– as a % of total adult population 42.0 56.0 59.4 57.1 8.1 … 3.0 45.0 27f
Illiterate female adults 2001– number (millions) 268.3 50.4 47.6 9.0 0.9 … … 378.5T 731.7T– as a % of total adult
female population 53.6 71.2 69.2 74.8 10.7 … … 56.8 30.0
Children malnutrition(weight for age) 1993-2001– % of children under 5 53.0 38.0 48.0 48.0 33.0 … … 50.6 …
Under 5 mortality rate(per 1000 live births) 2001 93.0 109.0 77.0 91.0 19.0 95.0 77.0 92.0 89.0
People living with HIV/AIDSAdults (% age 15-49) 2001** 0.8 0.1 <0.10 0.5 <0.10 <0.10 0.06 … 1.3
Notes:a: year 2000; b, d: year 1985-95; c, e: year 1991; f: 1998.*: latest available year. **: data refer to the end of 2001.
Source: Rows 1, 2, 4, 6, 8, 9 UNDP 2003; Row 3: MHHDC 2003; Row 7: World Bank 2003c, Row 5: UNDP 2003; MHHDC 2002.
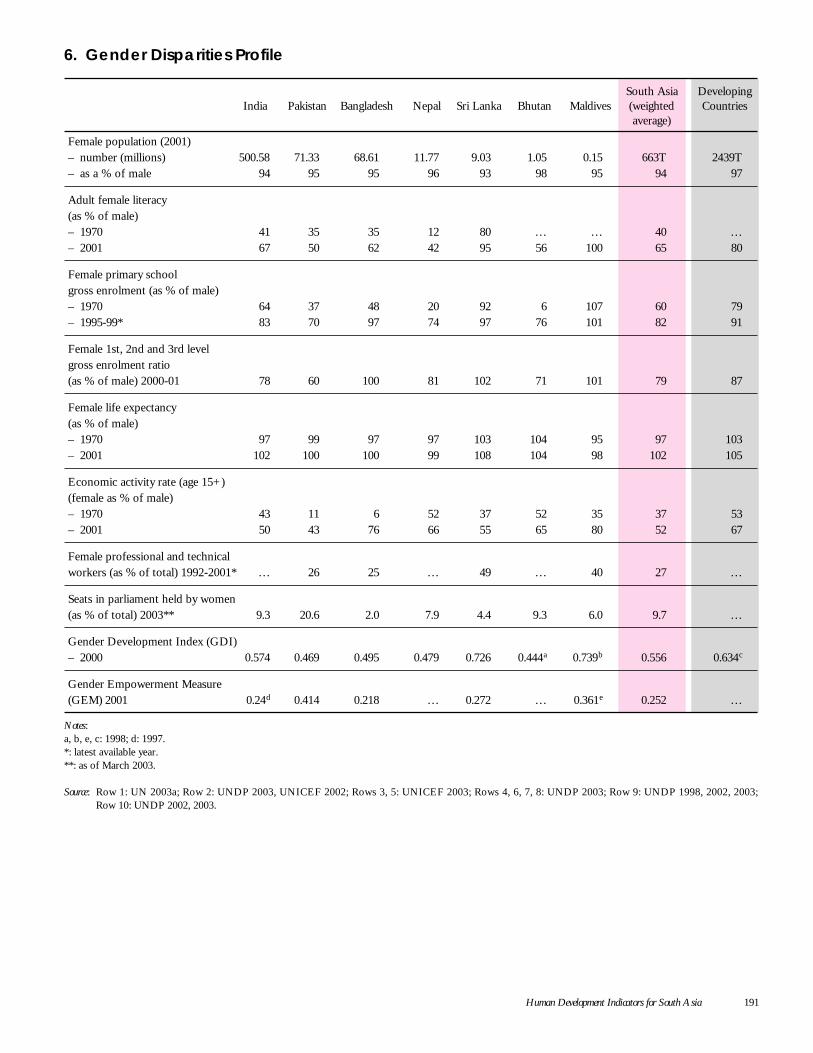
Human Development Indicators for South Asia 191
6. Gender Disparities Profile
South Asia DevelopingIndia Pakistan Bangladesh Nepal Sri Lanka Bhutan Maldives (weighted Countries
average)
Female population (2001)– number (millions) 500.58 71.33 68.61 11.77 9.03 1.05 0.15 663T 2439T– as a % of male 94 95 95 96 93 98 95 94 97
Adult female literacy(as % of male)– 1970 41 35 35 12 80 … … 40 …– 2001 67 50 62 42 95 56 100 65 80
Female primary schoolgross enrolment (as % of male)– 1970 64 37 48 20 92 6 107 60 79– 1995-99* 83 70 97 74 97 76 101 82 91
Female 1st, 2nd and 3rd levelgross enrolment ratio(as % of male) 2000-01 78 60 100 81 102 71 101 79 87
Female life expectancy(as % of male)– 1970 97 99 97 97 103 104 95 97 103– 2001 102 100 100 99 108 104 98 102 105
Economic activity rate (age 15+)(female as % of male)– 1970 43 11 6 52 37 52 35 37 53– 2001 50 43 76 66 55 65 80 52 67
Female professional and technicalworkers (as % of total) 1992-2001* … 26 25 … 49 … 40 27 …
Seats in parliament held by women(as % of total) 2003** 9.3 20.6 2.0 7.9 4.4 9.3 6.0 9.7 …
Gender Development Index (GDI)– 2000 0.574 0.469 0.495 0.479 0.726 0.444a 0.739b 0.556 0.634c
Gender Empowerment Measure(GEM) 2001 0.24d 0.414 0.218 … 0.272 … 0.361e 0.252 …
Notes:a, b, e, c: 1998; d: 1997.*: latest available year.**: as of March 2003.
Source: Row 1: UN 2003a; Row 2: UNDP 2003, UNICEF 2002; Rows 3, 5: UNICEF 2003; Rows 4, 6, 7, 8: UNDP 2003; Row 9: UNDP 1998, 2002, 2003;Row 10: UNDP 2002, 2003.
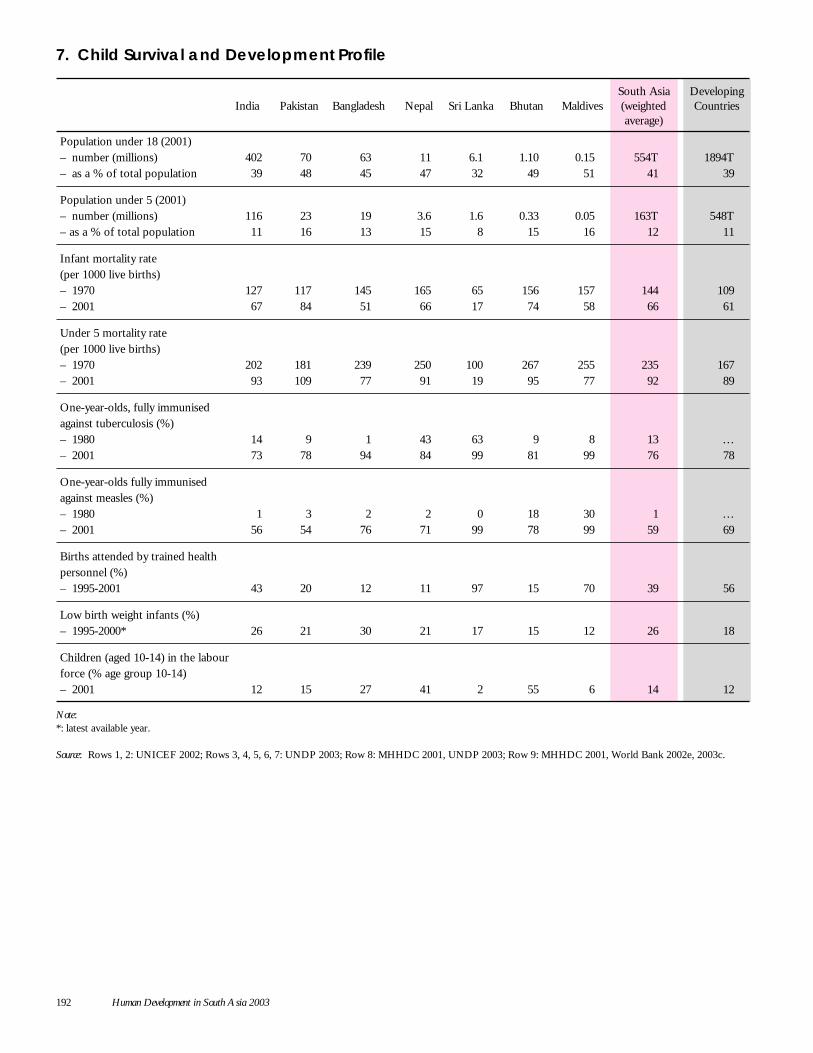
192 Human Development in South Asia 2003
7. Child Survival and Development Profile
South Asia DevelopingIndia Pakistan Bangladesh Nepal Sri Lanka Bhutan Maldives (weighted Countries
average)
Population under 18 (2001)– number (millions) 402 70 63 11 6.1 1.10 0.15 554T 1894T– as a % of total population 39 48 45 47 32 49 51 41 39
Population under 5 (2001)– number (millions) 116 23 19 3.6 1.6 0.33 0.05 163T 548T– as a % of total population 11 16 13 15 8 15 16 12 11
Infant mortality rate(per 1000 live births)– 1970 127 117 145 165 65 156 157 144 109– 2001 67 84 51 66 17 74 58 66 61
Under 5 mortality rate(per 1000 live births)– 1970 202 181 239 250 100 267 255 235 167– 2001 93 109 77 91 19 95 77 92 89
One-year-olds, fully immunisedagainst tuberculosis (%)– 1980 14 9 1 43 63 9 8 13 …– 2001 73 78 94 84 99 81 99 76 78
One-year-olds fully immunisedagainst measles (%)– 1980 1 3 2 2 0 18 30 1 …– 2001 56 54 76 71 99 78 99 59 69
Births attended by trained healthpersonnel (%)– 1995-2001 43 20 12 11 97 15 70 39 56
Low birth weight infants (%)– 1995-2000* 26 21 30 21 17 15 12 26 18
Children (aged 10-14) in the labourforce (% age group 10-14)– 2001 12 15 27 41 2 55 6 14 12
Note:*: latest available year.
Source: Rows 1, 2: UNICEF 2002; Rows 3, 4, 5, 6, 7: UNDP 2003; Row 8: MHHDC 2001, UNDP 2003; Row 9: MHHDC 2001, World Bank 2002e, 2003c.
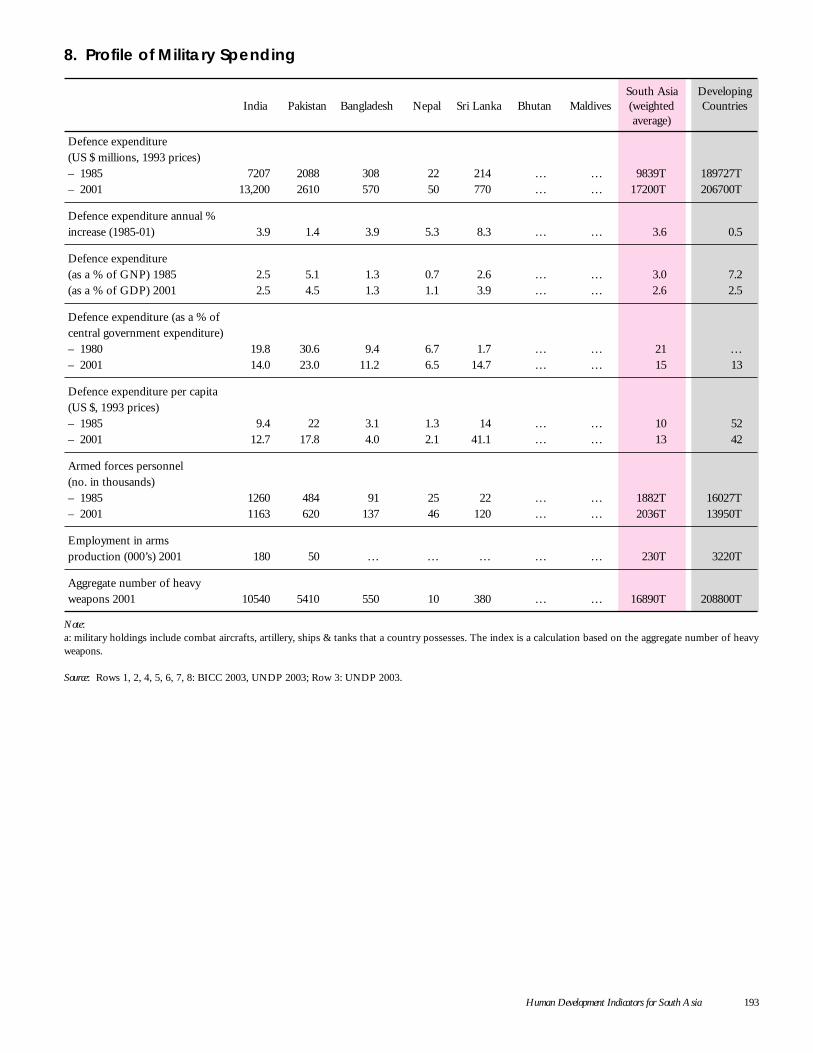
Human Development Indicators for South Asia 193
8. Profile of Military Spending
South Asia DevelopingIndia Pakistan Bangladesh Nepal Sri Lanka Bhutan Maldives (weighted Countries
average)
Defence expenditure(US $ millions, 1993 prices)– 1985 7207 2088 308 22 214 … … 9839T 189727T– 2001 13,200 2610 570 50 770 … … 17200T 206700T
Defence expenditure annual %increase (1985-01) 3.9 1.4 3.9 5.3 8.3 … … 3.6 0.5
Defence expenditure(as a % of GNP) 1985 2.5 5.1 1.3 0.7 2.6 … … 3.0 7.2(as a % of GDP) 2001 2.5 4.5 1.3 1.1 3.9 … … 2.6 2.5
Defence expenditure (as a % ofcentral government expenditure)– 1980 19.8 30.6 9.4 6.7 1.7 … … 21 …– 2001 14.0 23.0 11.2 6.5 14.7 … … 15 13
Defence expenditure per capita(US $, 1993 prices)– 1985 9.4 22 3.1 1.3 14 … … 10 52– 2001 12.7 17.8 4.0 2.1 41.1 … … 13 42
Armed forces personnel(no. in thousands)– 1985 1260 484 91 25 22 … … 1882T 16027T– 2001 1163 620 137 46 120 … … 2036T 13950T
Employment in armsproduction (000’s) 2001 180 50 … … … … … 230T 3220T
Aggregate number of heavyweapons 2001 10540 5410 550 10 380 … … 16890T 208800T
Note:a: military holdings include combat aircrafts, artillery, ships & tanks that a country possesses. The index is a calculation based on the aggregate number of heavyweapons.
Source: Rows 1, 2, 4, 5, 6, 7, 8: BICC 2003, UNDP 2003; Row 3: UNDP 2003.
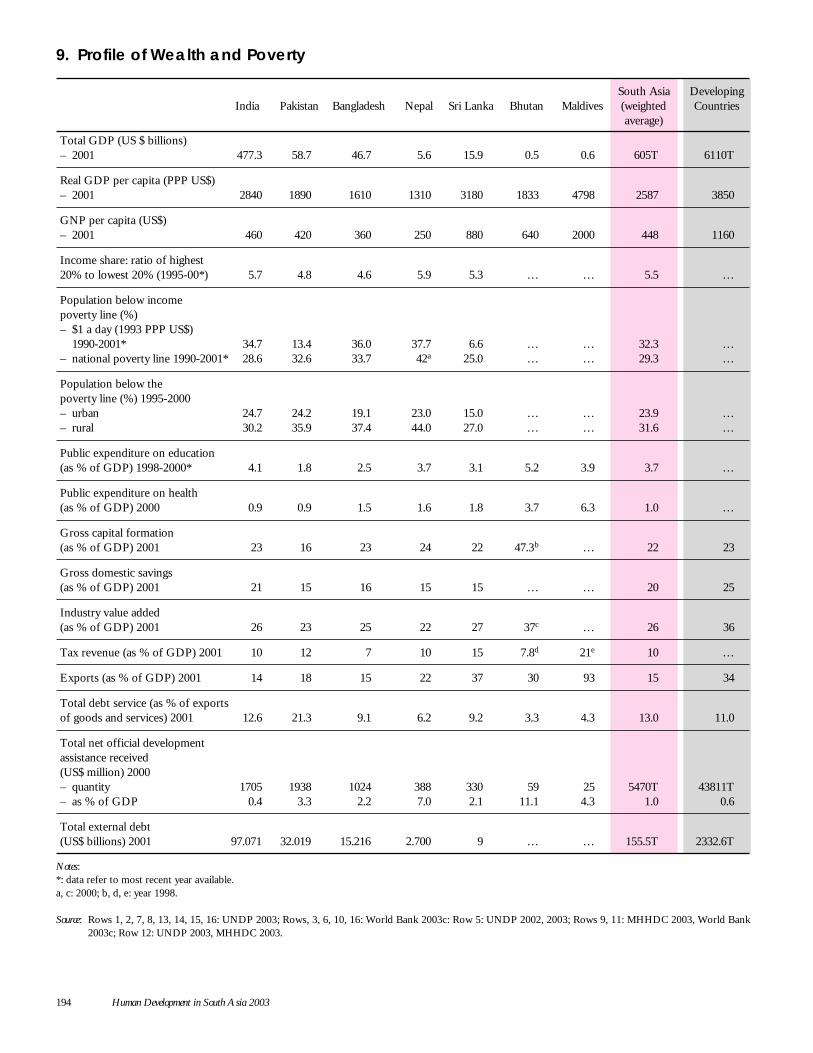
194 Human Development in South Asia 2003
9. Profile of Wealth and Poverty
South Asia DevelopingIndia Pakistan Bangladesh Nepal Sri Lanka Bhutan Maldives (weighted Countries
average)
Total GDP (US $ billions)– 2001 477.3 58.7 46.7 5.6 15.9 0.5 0.6 605T 6110T
Real GDP per capita (PPP US$)– 2001 2840 1890 1610 1310 3180 1833 4798 2587 3850
GNP per capita (US$)– 2001 460 420 360 250 880 640 2000 448 1160
Income share: ratio of highest20% to lowest 20% (1995-00*) 5.7 4.8 4.6 5.9 5.3 … … 5.5 …
Population below incomepoverty line (%)– $1 a day (1993 PPP US$)
1990-2001* 34.7 13.4 36.0 37.7 6.6 … … 32.3 …– national poverty line 1990-2001* 28.6 32.6 33.7 42a 25.0 … … 29.3 …
Population below thepoverty line (%) 1995-2000– urban 24.7 24.2 19.1 23.0 15.0 … … 23.9 …– rural 30.2 35.9 37.4 44.0 27.0 … … 31.6 …
Public expenditure on education(as % of GDP) 1998-2000* 4.1 1.8 2.5 3.7 3.1 5.2 3.9 3.7 …
Public expenditure on health(as % of GDP) 2000 0.9 0.9 1.5 1.6 1.8 3.7 6.3 1.0 …
Gross capital formation(as % of GDP) 2001 23 16 23 24 22 47.3b … 22 23
Gross domestic savings(as % of GDP) 2001 21 15 16 15 15 … … 20 25
Industry value added(as % of GDP) 2001 26 23 25 22 27 37c … 26 36
Tax revenue (as % of GDP) 2001 10 12 7 10 15 7.8d 21e 10 …
Exports (as % of GDP) 2001 14 18 15 22 37 30 93 15 34
Total debt service (as % of exportsof goods and services) 2001 12.6 21.3 9.1 6.2 9.2 3.3 4.3 13.0 11.0
Total net official developmentassistance received(US$ million) 2000– quantity 1705 1938 1024 388 330 59 25 5470T 43811T– as % of GDP 0.4 3.3 2.2 7.0 2.1 11.1 4.3 1.0 0.6
Total external debt(US$ billions) 2001 97.071 32.019 15.216 2.700 9 … … 155.5T 2332.6T
Notes:*: data refer to most recent year available.a, c: 2000; b, d, e: year 1998.
Source: Rows 1, 2, 7, 8, 13, 14, 15, 16: UNDP 2003; Rows, 3, 6, 10, 16: World Bank 2003c: Row 5: UNDP 2002, 2003; Rows 9, 11: MHHDC 2003, World Bank2003c; Row 12: UNDP 2003, MHHDC 2003.
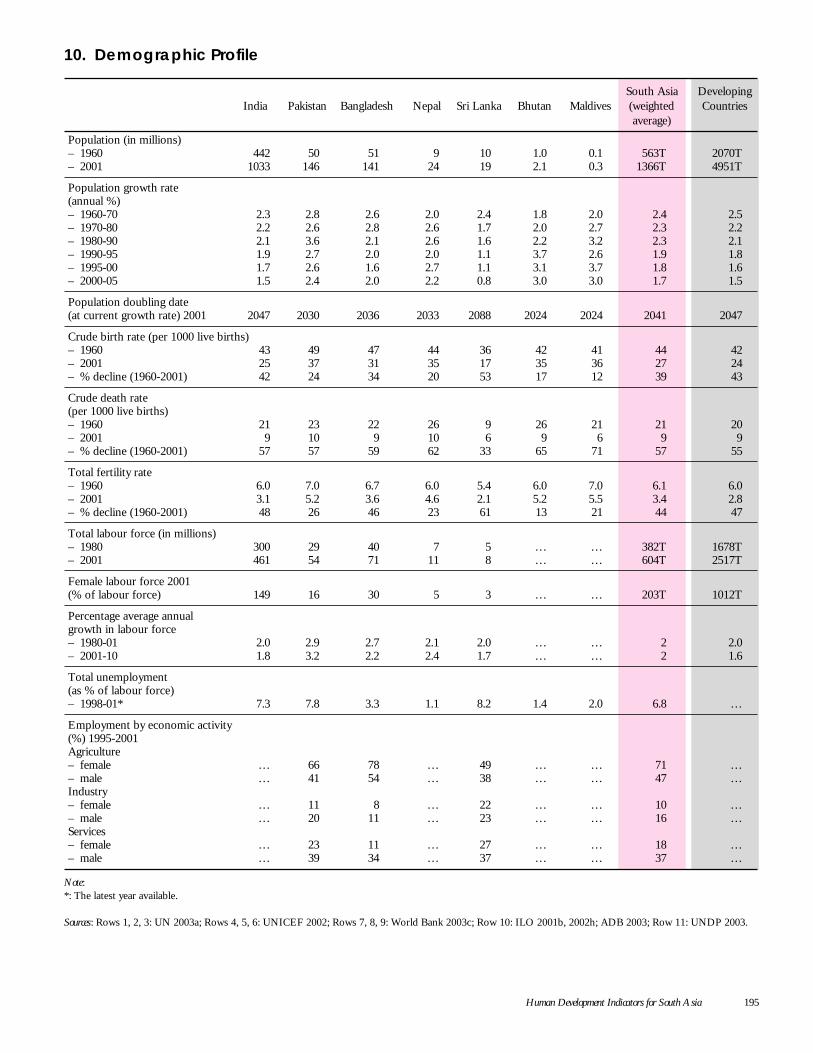
Human Development Indicators for South Asia 195
10. Demographic Profile
South Asia DevelopingIndia Pakistan Bangladesh Nepal Sri Lanka Bhutan Maldives (weighted Countries
average)
Population (in millions)– 1960 442 50 51 9 10 1.0 0.1 563T 2070T– 2001 1033 146 141 24 19 2.1 0.3 1366T 4951T
Population growth rate(annual %)– 1960-70 2.3 2.8 2.6 2.0 2.4 1.8 2.0 2.4 2.5– 1970-80 2.2 2.6 2.8 2.6 1.7 2.0 2.7 2.3 2.2– 1980-90 2.1 3.6 2.1 2.6 1.6 2.2 3.2 2.3 2.1– 1990-95 1.9 2.7 2.0 2.0 1.1 3.7 2.6 1.9 1.8– 1995-00 1.7 2.6 1.6 2.7 1.1 3.1 3.7 1.8 1.6– 2000-05 1.5 2.4 2.0 2.2 0.8 3.0 3.0 1.7 1.5
Population doubling date(at current growth rate) 2001 2047 2030 2036 2033 2088 2024 2024 2041 2047
Crude birth rate (per 1000 live births)– 1960 43 49 47 44 36 42 41 44 42– 2001 25 37 31 35 17 35 36 27 24– % decline (1960-2001) 42 24 34 20 53 17 12 39 43
Crude death rate(per 1000 live births)– 1960 21 23 22 26 9 26 21 21 20– 2001 9 10 9 10 6 9 6 9 9– % decline (1960-2001) 57 57 59 62 33 65 71 57 55
Total fertility rate– 1960 6.0 7.0 6.7 6.0 5.4 6.0 7.0 6.1 6.0– 2001 3.1 5.2 3.6 4.6 2.1 5.2 5.5 3.4 2.8– % decline (1960-2001) 48 26 46 23 61 13 21 44 47
Total labour force (in millions)– 1980 300 29 40 7 5 … … 382T 1678T– 2001 461 54 71 11 8 … … 604T 2517T
Female labour force 2001(% of labour force) 149 16 30 5 3 … … 203T 1012T
Percentage average annualgrowth in labour force– 1980-01 2.0 2.9 2.7 2.1 2.0 … … 2 2.0– 2001-10 1.8 3.2 2.2 2.4 1.7 … … 2 1.6
Total unemployment(as % of labour force)– 1998-01* 7.3 7.8 3.3 1.1 8.2 1.4 2.0 6.8 …
Employment by economic activity(%) 1995-2001Agriculture– female … 66 78 … 49 … … 71 …– male … 41 54 … 38 … … 47 …Industry– female … 11 8 … 22 … … 10 …– male … 20 11 … 23 … … 16 …Services– female … 23 11 … 27 … … 18 …– male … 39 34 … 37 … … 37 …
Note:*: The latest year available.
Sources: Rows 1, 2, 3: UN 2003a; Rows 4, 5, 6: UNICEF 2002; Rows 7, 8, 9: World Bank 2003c; Row 10: ILO 2001b, 2002h; ADB 2003; Row 11: UNDP 2003.
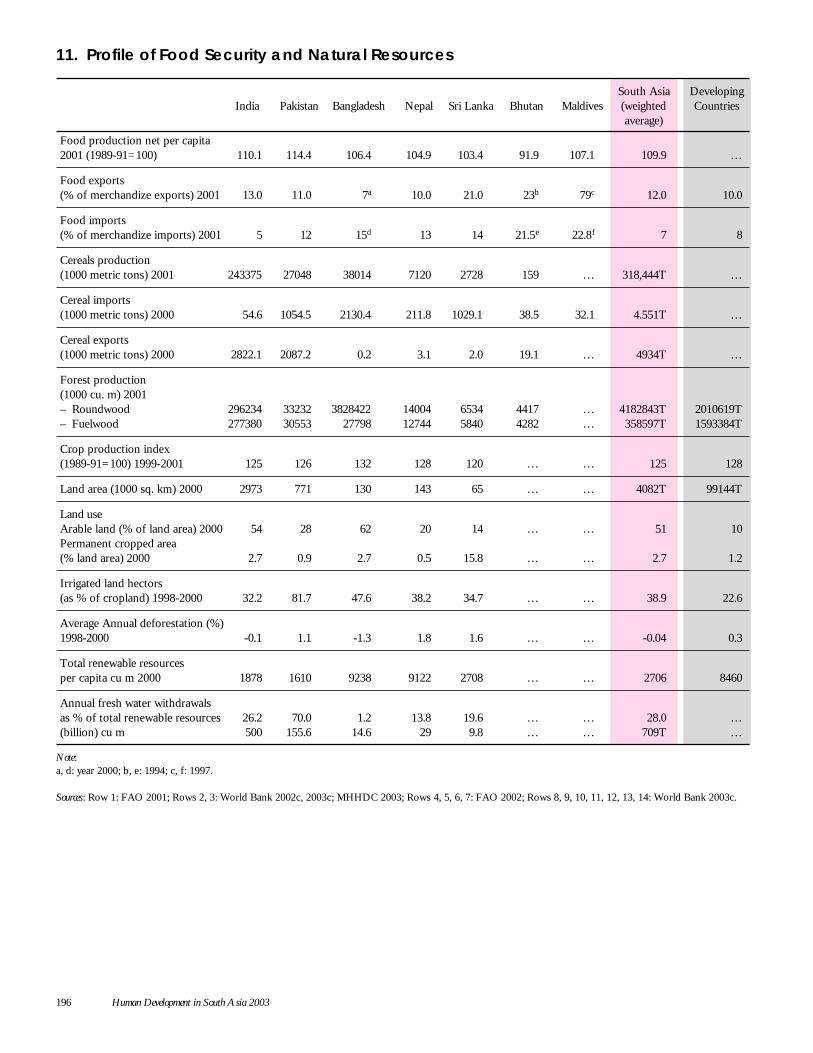
196 Human Development in South Asia 2003
11. Profile of Food Security and Natural Resources
South Asia DevelopingIndia Pakistan Bangladesh Nepal Sri Lanka Bhutan Maldives (weighted Countries
average)
Food production net per capita2001 (1989-91=100) 110.1 114.4 106.4 104.9 103.4 91.9 107.1 109.9 …
Food exports(% of merchandize exports) 2001 13.0 11.0 7a 10.0 21.0 23b 79c 12.0 10.0
Food imports(% of merchandize imports) 2001 5 12 15d 13 14 21.5e 22.8f 7 8
Cereals production(1000 metric tons) 2001 243375 27048 38014 7120 2728 159 … 318,444T …
Cereal imports(1000 metric tons) 2000 54.6 1054.5 2130.4 211.8 1029.1 38.5 32.1 4.551T …
Cereal exports(1000 metric tons) 2000 2822.1 2087.2 0.2 3.1 2.0 19.1 … 4934T …
Forest production(1000 cu. m) 2001– Roundwood 296234 33232 3828422 14004 6534 4417 … 4182843T 2010619T– Fuelwood 277380 30553 27798 12744 5840 4282 … 358597T 1593384T
Crop production index(1989-91=100) 1999-2001 125 126 132 128 120 … … 125 128
Land area (1000 sq. km) 2000 2973 771 130 143 65 … … 4082T 99144T
Land useArable land (% of land area) 2000 54 28 62 20 14 … … 51 10Permanent cropped area(% land area) 2000 2.7 0.9 2.7 0.5 15.8 … … 2.7 1.2
Irrigated land hectors(as % of cropland) 1998-2000 32.2 81.7 47.6 38.2 34.7 … … 38.9 22.6
Average Annual deforestation (%)1998-2000 -0.1 1.1 -1.3 1.8 1.6 … … -0.04 0.3
Total renewable resourcesper capita cu m 2000 1878 1610 9238 9122 2708 … … 2706 8460
Annual fresh water withdrawalsas % of total renewable resources 26.2 70.0 1.2 13.8 19.6 … … 28.0 …(billion) cu m 500 155.6 14.6 29 9.8 … … 709T …
Note:a, d: year 2000; b, e: 1994; c, f: 1997.
Sources: Row 1: FAO 2001; Rows 2, 3: World Bank 2002c, 2003c; MHHDC 2003; Rows 4, 5, 6, 7: FAO 2002; Rows 8, 9, 10, 11, 12, 13, 14: World Bank 2003c.
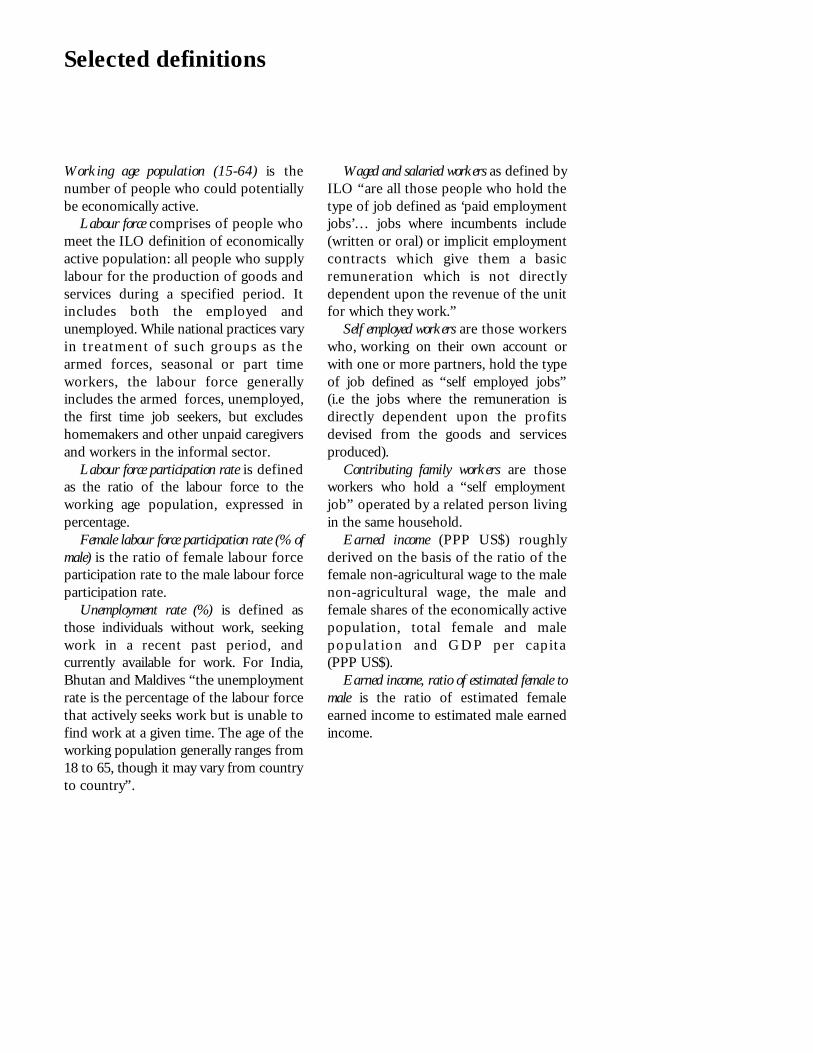
Key to Indicators 197
Working age population (15-64) is thenumber of people who could potentiallybe economically active.
Labour force comprises of people whomeet the ILO definition of economicallyactive population: all people who supplylabour for the production of goods andservices during a specified period. Itincludes both the employed andunemployed. While national practices varyin treatment of such groups as thearmed forces, seasonal or part timeworkers, the labour force generallyincludes the armed forces, unemployed,the first time job seekers, but excludeshomemakers and other unpaid caregiversand workers in the informal sector.
Labour force participation rate is definedas the ratio of the labour force to theworking age population, expressed inpercentage.
Female labour force participation rate (% ofmale) is the ratio of female labour forceparticipation rate to the male labour forceparticipation rate.
Unemployment rate (%) is defined asthose individuals without work, seekingwork in a recent past period, andcurrently available for work. For India,Bhutan and Maldives “the unemploymentrate is the percentage of the labour forcethat actively seeks work but is unable tofind work at a given time. The age of theworking population generally ranges from18 to 65, though it may vary from countryto country”.
Selected definitions
Waged and salaried workers as defined byILO “are all those people who hold thetype of job defined as ‘paid employmentjobs’… jobs where incumbents include(written or oral) or implicit employmentcontracts which give them a basicremuneration which is not directlydependent upon the revenue of the unitfor which they work.”
Self employed workers are those workerswho, working on their own account orwith one or more partners, hold the typeof job defined as “self employed jobs”(i.e the jobs where the remuneration isdirectly dependent upon the profitsdevised from the goods and servicesproduced).
Contributing family workers are thoseworkers who hold a “self employmentjob” operated by a related person livingin the same household.
Earned income (PPP US$) roughlyderived on the basis of the ratio of thefemale non-agricultural wage to the malenon-agricultural wage, the male andfemale shares of the economically activepopulation, total female and malepopulat ion and GDP per capita(PPP US$).
Earned income, ratio of estimated female tomale is the ratio of estimated femaleearned income to estimated male earnedincome.
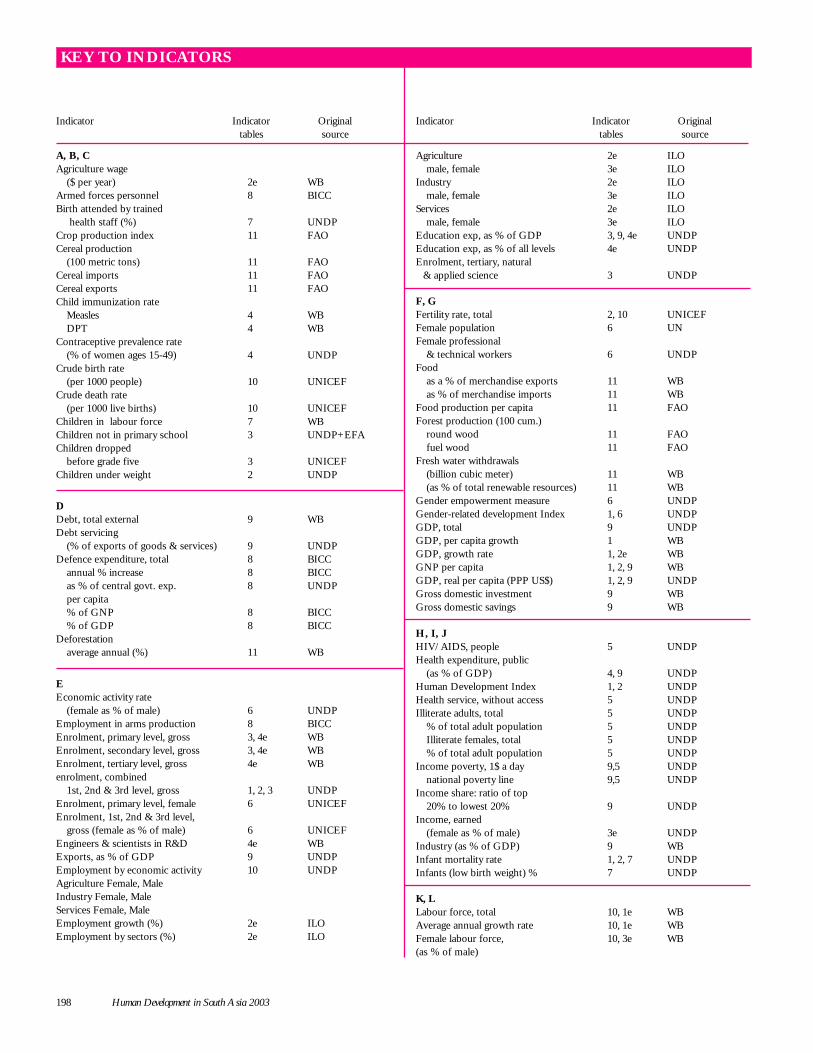
198 Human Development in South Asia 2003
A, B, CAgriculture wage
($ per year) 2e WBArmed forces personnel 8 BICCBirth attended by trained
health staff (%) 7 UNDPCrop production index 11 FAOCereal production
(100 metric tons) 11 FAOCereal imports 11 FAOCereal exports 11 FAOChild immunization rate
Measles 4 WBDPT 4 WB
Contraceptive prevalence rate(% of women ages 15-49) 4 UNDP
Crude birth rate(per 1000 people) 10 UNICEF
Crude death rate(per 1000 live births) 10 UNICEF
Children in labour force 7 WBChildren not in primary school 3 UNDP+EFAChildren dropped
before grade five 3 UNICEFChildren under weight 2 UNDP
DDebt, total external 9 WBDebt servicing
(% of exports of goods & services) 9 UNDPDefence expenditure, total 8 BICC
annual % increase 8 BICCas % of central govt. exp. 8 UNDPper capita% of GNP 8 BICC% of GDP 8 BICC
Deforestationaverage annual (%) 11 WB
EEconomic activity rate
(female as % of male) 6 UNDPEmployment in arms production 8 BICCEnrolment, primary level, gross 3, 4e WBEnrolment, secondary level, gross 3, 4e WBEnrolment, tertiary level, gross 4e WBenrolment, combined
1st, 2nd & 3rd level, gross 1, 2, 3 UNDPEnrolment, primary level, female 6 UNICEFEnrolment, 1st, 2nd & 3rd level,
gross (female as % of male) 6 UNICEFEngineers & scientists in R&D 4e WBExports, as % of GDP 9 UNDPEmployment by economic activity 10 UNDPAgriculture Female, MaleIndustry Female, MaleServices Female, MaleEmployment growth (%) 2e ILOEmployment by sectors (%) 2e ILO
KEY TO INDICATORS
Agriculture 2e ILOmale, female 3e ILO
Industry 2e ILOmale, female 3e ILO
Services 2e ILOmale, female 3e ILO
Education exp, as % of GDP 3, 9, 4e UNDPEducation exp, as % of all levels 4e UNDPEnrolment, tertiary, natural
& applied science 3 UNDP
F, GFertility rate, total 2, 10 UNICEFFemale population 6 UNFemale professional
& technical workers 6 UNDPFood
as a % of merchandise exports 11 WBas % of merchandise imports 11 WB
Food production per capita 11 FAOForest production (100 cum.)
round wood 11 FAOfuel wood 11 FAO
Fresh water withdrawals(billion cubic meter) 11 WB(as % of total renewable resources) 11 WB
Gender empowerment measure 6 UNDPGender-related development Index 1, 6 UNDPGDP, total 9 UNDPGDP, per capita growth 1 WBGDP, growth rate 1, 2e WBGNP per capita 1, 2, 9 WBGDP, real per capita (PPP US$) 1, 2, 9 UNDPGross domestic investment 9 WBGross domestic savings 9 WB
H, I, JHIV/AIDS, people 5 UNDPHealth expenditure, public
(as % of GDP) 4, 9 UNDPHuman Development Index 1, 2 UNDPHealth service, without access 5 UNDPIlliterate adults, total 5 UNDP
% of total adult population 5 UNDPIlliterate females, total 5 UNDP% of total adult population 5 UNDP
Income poverty, 1$ a day 9,5 UNDPnational poverty line 9,5 UNDP
Income share: ratio of top20% to lowest 20% 9 UNDP
Income, earned(female as % of male) 3e UNDP
Industry (as % of GDP) 9 WBInfant mortality rate 1, 2, 7 UNDPInfants (low birth weight) % 7 UNDP
K, LLabour force, total 10, 1e WBAverage annual growth rate 10, 1e WBFemale labour force, 10, 3e WB(as % of male)
Indicator Indicator Originaltables source
Indicator Indicator Originaltables source
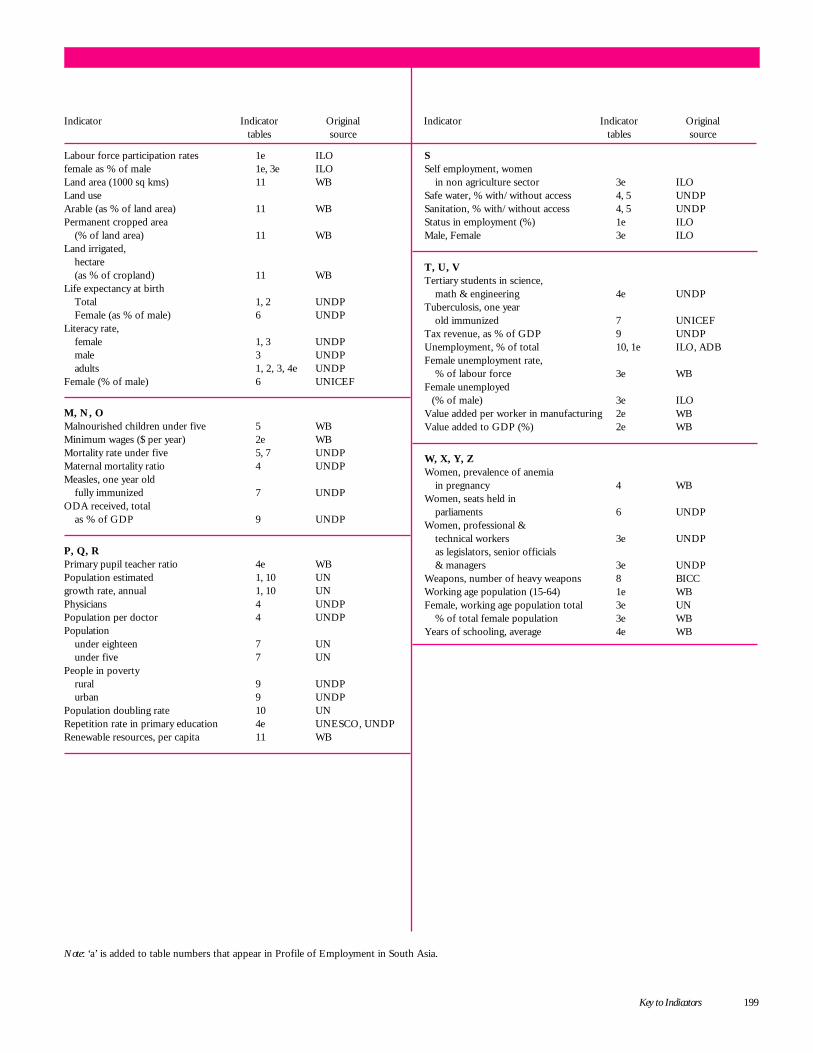
Key to Indicators 199
Labour force participation rates 1e ILOfemale as % of male 1e, 3e ILOLand area (1000 sq kms) 11 WBLand useArable (as % of land area) 11 WBPermanent cropped area
(% of land area) 11 WBLand irrigated,
hectare(as % of cropland) 11 WB
Life expectancy at birthTotal 1, 2 UNDPFemale (as % of male) 6 UNDP
Literacy rate,female 1, 3 UNDPmale 3 UNDPadults 1, 2, 3, 4e UNDP
Female (% of male) 6 UNICEF
M, N, OMalnourished children under five 5 WBMinimum wages ($ per year) 2e WBMortality rate under five 5, 7 UNDPMaternal mortality ratio 4 UNDPMeasles, one year old
fully immunized 7 UNDPODA received, total
as % of GDP 9 UNDP
P, Q, RPrimary pupil teacher ratio 4e WBPopulation estimated 1, 10 UNgrowth rate, annual 1, 10 UNPhysicians 4 UNDPPopulation per doctor 4 UNDPPopulation
under eighteen 7 UNunder five 7 UN
People in povertyrural 9 UNDPurban 9 UNDP
Population doubling rate 10 UNRepetition rate in primary education 4e UNESCO, UNDPRenewable resources, per capita 11 WB
Indicator Indicator Originaltables source
Indicator Indicator Originaltables source
Note: ‘a’ is added to table numbers that appear in Profile of Employment in South Asia.
SSelf employment, women
in non agriculture sector 3e ILOSafe water, % with/without access 4, 5 UNDPSanitation, % with/without access 4, 5 UNDPStatus in employment (%) 1e ILOMale, Female 3e ILO
T, U, VTertiary students in science,
math & engineering 4e UNDPTuberculosis, one year
old immunized 7 UNICEFTax revenue, as % of GDP 9 UNDPUnemployment, % of total 10, 1e ILO, ADBFemale unemployment rate,
% of labour force 3e WBFemale unemployed
(% of male) 3e ILOValue added per worker in manufacturing 2e WBValue added to GDP (%) 2e WB
W, X, Y, ZWomen, prevalence of anemia
in pregnancy 4 WBWomen, seats held in
parliaments 6 UNDPWomen, professional &
technical workers 3e UNDPas legislators, senior officials& managers 3e UNDP
Weapons, number of heavy weapons 8 BICCWorking age population (15-64) 1e WBFemale, working age population total 3e UN
% of total female population 3e WBYears of schooling, average 4e WB

200 Human Development in South Asia 2003
ADB Asian Development BankBICC Bonn International Centre for ConversionFAO Food and Agriculture OrganisationILO International Labour OrganizationMHHDC Mahbub ul Haq Human Development CentreUN United NationsUNDP United Nations Development ProgrammeUNICEF United Nations Children’s FundUNESCO United Nations Educational, Scientific and Cultural OrganizationWB World Bank
Key to source abbreviations