MGT 330F – Introduction to Marketing October 23, 2003 Marketing Plans.
23
MGT 330F – Introduction to Marketing October 23, 2003 Marketing Plans
-
date post
19-Dec-2015 -
Category
Documents
-
view
216 -
download
0
Transcript of MGT 330F – Introduction to Marketing October 23, 2003 Marketing Plans.
MGT 330F – Introduction to Marketing
October 23, 2003
Marketing Plans
Lecture Overview
• Marketing in the News
• Video segments and discussion
• Marketing Plans
Marketing in the News

Video Segments and Discussion
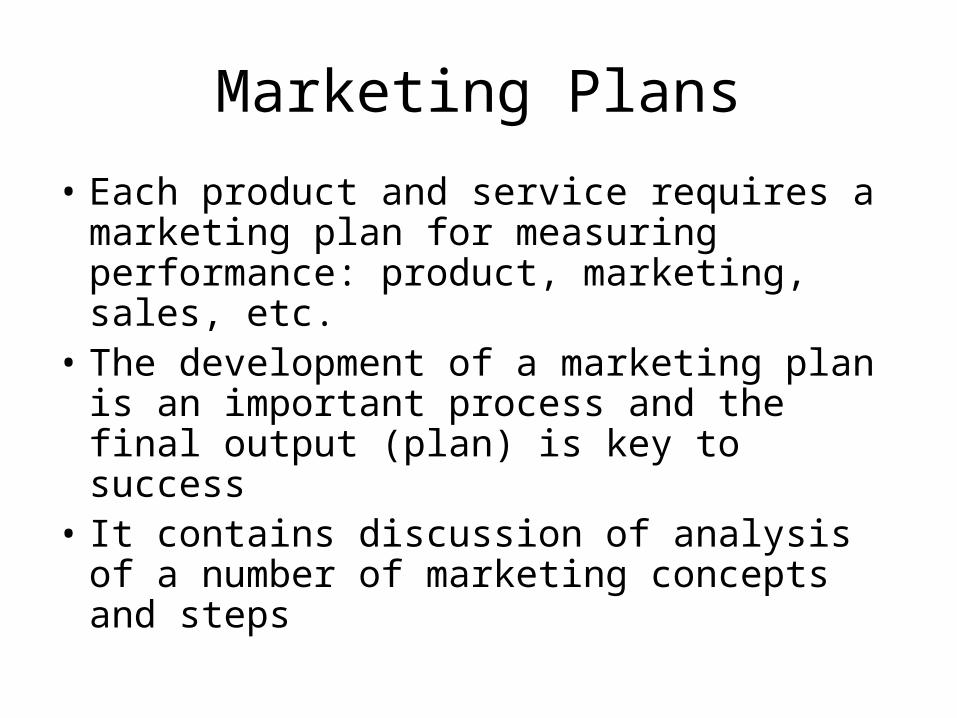
Marketing Plans
• Each product and service requires a marketing plan for measuring performance: product, marketing, sales, etc.
• The development of a marketing plan is an important process and the final output (plan) is key to success
• It contains discussion of analysis of a number of marketing concepts and steps
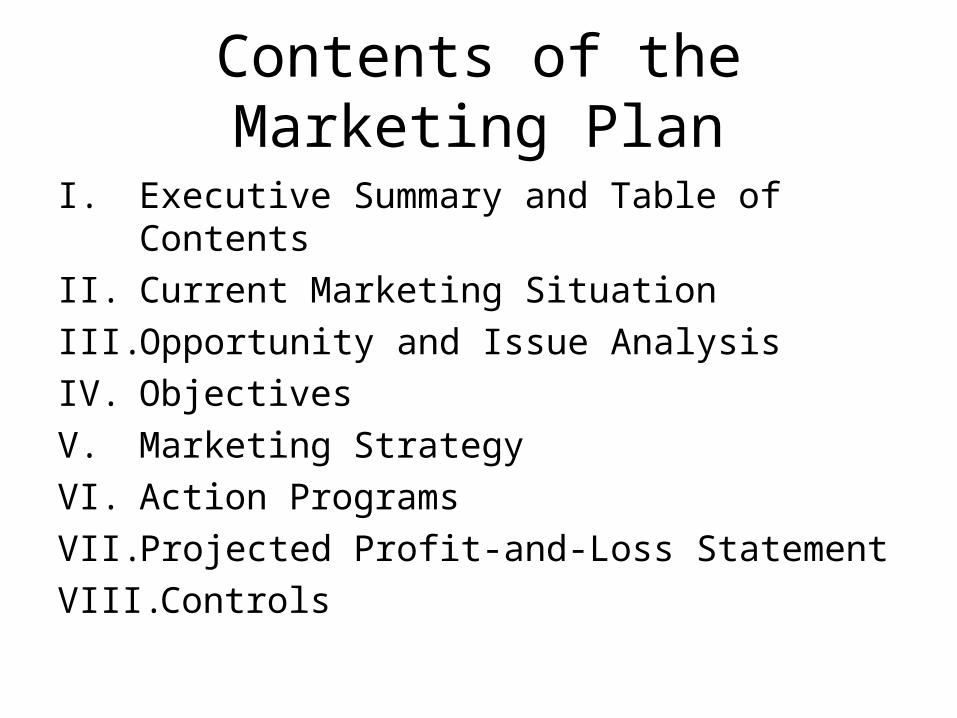
Contents of the Marketing Plan
I. Executive Summary and Table of Contents
II. Current Marketing Situation
III. Opportunity and Issue Analysis
IV. Objectives
V. Marketing Strategy
VI. Action Programs
VII. Projected Profit-and-Loss Statement
VIII. Controls
Executive Summary
• A brief summary of the plan’s main goals and recommendations
• Allows senior management to grasp the plan’s major thrust
Current Marketing Situation
• Market Situation– Relevant background data on the
microenvironment– Size and growth of the market– Customer needs and buying-behaviour trends– Information taken from marketing manager’s
product ‘fact book’
Current Marketing Situation
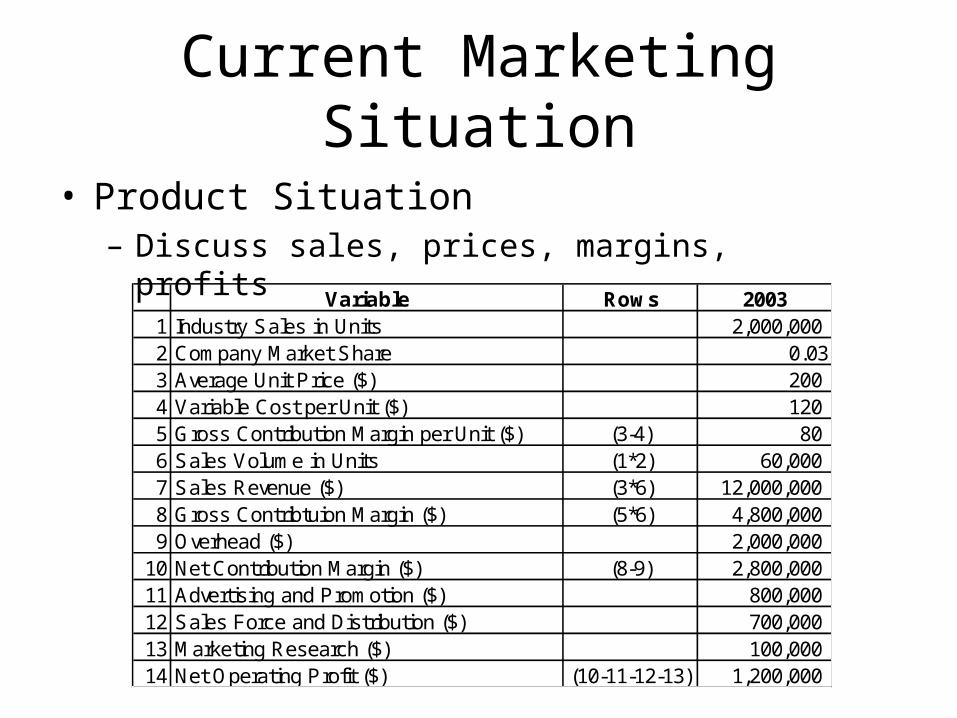
• Product Situation– Discuss sales, prices, margins, profits
Variable Rows 20031 Industry Sales in Units 2,000,000 2 Company Market Share 0.033 Average Unit Price ($) 200 4 Variable Cost per Unit ($) 120 5 Gross Contribution Margin per Unit ($) (3-4) 80 6 Sales Volume in Units (1*2) 60,000 7 Sales Revenue ($) (3*6) 12,000,000 8 Gross Contribtuion Margin ($) (5*6) 4,800,000 9 Overhead ($) 2,000,000
10 Net Contribution Margin ($) (8-9) 2,800,000 11 Advertising and Promotion ($) 800,000 12 Sales Force and Distribution ($) 700,000 13 Marketing Research ($) 100,000 14 Net Operating Profit ($) (10-11-12-13) 1,200,000
Current Marketing Situation
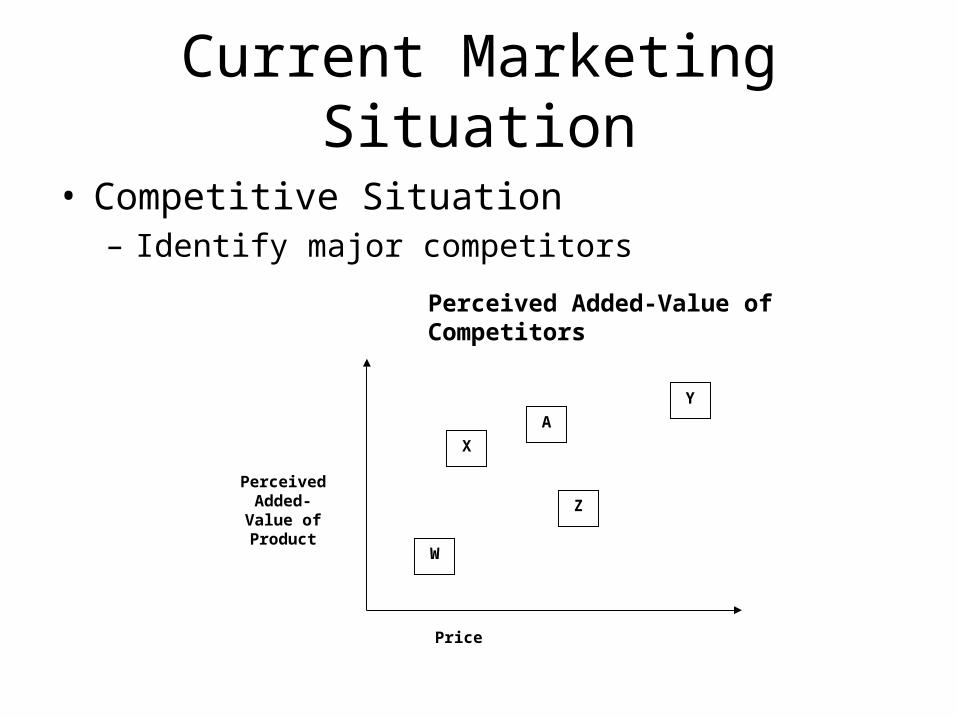
• Competitive Situation– Identify major competitors
Perceived Added-Value
of Product
Price
X
Z
Y
W
A
Perceived Added-Value of Competitors
Current Marketing Situation
• Distribution Strategy– Data on the size and importance of each
distribution channel
• Macroenvironment– Describe broad trends (e.g., demographics,
economy, technology, etc.)
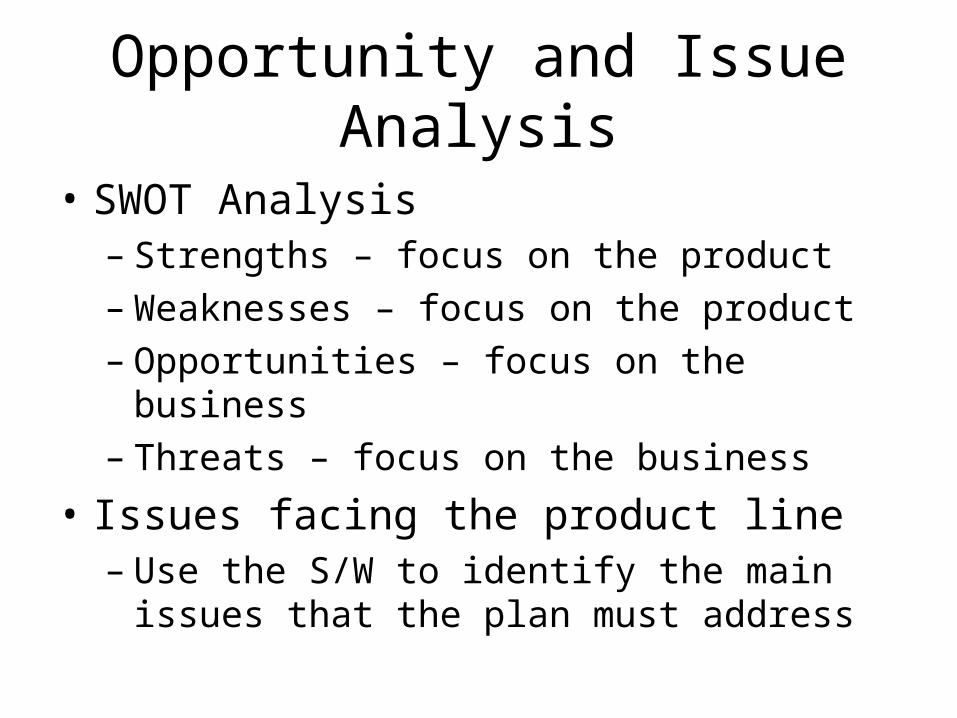
Opportunity and Issue Analysis
• SWOT Analysis– Strengths – focus on the product– Weaknesses – focus on the product– Opportunities – focus on the business– Threats – focus on the business
• Issues facing the product line– Use the S/W to identify the main issues that
the plan must address
Objectives
• Identify the Financial and Marketing Objectives– Financial: Specified Rates of Return, Cash
Flow or Net Profits– Marketing: Translate financial objectives into
marketing objectives
Marketing Strategy
• The “game plan” used to accomplish the plan’s objectives
• In developing the plan, the marketing manager must consult with others in the company:– Production and Manufacturing– Sales– Finance
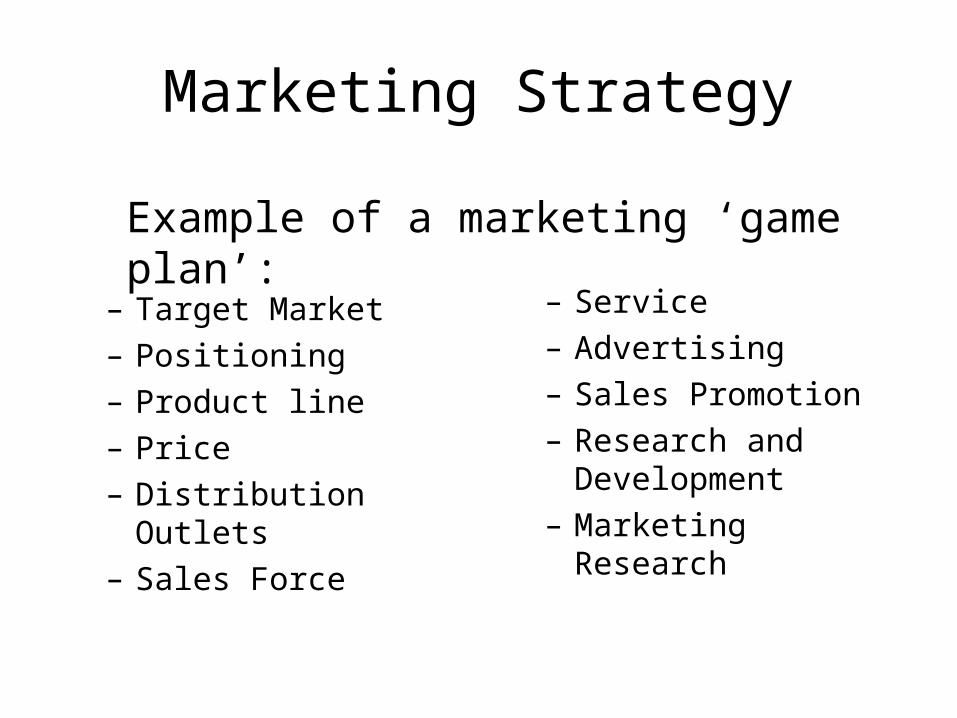
Marketing Strategy
– Target Market– Positioning– Product line– Price– Distribution Outlets– Sales Force
– Service– Advertising– Sales Promotion– Research and
Development– Marketing Research
Example of a marketing ‘game plan’:
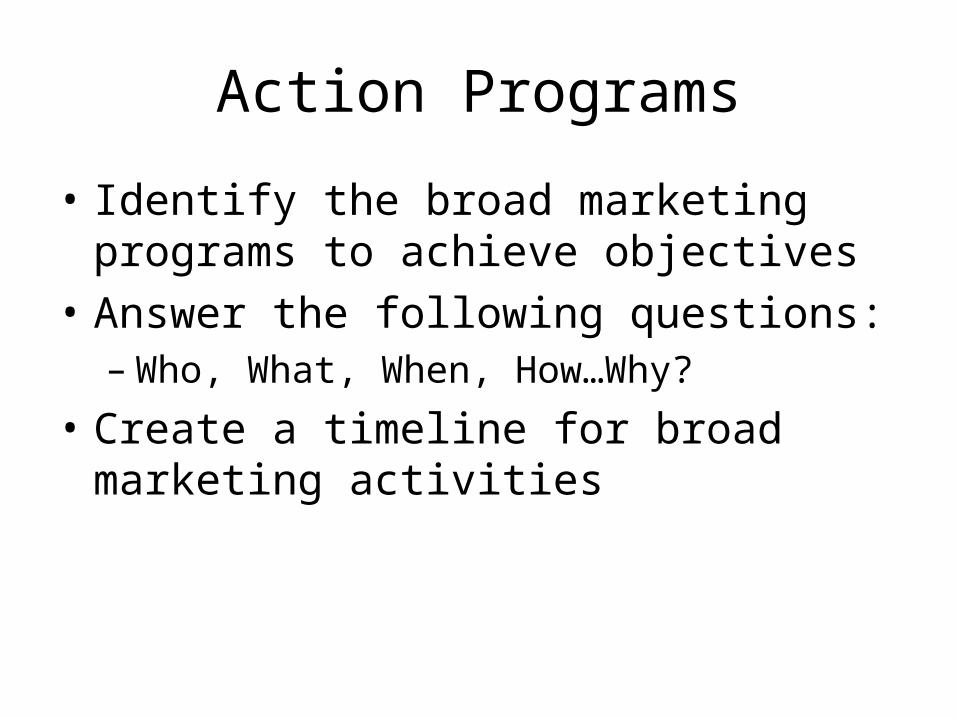
Action Programs
• Identify the broad marketing programs to achieve objectives
• Answer the following questions:– Who, What, When, How…Why?
• Create a timeline for broad marketing activities
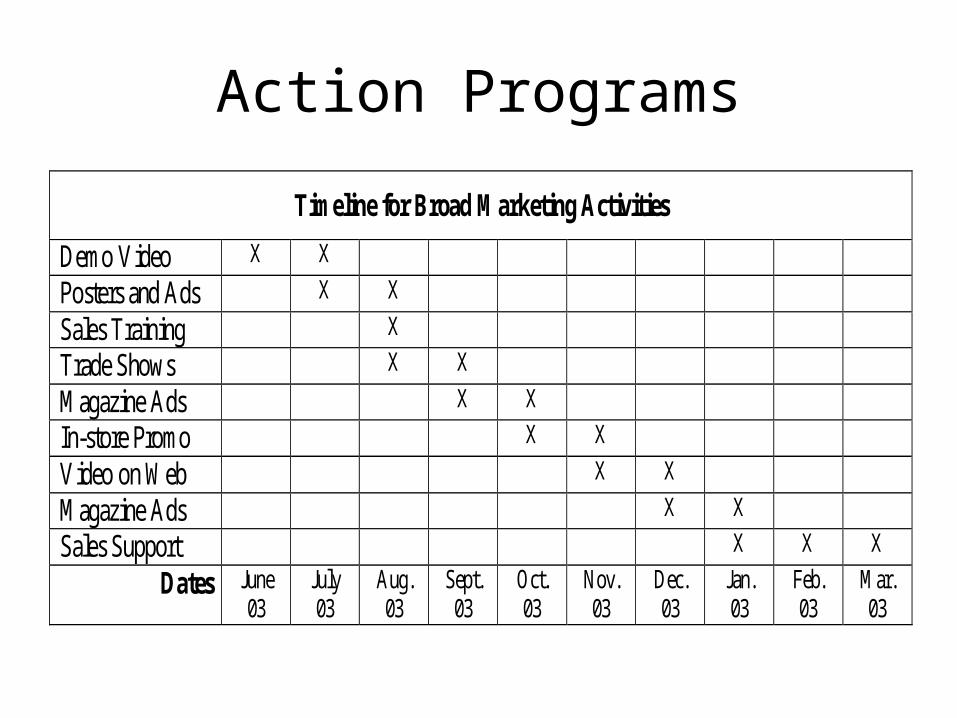
Action Programs
Timeline for Broad Marketing Activities
Demo Video X X
Posters and Ads X X
Sales Training X
Trade Shows X X
Magazine Ads X X
In-store Promo X X
Video on Web X X
Magazine Ads X X
Sales Support X X X
Dates June 03
July 03
Aug. 03
Sept. 03
Oct. 03
Nov. 03
Dec. 03
Jan. 03
Feb. 03
Mar. 03
Profit and Loss Statement
• Action plans lead to a budget
• Revenues…projected sales
• Expenses…estimated costs…granularity
• The difference is projected profit
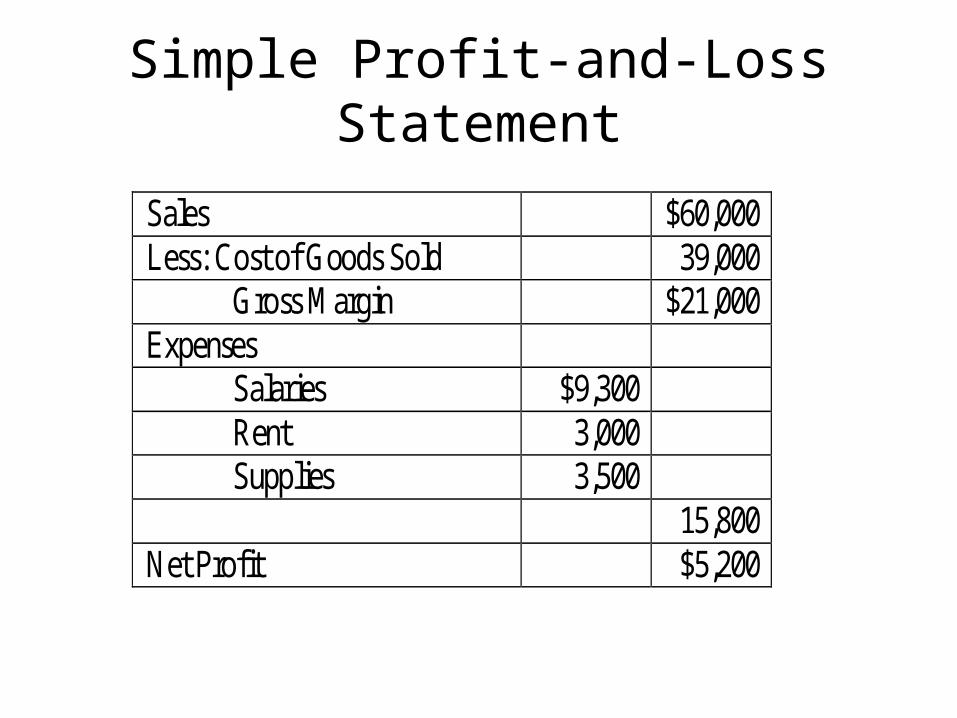
Simple Profit-and-Loss Statement
Sales $60,000 Less: Cost of Goods Sold 39,000
Gross Margin $21,000 Expenses
Salaries $9,300 Rent 3,000 Supplies 3,500
15,800 Net Profit $5,200
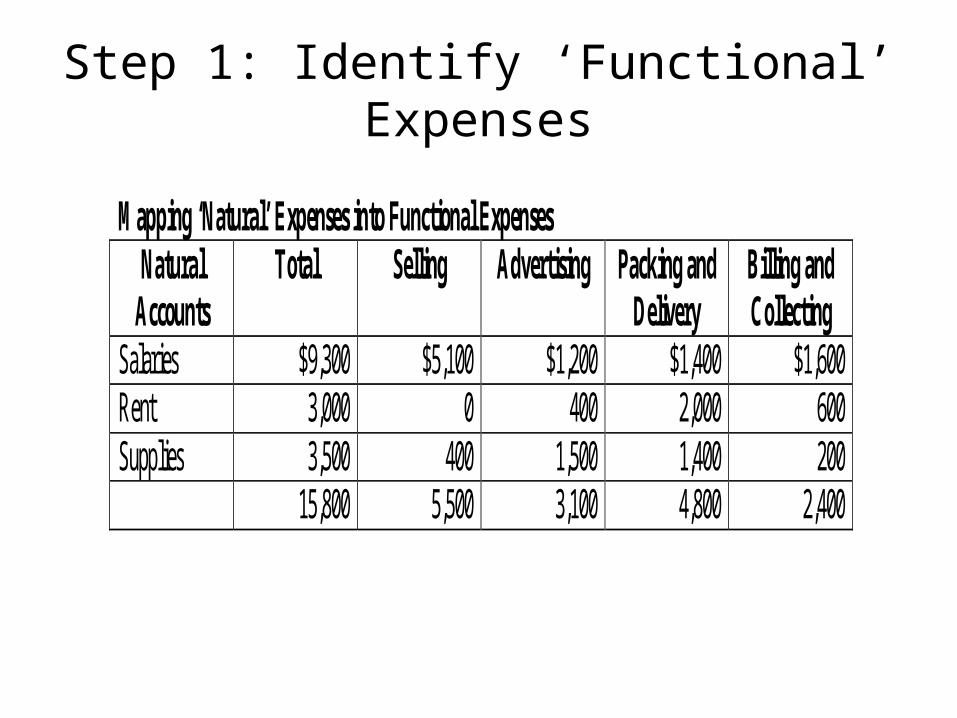
Step 1: Identify ‘Functional’ Expenses
Mapping ‘Natural’ Expenses into Functional Expenses Natural
Accounts Total Selling Advertising Packing and
Delivery Billing and Collecting
Salaries $9,300 $5,100 $1,200 $1,400 $1,600 Rent 3,000 0 400 2,000 600 Supplies 3,500 400 1,500 1,400 200 15,800 5,500 3,100 4,800 2,400
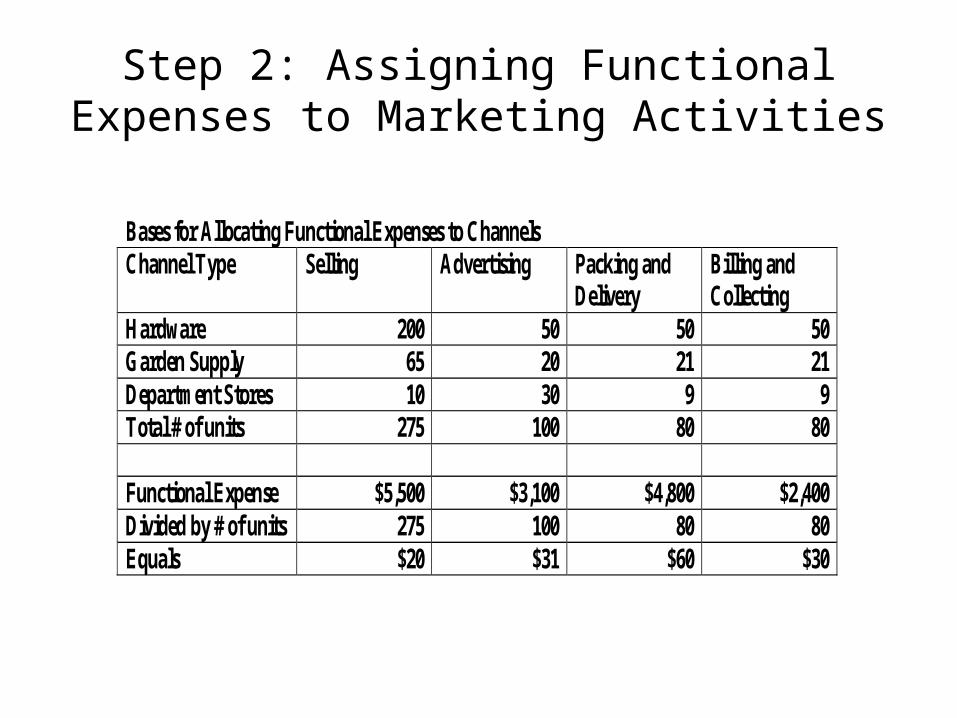
Step 2: Assigning Functional Expenses to Marketing Activities
Bases for Allocating Functional Expenses to Channels Channel Type Selling Advertising Packing and
Delivery Billing and Collecting
Hardware 200 50 50 50 Garden Supply 65 20 21 21 Department Stores 10 30 9 9 Total # of units 275 100 80 80 Functional Expense $5,500 $3,100 $4,800 $2,400 Divided by # of units 275 100 80 80 Equals $20 $31 $60 $30
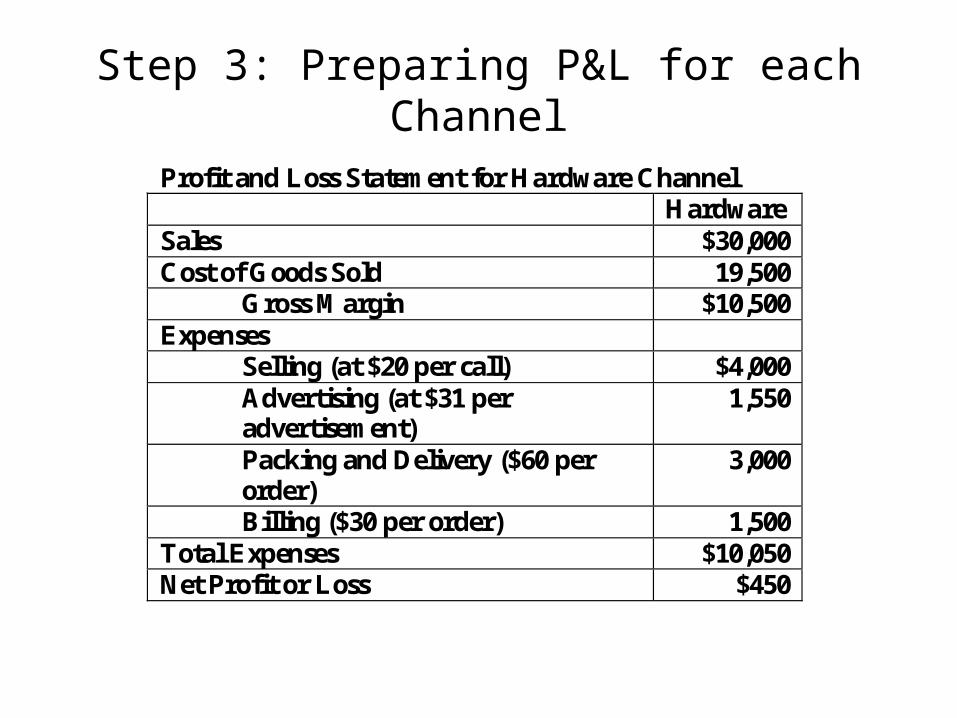
Step 3: Preparing P&L for each Channel
Profit and Loss Statement for Hardware Channel Hardware Sales $30,000 Cost of Goods Sold 19,500
Gross Margin $10,500 Expenses
Selling (at $20 per call) $4,000 Advertising (at $31 per advertisement)
1,550
Packing and Delivery ($60 per order)
3,000
Billing ($30 per order) 1,500 Total Expenses $10,050 Net Profit or Loss $450
Controls and Contingency
• An outline of how the plan will be monitored
• Goals are spelled out on a monthly or quarterly basis
• Managers and senior management review the performance
• Contingency plans are specific plans to deal with anticipated ‘adverse’ developments in the market (e.g., price war)