
Methods and limitations of evaluation and impact · PDF fileMethods and limitations of...
62
Methods and limitations of evaluation and impact research Reinhard Hujer, Marco Caliendo, Dubravko Radic In: Descy, P.; Tessaring, M. (eds) The foundations of evaluation and impact research Third report on vocational training research in Europe: background report. Luxembourg: Office for Official Publications of the European Communities, 2004 (Cedefop Reference series, 58) Reproduction is authorised provided the source is acknowledged Additional information on Cedefop’s research reports can be found on: http://www.trainingvillage.gr/etv/Projects_Networks/ResearchLab/ For your information: • the background report to the third report on vocational training research in Europe contains original contributions from researchers. They are regrouped in three volumes published separately in English only. A list of contents is on the next page. • A synthesis report based on these contributions and with additional research findings is being published in English, French and German. Bibliographical reference of the English version: Descy, P.; Tessaring, M. Evaluation and impact of education and training: the value of learning. Third report on vocational training research in Europe: synthesis report. Luxembourg: Office for Official Publications of the European Communities (Cedefop Reference series) • In addition, an executive summary in all EU languages will be available. The background and synthesis reports will be available from national EU sales offices or from Cedefop. For further information contact: Cedefop, PO Box 22427, GR-55102 Thessaloniki Tel.: (30)2310 490 111 Fax: (30)2310 490 102 E-mail: [email protected] Homepage: www.cedefop.eu.int Interactive website: www.trainingvillage.gr
Transcript of Methods and limitations of evaluation and impact · PDF fileMethods and limitations of...

Methods and limitations ofevaluation and impact research
Reinhard Hujer, Marco Caliendo, Dubravko Radic
In:
Descy, P.; Tessaring, M. (eds)
The foundations of evaluation and impact researchThird report on vocational training research in Europe: background report.
Luxembourg: Office for Official Publications of the European Communities, 2004(Cedefop Reference series, 58)
Reproduction is authorised provided the source is acknowledged
Additional information on Cedefop’s research reports can be found on:http://www.trainingvillage.gr/etv/Projects_Networks/ResearchLab/
For your information:
• the background report to the third report on vocational training research in Europe contains originalcontributions from researchers. They are regrouped in three volumes published separately in English only.A list of contents is on the next page.
• A synthesis report based on these contributions and with additional research findings is being published inEnglish, French and German.
Bibliographical reference of the English version:Descy, P.; Tessaring, M. Evaluation and impact of education and training: the value of learning. Thirdreport on vocational training research in Europe: synthesis report. Luxembourg: Office for OfficialPublications of the European Communities (Cedefop Reference series)
• In addition, an executive summary in all EU languages will be available.
The background and synthesis reports will be available from national EU sales offices or from Cedefop.
For further information contact:
Cedefop, PO Box 22427, GR-55102 ThessalonikiTel.: (30)2310 490 111Fax: (30)2310 490 102E-mail: [email protected]: www.cedefop.eu.intInteractive website: www.trainingvillage.gr

Contributions to the background report of the third research report
Impact of education and training
Preface
The impact of human capital on economic growth: areviewRob A. Wilson, Geoff Briscoe
Empirical analysis of human capital development andeconomic growth in European regionsHiro Izushi, Robert Huggins
Non-material benefits of education, training and skillsat a macro levelAndy Green, John Preston, Lars-Erik Malmberg
Macroeconometric evaluation of active labour-marketpolicy – a case study for GermanyReinhard Hujer, Marco Caliendo, Christopher Zeiss
Active policies and measures: impact on integrationand reintegration in the labour market and social lifeKenneth Walsh and David J. Parsons
The impact of human capital and human capitalinvestments on company performance Evidence fromliterature and European survey resultsBo Hansson, Ulf Johanson, Karl-Heinz Leitner
The benefits of education, training and skills from anindividual life-course perspective with a particularfocus on life-course and biographical researchMaren Heise, Wolfgang Meyer
The foundations of evaluation andimpact research
Preface
Philosophies and types of evaluation researchElliot Stern
Developing standards to evaluate vocational educationand training programmesWolfgang Beywl; Sandra Speer
Methods and limitations of evaluation and impactresearchReinhard Hujer, Marco Caliendo, Dubravko Radic
From project to policy evaluation in vocationaleducation and training – possible concepts and tools.Evidence from countries in transition.Evelyn Viertel, Søren P. Nielsen, David L. Parkes,Søren Poulsen
Look, listen and learn: an international evaluation ofadult learningBeatriz Pont and Patrick Werquin
Measurement and evaluation of competenceGerald A. Straka
An overarching conceptual framework for assessingkey competences. Lessons from an interdisciplinaryand policy-oriented approachDominique Simone Rychen
Evaluation of systems andprogrammes
Preface
Evaluating the impact of reforms of vocationaleducation and training: examples of practiceMike Coles
Evaluating systems’ reform in vocational educationand training. Learning from Danish and Dutch casesLoek Nieuwenhuis, Hanne Shapiro
Evaluation of EU and international programmes andinitiatives promoting mobility – selected case studiesWolfgang Hellwig, Uwe Lauterbach,Hermann-Günter Hesse, Sabine Fabriz
Consultancy for free? Evaluation practice in theEuropean Union and central and eastern EuropeFindings from selected EU programmesBernd Baumgartl, Olga Strietska-Ilina,Gerhard Schaumberger
Quasi-market reforms in employment and trainingservices: first experiences and evaluation resultsLudo Struyven, Geert Steurs
Evaluation activities in the European CommissionJosep Molsosa
Methods and limitations of evaluation and impact research
Reinhard Hujer, Marco Caliendo, Dubravko Radic (1)
AbstractThe need to measure and judge the effects of social programmes, and the importance of evaluation studiesin this context, is no longer questioned. Evaluation is a complex task and involves several steps. Thefollowing contribution mainly focuses on the methodological aspects of evaluation, particularly on econo-metric evaluation techniques. In consequence, we concentrate on evaluation studies conducted in the fieldof active labour-market policies (ALMP) and especially labour-market training (LMT) in Germany and Europe.The ideal evaluation process can be viewed as a series of three steps. First, the impacts of theprogramme on the individual should be estimated. Second, it should be determined whether the esti-mated impacts are large enough to yield net social gains. Finally, evaluation should question whether thebest outcome have been achieved for the money spent (Fay, 1996). The focus of our paper is the firststep, namely the microeconometric evaluation, although the other two steps, i.e. macroeconometric eval-uation and cost-benefit analysis (CBA), are also discussed.When discussing microeconometric evaluation, analysts such as LaLonde (1986) or Ashenfelter and Card(1985) view social experiments as the only valid evaluation method. A second group, including Heckmanand Hotz (1989) and Lechner (1998), believe that it is possible to construct a comparison group usingnon-experimental data and econometric and statistical methods to solve the fundamental evaluationproblem. This problem arises because we cannot observe individuals simultaneously with and withoutparticipation in a programme. Since experimental data is scarce in Europe and evaluators often have to evaluate programmes alreadyrunning, we focus on the techniques that deal with non-experimental data only. To do so we discuss thefundamental evaluation problem and different methods to solve this problem empirically. The methodspresented include the before-after estimator (BAE), the cross-section estimator (CSE), the matching estimator,the difference-in-differences estimator (DID) and finally the duration model approach. Every estimator makessome generally untestable assumption to overcome the fundamental evaluation problem and therefore wealso discuss the likelihood that these assumptions are met in practice. In addition we present a numericalexample to show how the estimators are implemented technically and also discuss their data requirements.Aggregated data can be used as well as individual data to evaluate the effects of ALMP programmes(including LMT). Instead of looking at the effect on individual performance, we would like to know if theALMP represent a net gain to the whole economy. If the total number of jobs is not affected bylabour-market policies, the effects will only be distributional. The need for a macroeconometric evalua-tion arises from the presence of dead-weight losses, displacement and substitution effects. Important
(1) Acknowledgements: the authors thank Björn Christensen, Pascaline Descy, Viktor Steiner, Manfred Tessaring,Stephan Thomsen and Christopher Zeiss for valuable comments and Yasemin Illgin, Paulo Rodrigues and Oliver Wünsche forresearch assistance.
The foundations of evaluation and impact research132
methodological issues in a macroeconometric evaluation are the specification of the empirical model,which should always be based on an appropriate theoretical framework, and the simultaneity problem ofALMP which has to be solved. Despite being able to reveal the impacts for the individuals and for the whole economy, micro- andmacroeconometric evaluations do not cover the full range of effects associated with social programmes.Social programmes also involve various other, more qualitative, aims and objectives. Examples includedistributional and equity goals, which are often hard to measure but nevertheless important. In order tocapture these effects, a cost-benefit analysis should be conducted as a third step. Such an analysiswidens the perspective of an impact analysis and contributes to better understanding of the completeeffects of a social programme. After having discussed the methodological issues related to the three evaluation steps, we presentempirical findings from micro- and macroeconometric evaluations in Europe and, in particular, inGermany. We find that training programmes seem to have positive effects on the individuals in most ofthe studies and perform better than alternative labour-market programmes such as, for example, jobcreation schemes (JCS). Finally, we use the results from our methodological discussion and the empirical findings to draw someimplications for policy and evaluation practice. We focus on the choice of the appropriate estimationmethod, data requirements, the problem of heterogeneity in evaluation analysis, the successful design oftraining programmes and the transferability of our findings (for ALMP) to other social programmes.

Table of contents
1. Introduction 136
2. Methods of evaluation 139
2.1. Process of evaluation 139
2.1.1. The evaluand and the time of the evaluation 139
2.1.2. The evaluators 140
2.1.3. The evaluation criteria 140
2.1.4. The evaluation method 141
2.2. Microeconometric evaluation 142
2.2.1. Fundamental evaluation problem 142
2.2.2. Before-after estimator 144
2.2.3. Cross-section estimator 146
2.2.4. Matching estimator 146
2.2.5. Difference-in-differences estimator 149
2.2.6. Duration models 150
2.2.7. An intuitive example 151
2.3. Macroeconometric evaluation 154
2.4. Cost-benefit analysis (CBA) 156
2.4.1. Time of a CBA 158
2.4.2. Selection of the alternatives 158
2.4.3. Defining the reference group 158
2.4.4. Enumerate and forecast all impacts 159
2.4.5. Measuring and aggregating impacts 160
2.4.6. Comparing costs and benefits 161
2.4.7. Conducting sensitivity tests 161
3. ALMP in the EU and empirical findings 165
3.1. Recent developments in ALMP in the EU 165
3.2. Microeconometric evaluation studies 167
3.2.1. Germany 167
3.2.2. Other European countries 168
3.2.2.1. Switzerland 168
3.2.2.2. Austria 169
3.2.2.3. Belgium 169
3.2.2.4. France 169
3.2.2.5. Denmark 169
3.2.2.6. United Kingdom 169
3.2.2.7. Ireland 169
3.2.2.8. Norway 169
3.2.2.9. Sweden 170
3.3. Macroeconometric evaluation studies 170
3.3.1. Sweden 170
3.3.2. Germany 170
3.4. Vocational training programme success in previous years 171

The foundations of evaluation and impact research134
4. Policy implications: some guidance for evaluation and implementation practice 175
4.1. Selection problem and the choice of estimation method 175
4.2. Heterogeneity 176
4.3. Data requirements 176
4.4. Macroeconometric analysis and cost-benefit analysis 177
4.5. The design of training programmes: some suggestions 178
4.6. Transferability to other social programmes 179
5. Summary and conclusions 180
List of abbreviations 182
Annex: Tables 183
References 186
List of tables and figures
TablesTable 1: Comparison of the different evaluation estimators 151
Table 2: Labour-market outcomes for participants and non-participants 152
Table 3: Estimates of the programme effects 154
Table 4: Hypothetical example before reallocation 162
Table 5: Hypothetical example after reallocation 162
Table 6: Costs and benefits of the Job Corps programme 163
Table 7: Expenditure on LMT as a percentage of total spending on ALMP 167
Table 8: Summary of the empirical findings from microeconometric studies 172
Table A1: Standardised unemployment rates in the EU (as a percentage of total labour force) 183
Table A2: Public expenditure on ALMP as a percentage of GDP 184
Table A3: Public expenditure on PLMP as a percentage of GDP 184
Table A4: Public expenditure on LMT as a percentage of GDP 185
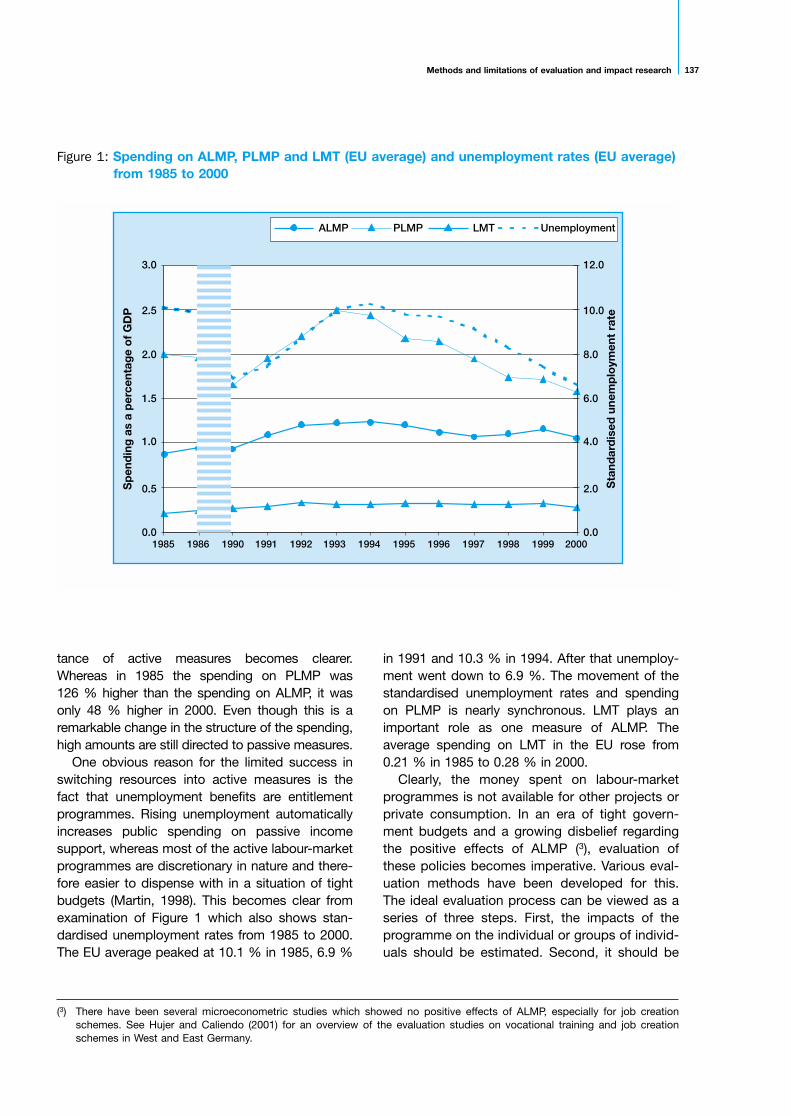
FiguresFigure 1: Spending on ALMP, PLMP and LMT (EU average) and unemployment rates (EU average)
from 1985 to 2000 137
Figure 2: Major aspects of an evaluation process 141
Figure 3: Ashenfelter’s dip 145
Figure 4: Different stages of a CBA 157
Figure 5: Spending on ALMP and PLMP in the EU, 1985 166
Figure 6: Spending on ALMP and PLMP in the EU, 2000 166
The need to measure and judge the effects ofsocial programmes, and the importance of evalua-tion studies in this context, is no longer ques-tioned. Evaluation is, however, a complex task andinvolves several steps. The range of topics is virtu-ally unlimited and, since every topic requires aspecific methodological approach, there exists nogeneral evaluation strategy. To be successful,every evaluation must pre-specify a set of prelimi-nary aspects. First it must be stated preciselywhich subject is to be evaluated. A second impor-tant question is ‘who are the evaluators and whatare their competences?’. Finally, and probablymost important, the evaluation criteria and thechosen procedure for the evaluation must be fixed.
This contribution will focus mainly on the lastaspect, i.e. offer some suggestions and advice onwhich econometric evaluation techniques shouldbe used under different economic circumstances.In doing so, we will concentrate on evaluationstudies conducted in the field of activelabour-market policies (ALMP) and especiallylabour-market training (LMT). We regard them asfruitful object of analysis for several reasons. Theincreasing expenditure on ALMP in the lastdecades has raised a considerable interest inevaluation and motivated many studies in thatfield. Also the choice of the outcome variable thatis of interest is more obvious than for other socialprogrammes; the question of what should bedefined as a success and how to measure it canbe answered more easily. Whereas evaluation inthe United States, for example, has mainlyfocused on earnings after participating in acertain programme, in Europe the focus is moreon the employment prospects of the participants.We will address the issue of choosing an appro-priate outcome variable later on. Finally, incontrast to health programmes, for example,there is a closer link between ALMP programmes,which are often short-term activities, and theoutcome considered. Therefore, the evaluation ofthe effect of these programmes is often easier.
ALMP have been seen as one way to fightunemployment, rising in most European countriessince the early 1970s. The growing interest inthese measures is easy to understand in view ofthe disillusionment with more aggregate policies.Traditional demand stimulation has been discred-ited because it faces the risk of increasing infla-tion with only small effects on employment.Supply-side structural reforms, aimed atremoving various labour-market rigidities, aredifficult to implement or appear to produceresults rather slowly. In this situation, as Calmfors(1994) notes, ALMP are regarded by many as thedeus ex machina that will provide the solution tounemployment. Not only do they provide a moreefficient outcome in the labour market, they alsoequip individuals with higher skills and thereforelower the risk of poverty. In this sense ALMP arecapable of meeting efficiency and equity goals atthe same time (OECD, 1991) (2). Another develop-ment that spurred interest in ALMP is the fact thatit has become a common theme in the politicaldebate that governments should shift the balanceof public spending on labour-market policiesaway from passive income support towards moreactive measures designed to get the unemployedback into work. Anglo-Saxon policy-makersespecially favour the idea of tying the right ofwelfare to the duty of work. Welfare thenbecomes workfare (Card, 2000).
This should manifest itself in a higher relativeimportance of ALMP. Figure 1 shows the averagespending on active (including LMT) and passivelabour-market policies (PLMP) as a percentage ofthe national gross domestic product (GDP) from1985 to 2000 for the countries of the EuropeanUnion (EU). The average spending on ALMP rosefrom 0.88 % of GDP in 1985 to 1.23 % in 1994.After that peak it went back to 1.06 % in 2000. Thespending on PLMP, in contrast, peaked in 1993 at2.49 % before it was reduced to 1.57 % in 2000. Ifone compares the relationship between the twomeasures in 1985 and 2000 the growing impor-
1. Introduction
(2) Several means by which ALMP might influence the labour markets, such as enhancing and adapting skills according to skillneeds, improving individual employability and avoiding skill shortages, can be thought of.
Methods and limitations of evaluation and impact research 137
tance of active measures becomes clearer.Whereas in 1985 the spending on PLMP was126 % higher than the spending on ALMP, it wasonly 48 % higher in 2000. Even though this is aremarkable change in the structure of the spending,high amounts are still directed to passive measures.
One obvious reason for the limited success inswitching resources into active measures is thefact that unemployment benefits are entitlementprogrammes. Rising unemployment automaticallyincreases public spending on passive incomesupport, whereas most of the active labour-marketprogrammes are discretionary in nature and there-fore easier to dispense with in a situation of tightbudgets (Martin, 1998). This becomes clear fromexamination of Figure 1 which also shows stan-dardised unemployment rates from 1985 to 2000.The EU average peaked at 10.1 % in 1985, 6.9 %
in 1991 and 10.3 % in 1994. After that unemploy-ment went down to 6.9 %. The movement of thestandardised unemployment rates and spendingon PLMP is nearly synchronous. LMT plays animportant role as one measure of ALMP. Theaverage spending on LMT in the EU rose from0.21 % in 1985 to 0.28 % in 2000.
Clearly, the money spent on labour-marketprogrammes is not available for other projects orprivate consumption. In an era of tight govern-ment budgets and a growing disbelief regardingthe positive effects of ALMP (3), evaluation ofthese policies becomes imperative. Various eval-uation methods have been developed for this.The ideal evaluation process can be viewed as aseries of three steps. First, the impacts of theprogramme on the individual or groups of individ-uals should be estimated. Second, it should be
Figure 1: Spending on ALMP, PLMP and LMT (EU average) and unemployment rates (EU average)from 1985 to 2000
ALMP PLMP LMT Unemployment
12.0
10.0
8.0
6.0
4.0
2.0
0.02000199919981997199619951994199319921991199019861985
3.0
2.5
2.0
1.5
1.0
0.5
0.0
Sp
end
ing
as
a p
erce
ntag
e o
f G
DP
Sta
ndar
dis
ed u
nem
plo
ymen
t ra
te
(3) There have been several microeconometric studies which showed no positive effects of ALMP, especially for job creationschemes. See Hujer and Caliendo (2001) for an overview of the evaluation studies on vocational training and job creationschemes in West and East Germany.
The foundations of evaluation and impact research138
determined whether the estimated impacts arelarge enough to yield net social gains. Finally, itshould be decided if this is the best outcome thatcould have been achieved for the money spent(Fay, 1996) (4). The focus of our paper is the firststep, namely the microeconometric evaluation,although the other two steps, i.e. macroecono-metric evaluation and cost-benefit analysis (CBA),are discussed too.
Empirical microeconometric evaluation isconducted with individual data. The main ques-tion is whether the desired outcome variable foran individual is affected by participation in anALMP programme. Relevant outcome variablescould be the future employment probability or thefuture earnings. We would like to know the differ-ence between the value of the participants’outcome in the actual situation and the value ofthe outcome if there had been no participation inthe programme. The fundamental evaluationproblem arises because we never observe bothstates (participation and non-participation) for thesame individual at the same time. Therefore,finding an adequate control group is necessary tomake a comparison possible. This is not easybecause participants in programmes usually differsystematically from the non-participants in moreaspects than just participation. Simply taking thedifference between their outcomes after theprogramme will not reveal the true programmeimpact but will lead to a biased estimate. Theliterature on the solution to this problem is domi-nated by two points of view.
Analysts such as LaLonde (1986) or Ashenfelter and Card (1985) view social experi-ments as the only valid evaluation method. Asecond group, including Heckman and Hotz(1989) and Lechner (1998), believe that it ispossible to construct a comparison group usingnon-experimental data and econometric andstatistical methods to solve the fundamental eval-uation problems. In non-experimental or observa-tional studies, the data are not derived in a
process that is completely under the control ofthe researcher. Instead, one has to rely on infor-mation about how individuals actually performedafter the intervention; that is, we observe theoutcome with treatment for participants and theoutcome without treatment for non-participants.
The objective of observational studies is to usethis information to restore the comparability of bothgroups by design. To do so, more-or-less plausibleidentification assumptions have to be imposed.There are several approaches differing with respectto the methods applied to this problem. Somestudies control for observables as part of para-metric evaluation models, others constructmatched samples. Some authors think that condi-tioning on observables is not enough and that onehas to take into account unobservables too. Wepresent here several different estimation tech-niques, discuss the methodological conceptsassociated with them, highlight their (dis-) advan-tages and identify the environments under whichthey work best. While presenting the methodolog-ical concepts of each estimator, we also discussthe data requirements needed for their implemen-tation. By doing this, we hope to give advice for theconstruction of datasets in the future.
The remainder of this paper is organised asfollows:(a) first, we present some methodological
concepts of evaluation. We discuss microe-conometric evaluation concepts in detail andalso present some ideas on macroeconometricanalysis and the cost-benefit approach;
(b) in the following chapter we present somestandardised facts about the evolution ofunemployment and labour-market policies inthe EU, before we give an overview of themost relevant previous empirical findingsregarding LMT in Germany and Europe;
(c) finally, we summarise the findings and giveadvice for the implementation and evaluationof training or other social programmes in thefuture.
(4) The results can also be used to provide a feedback for improvement of subsequent programmes.
2.1. Process of evaluation
The need to measure and judge the effects ofsocial programmes, and the importance of evalu-ation studies in this context, is no longer ques-tioned. Founders of these programmes increas-ingly ask for hard evidence of the efficient use ofinvestments and enquire whether theprogrammes were successful or not. Evaluationis, however, a complex task that involves severalsteps. The range of topics is virtually unlimitedand, since every topic requires a specificmethodological approach, there is no generalevaluation strategy.
Evaluation is, according to a definition ofWorthen et al. (1997), the determination of theworth or merit of an evaluation object, the eval-uand. It comprises (Worthen et al., 1997, p. 5) the‘identification, clarification, and application ofdefensible criteria to determine an evaluationobject’s value, quality, utility, effectiveness, orsignificance in relation to those criteria.’ Itsoutstanding attribute, therefore, is its scientificclaim. Another feature of evaluation that distin-guishes it from basic research is its practicalaccess. Evaluation and research are similar inthat they use empirical methods and techniquesto discover new knowledge. However, whereasresearch is primarily interested in advancingknowledge for its own sake, evaluation of socialprogrammes is concerned with practical utilisa-tion and matters such as:(a) did the programme achieve what it was
intended to do?(b) who benefited from the programme?(c) could the programme be conducted better or
more efficiently?(d) what changes must be undertaken to improve
particular aspects of the programme?To be successful, every evaluation must
pre-specify a set of preliminary aspects (Kromrey,2001). First, it must be stated precisely whichsubject should be evaluated and when this evalu-ation should take place. A second important pointis to consider who the evaluators are and whattheir competences are. Finally, and probably most
important, the evaluation criteria and the chosenprocedure for the evaluation must be fixed.
2.1.1. The evaluand and the time of theevaluation
Defining the evaluation object seems straightfor-ward at first sight. It comprises a detaileddescription of the programme which should beevaluated. A broad variety of programmes exists:those already implemented; those at the imple-mentation stage; regionally concentratedpilot-programmes; and well established nationalprogrammes. However, a detailed description ofthe programme is not enough. Since an evalua-tion of every aspect of the programme would notbe feasible, it must be clearly specified whetheronly the implementation of the programmeshould be evaluated or certain impacts of it.
Monitoring the implementation of theprogramme consists of a complete enumerationof what has happened during the different stagesof its execution. It gives a first impression of theprogramme under consideration, for example thenumber of participants, the average time theagencies conducting the programmes spent witheach client, the expected costs of theprogramme, the completion rate, the employmentstatus reached after the participation, etc. Suchinformation can be a form of control over theagents implementing the programme. Althoughthis monitoring gives a first impression about thesuccess or failure of a programme, it does notgive any explanations for it. Monitoring is thus areasonable first step in an evaluation process andcan be seen as a minimum requirement to checkhow large sums of public money are spent. Eval-uation, on the other hand, goes a step further andaims at determining whether a programme issuccessful or not by defining certain criteria andassessing whether these criteria were met.
Another question which has to be answeredbefore the evaluation takes place concerns thetime when an object should be evaluated. In thiscontext, a distinction between formative andsummative evaluation seems to be useful. If theevaluation takes place during the development
2. Methods of evaluation
The foundations of evaluation and impact research140
stage of the programme, and if the results of theevaluation are used to provide some feedback onhow to improve it, a formative evaluation isconducted. Such an open formative evaluation isof practical value because of its feedback feature.However, the feedback of evaluation results onthe programme does not allow for interpretationof the results in terms of success or efficiencysince the evaluation itself influences the successof the programme. In addition, most programmesyield benefits only in the medium the long termand hence cannot be used as feedback forcurrent programmes but, at best, as a basis forfuture improvements of similar programmes.
A summative evaluation, on the other hand, isconducted after the programme has beenfinished. Thereby an immediate influence on theresults on the programme is abandoned. Themajor task of a summative evaluation is to deter-mine whether the programme should becontinued or terminated after it was carried out.Scriven (1991) puts the difference between thetwo approaches using the following illustration:‘When the cook tastes the soup, that’s formativeevaluation; when the guest tastes it, that’ssummative evaluation.’
2.1.2. The evaluators Another important point is the question of who isauthorised to conduct an evaluation. In an internalevaluation, the employees working for theprogramme are in charge of it. The alternativewould be to assign this task to external evaluators,for example independent consultants orresearchers. The advantage of an internal processis that the evaluators are familiar to the programmeand that they have trouble-free access to all neces-sary information. One potential problem is thedesiderative professionalism and objectivity. If, forexample, the institution in charge of the evaluationis also responsible for the implementation of theprogramme, an incentive to find results that corre-spond to the aims and objectives of theprogramme could arise. This hazard can beavoided by external evaluators who are also able tobring in new views and ideas. But, even if the eval-uation is done by internal staff, the transparencyand accountability can be increased if there issome kind of cooperation with external institutionsin certain areas, or if the material underlying theevaluation, for example datasets, etc., are madeavailable to the scientific community.
2.1.3. The evaluation criteria The a-priori fixing of criteria ensures that the eval-uation is not done in an ad hoc manner but trans-parently and comprehensibly. There is a broadspectrum of potential criteria, including variousdirect and secondary impacts of the programme.In the case of ALMP for example, direct impactscould be on future employment probability orwages, whereas secondary effects would includepotential displacement and crowding-out-effects.We will address these issues shortly in moredetail. Other criteria could be the efficiency inconducting the programme or even the legitimacyof the objectives themselves. In this context animportant question is where these criteria comefrom, i.e. who sets them?
Typically, the criteria stem from the programmeitself. If for example the programme to be evalu-ated aims at improving the re-employment prob-ability of the disabled, then an obvious criterionwould be the change in the re-employment prob-ability attributable to this programme. The evalu-ation methods described in this contribution aremainly established on such quantitativemeasures. Whereas evaluation in the US, forexample, has mainly focused on earnings aftertraining participation, in Europe the training effecton employment plays a dominant role. This is notsurprising, as unemployment in Europe is muchhigher and more persistent than in the US. Butthe same quantitative outcome, say improvementof employment situation, may plausibly bemeasured in several ways, for instance by hoursper week in the new job or by a simple distinctionbetween employment and unemployment.Schmidt (1999) notes, that there are some prob-lems arising with the choice of an appropriateoutcome measure. Outcomes may not becomparable across interventions. Therefore apolicy-maker who has to decide which measureto implement will normally try to translate thegains of a programme into monetary terms or tocarry out a so-called cost-utility analysis. Still thisis not easy because new problems like time orgroup preferences emerge. We will pick up theseproblems in the following section. Trying tomeasure the gains of a social programme usingmonetary terms, however, does not mean thatother more qualitative aims and objectives, suchas the quality of life of the affected participants orfairness aspects, are of less importance. Other
Methods and limitations of evaluation and impact research 141
important examples for more qualitative aims andobjectives include equity goals, social inclusion,civic participation or reduction in crime. We willaddress these issues later on.
2.1.4. The evaluation method Having defined the programme and the successcriteria, evaluating the impact of a programmerequires disentangling the effect of the programmefrom other exogenous factors. The programmecan be seen as the independent variable, whereasthe dependent variable is the success criterion.Various empirical strategies can be used tomeasure the impact of the independent variable.The most favoured empirical strategy is a naturalexperiment where individuals participating in socialprogrammes and those who were excluded fromparticipation are randomly selected so that differ-
ences in the outcome variable after the treatment,i.e. after the programme took place, are solelyattributable to the programme. Although seen asthe golden path in evaluation, experiments havetheir own drawbacks, the most severe being anethical one. It is simply very hard to refuse help tosome people who are supposed to be in need of it.Besides this ethical issue, experiments suffer alsofrom other shortcomings, such as randomisationbias, Hawthorne effect, disruption and substitutionbias. We will address these issues later on.Quasi-experimental strategies, on the other hand,rely on a non-randomly chosen group ofnon-participants and differ in the way the controlgroup is constructed. Examples include thebefore-after-estimator or the matching-procedure.This paper will address issues concerned withthese estimators.
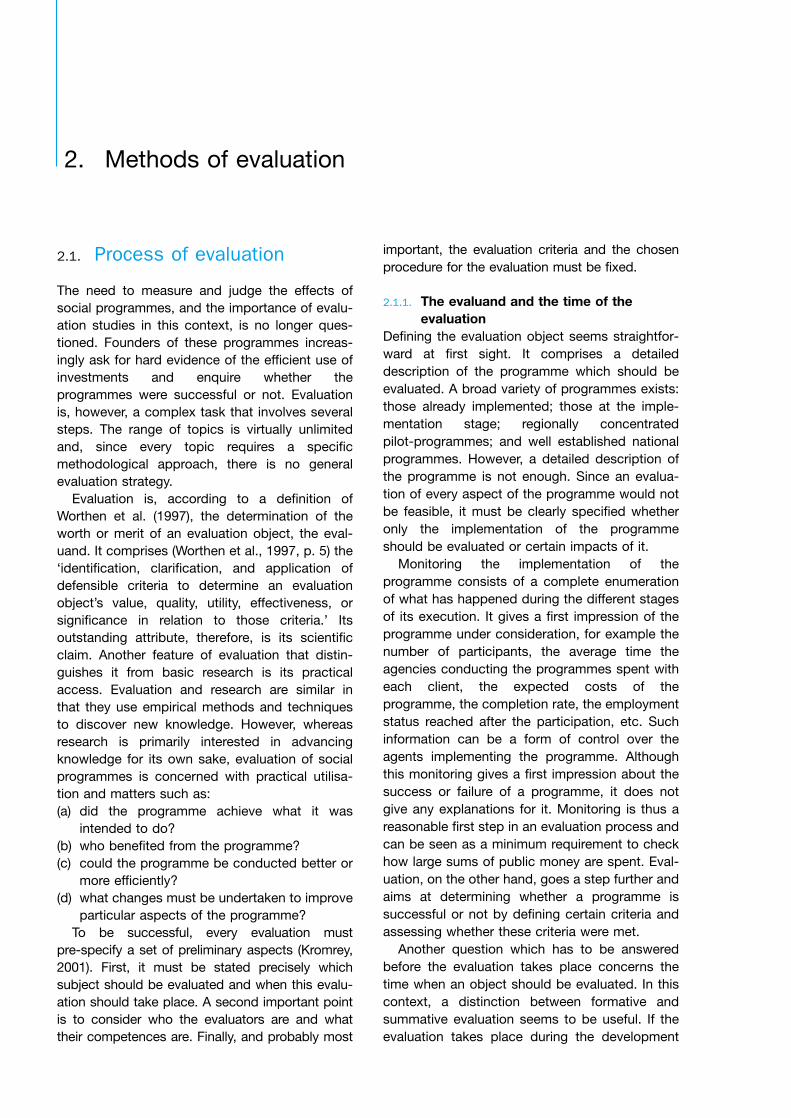
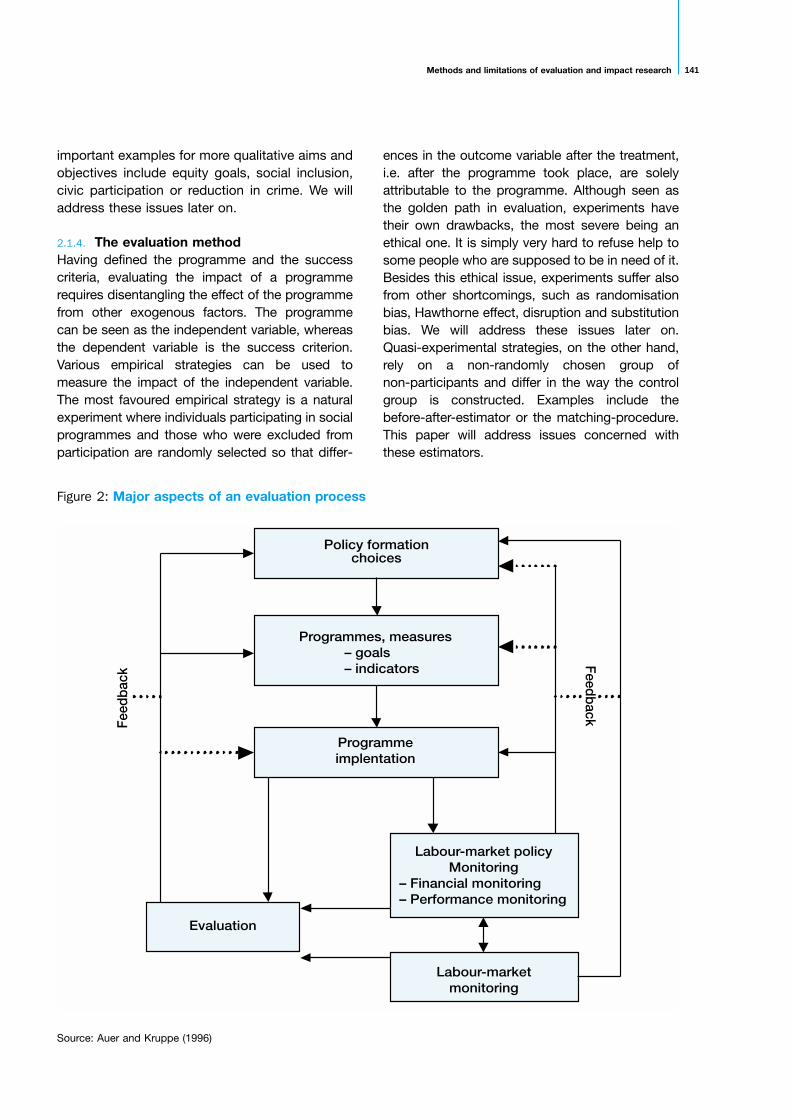
Figure 2: Major aspects of an evaluation process
Policy formationchoices
Programmes, measures– goals– indicators
Programmeimplentation
Labour-market policyMonitoring
– Financial monitoring– Performance monitoring
Evaluation
Labour-marketmonitoring
Feed
back
Feedback
Source: Auer and Kruppe (1996)
The foundations of evaluation and impact research142
Following Auer and Kruppe (1996) the majoraspects which have to be taken into accountwhen conducting an evaluation of socialprogrammes are once again summarised inFigure 2. With the definition of the goals andobjectives of the programme, appropriate indica-tors for measuring the success of the programmeshould be defined as well. These goals are then,once the programme has been implemented,confronted with the actual data obtained from afirst monitoring. The following sections will mainlyfocus on the last aspect, i.e. derive some sugges-tions and advice on which econometric evalua-tion techniques should be used under differenteconomic circumstances in order to conduct theevaluation.
2.2. Microeconometric evaluation
2.2.1. Fundamental evaluation problemInference about the impact of a treatment on theoutcome of an individual involves speculationabout how this individual would have performedin the labour market, had he or she not receivedthe treatment (5). The framework serving as aguideline for the empirical analysis of thisproblem is the potential outcome approach, alsoknown as the Roy-Rubin-model (Roy, 1951)(Rubin, 1974). In the basic model there are twopotential outcomes (or responses), Y1 and Y0, foreach individual, where Y1 indicates an outcomewith training and without. In the former case, theindividual is in the treatment group and in thelatter case it is in the comparison group. Tocomplete the notation we define a binary assign-ment indicator D, indicating whether an individualactually participated in training (D=1) or not (D=0).The treatment effect for each individual is thendefined as the difference between his/her poten-tial outcomes:
∆ = Y1 – Y0. (1)
The fundamental problem of evaluating this indi-vidual treatment effect arises because theobserved outcome for each individual is given by:
Y = D·Y1 + (1 – D)·Y0. (2)
This means that for individuals who participatedin training (D = 1) we observe Y1 and for those whodid not participate we observe Y0. Unfortunately,we can never observe Y1 and Y0 for the same indi-vidual simultaneously and therefore we cannotestimate (1) directly. The unobservable componentin (1) is called the counterfactual outcome, so thatfor an individual who participated in the trainingmeasure (D = 1), Y0 is the counterfactual outcome,and for another one who did not participate it is Y1.
The concentration on a single individualrequires that the effect of the intervention on eachindividual is not affected by the participationdecision of any other individual, i.e. the treatmenteffect ∆ for each person is independent of thetreatment of other individuals. In statistical litera-ture (Rubin, 1980) this is referred to as the stableunit treatment value assumption (SUTVA) andguarantees that average treatment effects can beestimated independently of the size and compo-sition of the treatment population (6). Note thatthere will never be an opportunity to estimateindividual effects with confidence. Therefore wehave to concentrate on the population average ofgains from treatment. The most prominent evalu-ation parameter is the so-called mean effect oftreatment on the treated:
E(∆ | D = 1) = E(Y1 | D = 1) – E(Y0 | D = 1). (7). (3)
The expected value of the treatment effect ∆ isdefined as the difference between the expectedvalues of the outcome with and without training forthose who actually participated in training. In thesense that this parameter focuses directly on actualtraining participants, it determines the realisedgross gain from the training programme and can becompared with its costs, helping to decide whetherthe programme is a success or not (Heckman et al.,1997, 1998b; Heckman et al., 1999).
(5) This is clearly different from asking whether there is an empirical association between training and the outcome (Lechner,2000). See Holland (1986) for an extensive discussion of concepts of causality in statistics, econometrics and other fields.
(6) Among other things SUTVA excludes cross-effects or general equilibrium effects. Its validity facilitates a manageable formalsetup; nevertheless in practical applications it is frequently questionable whether it holds.
(7) E is the expectation operator, in that case the expected value of the treatment effect ∆. E(∆ | D = 1) is the expected treatmentfor those who participated (| means conditional on)
Methods and limitations of evaluation and impact research 143
Despite the fact that most evaluation researchfocuses on average outcomes, partly becausemost statistical techniques focus on meaneffects, there is also a growing interest regardingeffects of policy variables on distributionaloutcomes. Examples where distributional conse-quences matter for welfare analysis includesubsidised training programmes (LaLonde, 1995)or minimum wages (DiNardo et al., 1996).Koenker and Bilias (2002) show that quantileregression methods can play a constructive rolein the analysis of duration (survival) data too.They describe the link between quantile regres-sion and the transformation model formulation ofsurvival analysis, offering a more flexible analysisthan conventional methods, for example if one isinterested in the duration of employment/unem-ployment after the programme took place.
Nevertheless we will focus on the averagetreatment effect on the treated E(∆ | D = 1) in thispaper. The second term on the right side in equa-tion (3) is unobservable as it describes the hypo-thetical outcome without treatment for partici-pants in a programme. If the condition:
E(Y0 | D = 1) = E(Y0 | D = 0) (4)
holds, we can use the non-participants as anadequate control group. In other words we wouldtake the mean outcome of non-participants as aproxy for the counterfactual outcome of partici-pants. This identifying assumption is definitelyvalid in social experiments. The key concept hereis the randomised assignment of individuals intotreatment and control groups. Individuals who areeligible to participate, for example, in training arerandomly assigned to a treatment group thatparticipates in the programme and a controlgroup that does not. This assignment mechanismis a process that is completely beyond employeeor administrator control. If the sample size issufficiently large, randomisation will generate acomplete balancing of all relevant observable andunobservable characteristics across treatmentand control groups. Therefore the comparabilitybetween experimental treatment and controlgroups is facilitated enormously. On average, thetwo groups do not systematically differ except for
having participated in training. As a result, anyobserved difference in the outcomes of thegroups after training is supposed to be solelyinduced by the programme itself, i.e. the impactof training is isolated and there should be noselection bias. Formally, random assignmentensures that the potential outcomes are indepen-dent of the assignment to the trainingprogramme. We write:
Y1,Y0 D (5)
denoting independence. When assignment totreatment is completely random it follows that:
E(Y1 | D = 1) = E(Y1 | D = 0),
and:
E(Y0 | D = 1) = E(Y0 | D = 0) (6)
Therefore, treatment assignment becomesignorable (Rubin, 1974) and we get an unbiasedestimate of E(∆), i.e. the randomly generatedgroup of non-participants can be used as anadequate control group to estimate consistentlythe counterfactual term E(Y0 | D = 0) and thus thecausal training effect E(∆ | D = 1). Although thisapproach seems to be very appealing inproviding a simple solution to the fundamentalevaluation problem, there are also problemsassociated with it. Besides relatively high costsand ethical issues concerning the use of experi-ments, in practice, a randomised experiment maysuffer from similar problems that affectbehavioural studies. Bijwaard and Ridder (2000)investigate the problem of non-compliance to theassigned intervention, that is when members ofthe treatment sample drop out of the programmeand members of the control group participate. Ifthe non-compliance is selective, i.e. correlatedwith the outcome variable, the difference of theaverage outcomes is a biased estimate of theeffect of the intervention, and correction methodshave to be applied too. Besides relatively highcosts and ethical issues concerning the use ofexperiments, further methodological problemsmight arise, such as substitution or randomisa-tion bias, which make the use of experimentsquestionable (8). For an extensive discussion of
ΠΠ
(8) A randomisation bias occurs when random assignment causes the types of persons participating in a programme to differ fromthe type that would participate in the programme as it normally operates, leading to an unrepresentative sample. We talk abouta substitution bias when members of an experimental control group gain access to close substitutes for the experimental treat-ment (Heckman and Smith, 1995).
∆BAEt t'E Y |D Y |D= = − =[( ) ( )].1 0
1 1
E Y |D E Y |Dt' t( ) ( ).0 0
1 1= = =
The foundations of evaluation and impact research144
(9) As Smith (2000) notes, social experiments have become the method of choice in the US. The most famous among them is theNational Job Training Partnership Act which had a major influence regarding the view on non-experimental studies. In Europe,however, social experiments have not received similar acceptance, although recently some test experiments have beenconducted. The most important one is the Restart experiment in Britain (Dolton and O’Neill, 1996).
(10) The distinction between observable and observed factors depends on the dataset. Whereas some factors like the motivationof an individual are hard to measure and therefore usually not observable, other factors like education are in general observ-able but might not be observed in the dataset at hand.
(11) On the other hand, if the difference in the treatment and the control group are due to unobservable characteristics, condi-tioning may accentuate rather than eliminate the differences in the no-programme state between the both groups (Heckmanet al., 1999).
these topics the interested reader should refer toBurtless (1995), Burtless and Orr (1986) andHeckman and Smith (1995) (9).
More important for practical applications is thefact that, in most European countries, experi-ments are not conducted and researchers have towork with non-experimental data anyway. Innon-experimental data, equation (4) will normallynot hold:
E(Y0 | D = 1) ≠ E(Y0 | D = 0), (7)
The use of the non-participants as a controlgroup might, therefore, lead to a selection bias.Heckman and Hotz (1989) point out that selectionmight occur on observable or unobservable char-acteristics. Good examples for observable char-acteristics are sociodemographic variables likequalification, age or gender of the individual,which are usually available in evaluation datasets.Unobservable characteristics might be the moti-vation or working habits of an individual. The aimof any observational evaluation approach is toensure the comparability of treatment and controlgroup by design; that is through a plausible iden-tifying assumption. Taking account of observablefactors might not be sufficient, if unobservablefactors invalidate the comparison, for examplewhen more motivated workers have a higheremployment probability and are also more likelyto participate in a training programme (Schmidt,1999) (10).
In the following subsections we will presentfour different evaluation approaches. Eachapproach invokes different identifying assump-tions to construct the required counterfactualoutcome. Therefore each estimator is onlyconsistent in a certain restrictive environment. AsHeckman et al. (1999) note, all estimators wouldidentify the same parameter only if there is noselection bias at all.
2.2.2. Before-after estimatorThe most obvious and still widely used evaluationstrategy is the before-after estimator (BAE). Itcompares the outcome of participants beforetraining took place with their outcome aftertraining. The basic idea is that the observableoutcome in the pre-training period t' represents avalid description of the unobservable counterfac-tual outcome of the participants without trainingin the post-training period t. The central identi-fying assumption of the BAE can be stated as:
(8)
Given the identifying assumption in (8), thefollowing estimator of the mean treatment effecton the treated can be derived:
(9)
Heckman et al. (1999) note that conditioningon observable characteristic X makes it morelikely that assumption (8) will hold. If the distribu-tion of X characteristics is different between thetreatment and the control group, conditioning onX may eliminate systematic differences in theoutcomes (11).
The validity of (9) depends on a set of implicitassumptions. First, the pre-exposure potentialoutcome without training should not be affectedby training. This may be invalid if individuals haveto behave in a certain way in order to get into theprogramme or behave differently in anticipation offuture training participation. Second, notime-variant effects should influence the potentialoutcomes from one period to the other. If thereare changes in the overall state of the economyor changes in the lifecycle position of a cohort ofparticipants, assumption (8) may be violated(Heckman et al., 1999).
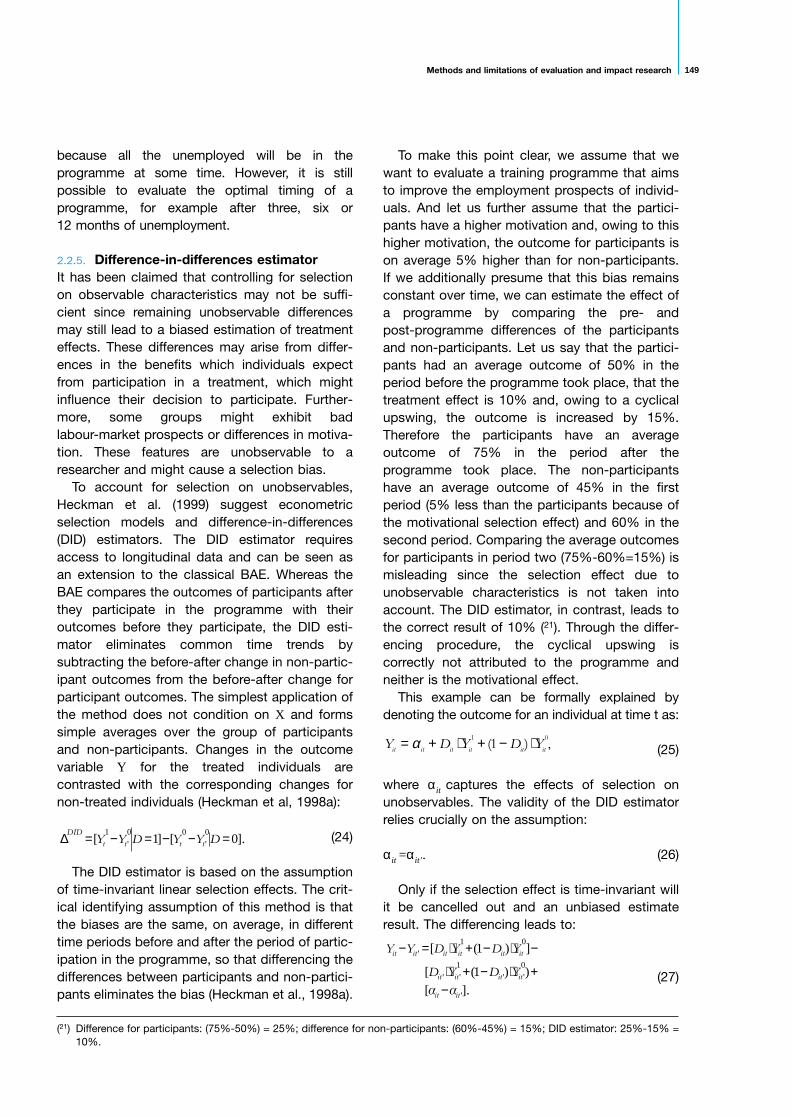
A good example where this might be the case isAshenfelter’s dip. That is a situation where shortly
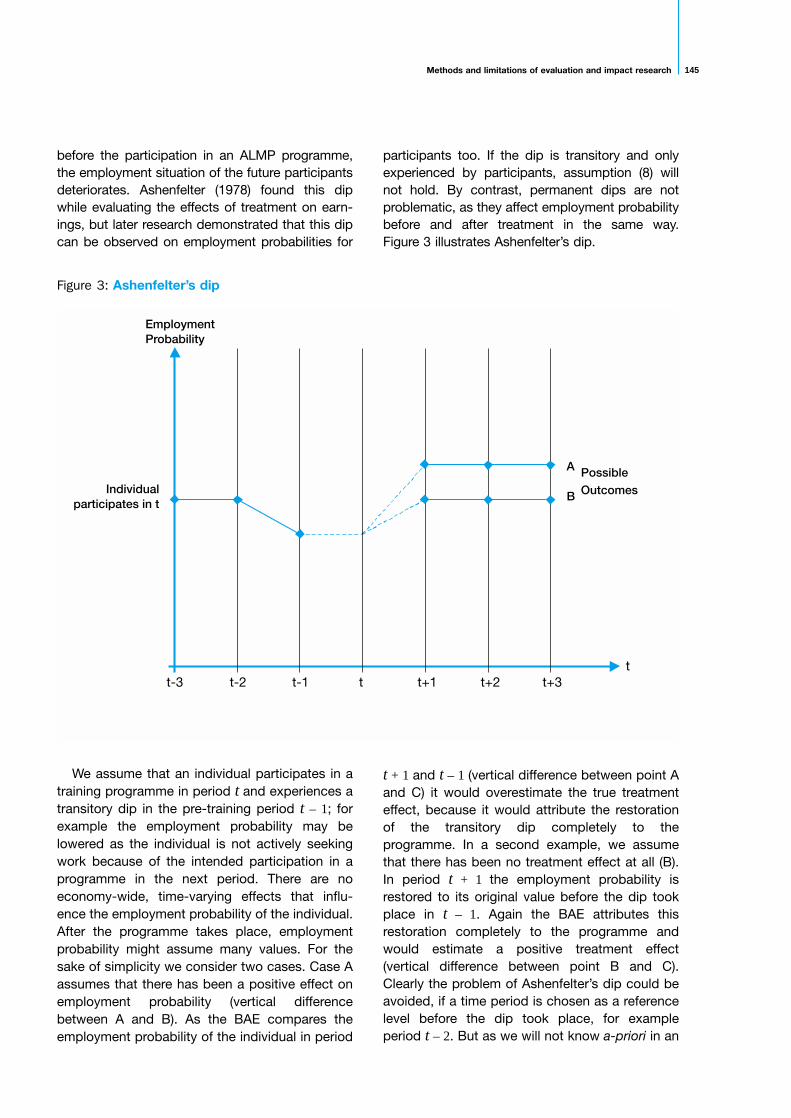
Methods and limitations of evaluation and impact research 145
before the participation in an ALMP programme,the employment situation of the future participantsdeteriorates. Ashenfelter (1978) found this dipwhile evaluating the effects of treatment on earn-ings, but later research demonstrated that this dipcan be observed on employment probabilities for
participants too. If the dip is transitory and onlyexperienced by participants, assumption (8) willnot hold. By contrast, permanent dips are notproblematic, as they affect employment probabilitybefore and after treatment in the same way.Figure 3 illustrates Ashenfelter’s dip.
Figure 3: Ashenfelter’s dip
EmploymentProbability
Individualparticipates in t
PossibleOutcomes
A
B
t-3 t-2 t-1 t t+1 t+2 t+3t
We assume that an individual participates in atraining programme in period t and experiences atransitory dip in the pre-training period t – 1; forexample the employment probability may belowered as the individual is not actively seekingwork because of the intended participation in aprogramme in the next period. There are noeconomy-wide, time-varying effects that influ-ence the employment probability of the individual.After the programme takes place, employmentprobability might assume many values. For thesake of simplicity we consider two cases. Case Aassumes that there has been a positive effect onemployment probability (vertical differencebetween A and B). As the BAE compares theemployment probability of the individual in period
t + 1 and t – 1 (vertical difference between point Aand C) it would overestimate the true treatmenteffect, because it would attribute the restorationof the transitory dip completely to theprogramme. In a second example, we assumethat there has been no treatment effect at all (B).In period t + 1 the employment probability isrestored to its original value before the dip tookplace in t – 1. Again the BAE attributes thisrestoration completely to the programme andwould estimate a positive treatment effect(vertical difference between point B and C).Clearly the problem of Ashenfelter’s dip could beavoided, if a time period is chosen as a referencelevel before the dip took place, for exampleperiod t – 2. But as we will not know a-priori in an
The foundations of evaluation and impact research146
empirical application when the dip starts, thequestion arises of which period to choose.
A major advantage of the BAE is that it doesnot require information on non-participants. Allthat is needed is longitudinal data on outcomeson participants before and after the programmetook place (12). As the employment status of theparticipants is usually known in the programmesor even prerequisite for participation, the BAEdoes not impose any major problems regardingthe data availability, which might explain why it isstill widely used (13).
2.2.3. Cross-section estimatorThe basic idea of the cross-section estimator isto compare the outcome of participants after theprogramme took place with the outcome ofnon-participants at the same time period. Insteadof comparing participants at two different timeperiods, the cross-section estimator comparesparticipants and non-participants at the sametime (after the programme took place), i.e. thepopulation average of the observed outcome ofnon-participants replaces the population averageof the unobservable outcome of participants. Thisis useful if no longitudinal information on partici-pants is available or macroeconomic conditionsshift substantially over time (Schmidt, 1999). Theidentifying assumption of the cross-section esti-mator can be stated formally as:
(10)=
That is, those who participate in theprogramme have, on average, the same no-treat-ment outcome as those who do not participate. Ifthis assumption is valid, the following estimatorof the mean true treatment effect can be derived:
(11)
It is worth noting that conditioning on observ-able characteristics makes it more likely that thisassumption will hold. If the distribution of X char-acteristics is different between the treatment andthe control group, conditioning on X may elimi-
nate systematic differences in the outcomes (14).To give a straightforward example, let us assumethat X represents the qualification level of an indi-vidual. For the sake of simplicity, we assume thatX might only take two values (1 for high-skilled and0 for low-skilled workers). Therefore, conditioningon X results in estimating the treatment effectsseparately for both skill groups and is intuitivelyappealing. The identifying assumption is then:
(12)
The first approach in equation (11) can be seenas a ‘naive’ estimator, because it just comparesthe results for the whole group, whereas thesecond takes into account observed differences inindividual’s characteristics, such as different skilllevels. The resulting estimator can be written as:
(13)
Schmidt (1999) notes, that for assumption (12)to be valid, selection into treatment has to bestatistically independent of its effects given X(exogenous selection), that is, no unobservablefactor should lead individual workers to partici-pate. A good example where this is violatedmight be the case if motivation plays a role indetermining the desire to participate and theoutcomes without treatment. Then we have, evenin the absence of any treatment effect, a higheraverage outcome in the participating groupcompared to the non-participating group. Ashen-felter’s dip is not problematic for the crosssection estimator as we compare only partici-pants and non-participants after the programmetook place. Moreover, as long as economy-wideshocks and individual lifecycle patterns operateidentically for the treatment and the controlgroup, the cross-section estimator is not vulner-able to the problems that plague the BAE(Heckman et al., 1999).
2.2.4. Matching estimatorThe matching approach originated in statisticalliterature and shows a close link to the experi-
∆CSE X
t tE Y X D Y X D= = − =[( | , ) ( | , )].1 0
1 0
E Y |X D E Y |X Dt( , ) ( , ).0 0
1 0= = =t
∆CSEt tE Y |D Y D= = − =[( ) ( | )].1 0
1 0
E Y |Dt( ).0
0=E Y Dt( )0
1| =
(12) The BAE might also work with repeated cross-sectional data from the same population, not necessarily containing informationon the same individuals. See Heckman and Robb (1985) or Heckman et al. (1999) for details.
(13) Note that the labour-market status (unemployed, part-time or low-skilled employed, etc.) is very often one of the entry condi-tions for ALMP programmes.
(14) On the other hand, if the differences in the treatment and the control group are due to unobservable characteristics, condi-tioning may accentuate rather than eliminate the differences in the no-programme state between both groups (Heckman et al.,1999).
Methods and limitations of evaluation and impact research 147
mental context (15). The basic idea underlying thematching approach is to find in a large group ofnon-participants those individuals who are similarto the participants in all relevant pre-trainingcharacteristics. That being done, the differencesin the outcomes between the well selected andthus adequate control group and the trainees canthen be attributed to the programme. Matchingdoes not need to rely on functional form or distri-butional assumptions, as its nature is non-para-metric (Augurzky, 2000).
Matching is first of all plagued by the sameproblem as all non-experimental estimators, whichmeans that assumption (4) cannot be expected tohold when treatment assignment is not random.However, following Rubin (1977), treatment assign-ment may be randomly given a set of covariates.The construction of a valid control group viamatching is based on the identifying assumptionthat conditional on all relevant pre-training covari-ates Z, the potential outcomes (Y1, Y0) are inde-pendent of the assignment to training (16). Thisso-called conditional independence assumption(CIA) can be written formally as:
(17) (14)
If assumption (14) is fulfilled we get:
E(Y0 | Z, D = 1) = E(Y0 | Z, D = 0) = E(Y0 | Z). (15)
Similar to randomisation in a classical experi-ment, the role of matching is to balance the distri-butions of all relevant pre-treatment characteris-tics in the treatment and control group, and thusto achieve independence between potentialoutcomes and the assignment to treatment,resulting in an unbiased estimate. The exactmatching estimator can be written as:
(16)
Conditioning on all relevant covariates is,however, limited in case of a high dimensionalvector Z. For instance, if Z contains n covariates
which are all dichotomous, the number ofpossible matches will be 2n. In this case cellmatching, that is exact matching on Z, is notpossible since an increase in the number of vari-ables increases the number of matching cellsexponentially. To deal with this dimensionalityproblem, Rosenbaum and Rubin (1983) suggestthe use of balancing scores b(Z), i.e. functions ofthe relevant observed covariates Z such that theconditional distribution of Z given b(Z) is indepen-dent of the assignment to treatment, that is Z D|b(Z) holds.
For trainees and non-trainees with the samebalancing score, the distributions of the covari-ates Z are the same, i.e. they are balanced acrossthe groups. Moreover Rosenbaum and Rubin(1983) show that if the treatment assignment isstrongly ignorable (18) when Z is given, it is alsostrongly ignorable given any balancing score. Thepropensity score, i.e. the probability of partici-pating in a programme is one possible balancingscore. It summarises the information of theobserved covariates into a single index function.
Rosenbaum and Rubin (1983) show how theconditional independence assumption extends tothe use of the propensity score so that:
Y0 D|P(Z) (17)
Therefore we get:
E(Y0 | P(Z), D = 1) = E(Y0 | P(Z), D = 0) E(Y0 | P(Z)), (18)
which allows us to rewrite the crucial term in theaverage treatment effect (3) as:
E(Y0 | D = 1) = Ep(z)[(Y0 | P(Z), D = 0) | D = 1]. (19)
Hujer and Wellner (2000b) note that the outerexpectation is taken over the distribution of thepropensity score in the treated population. Themajor advantage of the identifying assumption(17) is that it transforms the estimation probleminto a much easier task since one has to condi-tion on a univariate scale, i.e. on the propensity
∏
∏
∆MATt tE Y Z D Y Z D= = − =[( | , ) ( | , )].1 0
1 0
Y ,Y D Z1 0
C |( ).
(15) See Rubin (1974, 1977, 1979), Rosenbaum and Rubin (1983, 1985a, 1985b) or Lechner (1998).(16) If we say relevant we mean all those covariates that influence the assignment to treatment as well as the potential outcomes.
In contrast to the cross-section estimator, the matching procedure can also use information from the pre-treatment period,such as employment status or other time-varying covariates. To make this difference clear, we denote the covariates by (Z).
(17) For the purpose of estimating the mean effect of treatment on the treated, the assumption of conditional independence of Y0 issufficient because we like to infer estimates of Y0 for persons with D = 1 from data on persons with D = 0 (Heckman et al., 1997).
(18) Strongly ignorable means that assumption (16) holds and: 0<P(Z)≡P(D = 1 | Z)<1. The latter ensures that there are no charac-teristics in Z for which the propensity score is zero or one. Proofs go beyond the scope of this work and can be found inRosenbaum and Rubin (1983).
The foundations of evaluation and impact research148
score, only. When P(Z) is known, the problem ofdimensionality can be eliminated. The evaluationof the counterfactual term via matching on thebasis of the group of non-participants then onlyrequires to pair participants with non-participantswhich have the same propensity score. Thisensures a balanced distribution of Z across bothgroups. Unfortunately, P(Z) will not be knowna-priori so it has to be replaced by an estimate.This can be achieved by any number of standardprobability models, for example a probit model.
The empirical power of matching to reduce theproblem of selection bias relies crucially on thequality of the estimate of the propensity score, onthe one hand, and on the existence of compar-ison persons that have equal propensity scoresas the treated persons. If the latter is not ensuredwe run the risk of incomplete matching withbiased estimates (19). Several procedures formatching on the propensity score have beensuggested and will be discussed briefly; a goodoverview can be found in Heckman et al. (1998a)and Smith and Todd (2000). To introduce them amore general notation is needed. We estimate theeffect of treatment for each observation in thetreatment group, by contrasting his/her outcomewith treatment with a weighted average of controlgroup observations j in the following way:
(20)
where N0 is the number of observations in thecontrol group and N1 is the number of observationsin the treatment group and is a weighting functionwhich can take different forms. Matching estima-tors differ in the weights attached to the membersof the comparison group (Heckman et al., 1998a).Nearest neighbour (NN) matching sets:
(21)
Doing so, the non-participant with the value ofthat is closest to is selected as the match, there-fore WN0 N1 (i,j)=1 for this unit and WN0 N1 (i,j)=0otherwise (20). Several variants of nearest neigh-
bour matching are proposed, for example nearestneighbour matching ‘with’ and ‘without replace-ment’. In the former case, a non-participatingindividual can be used more than once as amatch, whereas in the latter case it is consideredonly once. Use of more than one nearest neigh-bour (over-sampling) is also suggested. Nearestneighbour matching runs the risk of bad matches,if the closest neighbour is far away.
This can be avoided by imposing a toleranceon the maximum distance ||Pi-Pj|| allowed. Thisform of matching, caliper matching (Cochraneand Rubin, 1973), imposes the condition:
(22).
where is a pre-specified level of tolerance.Kernel matching (KM) is a non-parametric
matching estimator that uses all individuals in thecontrol group to construct a match for eachprogramme participant. KM defines the weightingfunction as:
(23)
where Kik =K((Pi-Pk)/h) is a kernel thatdown-weights distant observations from Pi and h isa bandwidth parameter (Heckman et al., 1998a).
The matching estimator is very data-demandingin the sense that we need information for partici-pants and non-participants before and after theprogramme took place. In the case of exactmatching, a ‘rich’ dataset is needed to ensure thatwe find comparable individuals in the controlgroup for every combination of observable charac-teristics. Even if we do not use exact matching butmatching over the propensity score, a rich datasetis needed. In that case the quality of the scoredepends on our ability to account for all relevantcovariates that determine the participation deci-sion. Problems arise, if a programme is compul-sory, for example if all the unemployed have toparticipate in a training programme at a certainpoint in their unemployment spell. In this case itmight get difficult to find a suitable control group,
W i, jK
KNij
k (D ) ik0( ) ,=
∑ ∈ = 0
P P j Ni j− < ∈e, 0
C(P P P , j Nij
i j ) .= − ∈min 0
Y W i j Yi N N jj D
1 0
00 1
− ∑∈ ={ }
( , ) ,
(19) Matching was much discussed in recent econometric literature. Heckman and his colleagues reconsidered and further devel-oped the identifying assumptions of matching stated by Rubin (1977) and Rosenbaum and Rubin (1983). It turns out that thenew identifying assumptions are weaker compared to the original statements which brings along some advantages. Presentingthese ideas goes beyond the scope of this work. The interested reader should refer to Heckman et al. (1996, 1997, 1998a andb) and Heckman and Smith (1995).
(20) Exact matching imposes an even stronger condition, where only non-participants with exactly the same propensity score orthe same realisation of characteristics X are considered as matches.
Methods and limitations of evaluation and impact research 149
because all the unemployed will be in theprogramme at some time. However, it is stillpossible to evaluate the optimal timing of aprogramme, for example after three, six or12 months of unemployment.
2.2.5. Difference-in-differences estimatorIt has been claimed that controlling for selectionon observable characteristics may not be suffi-cient since remaining unobservable differencesmay still lead to a biased estimation of treatmenteffects. These differences may arise from differ-ences in the benefits which individuals expectfrom participation in a treatment, which mightinfluence their decision to participate. Further-more, some groups might exhibit badlabour-market prospects or differences in motiva-tion. These features are unobservable to aresearcher and might cause a selection bias.
To account for selection on unobservables,Heckman et al. (1999) suggest econometricselection models and difference-in-differences(DID) estimators. The DID estimator requiresaccess to longitudinal data and can be seen asan extension to the classical BAE. Whereas theBAE compares the outcomes of participants afterthey participate in the programme with theiroutcomes before they participate, the DID esti-mator eliminates common time trends bysubtracting the before-after change in non-partic-ipant outcomes from the before-after change forparticipant outcomes. The simplest application ofthe method does not condition on X and formssimple averages over the group of participantsand non-participants. Changes in the outcomevariable Y for the treated individuals arecontrasted with the corresponding changes fornon-treated individuals (Heckman et al, 1998a):
(24)
The DID estimator is based on the assumptionof time-invariant linear selection effects. The crit-ical identifying assumption of this method is thatthe biases are the same, on average, in differenttime periods before and after the period of partic-ipation in the programme, so that differencing thedifferences between participants and non-partici-pants eliminates the bias (Heckman et al., 1998a).
To make this point clear, we assume that wewant to evaluate a training programme that aimsto improve the employment prospects of individ-uals. And let us further assume that the partici-pants have a higher motivation and, owing to thishigher motivation, the outcome for participants ison average 5% higher than for non-participants.If we additionally presume that this bias remainsconstant over time, we can estimate the effect ofa programme by comparing the pre- andpost-programme differences of the participantsand non-participants. Let us say that the partici-pants had an average outcome of 50% in theperiod before the programme took place, that thetreatment effect is 10% and, owing to a cyclicalupswing, the outcome is increased by 15%.Therefore the participants have an averageoutcome of 75% in the period after theprogramme took place. The non-participantshave an average outcome of 45% in the firstperiod (5% less than the participants because ofthe motivational selection effect) and 60% in thesecond period. Comparing the average outcomesfor participants in period two (75%-60%=15%) ismisleading since the selection effect due tounobservable characteristics is not taken intoaccount. The DID estimator, in contrast, leads tothe correct result of 10% (21). Through the differ-encing procedure, the cyclical upswing iscorrectly not attributed to the programme andneither is the motivational effect.
This example can be formally explained bydenoting the outcome for an individual at time t as:
(25)
where α it captures the effects of selection onunobservables. The validity of the DID estimatorrelies crucially on the assumption:
α it =α it’ . (26)
Only if the selection effect is time-invariant willit be cancelled out and an unbiased estimateresult. The differencing leads to:
(27)
Y Y D Y D Y
D Y D Y
it it' it it it it
it' it' it' it'
it it'
− = ⋅ + − ⋅ −
⋅ + − ⋅ +−
[ ( ) ]
[ ( ) )
[ ].
1 0
1 0
1
1
a a
Y D Y D Yit it it it it it= + ⋅ + − ⋅α 1 01( ) ,
∆DIDt t' t t'Y Y D Y Y D= − = − − =[ ] [ ].1 0 0 0
1 0
(21) Difference for participants: (75%-50%) = 25%; difference for non-participants: (60%-45%) = 15%; DID estimator: 25%-15% =10%.
The foundations of evaluation and impact research150
If (26) is fulfilled, the last term in the expressioncan be cancelled out, leading to an unbiasedestimate. Compared to the method of matching,the DID approach does not require that the biasvanishes for any ‘matched’ individuals, but onlythat it remains constant (Heckman et al., 1998a).
If we condition the DID approach on observablecharacteristics X, the new estimator is given by:
(28)
The identifying assumption of this method is:
(29)–
Ashenfelter’s dip is definitely a problem for theDID estimator. If the dip is transitory and is even-tually restored even in the absence of participa-tion in the programme, the bias will not averageout. Therefore Bergmann et al. (2000) apply acombination of the matching- and the DID esti-mator in a recent paper, by implementing a‘conditional DID estimator’, where conditionalmeans that treatment and control groups arealready partly comparable regarding their observ-able characteristics. Kluve et al. (1999) suggestusing the pre-treatment (labour market) historiesof the individuals as an important variable in thematching process, so that only individuals withidentical pre-treatment histories are compared.Basically the conditional DID estimator extendsthe one suggested from Heckman et al. (1998a)by adding a longitudinal dimension. The basicquestion in this case is deciding the appropriatetime span to be considered.
2.2.6. Duration modelsAn alternative approach to modelling treatmenteffects of ALMP is the application of durationmodels. The basic idea here is to include theduration of (un)employment and the duration ofthe programmes when estimating effects. In abivariate duration model the durations Tu and Tp
measure the duration of unemployment until entryinto employment and the duration until entry intoALMP, respectively. Tu and Tp are random vari-ables, tu and tp denote their realisations. We areinterested in the causal effect of participation inALMP on exit from unemployment, that is theeffect of the realisation of Tp on the distribution ofTu. This implies that the causal effect is captured
by the effect of tp on the hazard rate for jobfinding: θu(t|Tp,x,v) for t>tp.
The transition rate from unemployment toemployment at time conditional on and can bespecified by a mixed proportional hazard modelas follows:
(30)
where I(.) denotes the indicator function, which is1 if its argument is true and 0 otherwise. Thefunction λu(t) is called the ‘baseline hazard’ indi-vidual duration dependence. δ measures theeffect of the participation in ALMP on the transi-tion rate from unemployment to employment, x isa vector of explanatory variables, µuz measureswhether there is any benefit exhaustion effect andthe term du represents unobserved heterogeneity.In a similar way, the hazard rate to programme pat time t conditional on x and dz can be specifiedin the following equation:
(31)
In the equation for θu and θp, unobservedheterogeneity is allowed to affect the transitionsto both a job and to a programme.
‘If the unobserved characteristics have a nega-tive effect on the job-finding rate and a positiveeffect on the transition to a programme, thenconditional on the observed characteristics andthe elapsed duration of unemployment, theaverage quality of workers in a programme islower than the average quality of workers who donot enter a programme. Then, if we would simplycompare the transition rates to regular jobs ofboth groups we would compare workers withunfavourable characteristics and programmeparticipation with workers with more favourablecharacteristics and non-participation. Therefore,we would underestimate the true effect of partic-ipating in a programme. The opposite effect isalso possible. One could imagine that the peoplein control of the programmes want theirprogrammes to be a success. Therefore theyprefer workers with good characteristics to flowinto their programme. This would imply that thereis a positive correlation between unobservedheterogeneity components in both transitionrates. Then we would overestimate the treatmenteffect of programmes.’ (Lalive et al., 2000).
q b mp z u p pz z pt|x,d (t) x' d v( ) ( ).= ⋅ + +λ exp
µp uz z uI t t d v( ) ),⋅ > + ⋅ +
θ λ β δu p z u u u pt x,t ,d ,v (t) exp x' t t ,x( | ) ( ( | )= ⋅ + ⋅
X D' | , ).0 0
0=YtE Y Y X D E Yt t' t( | , ) (1 0 0
1− = =
∆DID
t t' t t'Y Y X,DX
= − = − − =[ | ] [ | , ].1 0 0 0
1 0Y Y X D
Methods and limitations of evaluation and impact research 151
The authors of the empirical studies assumefor the joint distribution of the unobserved char-acteristics G(vu, vp) a multivariate discrete distri-bution using a multinomial logit specification(Heckman and Singer, 1984).
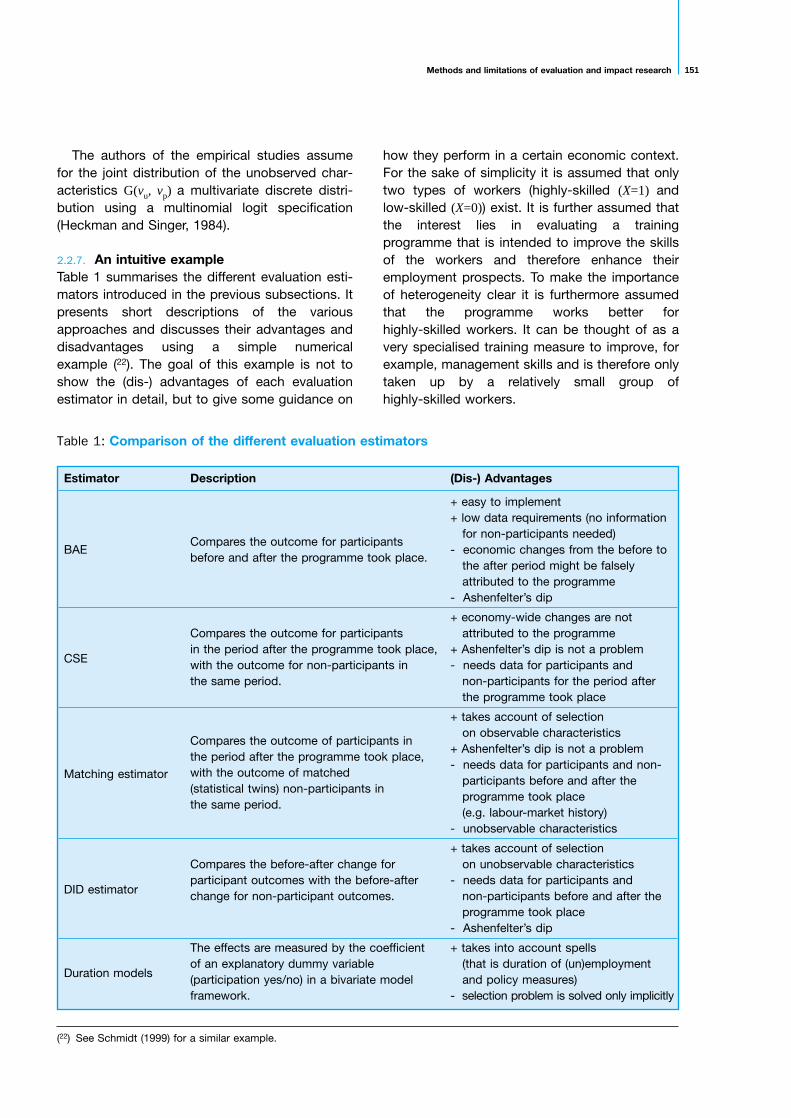
2.2.7. An intuitive exampleTable 1 summarises the different evaluation esti-mators introduced in the previous subsections. Itpresents short descriptions of the variousapproaches and discusses their advantages anddisadvantages using a simple numericalexample (22). The goal of this example is not toshow the (dis-) advantages of each evaluationestimator in detail, but to give some guidance on
how they perform in a certain economic context.For the sake of simplicity it is assumed that onlytwo types of workers (highly-skilled (X=1) andlow-skilled (X=0)) exist. It is further assumed thatthe interest lies in evaluating a trainingprogramme that is intended to improve the skillsof the workers and therefore enhance theiremployment prospects. To make the importanceof heterogeneity clear it is furthermore assumedthat the programme works better forhighly-skilled workers. It can be thought of as avery specialised training measure to improve, forexample, management skills and is therefore onlytaken up by a relatively small group ofhighly-skilled workers.
(22) See Schmidt (1999) for a similar example.
Estimator Description (Dis-) Advantages
+ easy to implement + low data requirements (no information
BAECompares the outcome for participants
for non-participants needed)
before and after the programme took place.- economic changes from the before to
the after period might be falsely attributed to the programme
- Ashenfelter’s dip
+ economy-wide changes are notCompares the outcome for participants attributed to the programme
CSEin the period after the programme took place, + Ashenfelter’s dip is not a problemwith the outcome for non-participants in - needs data for participants and the same period. non-participants for the period after
the programme took place
+ takes account of selectionon observable characteristics
Compares the outcome of participants in + Ashenfelter’s dip is not a problem
Matching estimatorthe period after the programme took place,
- needs data for participants and non-with the outcome of matched
participants before and after the (statistical twins) non-participants in
programme took place the same period.
(e.g. labour-market history)- unobservable characteristics
+ takes account of selectionCompares the before-after change for on unobservable characteristics
DID estimatorparticipant outcomes with the before-after - needs data for participants andchange for non-participant outcomes. non-participants before and after the
programme took place- Ashenfelter’s dip
The effects are measured by the coefficient + takes into account spells
Duration models of an explanatory dummy variable (that is duration of (un)employment(participation yes/no) in a bivariate model and policy measures)framework. - selection problem is solved only implicitly
Table 1: Comparison of the different evaluation estimators

The foundations of evaluation and impact research152
Table 2 displays the labour-market outcomesof the workers who received (D=1) and did notreceive (D=0) treatment. Columns 2 and 3 showthe labour-market outcomes for non-participantsbefore (Yt’ ) and after (Yt) the programme tookplace. Column 5 contains the pre-programmeoutcome of participants (Yt’ ), whereas column 7contains the post-programme outcome of partic-ipants (Yt+∆). All these outcomes are actuallyobserved. Column 6 contains the counterfactualoutcome under no treatment for participants.Clearly, this outcome is never observed in an
empirical study but allows us to answer the ques-tion ‘What would have happened to the partici-pants if they had not participated?’. Theprogramme impact can be calculated bycomparing the actual outcome of the participantsafter the programme took place (Yt+∆) with theircounterfactual outcome under no treatment (Yt).Again it is important to note that a researcher willnot be able to do so since column 6 is unobserv-able. This unobservable outcome is only intro-duced as a reference level to illustrate the func-tioning of the different estimators.
Table 2: Labour-market outcomes for participants and non-participants
Non-Participants (D = 0) Participants (D = 1)
Low-skilled workers (X = 0)
Worker Yt’ Yt Worker Yt’ Yt Yt+Delta
1 0 1 11 0 0 1
2 0 0 12 0 0 0
3 0 0 13 0 0 0
4 0 0 14 0 1 1
5 0 0 15 0 1 1
6 1 1 16 0 0 0
7 1 1 17 0 1 1
8 1 1 18 1 1 1
9 1 1 19 1 1 1
10 1 1 20 1 0 1
Mean 0.5 0.6 0.3 0.5 0.7
Highly-skilled workers (X = 1)
Worker Yt’ Yt Worker Yt’ Yt Yt+Delta
21 0 0 31 0 0 1
22 0 1 32 0 1 1
23 0 0 33 0 0 1
24 1 1 34 1 1 1
25 1 1 35 1 1 1
26 1 1
27 1 1
28 1 1
29 1 1
30 1 1
Mean 0.7 0.8 0.4 0.6 1
Methods and limitations of evaluation and impact research 153
The two skill groups will be discussed sepa-rately.
In the group of low-skilled workers there are10 non-participants (workers 1-10) and 10 partic-ipants (workers 11-20). 50 % of the non-partici-pants are employed in both periods and for onenon-participant the labour-market situationimproves over time (worker 1). In the group ofparticipants only 30 % are employed in the firstperiod. For three workers (workers 14, 15 and 17)the situation would have improved even inabsence of the training programme (Yt), whereasfor one worker (worker 20) it would have wors-ened. The programme impact can be estimatedby comparing columns 7 and 6. The programmeimproves the employment prospects fortwo workers (workers 11 and 20) and thereforethe effect is 0.2. The following is how aresearcher would calculate the programmeimpacts with some of the presented estima-tors (23).
The BAE invokes the identifying assumptionthat the pre-training outcome of the participantsrepresents a valid description of their unobserv-able counterfactual outcome in the post-trainingperiod (equation 7). Therefore the estimator iscalculated by comparing the outcome in column7 (0.7) with the outcome in column 5 (0.3) andleads to a result of 0.4. Clearly, this estimatorattributes all improvement in the employmentsituation between the two periods to theprogramme. But since, in our example, the situa-tion for two workers would have improvedanyway, for example due to an overall economicimprovement, the BAE overestimates the realimpact.
The implementation of the cross-section esti-mator requires that the population average of theobserved outcome of the non-participants isequal to the population average of the unobserv-able outcome of participants (equation 10).Therefore the estimator is calculated bycomparing the actual outcome for participants(workers 11-20) in period t (average: 0.7,column 7) with the actual outcome for non-partic-ipants (workers 1-10) in the same period(average: 0.6, column 3). The estimated impact
would be 0.1. This is due to the fact that theconstructed labour-market situation for non-participants in t (average: 0.6, column 3) is verysimilar to the counterfactual labour-market situa-tion for participants (average: 0.5, column 6).
A matching estimator replaces the counterfac-tual outcome of the participants with the popula-tion average of a matched control group. In thisexample there is only one available matchingvariable, namely the labour-market situationbefore training. Estimation is then simply done bycomparing the outcome in t of workers 11-17(average: 0.57, column 7) with the outcome ofworkers 1-5 (average: 0.2, column 3) on the onehand and between workers 18-20 (average: 1.0,column 7) and 6-10 (average: 1.0, column 3) onthe other. The estimated impact is then aweighted average (by the number of participants)between both groups. The effect in the first group(seven participants unemployed before training) is0.37, the effect in the second group is 0(three workers employed before training). Theweighted average is, therefore, (0.37 x 7/10) =0.26.
Finally, a DID estimator eliminates commontime trends by subtracting the before-afterchange in non-participant outcomes from thebefore-after change for participant outcomes. Inour example we form simple averages over thegroup of participants and non-participants andcontrast changes in the labour-market situationfor the treated individuals with the correspondingchanges for non-treated individuals. The esti-mated impact in the example is then(0.7 – 0.3) – (0.6 – 0.5) = 0.3. Since the increase inpotential non-treatment outcome is higher forparticipants (0.2 vs. 0.1), the DID overestimatesthe true treatment effect.
The same calculations can be done for thegroup of highly-skilled workers. This groupcontains 10 non-participants (workers 21-30)and five participants (workers 31-35). 60 % ofthe participants are unemployed before trainingand only one (worker 32) would have experi-enced an improvement in his labour-market situ-ation without training. The programme effect inthe group of highly-skilled workers is 0.4. The
(23) For the sake of simplicity this numerical example has been kept on a basic methodological level. Therefore, more complexestimators like the conditional DID or the duration models could not be illustrated and the focus lies on the BAE, CSE, DID andthe exact matching estimator.
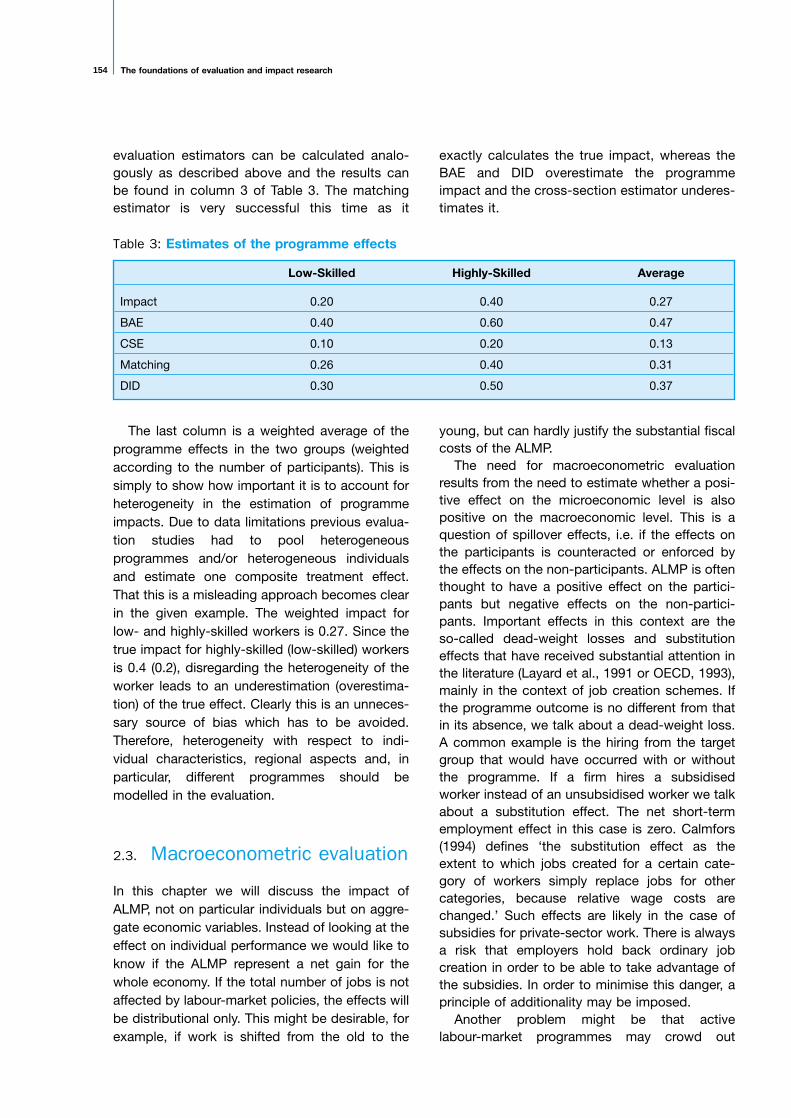
The foundations of evaluation and impact research154
evaluation estimators can be calculated analo-gously as described above and the results canbe found in column 3 of Table 3. The matchingestimator is very successful this time as it
exactly calculates the true impact, whereas theBAE and DID overestimate the programmeimpact and the cross-section estimator underes-timates it.
The last column is a weighted average of theprogramme effects in the two groups (weightedaccording to the number of participants). This issimply to show how important it is to account forheterogeneity in the estimation of programmeimpacts. Due to data limitations previous evalua-tion studies had to pool heterogeneousprogrammes and/or heterogeneous individualsand estimate one composite treatment effect.That this is a misleading approach becomes clearin the given example. The weighted impact forlow- and highly-skilled workers is 0.27. Since thetrue impact for highly-skilled (low-skilled) workersis 0.4 (0.2), disregarding the heterogeneity of theworker leads to an underestimation (overestima-tion) of the true effect. Clearly this is an unneces-sary source of bias which has to be avoided.Therefore, heterogeneity with respect to indi-vidual characteristics, regional aspects and, inparticular, different programmes should bemodelled in the evaluation.
2.3. Macroeconometric evaluation
In this chapter we will discuss the impact ofALMP, not on particular individuals but on aggre-gate economic variables. Instead of looking at theeffect on individual performance we would like toknow if the ALMP represent a net gain for thewhole economy. If the total number of jobs is notaffected by labour-market policies, the effects willbe distributional only. This might be desirable, forexample, if work is shifted from the old to the
young, but can hardly justify the substantial fiscalcosts of the ALMP.
The need for macroeconometric evaluationresults from the need to estimate whether a posi-tive effect on the microeconomic level is alsopositive on the macroeconomic level. This is aquestion of spillover effects, i.e. if the effects onthe participants is counteracted or enforced bythe effects on the non-participants. ALMP is oftenthought to have a positive effect on the partici-pants but negative effects on the non-partici-pants. Important effects in this context are theso-called dead-weight losses and substitutioneffects that have received substantial attention inthe literature (Layard et al., 1991 or OECD, 1993),mainly in the context of job creation schemes. Ifthe programme outcome is no different from thatin its absence, we talk about a dead-weight loss.A common example is the hiring from the targetgroup that would have occurred with or withoutthe programme. If a firm hires a subsidisedworker instead of an unsubsidised worker we talkabout a substitution effect. The net short-termemployment effect in this case is zero. Calmfors(1994) defines ‘the substitution effect as theextent to which jobs created for a certain cate-gory of workers simply replace jobs for othercategories, because relative wage costs arechanged.’ Such effects are likely in the case ofsubsidies for private-sector work. There is alwaysa risk that employers hold back ordinary jobcreation in order to be able to take advantage ofthe subsidies. In order to minimise this danger, aprinciple of additionality may be imposed.
Another problem might be that activelabour-market programmes may crowd out
Low-Skilled Highly-Skilled Average
Impact 0.20 0.40 0.27
BAE 0.40 0.60 0.47
CSE 0.10 0.20 0.13
Matching 0.26 0.40 0.31
DID 0.30 0.50 0.37
Table 3: Estimates of the programme effects
Methods and limitations of evaluation and impact research 155
regular employment. This can be seen as ageneralisation of the so-called displacementeffect. This effect typically refers to displacementin the product market; for example, firms withsubsidised workers may increase output, whileoutput may be reduced in firms that do not havesubsidised workers. Clearly these effects have tobe taken into account before making statementsabout the net effect of ALMP.
To derive the empirical model for a macroe-conometric evaluation, the theoretical analysis ofALMP becomes crucial. This is because thespecification of the empirical model matters inaddition to the outcome (i.e. dependent) variable.Calmfors (1994) shows how a theoretical frame-work can be developed to allow an analysis ofALMP. He presents the ‘revised Layard-Nickellmodel’ as a basic framework for the analysis ofthe effects of ALMP on a number of economicvariables and processes that influence aggregateemployment and unemployment rates. Therefore,such a framework can be used to identify thedifferent effects of ALMP on the whole economy.Following the discussion of Calmfors (1994),important effects of ALMP are considered below.
The first effects relate to the matching process.ALMP can improve matching between workersand jobs through several channels. First, ALMPcan improve the active search behaviour ofparticipants. Second, ALMP can speed up thematching process by adjusting the structure oflabour supply to demand. Here we primarily thinkof retraining programmes that adapt the skills ofthe unemployed to the requirements of vacantjobs. Third, participation in an ALMP programmecan serve as a substitute for work experiencethat reduces the employer’s uncertainty about theemployability of the job applicant.
If ALMP can improve the matching process,what are the effects on regular employment orwages? First, an improved matching processmeans that for a given stock of vacancies there isa greater inflow into employment (24). Further-more, the improved matching process reducesthe average duration that a vacancy remainsunfilled. Since this reduces the costs of main-taining a vacancy, firms provide more vacancies,which is equivalent to an increase in labourdemand. The same effect also improves the firm’s
position in a wage bargaining process, since thefirm can expect to fill a vacancy much quicker if aworker was laid off. Therefore, improvedmatching also leads to a reduction in wages.
ALMP programmes are also expected to havenegative effects on the matching process, i.e.so-called locking-in effects. If a participation in anALMP programme is associated with full timeengagement, there might be insufficient time foractively searching for a regular job. In this case, thesearch effectiveness of participants is lower thanthe search effectiveness of the unemployed (Holm-lund and Linden, 1993). Since this locking-in effectvanishes the moment the programme expires, dothe positive effects on the search effectivenesspersist after the participation has ended?
A second potential effect of ALMP is reducedwelfare losses for the unemployed. If an ALMPprogramme increases re-employment probability orif the compensation level is higher than the unem-ployment benefits, the ALMP programme increasesthe expected welfare of the unemployed. This iscaused by the fact that an unemployed personfaces a positive probability of being placed in aprogramme with a consequent rise in the expectedincome. In the context of a wage bargainingprocess this is the same as an increase in fallbackincome, i.e. the income that is obtained if thebargaining fails and the worker becomes unem-ployed (Layard et al., 1991). The rise in the fallbackincome leads to a higher outcome for wages, sincethe position of the workers in the bargainingprocess is improved. This effect of ALMP on wagepressure is not avoidable, since every improvementof the situation of the unemployed is connectedwith a reduction in the welfare losses.
There is also a competition effect, in thatALMP (especially training programmes) areexpected to improve the skills of participants andso make them more competitive. This means thatnot only is there improved competition betweenthe unemployed, but also improved competitionbetween the employed and the unemployed.Additionally, ALMP can affect competition if itstimulates participants to search more actively(i.e. to counteract the discouraged worker effect)or if it helps to increase labour-force participation.In both cases there is a rise in the effective laboursupply, which leads to a reduction in wages.
(24) This is equivalent to an inward shift of the Beveridge Curve, i.e. a reduction of the unemployment rate for a given vacancy rate.
The foundations of evaluation and impact research156
Finally, there are productivity effects. ALMPprogrammes that improve the skills of partici-pants or serve as a substitute for work experi-ence can be expected to improve or to maintainthe productivity of participants.
The productivity effect refers to firms being ableto produce more (or better quality) for given costs,particularly wages. Therefore, productivity isthought to be the marginal product of labour, i.e.the output of an additional hour of work. In an arti-ficial model economy these measures would beequal to the wage rate. However, as most Europeaneconomies face enormous wage rigidities, i.e.wages are not perfectly correlated with productivity.Considering a conventional labour-demand condi-tion, a rise in productivity would lead to an increasein employment for a given wage rate. Calmfors(1994) notes that the rise in productivity is notself-evident, because there is also an opportunity toproduce the same output with fewer, but more effi-cient, workers. Additionally, Calmfors et al. (2002)note that the rise in productivity of the participantsmay also have a wage-raising effect through a risein the reservation wage of the participants.
Such a theoretical analysis should serve as aguideline for an empirical analysis of the impacts ofALMP. The impacts on matching efficiency, i.e. theestimation of aggregated matching functions, arethe most frequent types of macroeconometric eval-uations. Other types of empirical models are thereduced form relationships, in order to estimate theoverall effect, i.e. the effect through the differentchannels, on employment or unemployment.Although such a model does not provide a differ-entiated picture of the effects of ALMP, it is able toquantify the net effect on the whole economy.
Another concern regarding macroeconometricevaluations is a serious simultaneity problem. Ingeneral, deciding how much money is spent onALMP directly relates to the situation in the labourmarket. Spending on ALMP should, therefore, bedetermined by a policy reaction function. As aresult, ALMP activity does not only determine thedependent variable in a macroeconometric evalu-ation; the dependent variable also determinesALMP activity. This classical simultaneity problemdoes not allow for identification of the parametersof ALMP measures. To solve this problem, instru-mental variable (IV) estimators should be used forthe estimation. Therefore, the main problem is tofind valid and good instruments. The validity of
the instruments refers to the requirement that theinstrument should not be determined by thedependent variable. The requirement for a goodinstrument is that the set instruments should beable to explain significantly the ALMP activity.From a practical point of view, the problem offinding an appropriate set of instruments isclearly a problem of data availability. Therefore, inmost cases where not enough data is available, agood strategy is to use lagged values for theALMP measures as instruments.
2.4. Cost-benefit analysis (CBA)
The previous sections introduced a number ofeconometric methods which can be used toassess the impacts of social programmes.Microeconometric evaluation studies are able todisclose whether social programmes have animpact on the individual. In addition, macroe-conometric studies can cope with external effectsthat have to be taken into account. They are anecessary first step in assessing the value andmerits of social programmes. If, for example, amicroeconometric evaluation reveals that acertain programme has no impact at individuallevel, it hardly makes sense to complement it witha CBA and to assess its financial effectiveness.
Conducting a CBA widens the perspective ofan impact analysis. A CBA is a method thatprovides a consistent, explicit and transparentprocedure to evaluate public projects in terms oftheir consequences, i.e. in terms of their costsand benefits. The aim of a CBA is an efficientallocation of scarce resources, allowing it to serveas a normative tool in social decision-making. It issimilar to a commercial profitability calculationconducted by private establishments. There are,however, also differences in that a CBA considersadditional aspects, such as equity and distribu-tional aims, and takes into account all costs andbenefits to society as a whole.
The growth of public spending for socialprogrammes has increased interest in a system-atic evaluation in terms of costs and benefits.Originally, CBA was applied to technical projects,such as water resources, or engineering projectssuch as highways. It was not easy to transferthese techniques to social programmes becausesuch programmes often involve impacts which
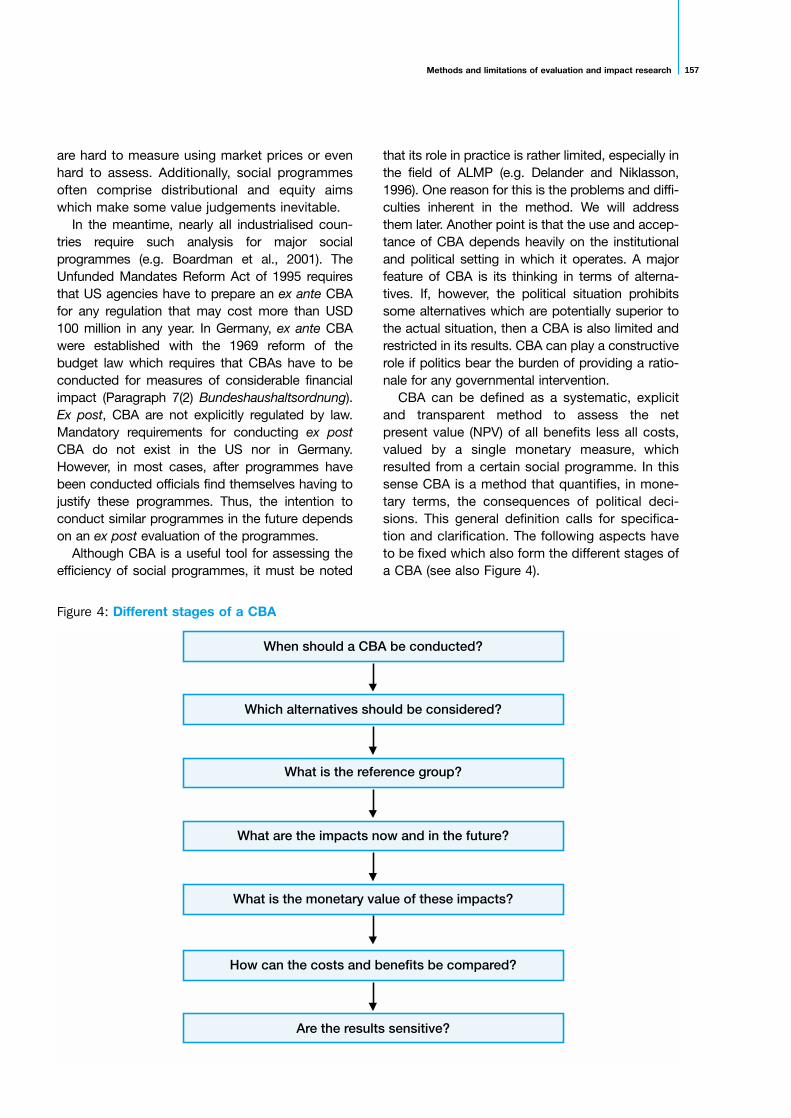
Methods and limitations of evaluation and impact research 157
are hard to measure using market prices or evenhard to assess. Additionally, social programmesoften comprise distributional and equity aimswhich make some value judgements inevitable.
In the meantime, nearly all industrialised coun-tries require such analysis for major socialprogrammes (e.g. Boardman et al., 2001). TheUnfunded Mandates Reform Act of 1995 requiresthat US agencies have to prepare an ex ante CBAfor any regulation that may cost more than USD100 million in any year. In Germany, ex ante CBAwere established with the 1969 reform of thebudget law which requires that CBAs have to beconducted for measures of considerable financialimpact (Paragraph 7(2) Bundeshaushaltsordnung).Ex post, CBA are not explicitly regulated by law.Mandatory requirements for conducting ex postCBA do not exist in the US nor in Germany.However, in most cases, after programmes havebeen conducted officials find themselves having tojustify these programmes. Thus, the intention toconduct similar programmes in the future dependson an ex post evaluation of the programmes.
Although CBA is a useful tool for assessing theefficiency of social programmes, it must be noted
that its role in practice is rather limited, especially inthe field of ALMP (e.g. Delander and Niklasson,1996). One reason for this is the problems and diffi-culties inherent in the method. We will addressthem later. Another point is that the use and accep-tance of CBA depends heavily on the institutionaland political setting in which it operates. A majorfeature of CBA is its thinking in terms of alterna-tives. If, however, the political situation prohibitssome alternatives which are potentially superior tothe actual situation, then a CBA is also limited andrestricted in its results. CBA can play a constructiverole if politics bear the burden of providing a ratio-nale for any governmental intervention.
CBA can be defined as a systematic, explicitand transparent method to assess the netpresent value (NPV) of all benefits less all costs,valued by a single monetary measure, whichresulted from a certain social programme. In thissense CBA is a method that quantifies, in mone-tary terms, the consequences of political deci-sions. This general definition calls for specifica-tion and clarification. The following aspects haveto be fixed which also form the different stages ofa CBA (see also Figure 4).
Figure 4: Different stages of a CBA
When should a CBA be conducted?
Which alternatives should be considered?
What is the reference group?
What are the impacts now and in the future?
What is the monetary value of these impacts?
How can the costs and benefits be compared?
Are the results sensitive?
2.4.1. Time of a CBAIn deciding when to conduct a CBA, one has tochoose between ex ante, ex post and in-medias-res,see Boardman et al. (2001), who also introduceda fourth category, namely one which comparesan ex ante CBA with an ex post CBA. An ex anteCBA is conducted before the project is actuallyimplemented. Its major advantage is that there isstill time to change certain aspects of theprogramme. The result of an ex ante CBA indi-cates whether a certain programme should beimplemented or not. If more than one programmehas been evaluated, it can help in deciding whichone to choose. Its major drawback is the fact thatmost of the benefits or costs will arise in thefuture and thus have to be estimated with uncer-tainty. Although plagued with these uncertainties,ex ante CBA are useful for decision-makingpurposes because it is still possible to makedifferent use of the resources.
In contrast, ex post CBA are conducted whenthe programme has already been implementedand all costs are irreversibly ‘sunk’. They providemore accurate and detailed information about asocial programme since they do not rely on esti-mates and can also be used to learn more aboutsimilar programmes which are still to be imple-mented. It should be mentioned, however, thatthey suffer from the same problems as ex anteCBA when looking at the medium/long-termbenefits of social programmes, which again haveto be predicted. In-medias-res CBA areconducted during the life course of a socialprogramme. They share some advantages anddisadvantages of ex ante and some of ex postCBA. If, for example, there are only low sunkcosts, in-medias-res CBA can be used to shiftresources to other more desirable projects. If thesunk costs are quite high, they only might, as wasthe case for ex post CBA, give a concludingassessment of the project.
2.4.2. Selection of the alternativesSelection of the alternatives concerns the identifi-cation of the project options to be evaluated.Every social programme aims at one specifictarget, such as improving the labour-marketprospects of disabled persons (e.g. Delander andNiklasson, 1996). Alternative policy instrumentsto achieve this aim could be for example wagesubsidies or increasing public employmentopportunities. Although research could make
some proposals on potential alternatives, theavailable policy alternatives must be given by thepolicy-maker and are beyond the function of theanalyst conducting a CBA.
This is important when interpreting the resultsof a CBA. If a CBA identifies one alternative asthe optimal one, i.e. one with the highest presentvalue of net-benefits, this only refers to the alter-natives under consideration. There could be otheralternatives with an even higher benefit whichwere not considered in the CBA.
2.4.3. Defining the reference group Defining the reference group means decidingwhose costs and benefits count, i.e. whose inter-ests should be considered. Different perspectivesare possible. One perspective is to differentiatebetween the target group, the non-target groupand society as a whole. Additionally, one caninclude financiers as a separate group. A furtheralternative is the distinction between a local andglobal perspective. The choice of a certainperspective is given by the institutions who haveordered the analysis and is, therefore, not thefunction of the analyst. The perspective heavilyinfluences which impacts have to be considered.
A profitability analysis in private establishmentscan be regarded as a CBA where only the privatebenefits, i.e. revenues, and private costs areconsidered. The net benefit is in this case iden-tical to the firm’s profits. A social CBA on theother hand, i.e. one which takes the perspectiveof the society as a whole, extends those privatecosts and benefits by including all impacts of theprogrammes whether they are private or social,tangible or intangible, direct or indirect.
The target group consists of those individualswho are eligible for the programme under consid-eration. If we consider a labour-marketprogramme aimed at improving the labour-marketprospects of disabled persons, the benefits forthe target group consist of the effects of theseprogrammes on the employment probability andwages. The costs, which have to be covered bythis group, consist of earnings and transfers fromwhich the participants have to abstain during theparticipation, i.e. opportunity costs of foregoneincome.
If we look at the group of non-participants,additional benefits and costs arise. Benefitswhich have to be taken into account in thisperspective would be the additional output
The foundations of evaluation and impact research158
Methods and limitations of evaluation and impact research 159
attributable to the participants after they havefinished the programme, the increasing taxpayments, and more intangible impacts such asreduced delinquency. Costs which arise for thisgroup are the expenditures for operating theprogrammes and the opportunity costs for theparticipants during participation. Aggregatingthese two views provides the social perspectivewhich yields the net-benefit effect of theprogramme. This perspective yields the mostcomplete, exhaustive and most complex view,since it requires the consideration of all possibleimpacts of a programme.
2.4.4. Enumerate and forecast all impactsProbably the most crucial and important step inconducting a CBA consists of a completeenumeration of all impacts of a programme ascosts and benefits, with a forecast of theseimpacts over the lifetime of the project. A condi-tion for the identification of the impacts of aprogramme is the existence of a model whichgives us the cause-and-effect relationshipbetween the programme under consideration andthe costs and benefits perceived by the targetgroup. For some impacts this relationship isobvious, for example there is no doubt thatmeasures for the disabled will influence theirlabour-market prospects or that the constructionof a highway will reduce travel costs. The effectssocial programmes might have on more intan-gible factors, for example decreasing delinquencyor more equity, are much harder to assess.
Impacts can be classified into real and mone-tary, direct and indirect, tangible or intangible,final or intermediate and, finally, internal orexternal effects. Real impacts mean the finalimpact on the social welfare, i.e. the final utilitygain or loss of a programme, whereas monetaryimpacts only change relative prices while havingno real welfare effects. Direct impacts refer to theintrinsic project goal while indirect effects coverthose not intended by the programme. Examplesof indirect effects in the context of labour-marketprogrammes include the displacement effect ordead-weight losses. Final impacts occur at thelevel of the consumer while intermediate impactsoccur at the producer level. The distinctionbetween internal and external impacts is againclosely related to the perspective of the CBA.Internal impacts are those which emerge within apre-specified target group and which could also
be made up of external effects. These couldoccur, for example, if a programme which shouldbring the long-term unemployed back into worknot only increases their employment prospectsbut also has other positive externalities such ascrime reduction. Spillover effects and externali-ties are also responsible for some effects outsidethis group or area. Popular examples for externaleffects are air and noise pollution but could alsocontain positive externalities like those mentionedbefore.
The impacts to be considered depends heavilyon the perspective chosen. In the example of thelabour-market programme for the long-termunemployed, the target group benefits could beincreasing employment probability after finishingthe programme, therefore increasing income andlife quality, reduced alcohol and drug abuse andreduced criminal activity (see for a practical appli-cation Long et al., 1981). Costs for the targetgroup include forgone income while in theprogramme. In respect of society as a whole,additional external benefits, such as avoidedcosts for alternative services and additionalcosts, such as programme expenditure, have tobe taken into account.
Other aims and objectives, which arise at thelevel of the society as a whole and which differ-entiate a CBA from private profitability calcula-tions, are distributional and equity effects. Thepresent value of a social programme onlycontains information on whether the benefitsexceed the costs, i.e. it answers the question ofwhether the programme is efficient. Anotherimportant issue which has to be considered,however, is how these costs and benefits aredistributed within society.
At this point a fundamental problem arises. Inmost cases, evaluating distributional and equitygoals proves very difficult. Every publicly financedmeasure, for example in the area of ALMP,implies redistribution in that it transfers incomefrom the non-participants to the participants ofthe programmes. Usually one Euro taken fromnon-participants is bestowed the same weight asone Euro given to the participants. One could,however, argue in this context that the marginalutility of one Euro is higher for the non-partici-pants, who are assumed to have a lower income,than for the participants and that therefore theweights attached to the participants should be
The foundations of evaluation and impact research160
higher. But since there are no objective and trans-parent methods to measure these weights accu-rately, they must be set within a political contextand are therefore arbitrary and vulnerable to criti-cism.
2.4.5. Measuring and aggregating impactsHaving defined the impacts which have to betaken into account, the next step is to measurethem in monetary terms. Measuring the impacts,i.e. ‘monetising’ them, is the heart of a CBA andalso, in most cases, the most difficult step. Forsome impacts, for example the direct tangibleeffects of a programme, one can rely on marketprices, whereas other impacts, such as savedlives, quality of life or equity are much harder toassess.
The simplest proceeding is an accounting ofthe monetary flows caused by a certainprogramme, for example expenditure on salariesor saved payments for social welfare. Anotherstraightforward possibility, which is especiallyapplicable in the case of tangible effects, is thedirect observation of market prices. Although it isuseful to start with market prices, very often it isnecessary to adjust them in order to includeexternal effects. If, for example, the social costsof labour input into a social programme should beevaluated, and if there is a large amount of invol-untary unemployment, wages may have to beadjusted downwards in order to account for thisidle input factor. This adjustment ensures thatmarket prices correspond to the real net impacton welfare, i.e. to their shadow prices. Only in thecase where there are no market distortions, i.e.when there is perfect competition and no externaleffects, will market prices correspond to theirshadow prices. Market prices can also be used toassess the value of more indirect effects, such asdeclining delinquency. One possibility in thiscontext would be to observe how prices for realestate evolve and to use the increase in theseprices as an approximation for the utility ofdeclining delinquency.
For intangible goods, like the value of a lifesaved or the increasing contentment of peoplewho participate in a labour-market programmeand afterwards find a job, referring to marketprices is not feasible. In this case other methodshave to be applied. One way is to directly ask forthe amount of money individuals are willing topay for a certain measure, for example an
improvement of the air quality or the like. To thisend, a number of questions have been devel-oped. By interpreting the results one has,however, to be aware of the hypothetical featureof these questions and therefore their limitedapplicability. Another way to measure intangiblegoods is the observation of political preferences.By observing, for example, that in the past alife-saving programme had been established thatcost EUR 100 000 and was able to save 10 lives,one could infer that the value of a life amounts toEUR 10 000. Again such indirect inferences haveto be made with care.
When a social perspective is chosen, one addi-tional problem that arises is the aggregation ofindividual costs and benefits. We have addressedthis issue already and also mentioned the prob-lems and difficulties arising in this context. Aggre-gating the individual costs and benefits presup-poses attaching weights to each individual. Dueto the absence of other convincing weightingschemes, equal weights are usually used. Onejustification for this simplification is the following:when the net benefit of a social programme isgreater than zero, the sum of all individual bene-fits exceeds the sum of all individual costs. Inother words, the size of the ‘common cake’increases (e.g. Delander and Niklasson, 1996). Ifthis is the case, there is room for redistribution inthe sense that the losers of the programme arecompensated by the winners. We should note,however, that this indemnification view is onlytheoretical and one has to consider that withsuch redistribution policies, additional costsmight arise which then will influence the netbenefit of the programme.
If it turns out that the problem of measuring theutilities of a social programme cannot be resolvedsatisfactorily, then at least a cost-effectivenessanalysis (CEA) can be conducted. Cost-effective-ness analysis evaluates programmes bycomparing the costs associated with theseprogrammes with a single quantified but notmonetised effectiveness measure. It may be thatin evaluating a health care programme the livessaved by alternative programmes have to beassessed. Conducting a CBA would require thevaluation of the lives saved using monetary units.Instead, the analyst could also assess thedifferent programmes by relating their costs to thelives saved, i.e. by constructing cost-efficiency
Methods and limitations of evaluation and impact research 161
ratios. Another example of a cost-effectivenessanalysis will be given later on.
2.4.6. Comparing costs and benefitsOnce all costs and benefits are itemised andmeasured, another problem which has to beresolved stems from the fact that costs andbenefits do not occur at one point in time butrather follow a dynamic path. In order to comparecosts and benefits which occur in the future withthose which occur now, it is necessary to definea discount rate r. Once a discount rate is found,the flows of costs Ct and benefits Bt can bediscounted to give the net present value NPV of asocial project according to:
(32)
A simple decision rule is to implement a projectif it has a net present value which is larger thanzero and to reject it otherwise. If more than oneproject is evaluated, the one with the largest NPVshould be implemented.
The choice of an appropriate discount rate,however, is contentious. One approach could beto use some market interest rate as an approxi-mation to the social discount rate. The marketinterest rate, however, does not correspond tothe social rate. This is because capital marketsare not perfect and thus the time preferences ofindividuals do not correspond to market interestrates. Other points responsible for this departureare, for example, uncertainty about future inflationand the existence of tax effects which will bereflected in market rates.
In most programmes, costs occur during imple-mentation while the benefits are spread over thefuture. Thus small changes in the discount ratemight have a great impact on the net present valueof the project. The choice of an appropriatediscount rate is crucial in conducting a CBA andtherefore an eligible candidate for a sensitivityanalysis.
An alternative decision rule, which does not relyon a certain discount rate, is to determine theinternal rate of return of the social programme. Theinternal rate of return r of a social programme is
equal to the discount rate for which the net presentvalue of the social programme becomes zero:
(33)
When more than one project is evaluated, theone with the highest internal rate of return ischosen. When only one project is considered, againa reference value is needed. If the internal rate ofreturn is above this reference value, the projectshould be realised. If not, it should be rejected.
This method, however, has some drawbacks. Ifthe flow of net-benefits alters between positiveand negative values during the lifetime of theproject, more than one value for the internal rateof return might fulfil the above equation. Addition-ally, decisions which rely on this rule might differfrom decisions derived by using the net presentvalue of the projects.
2.4.7. Conducting sensitivity testsWhile presenting the necessary steps forconducting a CBA, there are various caveats anddrawbacks which might heavily influence theresults and recommendations. CBA relies on anumber of assumptions and uncertain predic-tions, for example, with regard to the potentialimpacts, the way to measure them and at whichinterest rate to discount them. All these topics areeligible for a sensitivity analysis which examineshow sensitive the NPV results are to differentassumptions about those key parameters. Carefulscenarios, which vary the most importantassumptions, are one way to protect the resultsagainst indicated doubts.
In order to illustrate the above, one hypotheticaland one real case study in the field of ALMP will beused. Let us assume that in a hypothetical situationan economy tries to fight its rising unemploymentby running different measures of ALMP (25). Morespecifically, four different instruments will beconsidered: LMT, youth measures, subsidisedemployment and measures for the disabled. Thefollowing table contains hypothetical figures forexpenditure on these programmes and for thenumber of participants in the different measures.Total expenditure amounts to EUR 33 million, withparticipation by 15 753 individuals.
NPVB C !t t
t= −
+=∑
10
ρ.
NPVB C
rt t
t= −
+∑1
.
(25) Another assumption is that we are only interested in a reduction of overall unemployment. Other programme objectives are notincluded in this simple example.
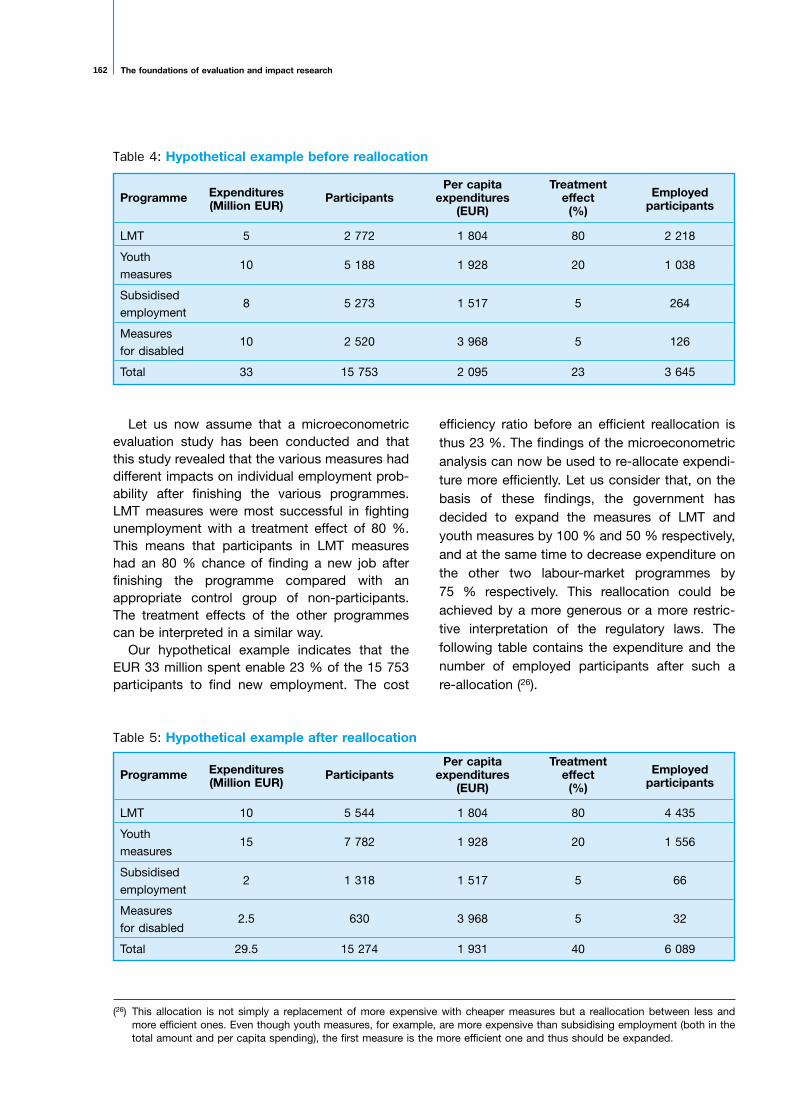
The foundations of evaluation and impact research162
Let us now assume that a microeconometricevaluation study has been conducted and thatthis study revealed that the various measures haddifferent impacts on individual employment prob-ability after finishing the various programmes.LMT measures were most successful in fightingunemployment with a treatment effect of 80 %.This means that participants in LMT measureshad an 80 % chance of finding a new job afterfinishing the programme compared with anappropriate control group of non-participants.The treatment effects of the other programmescan be interpreted in a similar way.
Our hypothetical example indicates that theEUR 33 million spent enable 23 % of the 15 753participants to find new employment. The cost
efficiency ratio before an efficient reallocation isthus 23 %. The findings of the microeconometricanalysis can now be used to re-allocate expendi-ture more efficiently. Let us consider that, on thebasis of these findings, the government hasdecided to expand the measures of LMT andyouth measures by 100 % and 50 % respectively,and at the same time to decrease expenditure onthe other two labour-market programmes by75 % respectively. This reallocation could beachieved by a more generous or a more restric-tive interpretation of the regulatory laws. Thefollowing table contains the expenditure and thenumber of employed participants after such are-allocation (26).
ExpendituresPer capita Treatment
EmployedProgramme(Million EUR)
Participants expenditures effectparticipants(EUR) (%)
LMT 5 2 772 1 804 80 2 218
Youth10 5 188 1 928 20 1 038
measures
Subsidised8 5 273 1 517 5 264
employment
Measures10 2 520 3 968 5 126
for disabled
Total 33 15 753 2 095 23 3 645
ExpendituresPer capita Treatment
EmployedProgramme(Million EUR)
Participants expenditures effectparticipants(EUR) (%)
LMT 10 5 544 1 804 80 4 435
Youth15 7 782 1 928 20 1 556
measures
Subsidised2 1 318 1 517 5 66
employment
Measures2.5 630 3 968 5 32
for disabled
Total 29.5 15 274 1 931 40 6 089
Table 4: Hypothetical example before reallocation
Table 5: Hypothetical example after reallocation
(26) This allocation is not simply a replacement of more expensive with cheaper measures but a reallocation between less andmore efficient ones. Even though youth measures, for example, are more expensive than subsidising employment (both in thetotal amount and per capita spending), the first measure is the more efficient one and thus should be expanded.

Methods and limitations of evaluation and impact research 163
Even with a smaller amount of money, moreparticipants were put back into the workforceand the average treatment effect of allmeasures has nearly doubled. Since an econo-metric evaluation also delivers other valuableinformation, for example for which subgroups ofparticipants which programmes are especiallysuccessful, this gives a first impression of thevalue and the usefulness of econometric evalu-ation studies.
Another real example of a CBA (Long et al.,1981 and Delander and Niklasson, 1996) aimedto assess the effects of a US federal socialprogramme for economically disadvantagedyouths, the Job Corps programme. Thisprogramme is a comprehensive set of services
for disadvantaged youths, such as vocational skilltraining, basic education and health care. The aimof the programme was to increase the employa-bility of the participants.
In order to take account of distributionaleffects, three different perspectives have beenconsidered: the group of participants, the groupof non-participants and an aggregated view ofsociety as a whole. Focusing on the perspectiveof society as a whole addresses the issue of effi-ciency while hints about the distributional conse-quences of the programme can be obtained bylooking at the two groups separately. A widerange of potential benefits and costs have beentaken into account as summarised in thefollowing table:
Table 6: Costs and benefits of the Job Corps programme
Benefits Examples
Output produced by Corps members In-programme output, increased post-programme output, increased tax payments, increased utility due to preferences for work over welfare.
Reduced dependence on transfer programs Reduced transfer payments, reduced administrative costs.
Reduced criminal activity Reduced criminal justices system costs, reduced personal injury and property damage.
Reduced drug/alcohol abuse Reduced treatment costs, increased utility from reduced drug/alcohol dependence.
Reduced utilisation of alternative services Reduced costs of other programmes than the Job Corps.
Other benefits Increased utility from redistribution, increased utility from improved well-being of Corps member.
Costs Examples
Programme operating expenditures Centre operating expenditures, excluding transfers to Corps members, central administrative costs.
Opportunity costs of Corps-member labour Forgone output, forgone tax payments.
The effects of the programme were estimatedusing data from a survey conducted among thegroup of participants and a comparison groupwho were never enrolled in this programme.Since the programme was not constructed as asocial experiment, multiple regression tech-niques, which account for both observable andunobservable effects, had to be employed to esti-mate the treatment effect of the programmes.
The other costs and benefits were valued sothat they reflect the resources saved, consumedor produced as a result of the Job Corp
programme. The benefits arise primarily from twofactors. First, Corps members made less use ofother social programmes and committed fewercrimes. Second, corps members improved theirlong-term employment prospects and increasedtheir contribution to the gross national product(GNP) and tax payments. The effects of thesechanges were valued by multiplying the esti-mated change in the behaviour of the participantsdue to the programme by estimated dollar values.
The contribution of the participants to GNP, forexample, was estimated by using the difference
The foundations of evaluation and impact research164
between the earnings of the Job Corps membersand the non-participants. The implicit assumptionin this procedure is that labour markets arecompetitive, so that the wages are equal to themarginal contribution to the GNP, and that thereare no displacement effects due to theprogramme. Using this method, the authors esti-mated that the total discounted value of theincreased output over the first two years after theend of the programme is USD 925 per partici-pant.
The benefits stemming from reduced delin-quency were estimated by multiplying the esti-mated changes in arrests due to the programmeby the shadow prices, which are equal to the costsavings per avoided arrest. The shadow priceswere calculated by considering the costs causedby arrested persons, for example police custody,arraignment, detention, etc. Costs of the project
mainly comprised operating expenditures for theprogramme centres and central administrationcosts. They represent costs to non-participants.Other categories which do not appear in thefinancial accounts are forgone income of theparticipants and forgone tax payments.
Making a set of assumptions, for examplesetting the discount rate to 5 %, assuming theeffects of the programme to diminish at a rate of50 % every 5 years, the present value of the netbenefits can be estimated. The results suggestthat the programme yields a net benefit to societyand also to the target group. The group ofnon-participants experiences a slightly negativevalue from the programme. The programme wasestimated to represent a socially efficient use ofthe resources and additionally entails redistribu-tion from the group of non-participants to thegroup of participants.
3.1. Recent developments inALMP in the EU
ALMP have been seen as one way to fight therising unemployment rates and the disequilibrium(skill shortage, etc.) in the labour markets whichhave arisen in most European countries since theearly 1970s. Table A.1 in the annex shows stan-dardised unemployment rates in the EU from1985 to 2000. In 1985 the EU average was10.8%. After declining in the following years, itcame back to this value in 1994. In subsequentyears unemployment eased, bringing the ratedown to 6.9% in the year 2000 (27). The averagereduction from 1985 to 2000 was 36%. It is quiteinteresting to compare this with the picture in thedifferent countries. Sweden and Finland had todeal with extraordinary increases in unemploy-ment during this period. The rate rose by 108% inSweden (from 2.8% to 5.9%) and 94% in Finland(from 5.0% to 9.7%). In France there was a slightincrease from 8.3% to 9.3% (+12%), whereas inall the other countries unemployment has fallensince 1985. The biggest decreases can be foundin Ireland (-76%, from 17.7% in 1985 to 4.2% in2000) and the Netherlands (-82%, from 13.1% to2.8%). The remaining countries had decreasesbetween 15% (Germany) and 52% (Portugal).
Whether these reductions are due to ALMP orother factors has to be determined by evaluationstudies, which will be reviewed in the next chapter.We have pointed out already, that the importanceof ALMP has been growing enormously from 1985to 2000. The ratio between ALMP and PLMP hasrisen from 0.44 in 1985 to 0.68 in 2000 (EUaverage). Even though there is an EU-wideincrease in ALMP this is not true for all of the coun-tries. Therefore we need to take a closer look at theevolution in specific countries. Tables A.2 and A.3in the annex show the spending on ALMP andPLMP for the years 1985 to 2000. If we look atTable A.3 we see that spending on PLMP peakedin the mid-1990s in line with the peak in unemploy-
ment. The obvious reason is that unemploymentbenefits are entitlement programmes, i.e. risingunemployment automatically increases publicspending on passive income support. Activelabour-market programmes, on the other hand, arediscretionary in nature and therefore more easilydisposed with in a situation of tight budgets.Despite that, ALMP spending reached its highestlevel in the mid-1990s; a clear indication that ALMPwere seen as a suitable measure against the badlabour-market situation.
Figures 5 and 6 compare spending on ALMPand PLMP in the years 1985 and 2000. Thebisecting line in the figures indicates a balancedrelationship between both measures, wherebycountries in the left/right half direct more moneyinto passive/active measures respectively. It isinteresting to note that the differences between thecountries were more pronounced in 1985. Italy andSweden spent more money on active measures,spending on PLMP by Belgium, Denmark, Irelandand the Netherlands exceeded spending on ALMPby more than two percentage points of GDP. In2000 the situation is much more balanced andthere is a tendency to an equal spending on bothmeasures. Italy still spends more money on activemeasures, Greece and Sweden spend equally forALMP and PLMP. The other countries all spendmore money on PLMP but they are moving closerto an equal spending. Denmark still spends mostmoney on PLMP (3% of the GDP), but the differ-ence between PLMP and ALMP was only 1.46percentage points in 2000, compared to 2.7percentage points in 1985.
Having discussed the importance of ALMP incontrast to PLMP in general, we look now at theimportance of one special programme, LMT.Table A.4 in the Annex shows the spending on LMTas a percentage of GDP for the years 1985 to2000. We see that Denmark (0.72%) and Sweden(0.64%) direct the highest amounts of their GDP toLMT. Table 7 demonstrates the relative importanceof LMT, by showing the spending on LMT as a
3. ALMP in the EU and empirical findings
(27) Unfortunately the OECD does not provide standardised unemployment rates for Austria and Greece until 1993.
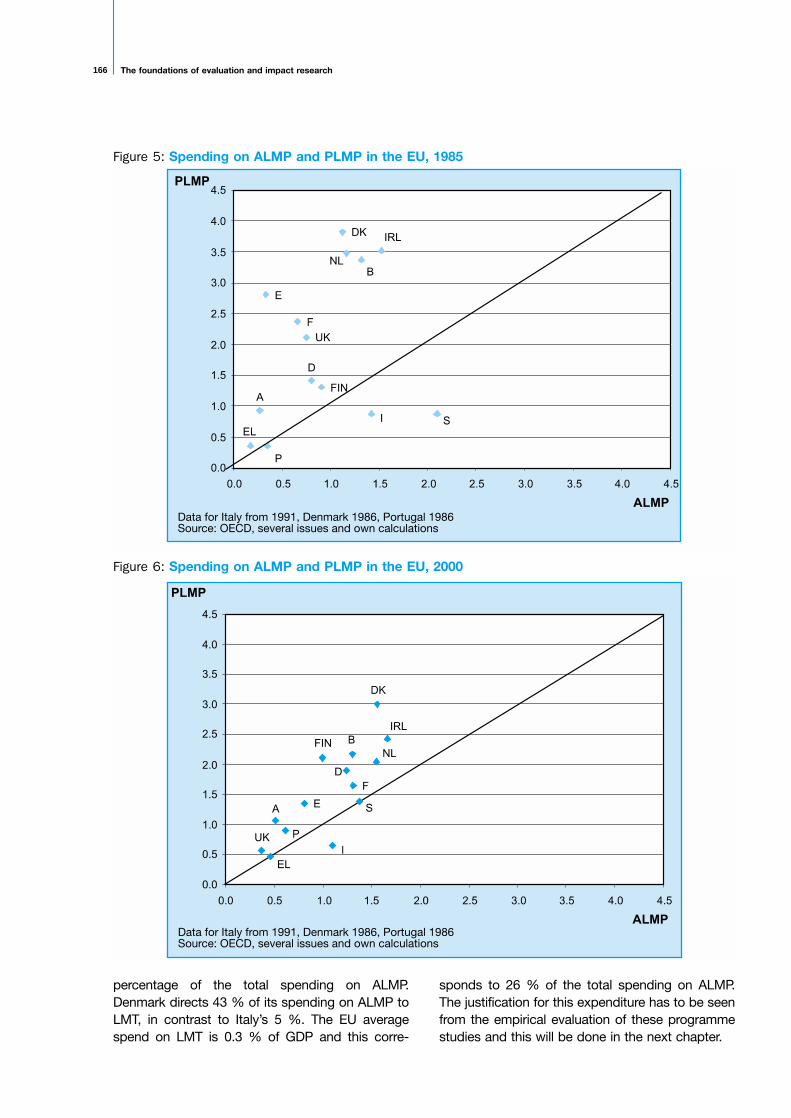
The foundations of evaluation and impact research166
percentage of the total spending on ALMP.Denmark directs 43 % of its spending on ALMP toLMT, in contrast to Italy’s 5 %. The EU averagespend on LMT is 0.3 % of GDP and this corre-
sponds to 26 % of the total spending on ALMP.The justification for this expenditure has to be seenfrom the empirical evaluation of these programmestudies and this will be done in the next chapter.
Figure 5: Spending on ALMP and PLMP in the EU, 1985
Data for Italy from 1991, Denmark 1986, Portugal 1986Source: OECD, several issues and own calculations
Figure 6: Spending on ALMP and PLMP in the EU, 2000
Data for Italy from 1991, Denmark 1986, Portugal 1986Source: OECD, several issues and own calculations
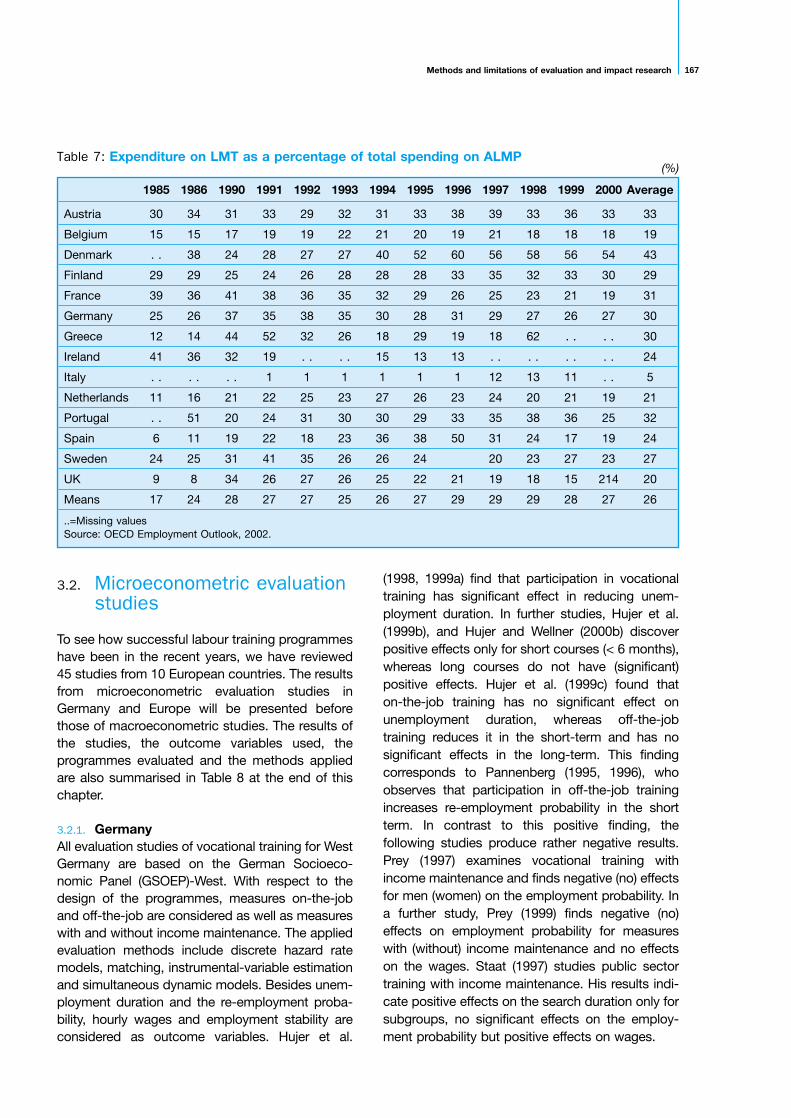
Methods and limitations of evaluation and impact research 167
3.2. Microeconometric evaluationstudies
To see how successful labour training programmeshave been in the recent years, we have reviewed45 studies from 10 European countries. The resultsfrom microeconometric evaluation studies inGermany and Europe will be presented beforethose of macroeconometric studies. The results ofthe studies, the outcome variables used, theprogrammes evaluated and the methods appliedare also summarised in Table 8 at the end of thischapter.
3.2.1. GermanyAll evaluation studies of vocational training for WestGermany are based on the German Socioeco-nomic Panel (GSOEP)-West. With respect to thedesign of the programmes, measures on-the-joband off-the-job are considered as well as measureswith and without income maintenance. The appliedevaluation methods include discrete hazard ratemodels, matching, instrumental-variable estimationand simultaneous dynamic models. Besides unem-ployment duration and the re-employment proba-bility, hourly wages and employment stability areconsidered as outcome variables. Hujer et al.
(1998, 1999a) find that participation in vocationaltraining has significant effect in reducing unem-ployment duration. In further studies, Hujer et al.(1999b), and Hujer and Wellner (2000b) discoverpositive effects only for short courses (< 6 months),whereas long courses do not have (significant)positive effects. Hujer et al. (1999c) found thaton-the-job training has no significant effect onunemployment duration, whereas off-the-jobtraining reduces it in the short-term and has nosignificant effects in the long-term. This findingcorresponds to Pannenberg (1995, 1996), whoobserves that participation in off-the-job trainingincreases re-employment probability in the shortterm. In contrast to this positive finding, thefollowing studies produce rather negative results.Prey (1997) examines vocational training withincome maintenance and finds negative (no) effectsfor men (women) on the employment probability. Ina further study, Prey (1999) finds negative (no)effects on employment probability for measureswith (without) income maintenance and no effectson the wages. Staat (1997) studies public sectortraining with income maintenance. His results indi-cate positive effects on the search duration only forsubgroups, no significant effects on the employ-ment probability but positive effects on wages.
1985 1986 1990 1991 1992 1993 1994 1995 1996 1997 1998 1999 2000 Average
Austria 30 34 31 33 29 32 31 33 38 39 33 36 33 33
Belgium 15 15 17 19 19 22 21 20 19 21 18 18 18 19
Denmark . . 38 24 28 27 27 40 52 60 56 58 56 54 43
Finland 29 29 25 24 26 28 28 28 33 35 32 33 30 29
France 39 36 41 38 36 35 32 29 26 25 23 21 19 31
Germany 25 26 37 35 38 35 30 28 31 29 27 26 27 30
Greece 12 14 44 52 32 26 18 29 19 18 62 . . . . 30
Ireland 41 36 32 19 . . . . 15 13 13 . . . . . . . . 24
Italy . . . . . . 1 1 1 1 1 1 12 13 11 . . 5
Netherlands 11 16 21 22 25 23 27 26 23 24 20 21 19 21
Portugal . . 51 20 24 31 30 30 29 33 35 38 36 25 32
Spain 6 11 19 22 18 23 36 38 50 31 24 17 19 24
Sweden 24 25 31 41 35 26 26 24 20 23 27 23 27
UK 9 8 34 26 27 26 25 22 21 19 18 15 214 20
Means 17 24 28 27 27 25 26 27 29 29 29 28 27 26
..=Missing valuesSource: OECD Employment Outlook, 2002.
Table 7: Expenditure on LMT as a percentage of total spending on ALMP(%)
The foundations of evaluation and impact research168
The studies for East Germany are either basedon the East German Labour Market Monitor(EGLMM), the GSOEP-East or the Labour MarketMonitor Saxony-Anhalt, a panel based on thepopulation of the state of Saxony-Anhalt. As withthe studies for West Germany, training is analysedon- and off-the-job, as well as with and withoutincome maintenance. The period under considera-tion ranges from 1989 to 1998. There is examina-tion of several outcome variables; (un)employmentduration, (stable and unstable) employment (proba-bilities), job search, working time and wages.Fitzenberger and Prey (1997) find that trainingoutside the firm shows considerable positiveeffects on employment probabilities, whereastraining inside has negative effects. Hübler (1998)found that on-the-job training increases job secu-rity, whereas off-the-job training leads to higherearnings. But this is true only for privately financedtraining. Publicly financed training has only positiveeffects in the short-term. Fitzenberger and Prey(2000) question training supported by publicincome maintenance outside a firm, and discoverpositive effects for employment and earnings (butonly a few significant in the long-term). Pannenberg(1995, 1996) ascertains positive effects on there-employment probability and the income forvocational training on- and off-the-job. Lechner(1999b) examines enterprise-related continuousvocational training and finds positive incomeeffects too, but no effects on unemployment prob-ability. Kraus et al. (1998) observe, for a sub-periodof their study, positive effects on (stable) employ-ment for on- and off-the-job training. Hübler (1994)examines on-the-job qualifying measures and findsthat training induces search activities and reducesthe effective hours of work.
Many studies do not find any clear positive ornegative effects. Bergemann et al. (2000) examinemultiple participation in further training. Theydiscover no positive effects for first trainingprogrammes, and the additional effects of asecond participation are, on average, not differentfrom zero. Hujer and Wellner (2000a) find nosignificant effects for public-sector sponsoredvocational training on unemployment duration,but very weak hints that short courses seem tobe more effective in reducing the duration.Lechner (1999c) investigates off-the-job training(publicly financed and enterprise related). Hecannot establish robust positive effects on either
employment probability or the earnings. Staat(1997) examines public sector training withincome maintenance and finds no effects eitheron the search duration, or on the employmentstability or the level of hourly wages.
The results of the following studies tend to benegative. Fitzenberger and Prey (1998) examinethe effects of training within and outside the firmand with and without public income maintenanceon employment and wages. Mostly they getnegative or no effects, differing with respect tothe specification. Lechner (2000) finds no positivelong-term effects on employment probabilities orearnings for public-sector-sponsored vocationaltraining. He gets negative results regarding therisk of unemployment in the short-term.
3.2.2. Other European countriesThis section presents an overview of microecono-metric studies in Europe. Due to numerousmicroeconometric evaluations in Europe, thefollowing section will focus only on recent studiesthat, in addition, deal with training programmes.Further overviews of European studies on themicroeconometric evaluation of ALMP are given,for example, by Steiner and Hagen (2002) andHeckman et al. (1999).
3.2.2.1. SwitzerlandLalive et al. (2000) analysed vocational trainingand job creation programmes in Switzerland.They found that both programmes have negativeeffects on employment during participation.Furthermore, they found that these negativelocking-in effects seem to dominate the positiveeffect on employment after the programme hasexpired. This problem seems to be particularlysevere for job creation schemes for men, whereasfor women it seems to be less important.
Another evaluation for Switzerland wasperformed by Gerfin and Lechner (2000). They alsoanalysed different vocational training and jobcreation programmes, including training to improvebasic skills, language and informatics abilities aswell as further training. Their results indicate thatthe informatics courses and further trainingprogrammes have no effect on employment andthat the basic skills and the language coursesseem to have a negative effect. Furthermore, theyfound that unemployment duration prior to theprogramme participation seems to have an influ-ence on the programme effect, i.e. programmes are
Methods and limitations of evaluation and impact research 169
more effective for long-term unemployment (LTU).For the job creation programmes they found nega-tive effects on employment, whereas positiveeffects were found for women.
3.2.2.2. AustriaZweimüller and Winter-Ebmer (1996) analysed theeffects of Austrian vocational training on employ-ment stability. Their results indicate that trainingprogrammes significantly reduce unemploymentrisk for the participants.
Winter-Ebmer (2001) analysed the employmenteffects of job creation and training programmesby the Österreichischen Stahlstiftung on employ-ment. These programmes are thought to coun-teract staff reduction within the steel industry, soonly steelworkers are eligible for the participation.The results of Winter-Ebmer (2001) indicate thatthere are positive employment effects primarilyfor unemployed older than 27 years, whereas foryounger people there are no effects.
3.2.2.3. BelgiumIn a study for Belgium, Cockx et al. (1998)compared the effects of training programmes andsubsidised employment programmes on employ-ment duration. They analysed in-house andexternal training programmes. Whereas theyfound no effect from subsidised employment andexternal training programmes, they found a posi-tive effect from in-house training programmes. Asinternal training programmes are an investment infirms’ human capital, they should reduce the riskof being laid off.
In a subsequent study, Cockx and Bardoulat(2000) analysed the effect of vocational trainingprogrammes on exit from unemployment evalu-ating training programmes not organised by firms.They found a negative locking-in effect during theprogramme and a positive effect after theprogramme had expired. The positive effectssubsequent to the programme, compensate forthe locking-in effect and thus the overall effect waspositive.
3.2.2.4. FranceFrench vocational training and job creationprogrammes were analysed by Bonnal, Fougèreand Sérandon (1997). In their analysis they distin-guished between unemployed people with voca-tional education and those without, finding apositive effect from training programmes on exit
from unemployment for the unemployed withoutvocational education. The found no positiveresults from job creation programmes. Brodatyet al. (2001) obtained similar results in their studywhere they used the same dataset but differentevaluation methods.
3.2.2.5. DenmarkJensen et al. (1999) analysed a youth unemploy-ment programme that was established inDenmark in 1996. Unemployed youths withoutvocational education are obliged to participate ina vocational training programme to remain enti-tled to unemployment benefits. Jensen et al.(1999) analysed the effects of this programme onentry into regular employment and into a regularvocational education. While they find no signifi-cant effect on entry into regular employment, theeffects on entry into regular vocational educationare positive.
3.2.2.6. United KingdomFirth et al. (1999) analysed the effects of Employ-ment Training (a vocational training programme)and Employment Action (a job creationprogramme) on the separation rate into employ-ment in the United Kingdom. EmploymentTraining offered a significant positive effectwhereas for Employment Action no significanteffects could be found. The same results werealso obtained by the prior study from Payne et al.(1996) that analysed the effects of bothprogrammes on employment.
3.2.2.7. IrelandFor Ireland, O’Connell and McGinnity (1997) anal-ysed the effects of classroom training, on-the-jobtraining and employment subsidy programmes onemployment. Their results indicate that bothtraining measures significantly increase employ-ment, whereas for the employment subsidyprogramme no significant effect could be found.
3.2.2.8. NorwayAakvik, Heckman and Vytlacil (2000) analysed theeffects of subsidised employment and trainingprogrammes on employment for women inNorway with long-term diseases. All programmesrecorded a negative effect. The authors noteproposed that the negative effect may have beencaused by the selection of the participants. Itseems that those placed into the programmes
The foundations of evaluation and impact research170
were mostly unemployed women who had goodemployment opportunities anyway.
3.2.2.9. SwedenCompared to other European countries, Swedenhas a long tradition of ALMP. Consequently, theSwedish active policy measures were evaluatedmore frequently than other European countries.Presented here are only three of the latest microe-conometric evaluations for Sweden. A completeoverview can be found in Calmfors et al. (2002).
Johansson and Martinson (2000) comparedtraditional vocational programmes (organised bythe labour administration) with a special trainingprogramme to qualify the unemployed for jobs inthe information technology sector (Sweden Infor-mation Technology – SwIT). This trainingprogramme is carried out in cooperation withindustry in order to ensure a sufficient supply ofqualified workers. Analysing the effects of bothprogrammes, Johansson and Martinson (2000)find that the Sweden Information Technologyprogramme increases employment probabilitymore than the traditional training programmes.The authors see this as evidence that a morefocused contact with firms can increase the effi-ciency of training programmes.
Larsson (2000) analysed the effects of jobcreation and training programmes for youngpeople. The study finds no evidence that there isa positive effect from either set of programmeson regular employment or on regular vocationaleducation.
Sianesi (2001) analysed the effects of ALMPprogrammes without a differentiation between thedifferent programme types, finding a positiveimpact on the registered unemployed. A seriousproblem seems to be the fact that participationserves as a requirement to renew entitlement forunemployment benefits. Finally Richardson andvan den Berg (2001) analysed (in an empiricalstudy) the impact of employment training inSweden targeted at unemployed individuals aswell as employed persons who are at risk ofbecoming unemployed. The results show highlypositive effects, with a doubling of individualre-employment rates after completion of training.Regarding the time spent within the programme,the individual net effect on unemployment dura-tion reduces to zero.
3.3. Macroeconometric evaluationstudies
Macroeconometric evaluations are rare in Europe,i.e. for most European countries there are nostudies. As a single time series at national levelusually does not provide enough observations,most studies rely on pooled cross-section timeseries data. Primarily these are studies usingregional data to evaluate ALMP for one specificcountry. Besides these studies there are alsosome using a cross-country dataset for theOECD countries (e.g. Jackman et al., 1990 orOECD, 1993). Since this data, and hence thestudies, are not restricted to Europe, statementsfor Europe alone cannot be made. Furthermore,cross-country studies suffer from the problemthat they are supposed to analyse heterogeneouspolicy measures, which is a major drawback ofthese studies.
3.3.1. Sweden Sweden provides the most macroeconometricevaluations using regional data. An overview canagain be found in Calmfors et al. (2002). A promi-nent study for Sweden was conducted by Calmforsand Skedinger (1995). They used a reduced formrelationship to analyse the effects of job creationand training programmes on the total rate of jobseekers (i.e. openly unemployed and programmeparticipants relative to the labour force). It is worthnoting that they have looked specifically for thesimultaneity problem of ALMP. As instruments theyused not only labour-market indicators but alsopolitical factors such as the proportion of seats inthe parliament assigned to left-wing parties. Theirresults indicate that job creation schemes tend tocrowd out regular employment and that the resultsfor vocational training, although they are unstable,are more favourable than the results for jobcreation schemes.
3.3.2. Germany In addition to the studies for Sweden, there aresome studies for Germany that were conductedwith regional data. Büttner and Prey (1998) evalu-ated training programmes and public sector jobcreation for West Germany. They find that jobcreation schemes reduce mismatch, whereastraining programmes do not have any significanteffects. Prey (1999) extends this work by addi-
Methods and limitations of evaluation and impact research 171
tionally controlling for the regional age structureand recipients of social assistance and estimatingseparately for men and women. She finds thatvocational training increases (decreases) themismatch for women (men), whereas job creationscheme decreases the mismatch for men.
Pannenberg and Schwarze (1998) use the datafrom 35 local labour office districts to evaluatetraining programmes in East Germany. They findthat the programmes have negative effects onregional wages. Schmid et al. (2000) estimate theeffects of further training, retraining, public sectorjob creation and wage subsidies on long-termunemployment and exit from unemployment. Theyfind that job creation schemes reduce only ‘short’long-term unemployment, vocational trainingreduces long-term unemployment and wagesubsidies help only the very long-term unem-ployed. Steiner et al. (1998) examine the effects ofvocational training on the labour-market mismatchin East Germany. They observe only very smalleffects on the matching efficiency which disappearin the long term. Hagen and Steiner (2000) eval-uate vocational training, job creation schemes andsocial assistance measures (SAM) for East andWest Germany using the data from local labouroffice districts. The estimated net-effects are notvery promising as all measures increase unem-ployment in West Germany. Only social assistancemeasures reduce unemployment slightly in EastGermany, whereas job creation schemes andvocational training increase it too.
3.4. Vocational trainingprogramme success inprevious years
Table 8 summarises empirical microeconometricstudies for Germany and Europe. The first thing tonote is that there seem to be more favourableeffects of training programmes in generalcompared to other types of programmes. Sincetraining programmes are one of the most importantmeasures of ALMP in Europe they are oftencompared to other measures such as job creationschemes or subsidised employment programmes.Whereas we find positive effects for vocational
training programmes in most cases, the effects ofother measures are positive only in one case.Furthermore we find that training programmes thatare organised by firms seem to be more effectivecompared to publicly organised programmes. Thismay be reasoned by a closer contact with the firmswhich may increase the efficiency in adjusting theskills of the participants to the demands of the firm.
We find immense differences between Eastand West Germany. In West Germany the resultsfor vocational training programmes lookpromising, especially evaluations with respect tothe duration of (un)employment. Unfortunatelythis positive effect does not remain stable if theevaluation is based on other outcome variables.Studies using alternative outcome variables, suchas re-employment probability or wages, show avery different picture. An interesting finding is theresult from Hujer et al. (1999b), and Hujer andWellner (2000b) where short (< 6 months) trainingprogrammes were found to be more effectivethan long ones. This may be caused by a nega-tive selection effect, i.e. the unemployed thatneed comprehensive training to become eligiblefor a regular job are a priori disadvantaged inorder to find a regular job. If such a negativeselection effect is present it is clearly important todifferentiate between different lengths of trainingprogrammes in an evaluation. Turning to EastGermany we find a positive effect in most studiesof vocational training, whereas there are hardlyany studies that indicate a negative effect.
In evaluation it should be noted that the choiceof the outcome variable seems to be an impor-tant issue. Outcome variables like earnings orwages may be questionable if we are evaluatingEuropean programmes. This is due to the factthat the welfare state and minimum wage regula-tions are responsible for distortions between theemployment status and the earnings. Therefore,outcome variables that are directly associatedwith employment status, such as employmentprobability or the unemployment duration, arepreferable for evaluations in Europe.
In this context it might be useful not only toregulate the evaluation by law but also to givesome recommendations with respect to theoutcome variable which should be used (28).
(28) It should be noted that in Germany regulatory law as in the Social Code III, provides the mandatory use of outcome variables,for example re-employment.
The foundations of evaluation and impact research172
Country/Author Outcome variable Programme Result* Applied method
Austria
Winte-ebmer (2001) Employment Vocational training (+) Tobit / IV
Switzerland
Lalive et al. (2000) Inflows into Vocational training (-) Duration analysisemployment Job creation schemes (-) men /
(0) women
Gerfin and Lechner Employment rate Training programmes(2000) - basic training (-)
programmes- language training (-) Matching- informatics courses (0)- vocational training (0)Job creation schemes (-) men /
(+) women
Belgium
Cockx et al. (1998) Employment duration Training programmes: Duration analysis- in-firm (+)- external (0)Subsidised employment (0)programmes
Cockx and Bardoulat Outflow rate from Vocational training (+) Minimum Chi Squares /(2000) unemployment programmes IV-estimation
France
Bonnal et al. (1997) Outflow rate from Vocational training (+) Duration analysisunemployment Job creation schemes (0)
Brodaty et al. (2001) Outflow rate from Vocational training (+) Duration analysisunemployment Job creation schemes (0)
Denmark
Jensen et al. (1999) Inflows into regular Youth unemployment (0) Duration analysisemployment programme
(vocational training)Inflows into regular (+)vocational education
United Kingdom
Firth et al. (1999) Inflows into regular Employment training (+) Duration analysisemployment Employment action (0)
Payne et al. (1996) Employment rate Employment training (+) Matching / selectionEmployment action (0)
Ireland
O’Connell and Employment rate Classroom training (+)McGinnity (1997) On-the-job training (+) Probit
Employment subsidies (0)programmes
Table 8: Summary of the empirical findings from microeconometric studies
Methods and limitations of evaluation and impact research 173
Norway
Aakvik et al. (2000) Employment Training programmes (-) Discrete choiceSubsidised employmentprogrammes (-)
Sweden
Johansson and Employment rate a) Vocational (+) b>a MatchingMartinson (2000) programmes
b) Information technology training programmes
Larsson (2000) Employment Vocational training (0) MatchingJob creation schemes (0)
Sianesi (2001) Unemployment ALMP in general (+) Matching
Richardson and van Employment rate Employment training (+) Duration analysisden Berg (2001) programme
Germany (West)
Hujer et al. Unemployment duration Vocational training (-) Duration analysis(1998, 1999a)
Hujer et al. (1999b), Unemployment duration Vocational training Duration analysisHujer and Wellner - short courses (-)(2000b) (< 6 months)
- long courses (0)
Hujer et al. (1999c) Unemployment duration Off-the-job training (0) Duration analysisOff-the-job training (-)
Pannenberg Re-employment Off-the-job training (+) Discrete hazard rate, (1995, 1996) probability logit and probit
estimates
Prey (1997) Employment probability Vocational training: Simultaneous probit- men (-)- women (0)
Prey (1999) Employment probability / Vocational training (-) / (0) Simultaneous probitwages
Staat (1997) Search duration / Public sector training (+) /(0) / (+) Ordered probit, Employment probability / IV-estimationwages
Germany (East)
Fitzenberger and Employment probability Training outside the firm (+) Simultaneous probit Prey (1997) Training inside the firm (-)
Hübler (1998) Job security / Earnings Off-the-job training (+) Comparison of: matching / OLS/Logit-ML
Off-the-job training (+)
Fitzenberger and Employment / Earnings Public financed training (0) - (+) Simultaneous probitPrey (2000)
Pannenberg Re-employment Off-the-job training (+) Duration analysis(1995, 1996) probability Off-the-job training (+)
Lechner (1999b) Income / Unemployment Vocational training (+) /(0) Matchingprobability
The foundations of evaluation and impact research174
Hübler (1994) Search activity / Off-the-job training (+)/(-) Simultaneous probitHours of work
Kraus et al. (1998) (Stable) Employment Off-the-job training (+) Multinomial LogitOff-the-job training (+)
Bergemann et al. Employment Further training (0) Matching(2000)
Hujer and Wellner Unemployment duration Public-sector sponsored (0) Duration analysis(2000a) vocational training
Lechner (1999a) Employment probability Off-the-job training (0) MatchingEarnings (0)
Fitzenberger and Employment and wages Training in the firm (-)-(0) Random-effects Prey (1998) Training outside the firm (-)-(0) estimation, Matching
Lechner (2000) Employment probabilities Public-sector sponsored (0) Matchingvocational training
* Effect on the outcome variable: (+) positive significant, (-) negative significant, 0 no significant effect.
The last two chapters have presented severaldifferent evaluation methods and previous empir-ical findings for the evaluation of LMT in Germanyand the EU. The three evaluation steps discussed(micro- and macroeconometric evaluation as wellas CBA) should be seen as additional ingredientsto a complete evaluation. Clearly, the first step ofevery evaluation, and therefore also the mostdominant in existing literature, is based at indi-vidual level. This is easy to understand if we bringto mind that the most relevant question to beanswered after the introduction of the newprogramme is whether the programme has thedesired effects for the participating individual.Other effects, indirect ones on the non-partici-pants or macroeconomic effects, have to betaken into account too, but they are usuallyassessed after the microeconometric evaluation.This chapter summarises and reviews the find-ings and aims to give guidance to policy-makerson how to evaluate and implement labour-marketprogrammes. Therefore, focus is on the microe-conometric approach, the choice of the estima-tion method, the problem of heterogeneity, datarequirements, the importance of additionalmacroeconometric and CBA, the design oftraining programmes and the transferability of thefindings to other social programmes.
4.1. Selection problem and thechoice of estimation method
The fundamental evaluation problem and the riskof a selection bias are the first things to worryabout in the microeconometric evaluationcontext. We would like to compare the outcomeof the participating individual after theprogramme took place with the hypotheticaloutcome if they have not participated. Since wecannot observe the same individual simultane-ously in both states (participation and non-partic-
ipation), the fundamental evaluation problemarises and, in order to estimate the true treatmenteffect, some identifying assumptions arerequired. We have presented several microecono-metric evaluation estimators and the assumptionsthey impose in Section 2.2. We have alsodiscussed how likely these assumptions are metin reality and showed how these estimators areimplemented with a basic numerical example(Section 2.2.7). Of all the approaches presented,the matching estimator seems to be mostfavourable. The basic idea is to compare individ-uals who have the same characteristics. Ideallywe have statistical twins and the only differencebetween them is participation in the programme.Therefore, we can interpret the difference in theiroutcomes as the average treatment effect of theprogramme. The implementation of the matchingestimator relies on the assumption that allobservable characteristics that influence theparticipation decision and the outcome variablecan be controlled. Conditional to these character-istics, participation is independent of theoutcomes and no selection bias should occur(conditional independence assumption). Thus itcan be concluded that the matching estimatorfully accounts for selection on observable char-acteristics. However, to implement it an informa-tive dataset is needed which contains the vari-ables from which they might influence the partic-ipation decision and the outcome variable (29). Ifone suspects that unobservable characteristics(like the motivation of an individual) or unob-served variables (some relevant variables, likeeducation or labour-market history are not in thedataset) drive the selection bias, an additionalDID procedure might be useful. Even though it ishard to give a general recommendation in thiscontext, it can be concluded that the more infor-mative the dataset the more likely it is that theconditions for the matching estimator are met.
4. Policy implications: some guidance for evaluationand implementation practice
(29) In Section 4.3 we will discuss which variables that might be.
The foundations of evaluation and impact research176
4.2. Heterogeneity
Another important issue for an evaluation is theproblem of heterogeneity. Disregarding hetero-geneity might lead to severe problems and biasesfor the estimation and interpretation of theresults. Basically heterogeneity might arise onthree levels (individual, programme, regional)which will be discussed later. First, an in-depthestimation of the effects of a training programmeon the participating individual should regard theheterogeneity of the participants. For example, itmakes a difference if one participant is long-termunemployed and another is unemployed only fora short time. This is because the effects forheterogeneous participants may differ signifi-cantly. To proceed with the example we assumethat the effect of the programme is positive forthe long-term unemployed but negative for theshort-term unemployed. Taking the average overboth groups would, therefore, lead to a bias esti-mation of the treatment effect. The positive effectfor the long-term unemployed is underestimatedand the negative effect for the short-term unem-ployed is overestimated. Clearly, this is a signifi-cant bias which has to be avoided by estimatingthe effects separately for the heterogeneousgroups.
The second type of heterogeneity concerns theprogrammes. Programmes might differ forexample in their duration or content. It is under-standable that different programmes might havedifferent effects. Comparing a two-weekcomputer course with a six-month languagecourse may be very misleading. Estimating theeffect by taking the average over bothprogrammes leads again to a biased estimate ofthe treatment effect. Finally, there is also aheterogeneity regarding the geographical distri-bution of the participants. The importance oflocal labour markets has been stressed in recentyears. Different conditions in these local labourmarkets might affect the effectiveness of theprogrammes and the outcomes of participantsand non-participants. In the context of thematching estimator, this means that comparing aparticipant from a booming region with anon-participant from a depressed region is notappropriate. But this might also extend to theprogrammes since a programme might work in acertain region but not in another one.
Bearing these considerations in mind, it shouldbe emphasised that accounting for all three typesof heterogeneity is crucial to obtaining a reliableand differentiated picture of the effects of LMTprogrammes. To do this certain data require-ments have to be fulfilled and this is the topic ofour next section.
4.3. Data requirements
The previous discussion has clarified the crucialrole that datasets play in an evaluation study. Toimplement the matching estimator and to takeaccount of the heterogeneity problem an informa-tive dataset is needed. First individual informationfor participants and non-participants is required. Toestimate the effects in heterogeneous subgroups ofthe treatment population (e.g. old vs. young partic-ipants) a sufficient number of treated individuals isneeded. To find comparable control groupmembers, the number of non-participants has toexceed the number of participants. Unfortunatelythere is no rule of thumb on how many controlgroup members are needed to do this. Clearly themore comparable both groups are, the more likelyit is that good matches will exist. For example, ifthe programme is addressed to the long-termunemployed and the control group is drawn out oflong-term unemployed, the number of control unitsdoes not have to be much higher. On the otherhand, if the control group is drawn randomly fromthe whole population (including short-term unem-ployed, employed, etc.) good matches are lesslikely and therefore the number of controls has tobe higher. The type of explanatory variables whichare needed depend on the programmes evaluatedand should be based on a theoretical model (whichvariables influence the participation decision andthe outcome variable?). The suggestions in thiscontext are manifold. Sociodemographic variableslike age, gender, education, children, etc., areessential as well as variables of the labour-marketstatus (current job, industrial sector, function,high-skilled/low-skilled occupation). The impor-tance of labour-market history as an explanatoryvariable for labour-market success today has beenstressed in recent years. Therefore ‘historical’ infor-mation is used in most of the studies and is espe-cially important if one suspects that there has beenan Ashenfelter’s dip. Finally, a good and reliable
Methods and limitations of evaluation and impact research 177
outcome measure needs to be available too. Theoutcome measure should correspond to the aimsof the programme (e.g. if the programme isintended to increase the employment prospects ofindividuals we need the employment status afterthe programme). It should be traced a sufficientperiod of time after the programme ends to drawconclusions for the short-, medium- and long-termeffects of the programme. The reliability of theoutcome measure is very important since the esti-mation of the effects depends directly on it.
One well-known problem for evaluators is thatthey are not included in the creation of thedatasets used later on for the programme evalua-tion. In this situation one can either rely onalready existing datasets or build up new ones.Using existing datasets, for example surveys likethe German Socioeconomic Panel or administra-tive records collected by governmental agencies,has the major advantage of low costs. There are,however, also several drawbacks which make theinterpretation of the results problematic (e.g.Heckman et al., 1999). First, such datasets arenot focused on participants in certainprogrammes, i.e. the number of observations inthe treatment group will probably be quite small.Additionally, even if information on treated indi-viduals is available, it is very often difficult toconstruct an appropriate control group mirroringthe treatment group in all characteristics. It mayalso be difficult to implement the matching esti-mator if not enough explanatory variables areavailable. Another possible factor of distortion isgiven when the outcome variable of interest is notcovered in the dataset and has to be approxi-mated. The major disadvantage of building upnew datasets (either by collecting a new surveyor merging the information from administrativerecords, etc.) is the high costs. Besides that, theadvantages are numerous. The researcher hascomplete control over the information collected(important variables, outcome variable, etc.) inthe group of treated and control individuals. Thedecisive objective of the programme can betaken into account (e.g. not only the employmentstatus but also the hours worked and/or thewage) and the conditions for the implementationof the appropriate econometric method are morelikely to hold. The ideal evaluation dataset is apanel dataset for participants and non-partici-pants that starts some time before the
programme begins and that traces the individualsfor a certain time period. The necessary length ofthis time period depends on the views of thepolicy-makers on how long the effects last.
4.4. Macroeconometric analysisand cost-benefit analysis
Evaluating the impacts of labour-marketprogrammes at an individual level is an importanttopic but can only serve as a first step in a compre-hensive evaluation. This microeconometricapproach has to be complemented by two addi-tional steps. The first consists of an assessment ofthe indirect effects which can emerge at a macroe-conomic level. Examples of such indirect spillovereffects include dead-weight losses, substitution ordisplacement effects. Since these effects cancounteract the actual goals and objectives of aprogramme, it is crucial to take them into account.The appropriate method in this context is dynamicpanel models as they allow for persistent patternsin the labour market. The data requirements fortheir implementation are usually substantially lowercompared to the microeconometric analysis.Aggregate (either on national or regional) data isrequired and variables of interest include:(un)employed, programme participants, spendingon ALMP and PLMP, vacancies, etc. Particularlyinteresting in this context are aggregated flow data(from programmes into (un)employment and viceversa), for example to estimate the relationshipbetween the number of unemployed which are putback into work through programmes. An additionalmethodological problem which has to be taken intoaccount in this context is a potential simultaneitybetween the spending on labour-marketprogrammes and unemployment. Clearly, inmacroeconometric analysis it is harder to takeaccount of the afore-mentioned heterogeneity,since individual characteristics are usually notavailable.
Once all micro- and macro-economic effectshave been evaluated, confrontation between theseestimated effects and associated costs is impera-tive, i.e. the next logical step is to conduct a CBA.We sketched the proceeding for a CBA in one ofthe previous sections. One of the major problemswas a complete gathering of all benefits oflabour-market programmes. Surely the effects
The foundations of evaluation and impact research178
which are estimated typically by microeconometricmethods, for example improvement in labour-market prospects, are not exhaustive. Insteadvarious additional indirect effects have to be takeninto account. Typical examples in this contextinclude the reduction in criminal activities or equityaims. Once this enumeration is finished the next,and even more difficult, step is measuring theseeffects in monetary terms. If there is no clear guid-ance from doing so, at least a cost-effectivenessanalysis should be conducted. We have given anumerical example for such a cost-effectivenessanalysis in Section 2.4.7.
4.5. The design of trainingprogrammes: somesuggestions
Since the importance of heterogeneity has beenstressed in the previous sections, can it beconcluded from empirical findings whichprogramme designs are most effective? Naturallythis question can only be answered with evalua-tion studies that compare different types of voca-tional training programmes. Since macroecono-metric evaluations do not distinguish betweendifferent types of vocational training programmes,the following statements will rely solely on thereview of microeconometric studies. It should benoted, however, that the suggestions we makemay not be applicable across all occurrences.The success of every programme also dependson the (labour-market) situation in the imple-menting regions and therefore a rule of thumb isnot available.
The major objective of LMT programmes is toreintegrate the unemployed into regular employ-ment. In order to accomplish this objective thechoice between on-the-job and off-the-jobtraining is crucial. A straightforward argumentwould be that on-the-job training is morefavourable, since such a programme does notonly provide training but also imparts work expe-rience. Another point might be that the immediateapplication of the learned knowledge shouldmake it easier for participants to transfer thelearned knowledge into their work. Consideringthe empirical results in respect of this context, noclear picture emerges. The study from Hujer et al.(1999c) suggests a more favourable effect for
off-the-job training programmes; that on-the-jobtraining programmes are too specific and only ofuse in the same firm. In contrast to this findingthe majority of studies find that on-the-jobtraining is more effective. The study fromJohansson and Martinson (2000) suggests that anarrow contact between participants and firms isbeneficial. The subject of the programme shouldalso be considered in this context. Generalcourses, like language or basic computercourses, may work better as off-the job trainingprogrammes, but if a training programme isaimed at a specific skill that is narrowly associ-ated with practical work, on-the-job trainingseems to be more appropriate.
Another question might be how long the dura-tion of a training programme should be in order tobe most efficient. As a first guess it could beargued that a longer programme means morecomprehensive training. However, participation ina training programme is mostly associated withreduced search activity and therefore the longerprogramme duration may thwart the effects. Thelocking-in effect in particular has become a majorissue in empirical studies. The problem here is thatprogrammes associated with a full-time engage-ment do not allow any time for active job search,the benefit of new knowledge is opposed toreduced search activity. In order to avoid thisnegative effect, vocational training programmesshould be designed in a way that enough timeremains for active search . Additionally, activesearch should be actively promoted. Compensa-tion for the participants is relevant in this contexttoo. If the compensation is too high, the incentiveto search for a regular job is weakened. Therefore,compensation should lie significantly under theearnings associated with a regular employment.
A further concern associated with trainingprogrammes seems to be that, although theseprogrammes are designed for problem groups, anoften found phenomenon is that the organisinginstitution selects the participants in a way thatthe success of the programme is artificiallyimproved. In order to avoid this ‘creaming’ ofparticipants, it could be useful to define the eligi-bility criteria for a programme participation in afairly explicit way; the length of the unemploy-ment spell, as well as the basic skill level, shouldserve as a major criterion. As the Winter-Ebmerstudy (2001) has shown, vocational training
Methods and limitations of evaluation and impact research 179
programmes that are targeted to an explicit groupcan be quite successful. An additional advantageof explicit targeting is that the content of thetraining can be adjusted to the needs of theparticipants in a more efficient way.
A final issue is that, in some European countries,participation in a training programme is essential topreserve entitlement to unemployment benefits.Although this helps to avoid a misuse of the unem-ployment benefit system, it may be contradictivefor the success of the training programme, sincetraining cannot be effective if the participants areforced to participate. If there is the objective toinhibit misuse of the benefit system, job creationschemes seem to be more convenient, since theyare of value also for the whole society.
The last point shows that the effectiveness ofvocational training programmes does not onlydepend on the design and implementation of theprogrammes itself, but also on the general frame-work of labour-market policy. There is a stronginterdependence between the unemploymentbenefit system, i.e. the passive labour-marketpolicy, and vocational training, i.e. ALMP. Therefore,general recommendations are hard to make andthe design has to be adjusted to the local situation.
4.6. Transferability to other socialprogrammes
An important question which remains unan-swered regards the transferability of the methodspresented to other social programmes. Eventhough, in principle, transfer is possible, certainrestrictions and possible problems will be consid-ered in this section. Although able to reveal theimpacts at individual and macroeconomic levels,micro- and macroeconometric evaluationmethods do not cover the whole scope of effectsassociated with social programmes. The advan-tage of econometric methods lies in assessingthe quantitative effects of social programmes. Inevaluating LMT, for example, they are able touncover whether the employment chances of theparticipants or the (un)employment situation inthe economy are affected. Social programmes,however, might also involve various other morequalitative aims and objectives. These goals (e.g.well-being, health, criminal records) are oftenhard to measure and therefore hard to evaluate in
the presented framework. The time horizon of theprogramme might also be a problem. Thematching estimator identifies the true treatmenteffect by controlling for other characteristicswhich influence the outcome variable. Naturally,the longer the time horizon of the programme orthe evaluation itself, the harder it is to control forall influences. After 10 years, for example, it isreasonable to assume that other factors whichhave nothing to do with the treatment are influ-encing the outcome variable. Therefore, the appli-cability of the estimator is questionable in thissituation. Furthermore, all presented estimatorshave some data requirements (Section 4.3) whichhave to be met for their implementation. If theserequirements are not fulfilled, their applicationfails. Another point concerns the choice of thecontrol group. In the methodological discussionwe introduced the control group as a group ofnon-participants. This is problematic if nonon-participants are available, for example if allthe unemployed have to participate in a measureafter a certain period of unemployment or ifcomparison of the effects of different vocationaltraining programmes is required. This problem isnot so problematic and the framework can still beapplied. The important difference is the differentinterpretation of the results. For example, if weare interested in comparing two trainingprogrammes we can use the participants of thesecond training group as controls. So, instead ofcomparing participation in a programme withnon-participation we compare the effect ofprogramme A relative to the effect ofprogramme B. If we only have one identicalprogramme in which all individuals have to participate, it might be interesting to compareindividuals who participate after three months ofunemployment with those who participate aftertwo years of unemployment. This could lead toconclusions on when it is best to direct theunemployed into programmes. To emphasise thispoint: the control group does not necessarilyhave to be a group of non-participants but mightalso be a group of participants in otherprogrammes or a group within the sameprogramme but with other entry characteristics.Attention has to be given, in this case, to inter-pretation of the effects, since they are no longermeasured relative to non-participation.
The recent growth in public spending on socialprogrammes, together with tight governmentbudgets, has increased the demand for evalua-tion of these programmes. In consequence,several evaluation methods and procedures havebeen developed. With this contribution we havetried to give an overview of the necessary stepsin such analysis. The ideal evaluation process canbe viewed as a series of three steps. First, theimpacts of the programme on the individualshould be estimated. Second, it should be exam-ined whether or not the estimated impacts arelarge enough to yield net social gains. Finally, itshould be determined if this is the best outcomethat could have been achieved for the moneyspent (Fay, 1996). For these reasons, we concen-trated on evaluation of economic goals witheconometric techniques.
The first step of an evaluation is concernedwith the individual level, i.e. the researcher has toanalyse if the programme under considerationhas any effect at all on the individual. This meansanswering the question of how the participatingindividual would have behaved under the hypo-thetical situation of non-participation. Has theindividuals who participated in this programmeimproved in contrast to a situation without partic-ipation? The fundamental evaluation problemwhich arises in this context is due to the fact thatwe can never observe an individual in bothstates, i.e. we have a counterfactual situation. Wehave presented several econometric estimatorswhich simulate this hypothetical outcome. Theseestimators rest on a number of generallyuntestable assumptions which were discussedcritically to determine their major advantages anddisadvantages. We also assessed how likely it isthat these assumptions are met in practice.Furthermore, we implemented a numericalexample to show how the estimators are imple-mented technically and also discussed their datarequirements.
This microeconometric evaluation, is only afirst step towards an overall assessment of thesocial programme. In this contribution we have
also sketched how the next steps should look inan evaluation study. We pointed out the possibleexistence of indirect and secondary effects whichmight counteract the actual aims and objectivesof the programme. In this context the mostimportant effects are dead-weight losses, substi-tution and displacement effects. These effectscannot be evaluated at an individual level, makingan additional assessment on an aggregate levelnecessary. We have proposed macroeconometricmethods, like augmented matching functionswhich can be used to take such indirect effectsinto account. Instead of looking at the effect onindividual performance, we would like to know ifthe ALMP represent a net gain to the wholeeconomy. Important methodological issues in amacroeconometric evaluation are the specifica-tion of the empirical model, which should alwaysbe based on an appropriate theoretical frame-work and the simultaneity problem of ALMPwhich has to be solved. Having identified allpotential quantitative effects of a programme,whether they are direct or indirect, the final stepconsists of augmenting these effects with addi-tional, more qualitative impacts of theprogramme. These are harder to measure butnevertheless important for an overall assessment.The defined benefits of the programme can becontrasted in a CBA with the costs caused by theprogramme in order to assess the overall netbenefit.
Having discussed the methodological issuesrelated to the three evaluation steps, we presentedempirical findings form micro- and macroecono-metric evaluations in Europe, with a particularfocus on Germany. Training programmes seem tohave positive effects on the individuals in most ofthe studies and perform better than alternativelabour-market programmes, such as job creationschemes. Finally, we used the results from ourmethodological discussion and the empirical find-ings to draw some implications for policy andevaluation practice. We focused on the choice ofthe appropriate estimation method, data require-ments, the problem of heterogeneity in evaluation
5. Summary and conclusions

Methods and limitations of evaluation and impact research 181
analysis, the successful design of trainingprogrammes and the transferability of our findings(for ALMP) to other social programmes. It was ouraim to provide the interested reader with themethodological foundations of econometric evalu-
ation analysis and present some easily under-standable numerical examples. In doing so, wewanted to give some guidance for the evaluationand implementation practice of ALMP and, to acertain extent, also other social programmes.

List of abbreviations
ALMP Active labour-market policies
BAE Before-after estimator
CBA Cost-benefit analysis
CEA Cost-effectiveness analysis
CIA Conditional independence assumption
CSE Cross-section estimator
DID Difference-in-differences
EGLMM East German Labour Market Monitor
EU European Union
GDP Gross domestic product
GNP Gross national product
GSOEP German socioeconomic panel
JCS Job creation scheme
KM Kernel matching
LMT Labour-market training
LTU Long-term unemployment
NN Nearest neighbour
NPV Net present value
PLMP Passive labour-market policies
SAM Social assistance measure
SUTVA Stable unit treatment value assumption
SwIT Sweden Information Technology
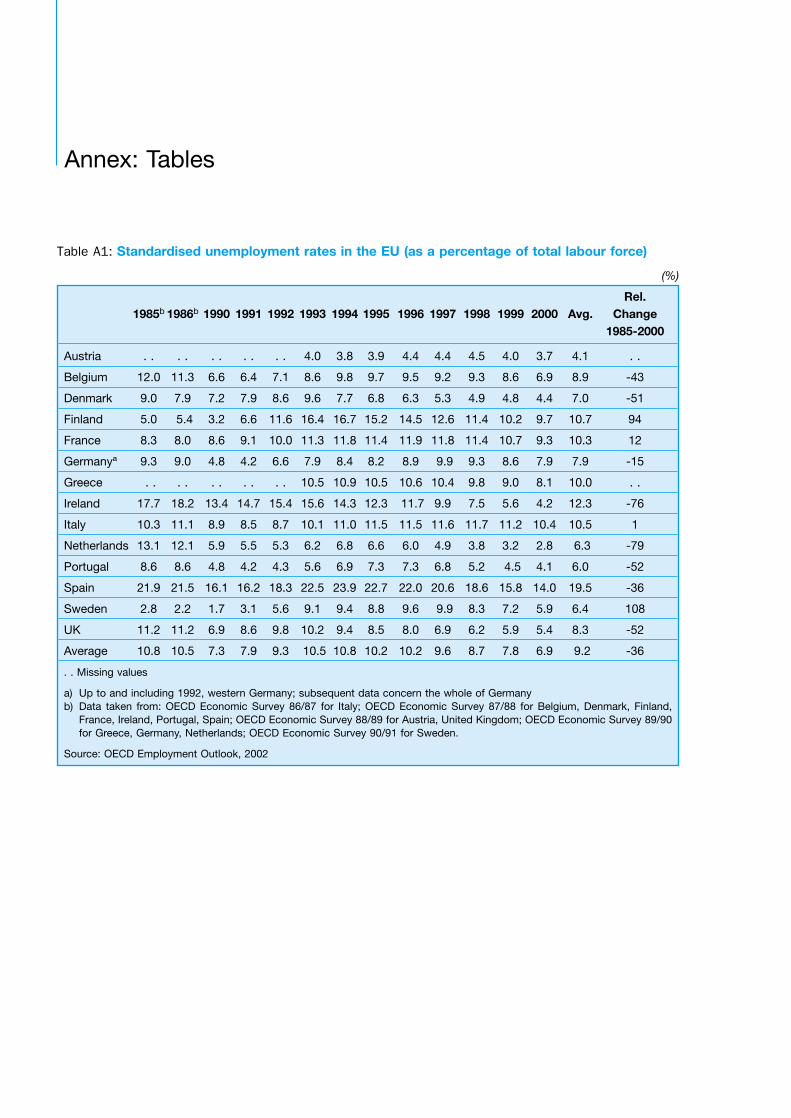
Annex: Tables
Rel. 1985b 1986b 1990 1991 1992 1993 1994 1995 1996 1997 1998 1999 2000 Avg. Change
1985-2000
Austria . . . . . . . . . . 4.0 3.8 3.9 4.4 4.4 4.5 4.0 3.7 4.1 . .
Belgium 12.0 11.3 6.6 6.4 7.1 8.6 9.8 9.7 9.5 9.2 9.3 8.6 6.9 8.9 -43
Denmark 9.0 7.9 7.2 7.9 8.6 9.6 7.7 6.8 6.3 5.3 4.9 4.8 4.4 7.0 -51
Finland 5.0 5.4 3.2 6.6 11.6 16.4 16.7 15.2 14.5 12.6 11.4 10.2 9.7 10.7 94
France 8.3 8.0 8.6 9.1 10.0 11.3 11.8 11.4 11.9 11.8 11.4 10.7 9.3 10.3 12
Germanyª 9.3 9.0 4.8 4.2 6.6 7.9 8.4 8.2 8.9 9.9 9.3 8.6 7.9 7.9 -15
Greece . . . . . . . . . . 10.5 10.9 10.5 10.6 10.4 9.8 9.0 8.1 10.0 . .
Ireland 17.7 18.2 13.4 14.7 15.4 15.6 14.3 12.3 11.7 9.9 7.5 5.6 4.2 12.3 -76
Italy 10.3 11.1 8.9 8.5 8.7 10.1 11.0 11.5 11.5 11.6 11.7 11.2 10.4 10.5 1
Netherlands 13.1 12.1 5.9 5.5 5.3 6.2 6.8 6.6 6.0 4.9 3.8 3.2 2.8 6.3 -79
Portugal 8.6 8.6 4.8 4.2 4.3 5.6 6.9 7.3 7.3 6.8 5.2 4.5 4.1 6.0 -52
Spain 21.9 21.5 16.1 16.2 18.3 22.5 23.9 22.7 22.0 20.6 18.6 15.8 14.0 19.5 -36
Sweden 2.8 2.2 1.7 3.1 5.6 9.1 9.4 8.8 9.6 9.9 8.3 7.2 5.9 6.4 108
UK 11.2 11.2 6.9 8.6 9.8 10.2 9.4 8.5 8.0 6.9 6.2 5.9 5.4 8.3 -52
Average 10.8 10.5 7.3 7.9 9.3 10.5 10.8 10.2 10.2 9.6 8.7 7.8 6.9 9.2 -36
. . Missing values
a) Up to and including 1992, western Germany; subsequent data concern the whole of Germanyb) Data taken from: OECD Economic Survey 86/87 for Italy; OECD Economic Survey 87/88 for Belgium, Denmark, Finland,
France, Ireland, Portugal, Spain; OECD Economic Survey 88/89 for Austria, United Kingdom; OECD Economic Survey 89/90for Greece, Germany, Netherlands; OECD Economic Survey 90/91 for Sweden.
Source: OECD Employment Outlook, 2002
Table A1: Standardised unemployment rates in the EU (as a percentage of total labour force)
(%)
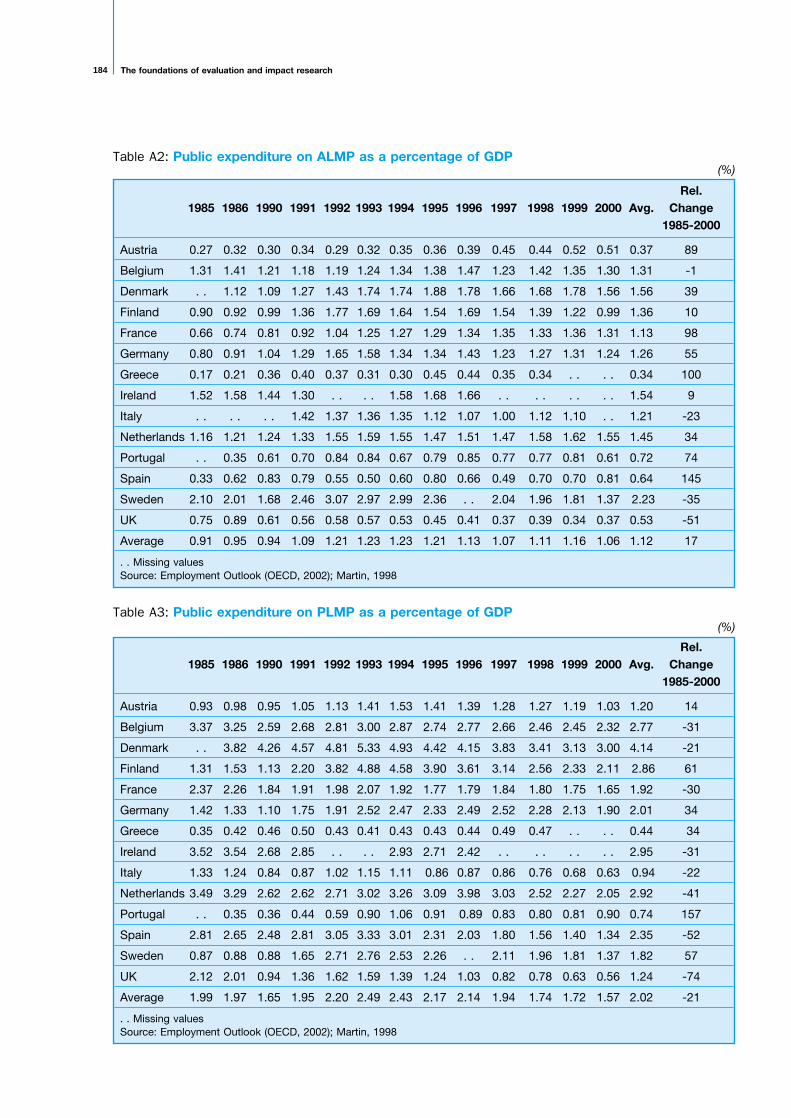
The foundations of evaluation and impact research184
Table A2: Public expenditure on ALMP as a percentage of GDP
Rel. 1985 1986 1990 1991 1992 1993 1994 1995 1996 1997 1998 1999 2000 Avg. Change
1985-2000
Austria 0.27 0.32 0.30 0.34 0.29 0.32 0.35 0.36 0.39 0.45 0.44 0.52 0.51 0.37 89
Belgium 1.31 1.41 1.21 1.18 1.19 1.24 1.34 1.38 1.47 1.23 1.42 1.35 1.30 1.31 -1
Denmark . . 1.12 1.09 1.27 1.43 1.74 1.74 1.88 1.78 1.66 1.68 1.78 1.56 1.56 39
Finland 0.90 0.92 0.99 1.36 1.77 1.69 1.64 1.54 1.69 1.54 1.39 1.22 0.99 1.36 10
France 0.66 0.74 0.81 0.92 1.04 1.25 1.27 1.29 1.34 1.35 1.33 1.36 1.31 1.13 98
Germany 0.80 0.91 1.04 1.29 1.65 1.58 1.34 1.34 1.43 1.23 1.27 1.31 1.24 1.26 55
Greece 0.17 0.21 0.36 0.40 0.37 0.31 0.30 0.45 0.44 0.35 0.34 . . . . 0.34 100
Ireland 1.52 1.58 1.44 1.30 . . . . 1.58 1.68 1.66 . . . . . . . . 1.54 9
Italy . . . . . . 1.42 1.37 1.36 1.35 1.12 1.07 1.00 1.12 1.10 . . 1.21 -23
Netherlands 1.16 1.21 1.24 1.33 1.55 1.59 1.55 1.47 1.51 1.47 1.58 1.62 1.55 1.45 34
Portugal . . 0.35 0.61 0.70 0.84 0.84 0.67 0.79 0.85 0.77 0.77 0.81 0.61 0.72 74
Spain 0.33 0.62 0.83 0.79 0.55 0.50 0.60 0.80 0.66 0.49 0.70 0.70 0.81 0.64 145
Sweden 2.10 2.01 1.68 2.46 3.07 2.97 2.99 2.36 . . 2.04 1.96 1.81 1.37 2.23 -35
UK 0.75 0.89 0.61 0.56 0.58 0.57 0.53 0.45 0.41 0.37 0.39 0.34 0.37 0.53 -51
Average 0.91 0.95 0.94 1.09 1.21 1.23 1.23 1.21 1.13 1.07 1.11 1.16 1.06 1.12 17
. . Missing valuesSource: Employment Outlook (OECD, 2002); Martin, 1998
(%)
Table A3: Public expenditure on PLMP as a percentage of GDP
Rel. 1985 1986 1990 1991 1992 1993 1994 1995 1996 1997 1998 1999 2000 Avg. Change
1985-2000
Austria 0.93 0.98 0.95 1.05 1.13 1.41 1.53 1.41 1.39 1.28 1.27 1.19 1.03 1.20 14
Belgium 3.37 3.25 2.59 2.68 2.81 3.00 2.87 2.74 2.77 2.66 2.46 2.45 2.32 2.77 -31
Denmark . . 3.82 4.26 4.57 4.81 5.33 4.93 4.42 4.15 3.83 3.41 3.13 3.00 4.14 -21
Finland 1.31 1.53 1.13 2.20 3.82 4.88 4.58 3.90 3.61 3.14 2.56 2.33 2.11 2.86 61
France 2.37 2.26 1.84 1.91 1.98 2.07 1.92 1.77 1.79 1.84 1.80 1.75 1.65 1.92 -30
Germany 1.42 1.33 1.10 1.75 1.91 2.52 2.47 2.33 2.49 2.52 2.28 2.13 1.90 2.01 34
Greece 0.35 0.42 0.46 0.50 0.43 0.41 0.43 0.43 0.44 0.49 0.47 . . . . 0.44 34
Ireland 3.52 3.54 2.68 2.85 . . . . 2.93 2.71 2.42 . . . . . . . . 2.95 -31
Italy 1.33 1.24 0.84 0.87 1.02 1.15 1.11 0.86 0.87 0.86 0.76 0.68 0.63 0.94 -22
Netherlands 3.49 3.29 2.62 2.62 2.71 3.02 3.26 3.09 3.98 3.03 2.52 2.27 2.05 2.92 -41
Portugal . . 0.35 0.36 0.44 0.59 0.90 1.06 0.91 0.89 0.83 0.80 0.81 0.90 0.74 157
Spain 2.81 2.65 2.48 2.81 3.05 3.33 3.01 2.31 2.03 1.80 1.56 1.40 1.34 2.35 -52
Sweden 0.87 0.88 0.88 1.65 2.71 2.76 2.53 2.26 . . 2.11 1.96 1.81 1.37 1.82 57
UK 2.12 2.01 0.94 1.36 1.62 1.59 1.39 1.24 1.03 0.82 0.78 0.63 0.56 1.24 -74
Average 1.99 1.97 1.65 1.95 2.20 2.49 2.43 2.17 2.14 1.94 1.74 1.72 1.57 2.02 -21
. . Missing valuesSource: Employment Outlook (OECD, 2002); Martin, 1998
(%)
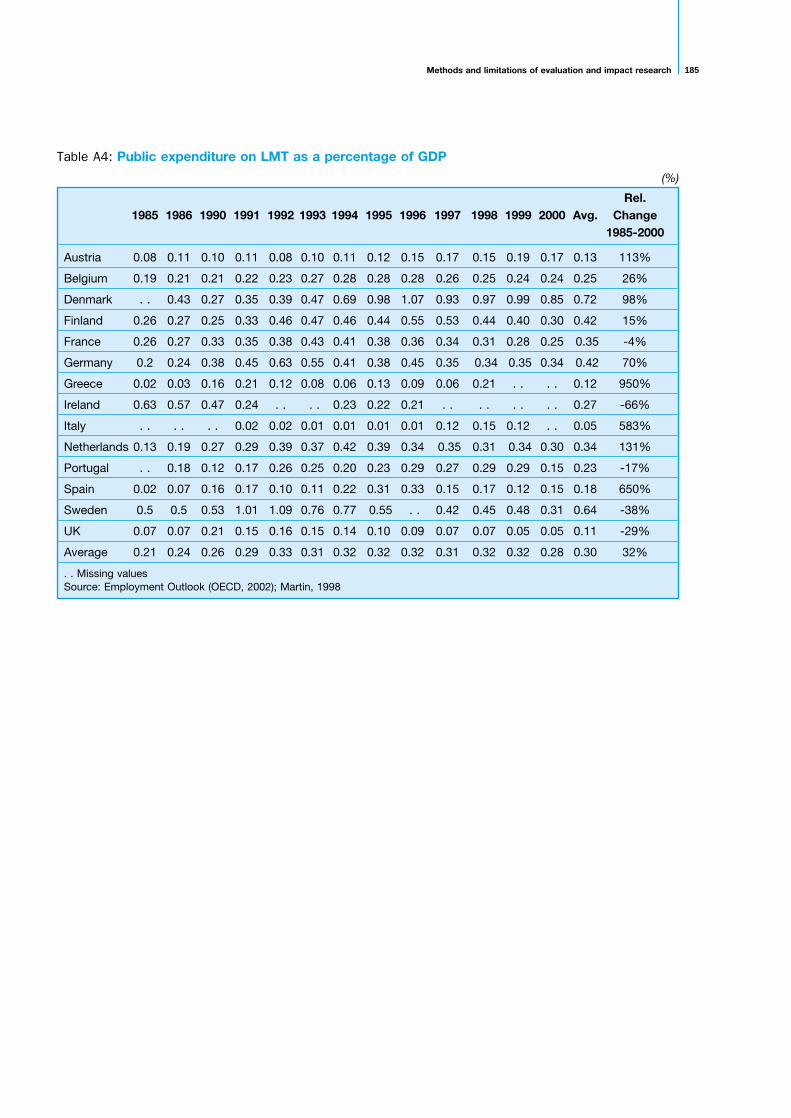
Methods and limitations of evaluation and impact research 185
Table A4: Public expenditure on LMT as a percentage of GDP
Rel. 1985 1986 1990 1991 1992 1993 1994 1995 1996 1997 1998 1999 2000 Avg. Change
1985-2000
Austria 0.08 0.11 0.10 0.11 0.08 0.10 0.11 0.12 0.15 0.17 0.15 0.19 0.17 0.13 113%
Belgium 0.19 0.21 0.21 0.22 0.23 0.27 0.28 0.28 0.28 0.26 0.25 0.24 0.24 0.25 26%
Denmark . . 0.43 0.27 0.35 0.39 0.47 0.69 0.98 1.07 0.93 0.97 0.99 0.85 0.72 98%
Finland 0.26 0.27 0.25 0.33 0.46 0.47 0.46 0.44 0.55 0.53 0.44 0.40 0.30 0.42 15%
France 0.26 0.27 0.33 0.35 0.38 0.43 0.41 0.38 0.36 0.34 0.31 0.28 0.25 0.35 -4%
Germany 0.2 0.24 0.38 0.45 0.63 0.55 0.41 0.38 0.45 0.35 0.34 0.35 0.34 0.42 70%
Greece 0.02 0.03 0.16 0.21 0.12 0.08 0.06 0.13 0.09 0.06 0.21 . . . . 0.12 950%
Ireland 0.63 0.57 0.47 0.24 . . . . 0.23 0.22 0.21 . . . . . . . . 0.27 -66%
Italy . . . . . . 0.02 0.02 0.01 0.01 0.01 0.01 0.12 0.15 0.12 . . 0.05 583%
Netherlands 0.13 0.19 0.27 0.29 0.39 0.37 0.42 0.39 0.34 0.35 0.31 0.34 0.30 0.34 131%
Portugal . . 0.18 0.12 0.17 0.26 0.25 0.20 0.23 0.29 0.27 0.29 0.29 0.15 0.23 -17%
Spain 0.02 0.07 0.16 0.17 0.10 0.11 0.22 0.31 0.33 0.15 0.17 0.12 0.15 0.18 650%
Sweden 0.5 0.5 0.53 1.01 1.09 0.76 0.77 0.55 . . 0.42 0.45 0.48 0.31 0.64 -38%
UK 0.07 0.07 0.21 0.15 0.16 0.15 0.14 0.10 0.09 0.07 0.07 0.05 0.05 0.11 -29%
Average 0.21 0.24 0.26 0.29 0.33 0.31 0.32 0.32 0.32 0.31 0.32 0.32 0.28 0.30 32%
. . Missing valuesSource: Employment Outlook (OECD, 2002); Martin, 1998
(%)
Aakvik, A.; Heckman, J. J.; Vytlacil, E. J. Treatmenteffects for discrete outcomes when responsesto treatment vary among observationally iden-tical person: an application to Norwegian voca-tional rehabilitation programmes. Cambridge:National Bureau of Economic Research –NBER, 2000 (Technical Working Paper, 262).
Ashenfelter, O. Estimating the effects of trainingprogrammes on earnings. In: Review ofEconomics and Statistics, 1978, Vol. 60,p. 47-57.
Ashenfelter, O.; Card, D. Using the longitudinalstructure of earnings to estimate the effects oftraining programmes. In: Review of Economicsand Statistics, 1985, Vol. 66, p. 648-660.
Auer, P.; Kruppe, T. Monitoring of labour marketpolicy in the EU member states. Berlin: Reihe,1996 (Serie: Wissenschaftszentrum Berlin fürSozialforschung. Discussion paper FS 1No 96-202).
Augurzky, B. Optimal full matching: an applicationusing the NLSY79. Heidelberg: University ofHeidelberg, Department of Economics, 2000.(Discussion Paper, No 310).
Bergemann, A. et al. Multiple active labor marketpolicy participation in East Germany: an assess-ment of outcomes. Halle: Institute of EconomicResearch, 2000 (Working Paper).
Bijwaard, G.; Ridder, G. Correcting for selectivecompliance in a reemployment bonus experi-ment. Baltimore: John Hopkins University, 2000(Working Paper).
Boardman, A. E. et al. Cost-benefit analysis:concepts and practice. New Jersey: PrenticeHall, 2001.
Bonnal, L.; Fougère, D.; Sérandon, A. Evaluatingthe impact of French employment policies onindividual labour market histories. In: Review ofEconomic Studies, 1997, p. 683-713.
Brent, R. J. Applied cost-benefit analysis. Vermont:Edward Elgar Publishing Limited, 1996.
Brodaty, T.; Crepon, B.; Fougère, D. Using matchingestimators to evaluate alternative youthemployment programmes: evidence fromFrance, 1986-1988. In: Lechner, M.; Pfeiffer, F.(eds) Econometric evaluation of labour market
policies. Heidelberg: Physika Verlag, 2001(ZEW Economic Studies, Vol. 13).
Burtless, G. The case for randomized field trials ineconomic and policy research. In: Journal ofEconomic Perspectives, 1995, Vol. 9, p. 63-84.
Burtless, G.; Orr, L. Are classical experimentsneeded for manpower policy? In: Journal ofHuman Resources, 1986, Vol. 21, p. 606-640.
Büttner, T.; Prey, H. Does active labour-marketpolicy affect structural unemployment? Anempirical investigation for West Germanyregions, 1986-1993. In: Zeitschrift fürWirtschafts- und Sozialwissenschaften, 1998,Vol. 188, p. 389-413.
Calmfors, L. Active labour market policy and unem-ployment: a framework for the analysis ofcrucial design features. In: OECD EconomicStudies, 1994, Vol. 22, p. 7-47.
Calmfors, L.; Forslund, A.; Hemström, M. Doesactive labour market policy work? Lessons fromthe Swedish experiences. Munich: CESifo,2002 (Working Paper series, No 675).
Calmfors, L.; Skedinger, P. Does active labourmarket policy increase employment? Theoret-ical considerations and some empiricalevidence from Sweden. In: Oxford Review ofEconomic Policy, 1995, No 11.
Card, D. Reforming the financial incentives of thewelfare system. Bonn: IZA, 2000 (DiscussionPaper, No 172).
Cochrane, W.; Rubin, D. Controlling bias in obser-vational studies. In: Sankyha, 1973, Vol. 35,p. 417-446.
Cockx, B.; Bardoulat, I. Vocational training: does itspeed up the transition rate out of unemploy-ment? Amsterdam: Tinbergen Institute, 2000(Discussion Paper No 9932).
Cockx, B.; Van Der Linden, B.; Karaa, A. Activelabour market policy and job tenure. In: OxfordEconomic Papers, 1998, Vol. 50, p. 685-708.
Delander, L.; Niklasson, H. Cost-benefit analysis.In: Schmid, G.; O’Reilly, J.; Schönemann, K.(eds) Handbook of international labour marketpolicy and economics. Cheltenham: EdwardElgar, 1996.
References
Methods and limitations of evaluation and impact research 187
DiNardo, J.; Fortin, N.; Lemieux, T. Labor marketinstitutions and the distribution of wages,1973-1992: a semiparametric approach. In:Econometrica, 1996, Vol. 64, p. 1001-1045.
Dolton, P.; O’Neill, D. Unemployment duration andthe restart effect: some experimental evidence.In: Economic Journal, 1996, Vol. 106,p. 387-400.
Fay, R. Enhancing the effectiveness of active labourmarket policies: evidence from programmeevaluations in OECD countries. Paris: OECD,1996 (Labour Market and Social Policy Occa-sional Papers).
Firth, D.; Payne, C.; Payne, J. Efficacy ofprogrammes for the unemployed: discrete timemodelling of duration data from a matchedcomparison study. In: Journal of the RoyalStatistical Society, 1999, Vol. 162, p. 111-120.
Fitzenberger, B.; Prey, H. Assessing the impact oftraining on employment. In: ifo-Studien, 1997,Vol. 43, p. 71-116.
Fitzenberger, B.; Prey, H. Evaluating public sectorsponsored training in East Germany. In: OxfordEconomic Papers, 2000, p. 497-520.
Fitzenberger,B.; Prey,H. Beschäftigungs-und Verdi-enstwirkungen von Weiterbildungsmaßnahmenim ostdeutschen Transformationsprozeß: EineMethodenkritik. In: Pfeiffer, F. Pohlmeier, W. (eds)Qualifikation, Weiterbildung und Arbeitsmarkter-folg. Baden-Baden: Nomos-Verlag, 1998 (ZEW-Wirtschaftsanalysen, Vol 31).
Gerfin, M.; Lechner, M. Microeconometric evalua-tion of the active labour market policy in Switzer-land. Mannheim: ZEW, 2000 (Discussion Paper,No 00-24).
Gritz, M. The impact of training on the frequencyand duration of employment. In: Journal ofEconometrics, 1993, Vol. 57, p. 21-51.
Hagen, T.; Steiner, V. Von der Finanzierung derArbeitslosigkeit zur Förderung von Arbeit –Analysen und Empfehlungen zur Arbeitsmarkt-politik in Deutschland. Baden-Baden: NomosVerlagsgesellschaft, 2000.
Heckman, J.; Hotz, J. Choosing among alternativenonexperimental methods for estimating theimpact of social programmes: the case ofmanpower training. In: Journal of the AmericanStatistical Association, 1989, Vol. 84, p.862-880.
Heckman, J. et al. Sources of selection bias in eval-uating social programmes: an interpretation ofconventional measures and evidence on the
effectiveness of matching as a program evalua-tion method. In: Proceedings of the NationalAcademy of Sciences, 1996, Vol. 93,p. 13416-13420.
Heckman, J. et al. Characterizing selection biasusing experimental data. In: Econometrica,1998a, Vol. 66, p. 1017-1098.
Heckman, J.; Ichimura, H.; Todd, P. Matching as aneconometric evaluation estimator: evidencefrom evaluating a job training programme. In:Review of Economic Studies, 1997, Vol. 64,p. 605-654.
Heckman, J.; Ichimura, H.; Todd, P. Matching as aneconometric evaluation estimator. In: Review ofEconomic Studies, 1998b, Vol. 65, p. 261-294.
Heckman, J.; LaLonde, R.; Smith, J. The economicsand econometrics of active labor marketprogrammes. In: Ashenfelter, O.; Card, D. (eds)In: Handbook of Labor Economics Vol. III.Amsterdam: Elsvier, 1999, p. 1865-2097.
Heckman, J.; Robb, R. Alternative models for evalu-ating the impact of interventions. In:Heckman, J.; Singer, B. (eds) Longitudinal anal-ysis of labor market data, Cambridge:Cambridge University Press, 1985, p. 156-245.
Heckman, J.; Singer, B. A method for minimizing theimpact of distributional assumptions in econo-metric models for duration data. In: Economet-rica, 1984, Vol. 52, p. 271-320.
Heckman, J.; Smith, J. Assessing the case for socialexperiments. In: Journal of Economic Perspec-tives, 1995, Vol. 9, p. 85-110.
Holland, P. Statistics and causal inference. In:Journal of American Statistical Association,1986, Vol. 81, p. 945-970.
Holmlund, B.; Linden, J. Job matching, temporarypublic employment and equilibrium unemploy-ment. In: Journal of Public Economics, 1993,Vol. 51, p. 329-343.
Hübler, O. Berufliche Weiterbildung und Umschu-lung in Ostdeutschland – Erfahrungen undPerspektiven. In: Pfeiffer, F.; Pohlmeier, W. (eds)Qualifikation, Weiterbildung und Arbeitsmarkter-folg. Baden-Baden: Nomos-Verlag, 1998(ZEW-Wirtschaftsanalysen, Vol. 31).
Hübler, O. Weiterbildung, Arbeitsplatzsuche undindividueller Beschäftigungsumfang – Eineökonometrische Untersuchung für Ostdeutsch-land. In: Zeitschrift für Wirtschafts- und Sozial-wissenschaften, 1994, Vol. 114, p. 419-447.
The foundations of evaluation and impact research188
Hujer, R.; Caliendo, M. Evaluation of active labourmarket policy – methodological concepts andempirical estimates. In: Becker, I. et al. (eds)Soziale Sicherung in einer dynamischenGesellschaft. Campus Verlag, 2001, p. 583-617.
Hujer, R.; Maurer, K. O.; Wellner, M. Kurz- undlangfristige Effekte von Weiterbildungsmaß-nahmen auf die Arbeitslosigkeitsdauer in West-deutschland. In: Pfeiffer, F.; Pohlmeier, W. (eds)Qualifikation, Weiterbildung und Arbeitsmarkter-folg. Baden Baden: Nomos-Verlag, 1998,p.197-221 (ZEW-Wirtschaftsanalysen Band31).
Hujer, R.; Maurer, K. O.; Wellner, M. Estimating theeffect of vocational training on unemploymentduration in West Germany: a discrete hazardrate model with instrumental variables. In:Jahrbücher für Nationalökonomie und Statistik,1999a, Vol. 218/5+6, p. 619-646.
Hujer, R.; Maurer, K. O.; Wellner, M. The effects ofpublic sector sponsored training on unemploy-ment duration in West Germany: a discretehazard rate model based on a matched sample.In: ifo-Studien, 1999b, Vol. 3, p. 371-410.
Hujer, R.; Maurer, K. O.; Wellner, M. Analyzing theeffects of on-the-job vs. off-the-job training onunemployment duration in West Germany. In:Bellmann, L.; Steiner, V. (eds) Panelanalysen zuLohnstruktur, Qualifikation und Beschäftigungs-dynamik. IAB – Beiträge zur Arbeitsmarkt- undBerufsforschung 229, 1999c, p. 203-237.
Hujer, R.; Wellner, M. The effects of public sectorsponsored training on individual employmentperformance in East Germany. Bonn: IZA,2000a (Discussion Paper, No 141).
Hujer, R.; Wellner, M. Berufliche Weiterbildung undindividuelle Arbeitslosigkeitsdauer in West- undOstdeutschland: Eine mikroökonometrischeAnalyse, 2000b (Discussion Paper).
Jackman, R.; Pissarides, C.; Savouri, S. Labourmarket policies and unemployment in the OECD.In: Economic Policy, 1990, Vol. 5, p. 450-490.
Jensen, P.; Nielsen, M. S.; Rosholm, M. The effectsof benefit, incentives, and sanctions on youthunemployment. Arhus: Center of LabourMarket and Social Research – CLS, 1999(Working Paper, No 99-05).
Johansson, P.; Martinson, S. The effect of increasedemployer contacts within a labour markettraining program. Uppsala: IFAU – Office ofLabour Market Policy Evaluation, 2000(Working Paper, No 10).
Kluve, J.; Lehmann, H.; Schmidt, C. Active labourmarket policies in Poland: human capitalenhancement, stigmatization, or benefitchurning? In: Journal of ComparativeEconomics, 1999, Vol. 27, p. 61-89.
Koenker, R.; Bilias, Y. Quantile regression for dura-tion data: a reappraisal of the Pennsylvaniareemployment bonus experiments. In: Fitzen-berger, B.; Koenker, R. Machado,; J. A. F. (eds)Studies in empirical economics: economicapplications of quantile Regression, 2002,p. 199-220.
Kraus, F.; Puhani, P. A.; Steiner, V. Do public worksprogrammes work? Some unpleasant resultsfrom the East German experience. Mannheim:ZEW, 1998 (Discussion Paper, No 98-07).
Kromrey, H. Evaluation – ein vielschichtigesKonzept. In: Sozialwissenschaften und Beruf-spraxis, 2001, Vol. 2, p. 105-132.
Lalive, R.; Van Ours, J. C.; Zweimüller, J. The impactof active labor market programmes and benefitentitlement rules on the duration of unemploy-ment. Bonn: IZA, 2000. (Discussion PaperNo 149).
LaLonde, R. Evaluating the econometric evalua-tions of training programmes with experimentaldata. In: The American Economic Review, 1986,Vol. 76, p. 604-620.
LaLonde, R. The promise of public-sector sponsoredtraining programmes. In: Journal of EconomicPerspectives, 1995, Vol. 9, p. 149-168.
Larsson, L. Evaluation of Swedish youth labourmarket programmes. Uppsala: IFAU, 2000(Working Paper, 2000:1).
Layard, R.; Nickell, S.; Jackman, R. Unemployment:macroeconomic performance and the labourmarket. Oxford: Oxford University Press, 1991.
Lechner, M. Mikroökonometrische Evaluationsstu-dien: Anmerkungen zu Theorie und Praxis. In:Pfeiffer, F.; Pohlmeier, W. (eds) Qualifikation, Weit-erbildung und Arbeitsmarkterfolg. Baden-Baden:Nomos-Verlag, 1998. (ZEW–Wirtschaftsanal-ysen, Vol. 31).
Lechner, M. Earnings and employment effects ofcontinuous off-the-job training in East Germanyafter unification. In: Journal of BusinessEconomic Statistics, 1999c, Vol. 17, p. 74-90.
Lechner,M. An evaluation of public sector sponsoredcontinuous vocational training programmes inEast Germany. In: Journal of Human Resources,2000a, p. 347-375.
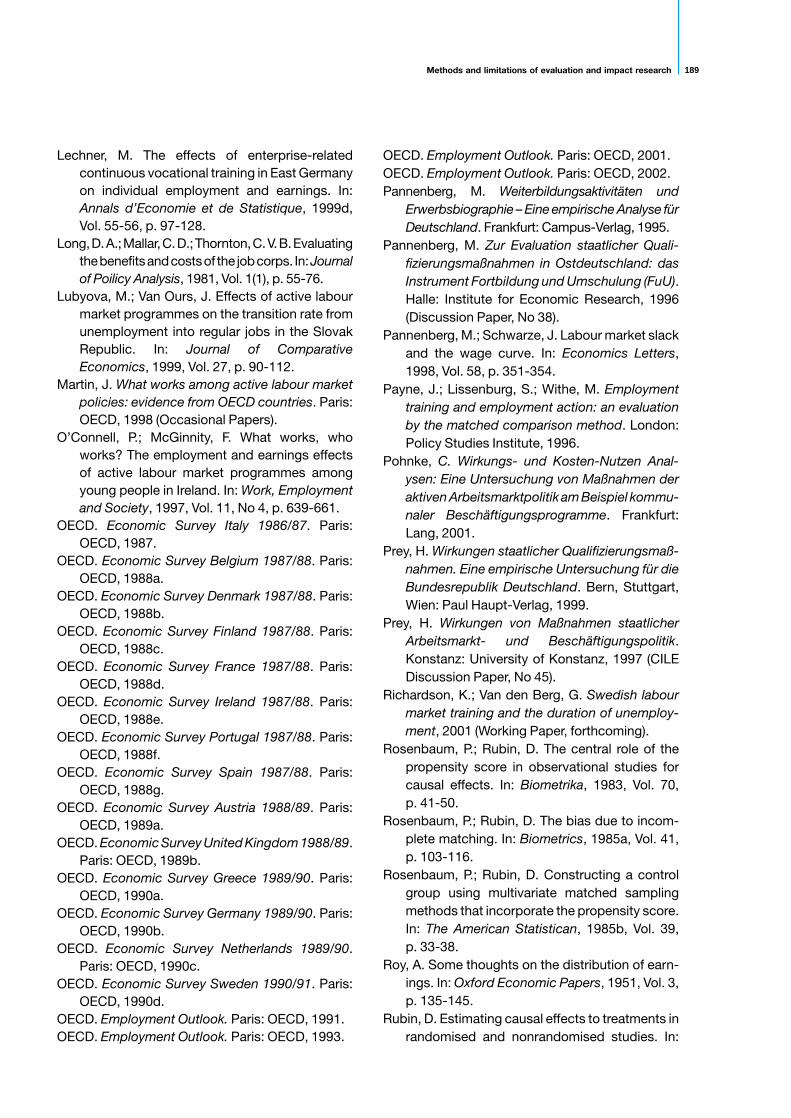
Methods and limitations of evaluation and impact research 189
Lechner, M. The effects of enterprise-relatedcontinuous vocational training in East Germanyon individual employment and earnings. In:Annals d’Economie et de Statistique, 1999d,Vol. 55-56, p. 97-128.
Long,D.A.; Mallar,C.D.; Thornton,C.V.B. Evaluatingthe benefits and costs of the job corps. In: Journalof Poilicy Analysis, 1981, Vol. 1(1), p. 55-76.
Lubyova, M.; Van Ours, J. Effects of active labourmarket programmes on the transition rate fromunemployment into regular jobs in the SlovakRepublic. In: Journal of ComparativeEconomics, 1999, Vol. 27, p. 90-112.
Martin, J. What works among active labour marketpolicies: evidence from OECD countries. Paris:OECD, 1998 (Occasional Papers).
O’Connell, P.; McGinnity, F. What works, whoworks? The employment and earnings effectsof active labour market programmes amongyoung people in Ireland. In: Work, Employmentand Society, 1997, Vol. 11, No 4, p. 639-661.
OECD. Economic Survey Italy 1986/87. Paris:OECD, 1987.
OECD. Economic Survey Belgium 1987/88. Paris:OECD, 1988a.
OECD. Economic Survey Denmark 1987/88. Paris:OECD, 1988b.
OECD. Economic Survey Finland 1987/88. Paris:OECD, 1988c.
OECD. Economic Survey France 1987/88. Paris:OECD, 1988d.
OECD. Economic Survey Ireland 1987/88. Paris:OECD, 1988e.
OECD. Economic Survey Portugal 1987/88. Paris:OECD, 1988f.
OECD. Economic Survey Spain 1987/88. Paris:OECD, 1988g.
OECD. Economic Survey Austria 1988/89. Paris:OECD, 1989a.
OECD. Economic Survey United Kingdom 1988/89.Paris: OECD, 1989b.
OECD. Economic Survey Greece 1989/90. Paris:OECD, 1990a.
OECD. Economic Survey Germany 1989/90. Paris:OECD, 1990b.
OECD. Economic Survey Netherlands 1989/90.Paris: OECD, 1990c.
OECD. Economic Survey Sweden 1990/91. Paris:OECD, 1990d.
OECD. Employment Outlook. Paris: OECD, 1991.OECD. Employment Outlook. Paris: OECD, 1993.
OECD. Employment Outlook. Paris: OECD, 2001.OECD. Employment Outlook. Paris: OECD, 2002.Pannenberg, M. Weiterbildungsaktivitäten und
Erwerbsbiographie – Eine empirische Analyse fürDeutschland. Frankfurt: Campus-Verlag, 1995.
Pannenberg, M. Zur Evaluation staatlicher Quali-fizierungsmaßnahmen in Ostdeutschland: dasInstrument Fortbildung und Umschulung (FuU).Halle: Institute for Economic Research, 1996(Discussion Paper, No 38).
Pannenberg, M.; Schwarze, J. Labour market slackand the wage curve. In: Economics Letters,1998, Vol. 58, p. 351-354.
Payne, J.; Lissenburg, S.; Withe, M. Employmenttraining and employment action: an evaluationby the matched comparison method. London:Policy Studies Institute, 1996.
Pohnke, C. Wirkungs- und Kosten-Nutzen Anal-ysen: Eine Untersuchung von Maßnahmen deraktiven Arbeitsmarktpolitik am Beispiel kommu-naler Beschäftigungsprogramme. Frankfurt:Lang, 2001.
Prey, H. Wirkungen staatlicher Qualifizierungsmaß-nahmen. Eine empirische Untersuchung für dieBundesrepublik Deutschland. Bern, Stuttgart,Wien: Paul Haupt-Verlag, 1999.
Prey, H. Wirkungen von Maßnahmen staatlicherArbeitsmarkt- und Beschäftigungspolitik.Konstanz: University of Konstanz, 1997 (CILEDiscussion Paper, No 45).
Richardson, K.; Van den Berg, G. Swedish labourmarket training and the duration of unemploy-ment, 2001 (Working Paper, forthcoming).
Rosenbaum, P.; Rubin, D. The central role of thepropensity score in observational studies forcausal effects. In: Biometrika, 1983, Vol. 70,p. 41-50.
Rosenbaum, P.; Rubin, D. The bias due to incom-plete matching. In: Biometrics, 1985a, Vol. 41,p. 103-116.
Rosenbaum, P.; Rubin, D. Constructing a controlgroup using multivariate matched samplingmethods that incorporate the propensity score.In: The American Statistican, 1985b, Vol. 39,p. 33-38.
Roy, A. Some thoughts on the distribution of earn-ings. In: Oxford Economic Papers, 1951, Vol. 3,p. 135-145.
Rubin, D. Estimating causal effects to treatments inrandomised and nonrandomised studies. In:
The foundations of evaluation and impact research190
Journal of Educational Psychology, 1974,Vol. 66, p. 688-701.
Rubin, D. Assignment to treatment group on thebasis of a covariate. In: Journal of EducationalStudies, 1977, Vol. 2, p. 1-26.
Rubin, D. Using multivariate matched sampling andregression adjustment to control bias in observa-tional studies. In: Journal of the American Statis-tical Association, 1979, Vol. 74, p. 318-328.
Rubin,D. Comment on Basu,D. Randomization anal-ysis of experimental data: The Fisher randomiza-tion test. In: Journal of the American StatisticalAssociation, 1980, Vol. 75, p. 591-593.
Schmidt, C. Knowing what works: the case forrigorous program evaluation. Bonn: IZA, 1999(Discussion Paper, No 77).
Schmid, G.; Speckesser, S.; Hilbert, C. Does activelabour market policy matter? An aggregateimpact analysis for Germany. In: Labour marketpolicy and unemployment. Evaluation of activemeasures in France, Germany, The Nether-lands, Spain and Sweden, Cheltenham: EdwardElgar, 2000.
Scriven, M. Evaluation thesaurus (Fourth edition).Newbury Park, CA: Sage Publications, 1991.
Sianesi, B. An evaluation of the active labour marketprogrammes in Sweden. Uppsala: IFAU, 2001(Working Paper, 2001:5).
Smith, J. Evaluating active labour market policies:lessons from North America. In: Mitteilungenaus der Arbeitsmarkt und Berufsforschung,Schwerpunktheft: Erfolgskontrolle aktiverArbeitsmarktpolitik, 2000, Vol. 3, p. 345-356.
Smith, J.; Todd, P. Does matching overcomeLaLonde’s critique of nonexperimental estima-tors. University of Western Ontario, Universityof Pennsylvania, 2000. (Working Paper).
Staat, M. Empirische Evaluation von Fortbildung undUmschulung. Baden-Baden: Nomos-Verlag,1997(Schriftenreihe des ZEW, 21).
Steiner, V.; Hagen, T. Was kann die Aktive Arbeits-marktpolitik in Deutschland aus der Evalua-tionsforschung in anderen europäischenLändern lernen? In: Perspektiven derWirtschaftspolitik 2000, 2002, Vol. 3, No 2,p. 189-206.
Steiner, V. et al. Strukturanalyse der Arbeitsmark-tentwicklung in den neuen Bundesländern.Baden-Baden: Nomos Verlag, 1998.
Van Ours, J. Do active labour market policies helpunemployed workers to find and keep regularjobs? Tilburg: Center for Economic Research,2000 (Discussion Paper, No 0010).
Winter-Ebmer, R. Evaluating an innovative redun-dancy-retraining project: the Austrian SteelFoundation. London: CEPR – Centre forEconomic policy research 2001 (DiscussionPaper, DP2776).
Worthen, B. R.; Sanders, J. R.; Fitzpatrick, J. L.Program evaluation: alternative approachesand practical guidelines (Second edition). NewYork: Longman, 1997.
Zweimüller, J.; Winter-Ebmer, R. Manpower trainingprogrammes and employment stability. In:Economica, 1996, Vol. 63, p. 113-130.