Impact Evaluation
42
Impact Evaluation: An Overview Wali Memon Wali Memon 1
-
Upload
wali-memon -
Category
Education
-
view
172 -
download
1
Transcript of Impact Evaluation
Impact Evaluation:
An Overview
Wali Memon
Wali Memon1
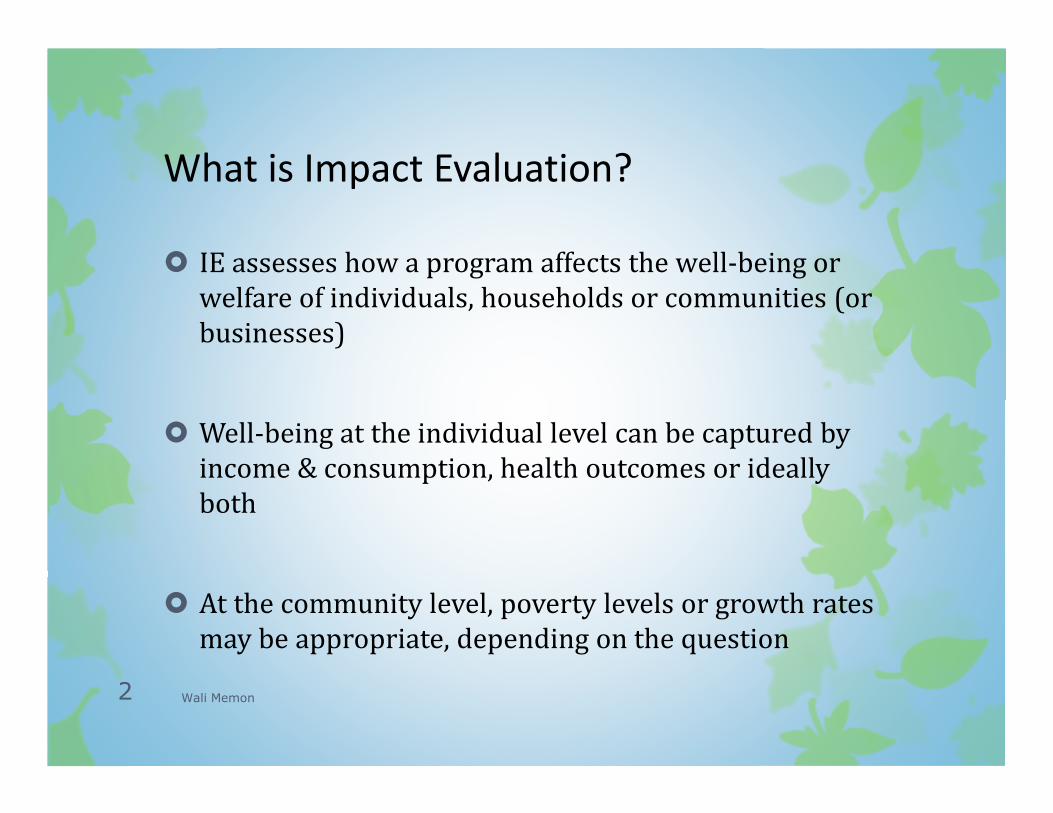
What is Impact Evaluation?
� IE assesses how a program affects the well-being or
welfare of individuals, households or communities (or
businesses)
� Well-being at the individual level can be captured by
income & consumption, health outcomes or ideally
both
� At the community level, poverty levels or growth rates
may be appropriate, depending on the question
Wali Memon2
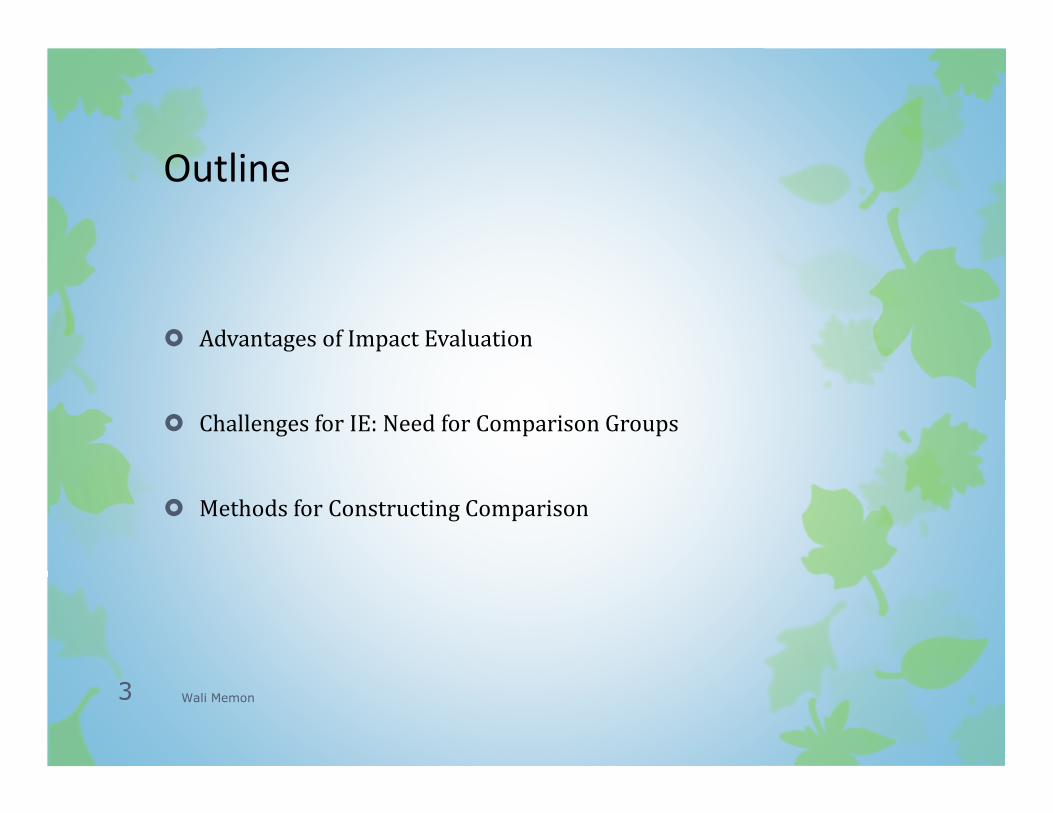
Outline
� Advantages of Impact Evaluation
� Challenges for IE: Need for Comparison Groups
� Methods for Constructing Comparison
Wali Memon3
IE Versus other M&E Tools
� The key distinction between impact evaluation
and other M&E tools is the focus on discerning the
impact of the program from all other confounding
effects
� IE seeks to provide evidence of the causal link
between an intervention and outcomes
Wali Memon4
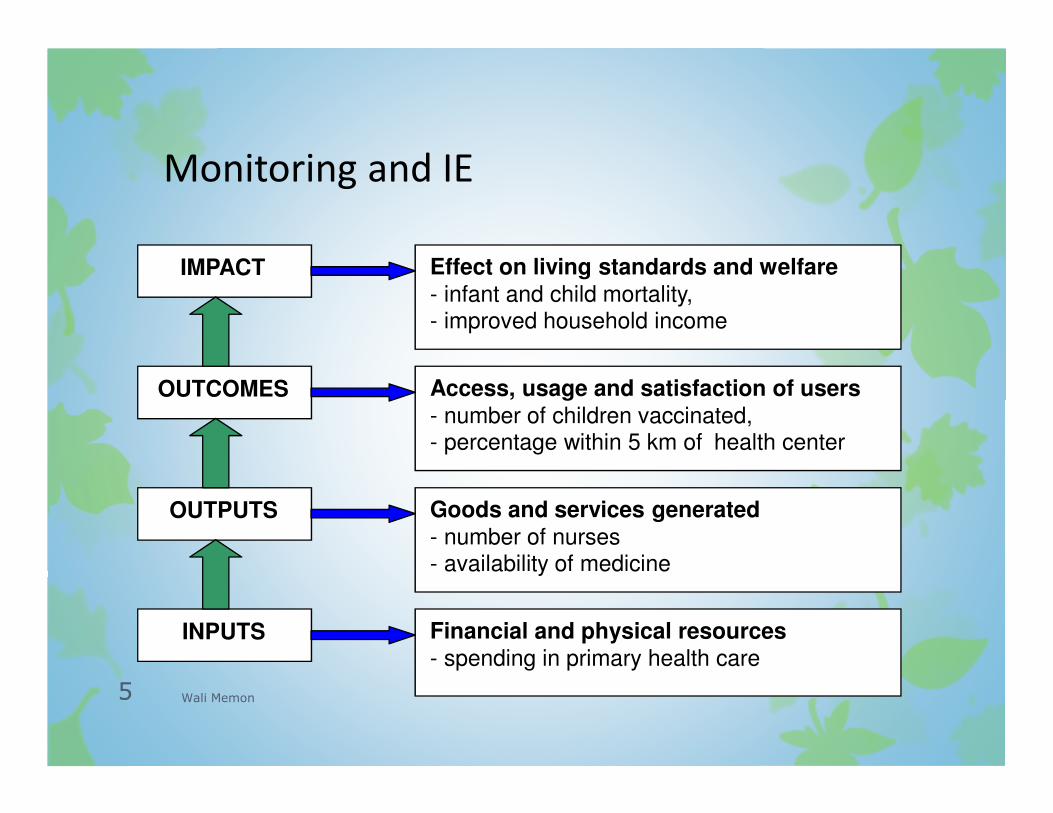
Monitoring and IE
IMPACT
OUTPUTS
OUTCOMES
INPUTS
Effect on living standards and welfare
- infant and child mortality, - improved household income
Financial and physical resources - spending in primary health care
Goods and services generated
- number of nurses- availability of medicine
Access, usage and satisfaction of users
- number of children vaccinated, - percentage within 5 km of health center
Wali Memon5
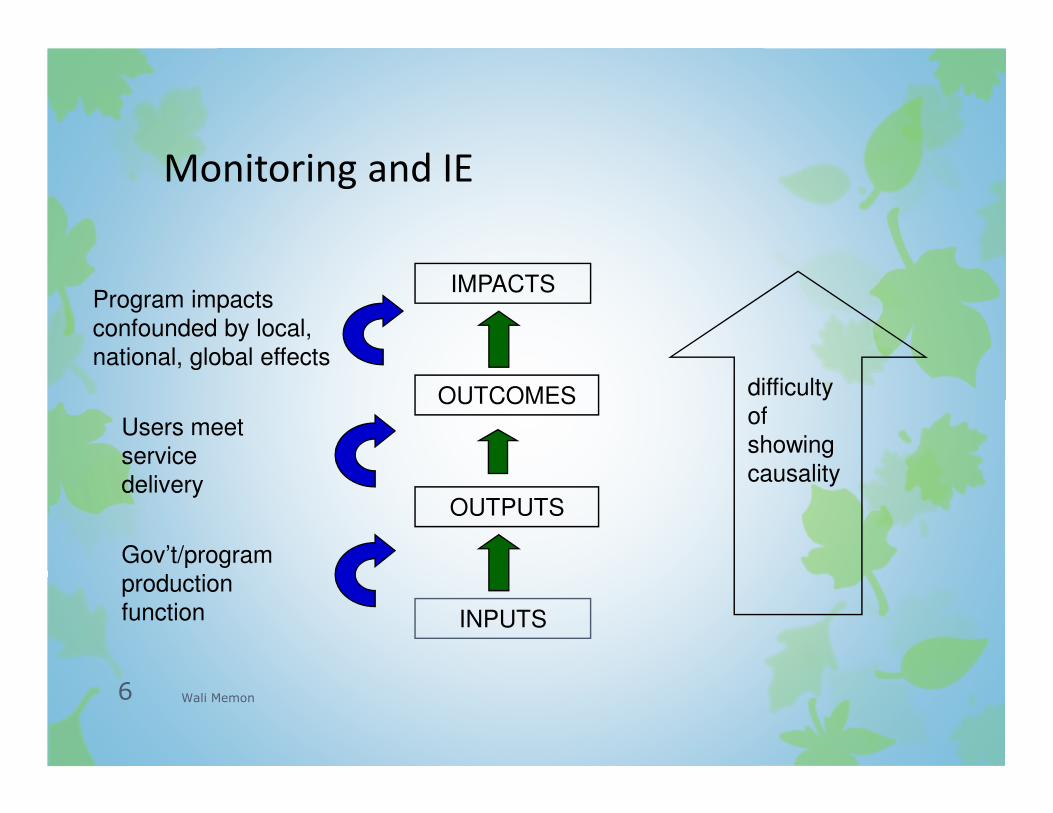
Monitoring and IE
Gov’t/program
production
function
Users meet
service
delivery
INPUTS
OUTPUTS
OUTCOMES
IMPACTSProgram impacts
confounded by local,
national, global effects
difficulty
of
showing
causality
Wali Memon6
Logic Model: An Example
� Consider a program of providing Insecticide-Treated Nets (ITNs) to
poor households
� What are:
� Inputs?
� Outputs?
� Outcomes?
� Impacts?
Wali Memon7
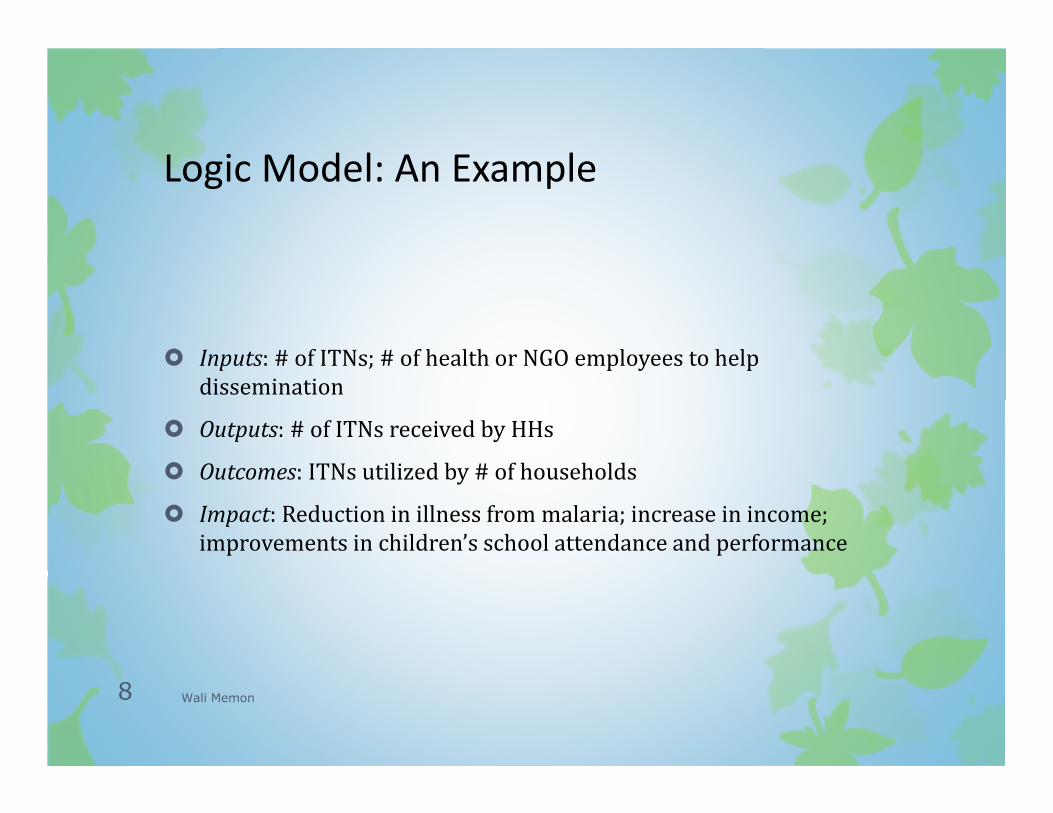
Logic Model: An Example
� Inputs: # of ITNs; # of health or NGO employees to help
dissemination
� Outputs: # of ITNs received by HHs
� Outcomes: ITNs utilized by # of households
� Impact: Reduction in illness from malaria; increase in income;
improvements in children’s school attendance and performance
Wali Memon8
Advantages of IE
� In order to be able to determine which projects are successful, need a carefully designed impact evaluation strategy
� This is useful for:� Understanding if projects worked:
� Justification for funding
� Scaling up
� Meta-analysis: Learning from Others
� Cost-benefit tradeoffs across projects
� Can test between different approaches of same program or different projects to meet national indicator
Wali Memon9
Essential Methodology
� Difficulty is determining what would have happened to the individuals or communities of interest in absence of the project
� The key component to an impact evaluation is to construct a suitable comparison group to proxy for the “counterfactual”
� Problem: can only observe people in one state of the world at one time
Wali Memon10
Before/After Comparisons
� Why not collect data on individuals before and after intervention (the Reflexive)? Difference in income, etc, would be due to project
� Problem: many things change over time, including the project
� The country is growing and ITN usage is increasing generally (from 2000-2003 in NetMark data), so how do we know an increase in ITN use is due to the program or would have occurred in absence of program?
� Many factors affect malaria rate in a given year
Wali Memon11
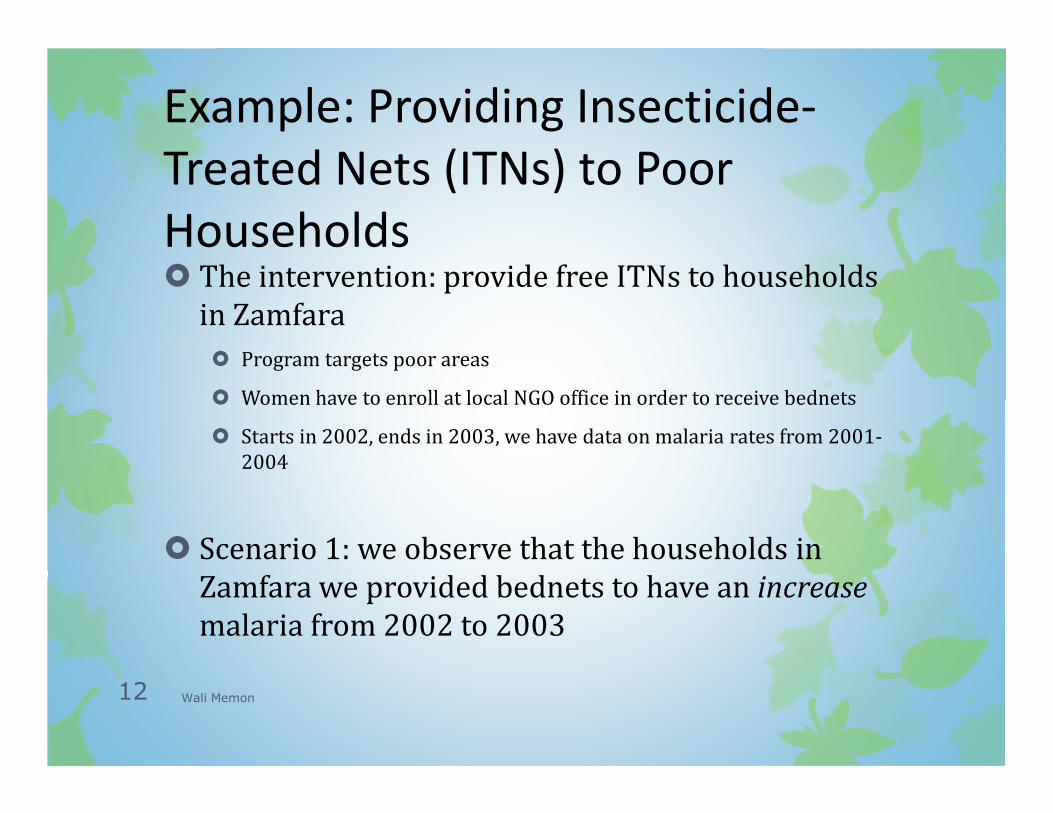
Example: Providing Insecticide-
Treated Nets (ITNs) to Poor
Households� The intervention: provide free ITNs to households
in Zamfara
� Program targets poor areas
� Women have to enroll at local NGO office in order to receive bednets
� Starts in 2002, ends in 2003, we have data on malaria rates from 2001-
2004
� Scenario 1: we observe that the households in
Zamfara we provided bednets to have an increase
malaria from 2002 to 2003
Wali Memon12
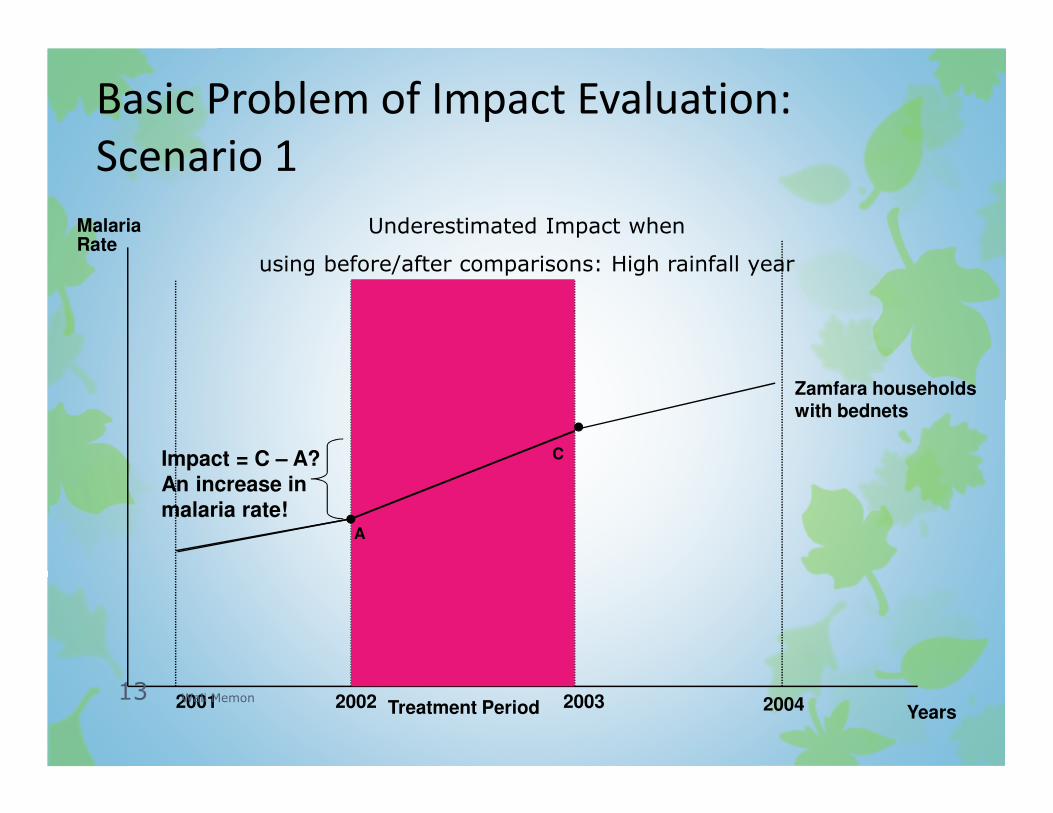
Years
Malaria Rate
2001 2002 2003 2004Treatment Period
A
CImpact = C – A?An increase in malaria rate!
Underestimated Impact when
using before/after comparisons: High rainfall year
Basic Problem of Impact Evaluation:
Scenario 1
Zamfara households with bednets
Wali Memon13
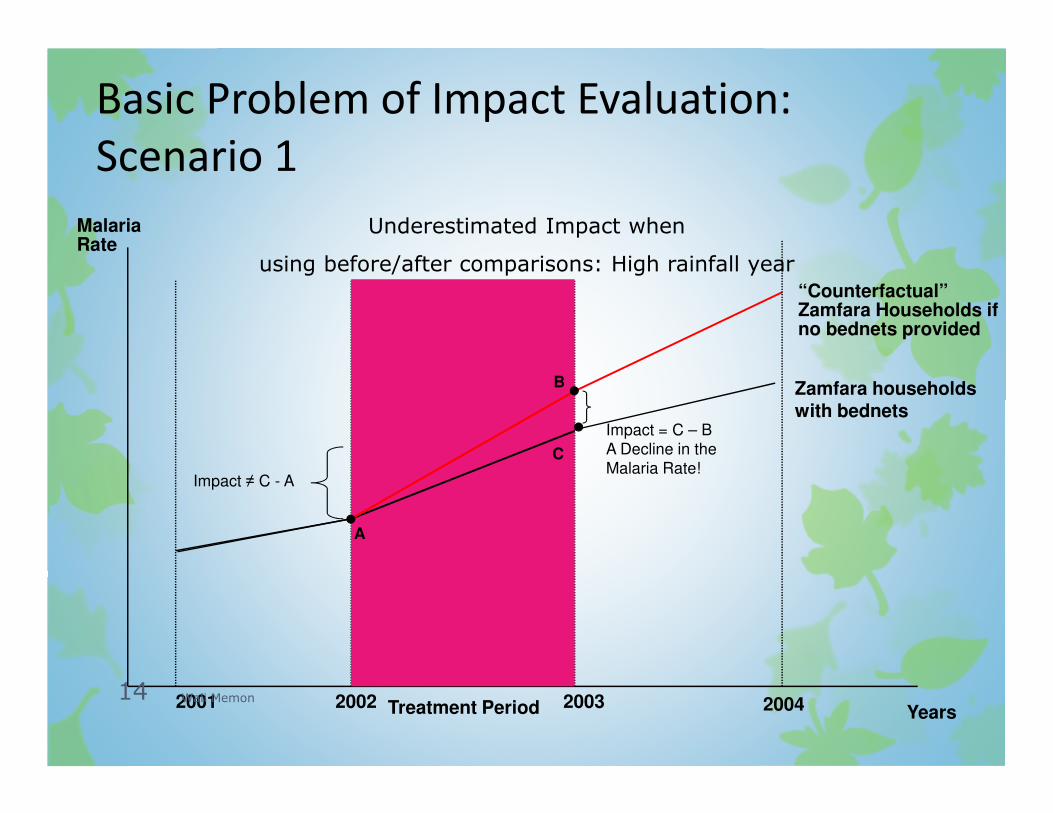
“Counterfactual”Zamfara Households if no bednets provided
Years
Malaria Rate
2001 2002 2003 2004Treatment Period
Impact = C – B
A Decline in the
Malaria Rate!
A
B
C
Impact ≠ C - A
Underestimated Impact when
using before/after comparisons: High rainfall year
Basic Problem of Impact Evaluation:
Scenario 1
Zamfara households with bednets
Wali Memon14
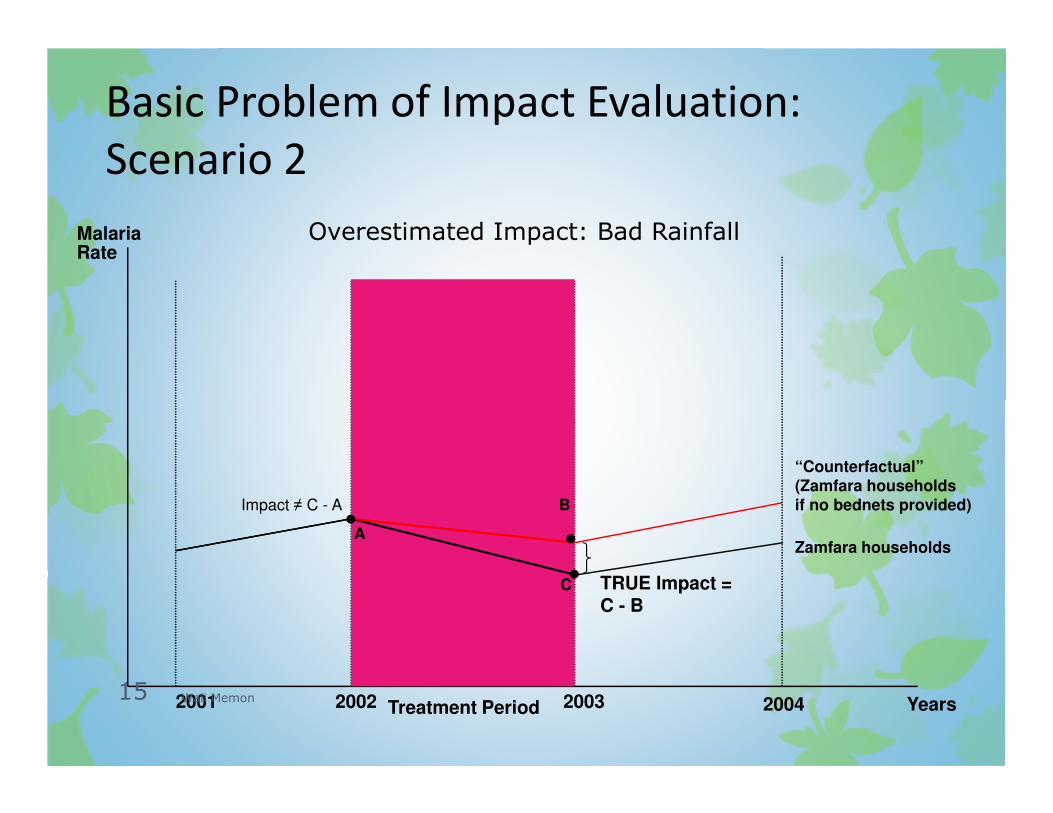
“Counterfactual” (Zamfara households if no bednets provided)
Years
Malaria Rate
2001 2002 2003 2004Treatment Period
TRUE Impact = C - B
A
B
C
Overestimated Impact: Bad Rainfall
Impact ≠ C - A
Basic Problem of Impact Evaluation:
Scenario 2
Zamfara households
Wali Memon15
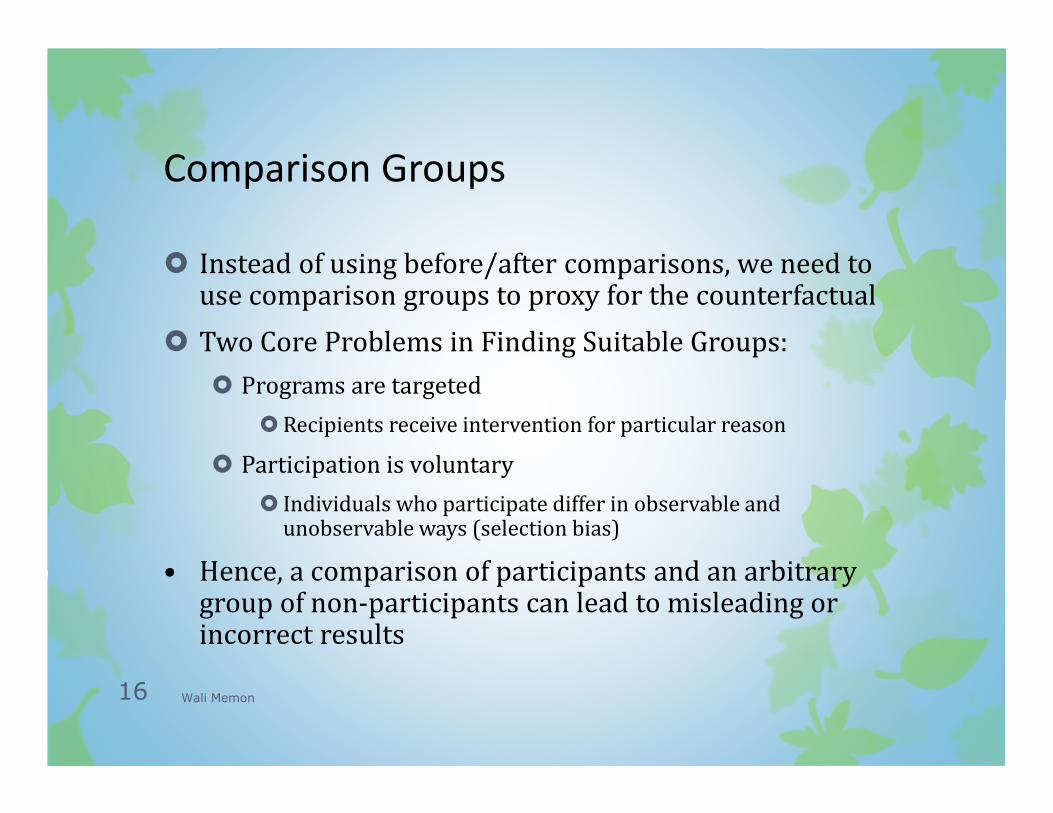
Comparison Groups
� Instead of using before/after comparisons, we need to use comparison groups to proxy for the counterfactual
� Two Core Problems in Finding Suitable Groups:
� Programs are targeted
�Recipients receive intervention for particular reason
� Participation is voluntary
� Individuals who participate differ in observable and unobservable ways (selection bias)
• Hence, a comparison of participants and an arbitrary group of non-participants can lead to misleading or incorrect results
Wali Memon16
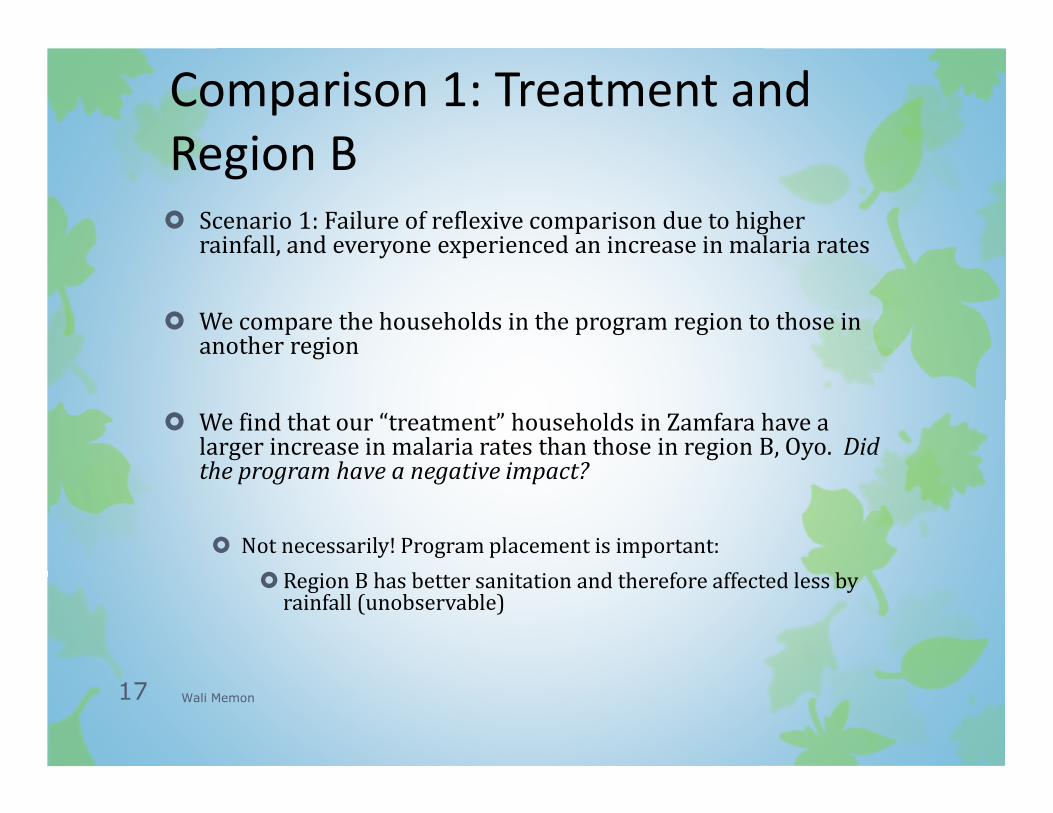
Comparison 1: Treatment and
Region B� Scenario 1: Failure of reflexive comparison due to higher
rainfall, and everyone experienced an increase in malaria rates
� We compare the households in the program region to those in another region
� We find that our “treatment” households in Zamfara have a larger increase in malaria rates than those in region B, Oyo. Did the program have a negative impact?
� Not necessarily! Program placement is important:
�Region B has better sanitation and therefore affected less by rainfall (unobservable)
Wali Memon17
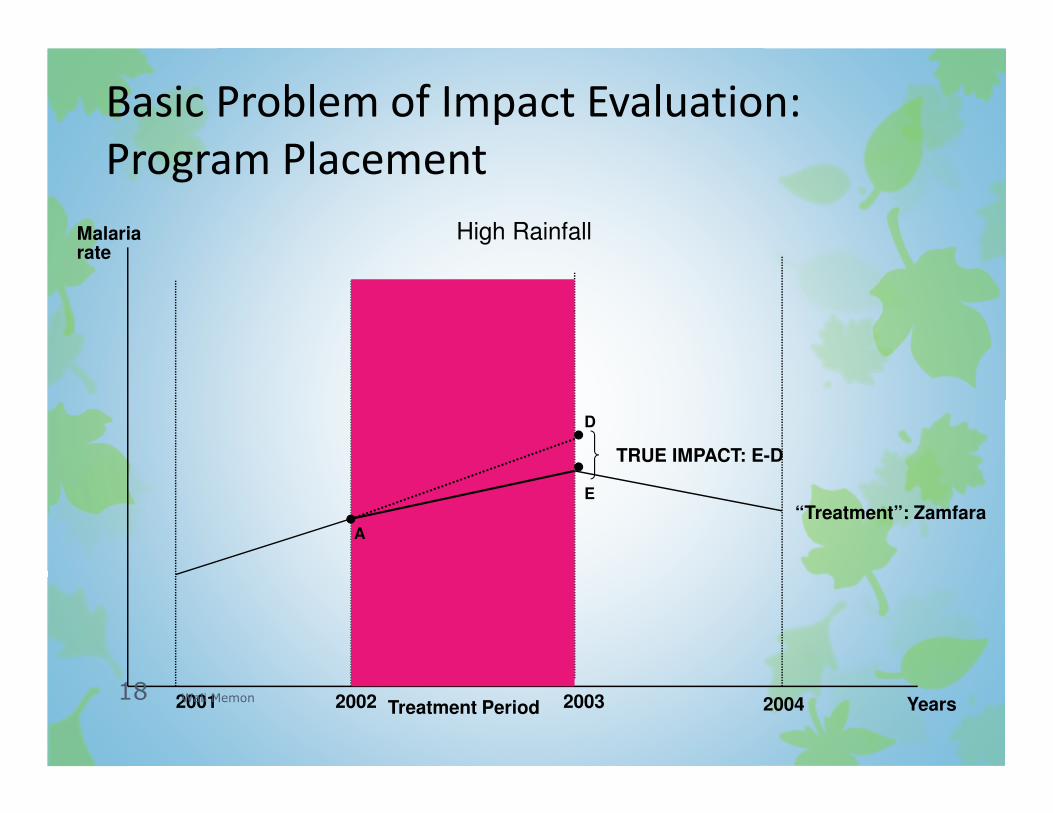
Years
Malaria rate
2001 2002 2003 2004Treatment Period
High Rainfall
Basic Problem of Impact Evaluation:
Program Placement
“Treatment”: ZamfaraA
D
E
TRUE IMPACT: E-D
Wali Memon18
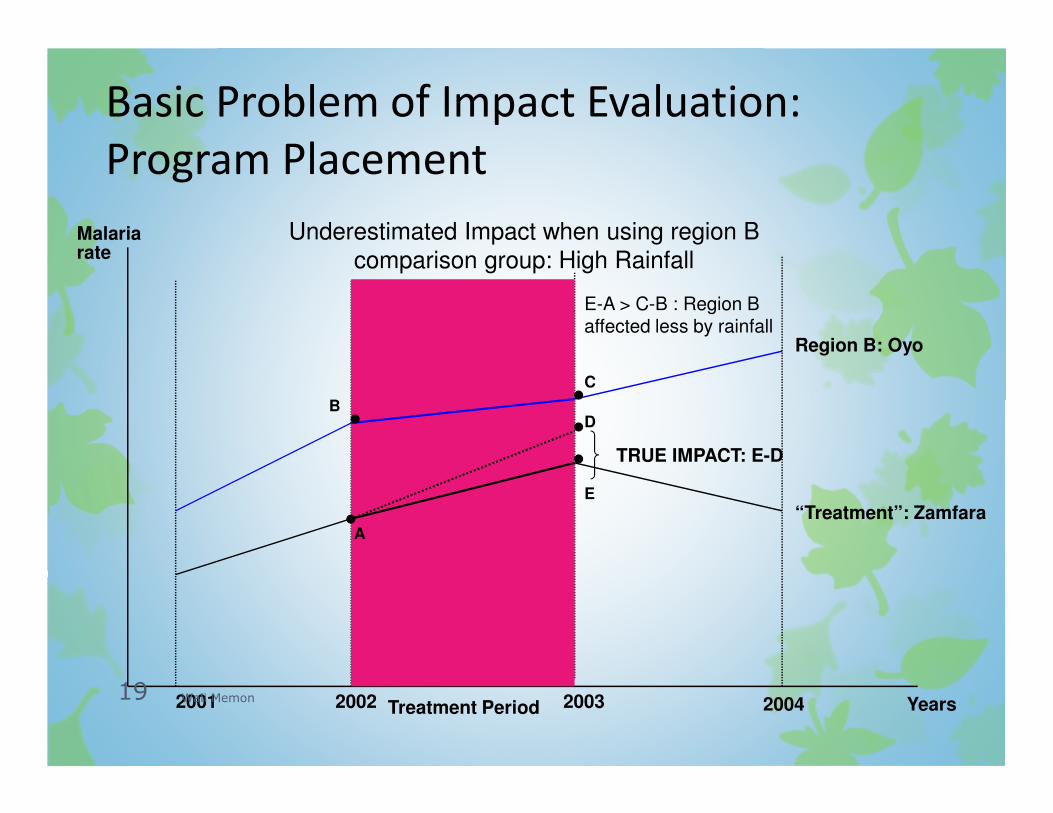
Years
Malaria rate
2001 2002 2003 2004Treatment Period
Underestimated Impact when using region B
comparison group: High Rainfall
Basic Problem of Impact Evaluation:
Program Placement
“Treatment”: Zamfara
Region B: Oyo
A
B
C
D
E-A > C-B : Region B affected less by rainfall
E
TRUE IMPACT: E-D
Wali Memon19
Comparison 2: Treatment vs.
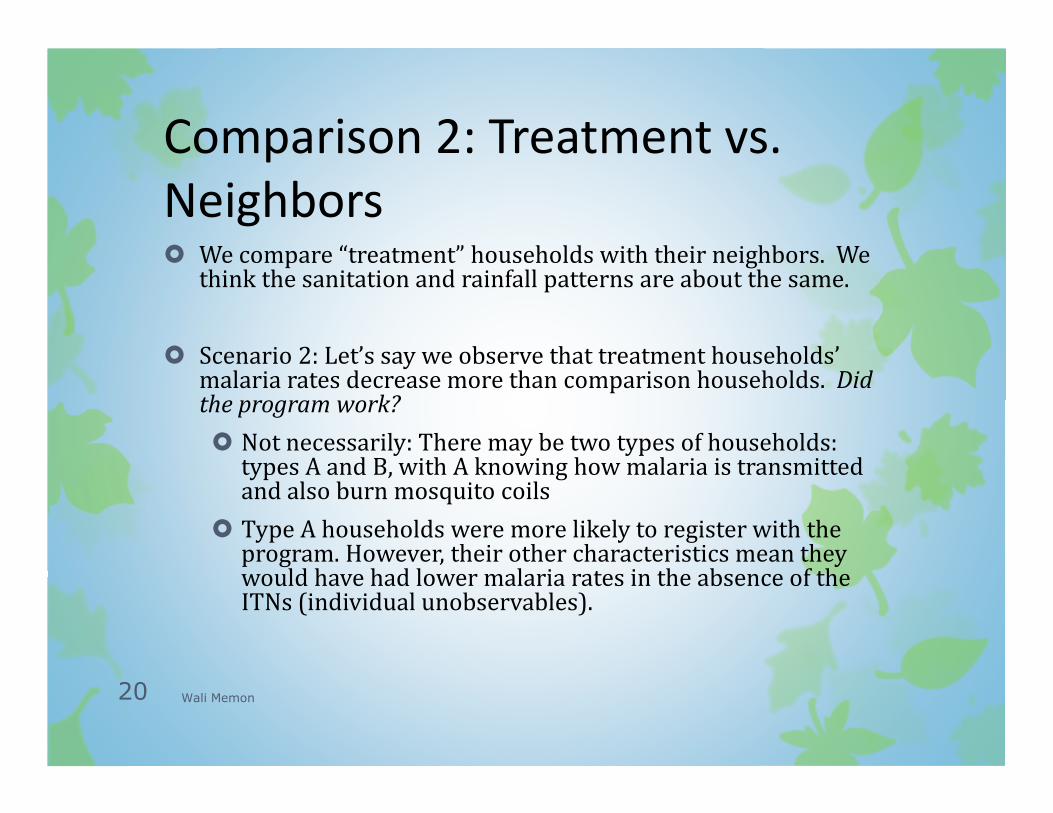
Neighbors� We compare “treatment” households with their neighbors. We
think the sanitation and rainfall patterns are about the same.
� Scenario 2: Let’s say we observe that treatment households’ malaria rates decrease more than comparison households. Did the program work?
� Not necessarily: There may be two types of households: types A and B, with A knowing how malaria is transmitted and also burn mosquito coils
� Type A households were more likely to register with the program. However, their other characteristics mean they would have had lower malaria rates in the absence of the ITNs (individual unobservables).
Wali Memon20
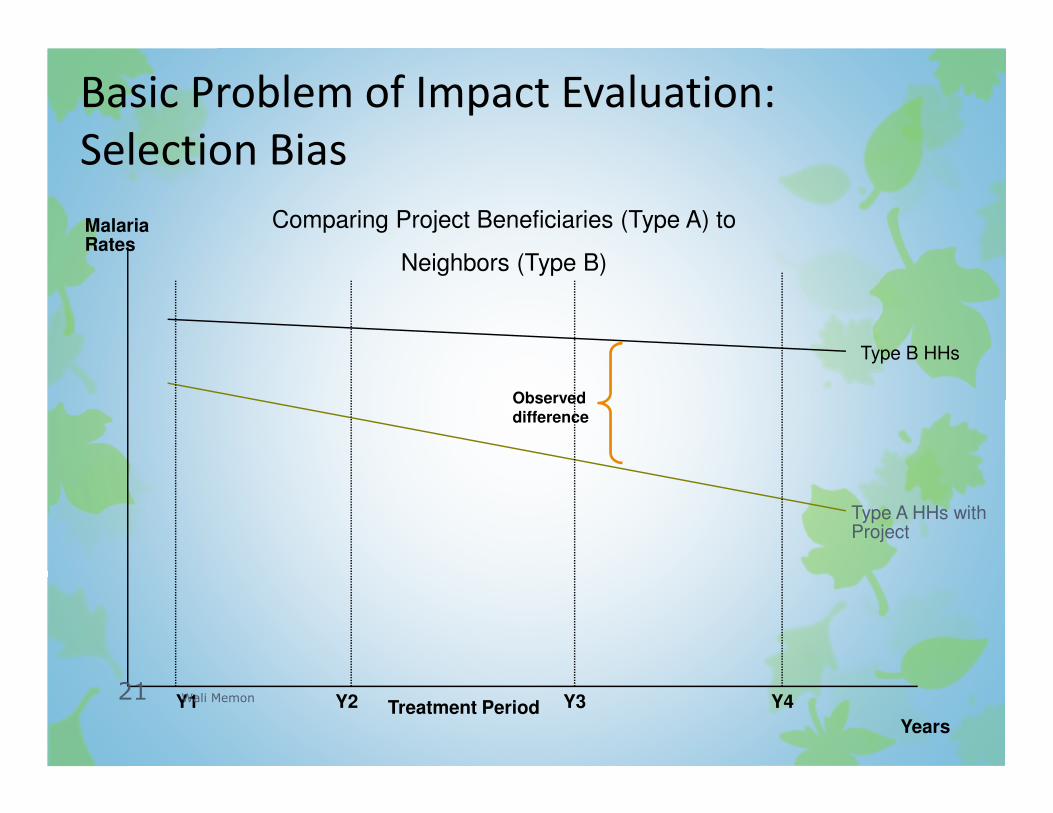
Type A HHs with Project
Years
Malaria Rates
Y1 Y2 Y3 Y4Treatment Period
Basic Problem of Impact Evaluation:
Selection Bias
Type B HHs
Observed difference
Comparing Project Beneficiaries (Type A) to
Neighbors (Type B)
Wali Memon21
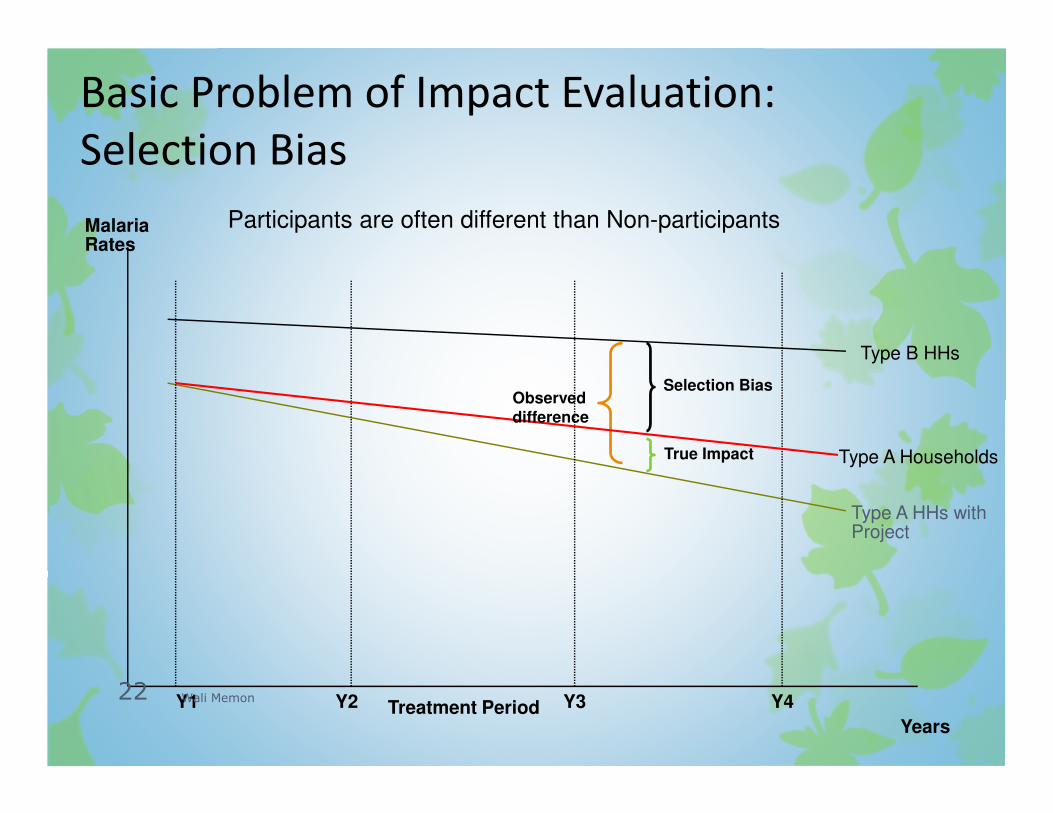
Type A HHs with Project
Type A Households
Years
Malaria Rates
Y1 Y2 Y3 Y4Treatment Period
Basic Problem of Impact Evaluation:
Selection Bias
Type B HHs
True Impact
Selection BiasObserved difference
Participants are often different than Non-participants
Wali Memon22
Basic Problem of Impact Evaluation:
Spillover Effects
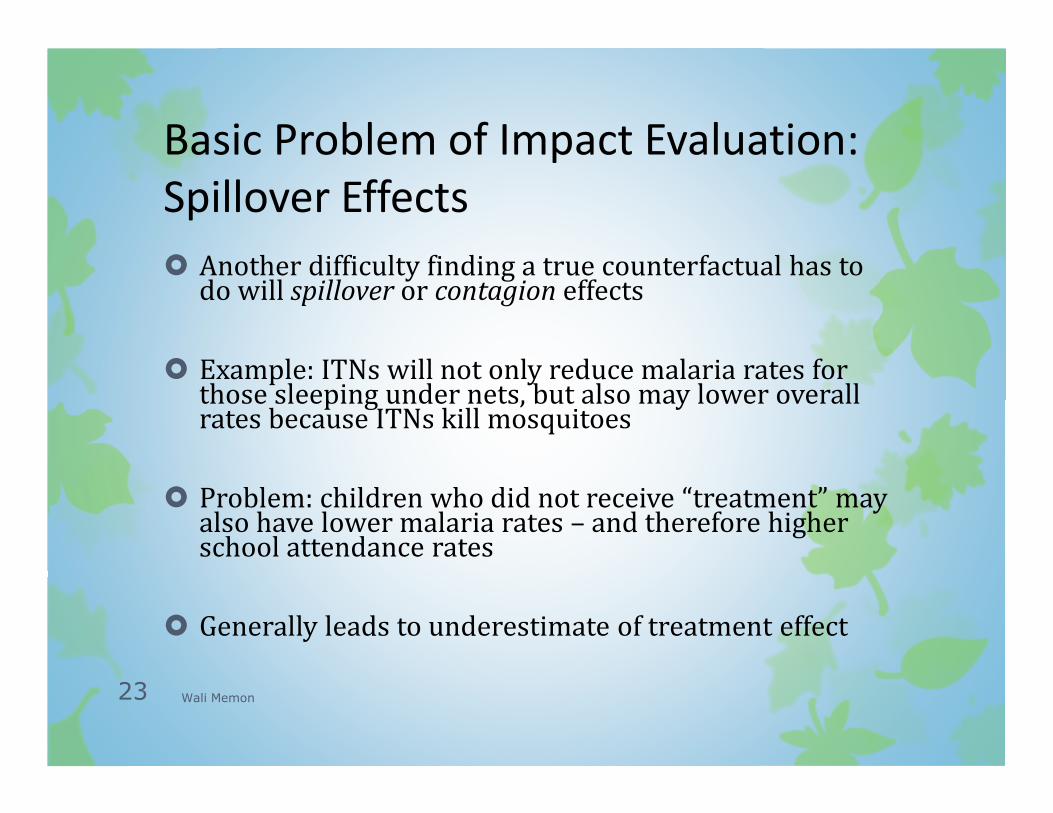
� Another difficulty finding a true counterfactual has to do will spillover or contagion effects
� Example: ITNs will not only reduce malaria rates for those sleeping under nets, but also may lower overall rates because ITNs kill mosquitoes
� Problem: children who did not receive “treatment” may also have lower malaria rates – and therefore higher school attendance rates
� Generally leads to underestimate of treatment effect
Wali Memon23
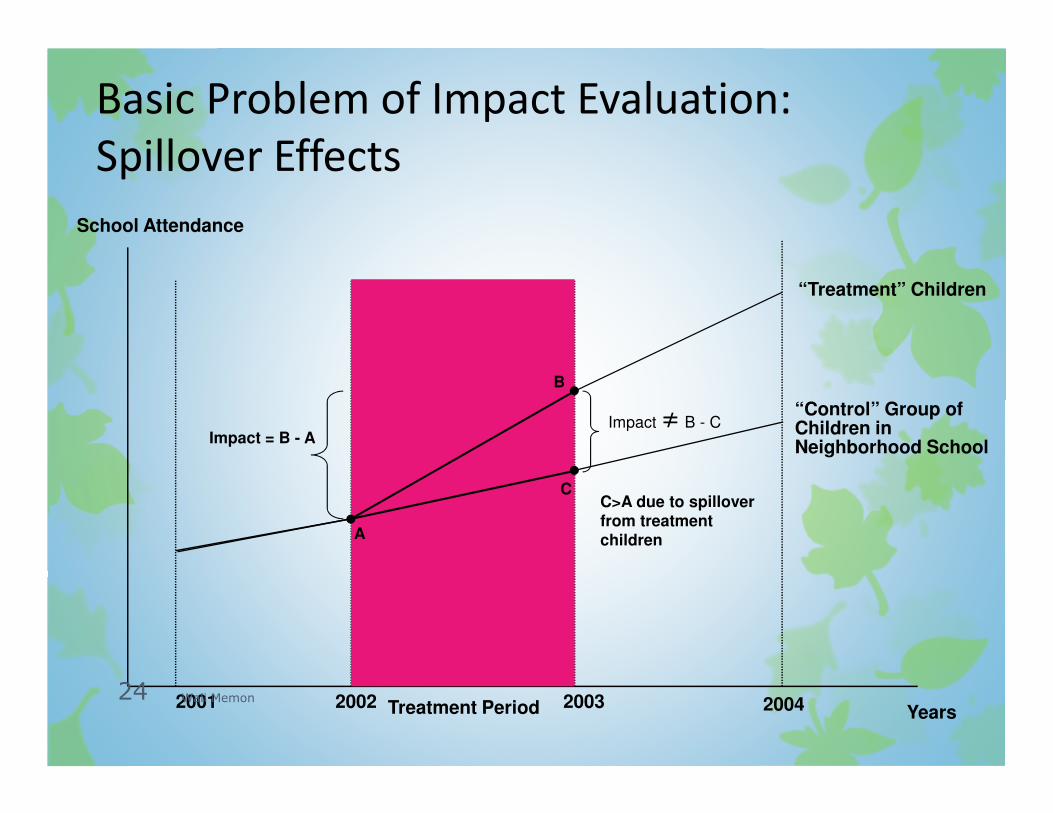
“Treatment” Children
Years
School Attendance
2001 2002 2003 2004Treatment Period
Impact ≠ B - C
A
B
C
Impact = B - A
Basic Problem of Impact Evaluation:
Spillover Effects
“Control” Group of Children in Neighborhood School
C>A due to spilloverfrom treatment children
Wali Memon24
Counterfactual: Methodology
� We need a comparison group that is as identical in observable and
unobservable dimensions as possible, to those receiving the
program, and a comparison group that will not receive spillover
benefits.
� Number of techniques:
�Randomization as gold standard
�Various Techniques of Matching
Wali Memon25
How to construct a comparison
group – building the
counterfactual1. Randomization
2. Difference-in-Difference
3. Regression discontinuity
4. Matching
� Pipeline comparisons
� Propensity score
Wali Memon26
1. Randomization
� Individuals/communities/firms are randomly assigned into participation
� Counterfactual: randomized-out group
� Advantages:
� Often addressed to as the “gold standard”: by design: selection bias is zero on average and mean impact is revealed
� Perceived as a fair process of allocation with limited resources
Wali Memon27
Randomization: Disadvantages
� Disadvantages:
� Ethical issues, political constraints
� Internal validity (exogeneity): people might not comply with the
assignment (selective non-compliance)
� External validity (generalizability): usually run controlled experiment
on a pilot, small scale. Difficult to extrapolate the results to a larger
population.
� Does not always solve problem of spillovers
Wali Memon28
When to Randomize
� If funds are insufficient to treat all eligible recipients
� Randomization can be the most fair and transparent approach
� The program is administered at the individual, household or community level
� Higher level of implementation difficult: example – trunk roads
� Program will be scaled-up: learning what works is very valuable
Wali Memon29
2. Difference-in-difference
� Observations over time: compare observed changes in the outcomes for a sample of participants and non-participants
� Identification assumption: the selection bias or unobservable characteristics are time-invariant (‘parallel trends’ in the absence of the program)
� Counter-factual: changes over time for the non-participants
Wali Memon30
Diff-in-Diff: Continued
Constraint: Requires at least two cross-sections of data,
pre-program and post-program on participants
and non-participants
� Need to think about the evaluation ex-ante, before the program
� More valid if there are 2 pre-periods so can observe whether trend is
same
� Can be in principle combined with matching to
adjust for pre-treatment differences that affect the
growth rate
Wali Memon31
Implementing differences in
differences: Different Strategies
� Some arbitrary comparison group
� Matched diff in diff
� Randomized diff in diff
� These are in order of more problems � less problems, think about
this as we look at this graphically
Wali Memon32
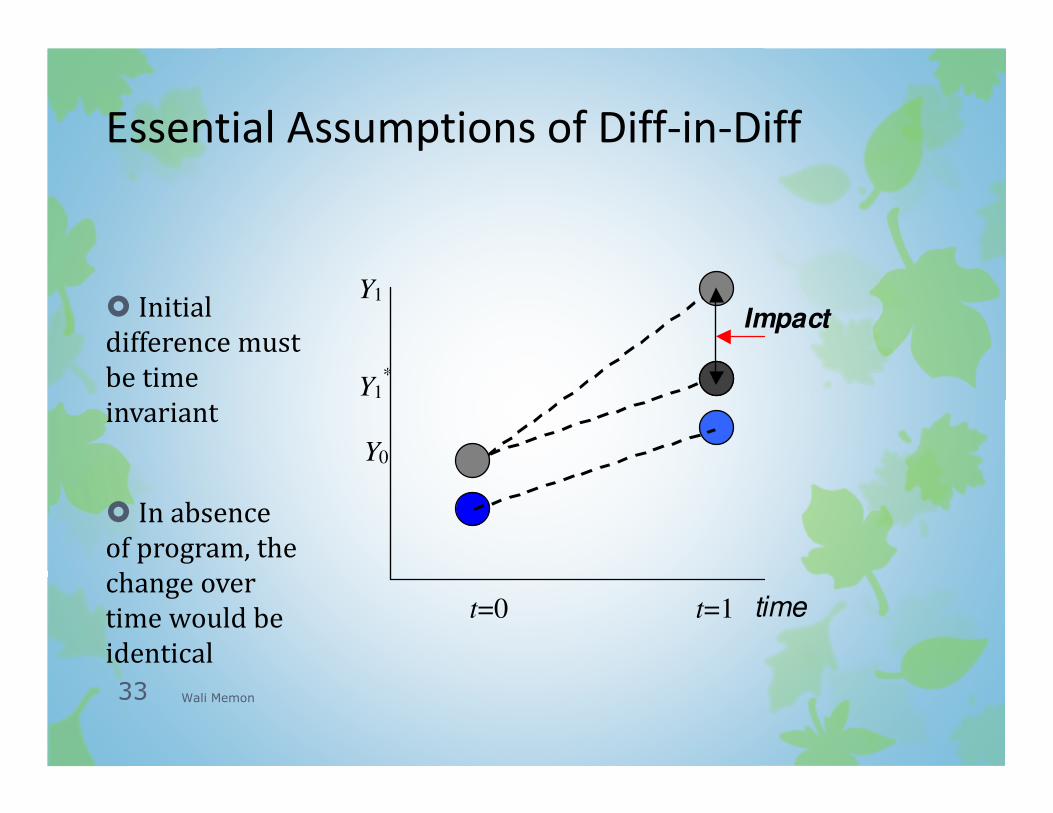
Essential Assumptions of Diff-in-Diff
� Initial
difference must
be time
invariant
� In absence
of program, the
change over
time would be
identical
Y1
Impact
Y1
*
Y0
t=0 t=1 time
Wali Memon33
Difference-in-Difference in ITN
Example
� Instead of comparing Zamfara to Oyo, compare Zamfara to Niger if:
� While Zamfara and Oyo have different malaria rates and different ITN
usage, we expect that they change in parallel
� Use NetMark data to compare 2000 to 2003 in Zamfara and Niger
states
� Use additional data (GHS, NLSS) to compare incomes and sanitation
infrastructure levels and changes prior to program implementation
Wali Memon34
3. Regression discontinuity design
� Exploit the rule generating assignment into a program given to individuals only above a given threshold – Assume that discontinuity in participation but not in counterfactual outcomes
� Counterfactual: individuals just below the cut-off who did not participate
� Advantages:
� “Identification” built in the program design
� Delivers marginal gains from the program around the eligibility cut-off point. Important for program expansion
� Disadvantages:
� Threshold has to be applied in practice, and individuals should not be able manipulate the score used in the program to become eligibleWali Memon35
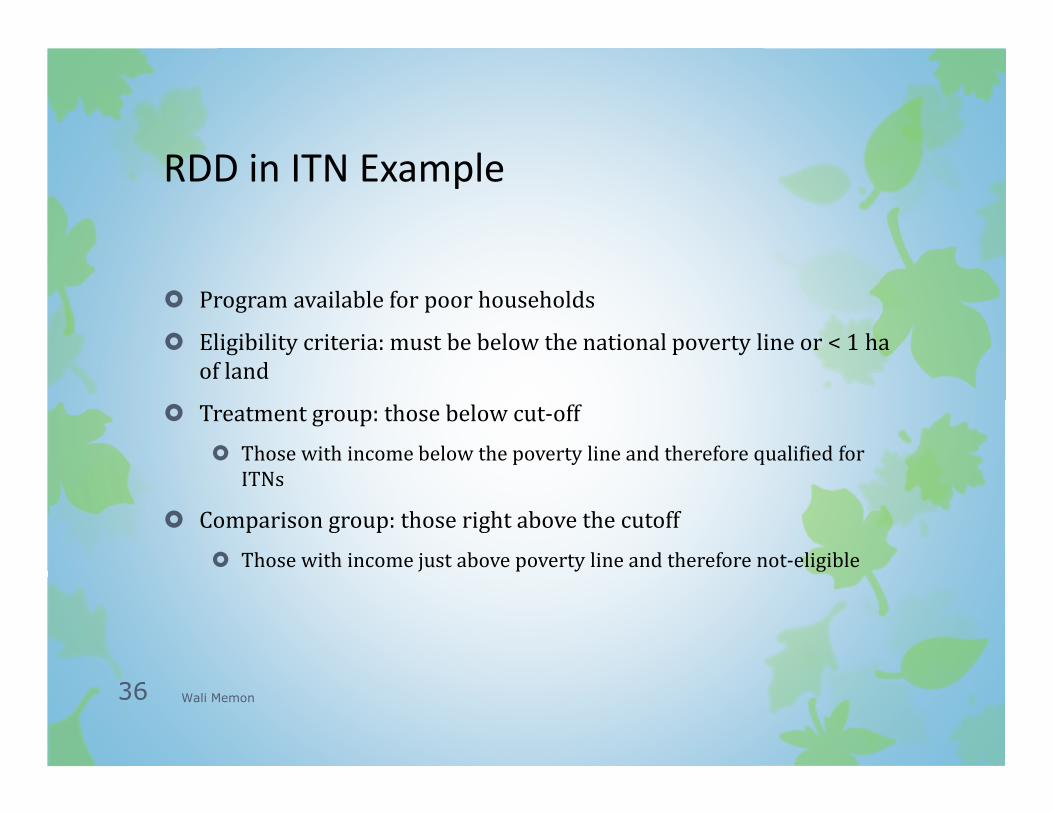
RDD in ITN Example
� Program available for poor households
� Eligibility criteria: must be below the national poverty line or < 1 ha
of land
� Treatment group: those below cut-off
� Those with income below the poverty line and therefore qualified for
ITNs
� Comparison group: those right above the cutoff
� Those with income just above poverty line and therefore not-eligible
Wali Memon36
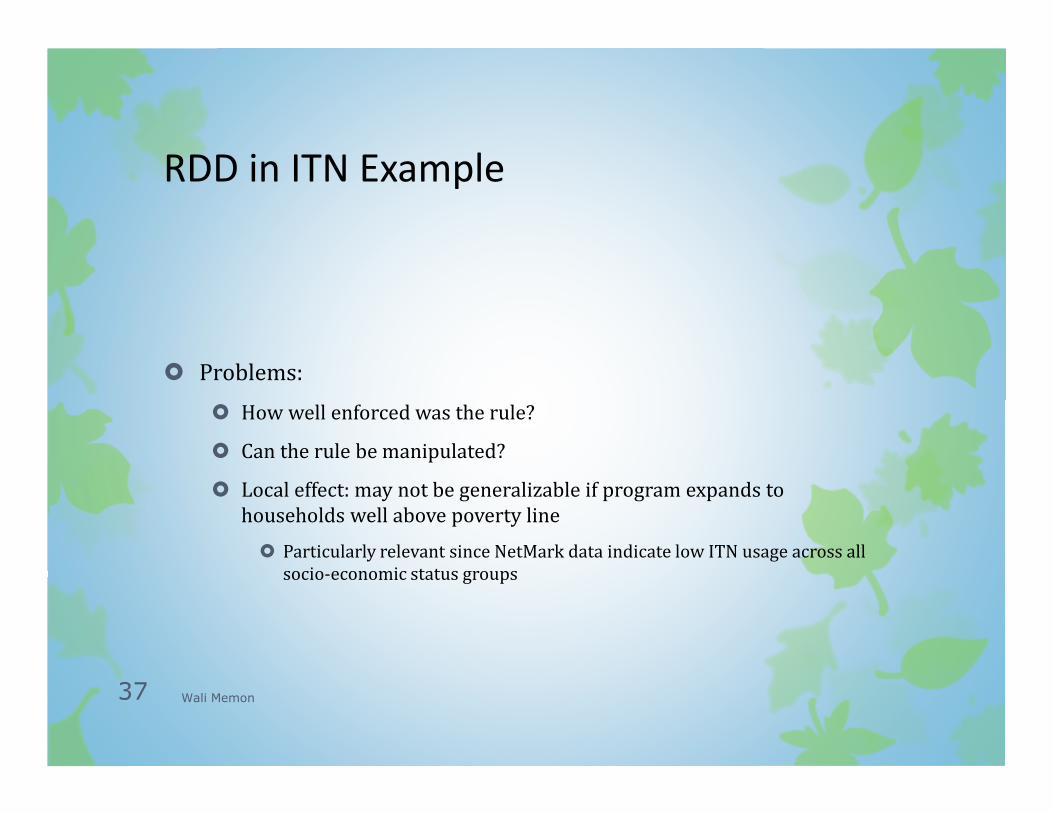
RDD in ITN Example
� Problems:
� How well enforced was the rule?
� Can the rule be manipulated?
� Local effect: may not be generalizable if program expands to
households well above poverty line
� Particularly relevant since NetMark data indicate low ITN usage across all
socio-economic status groups
Wali Memon37
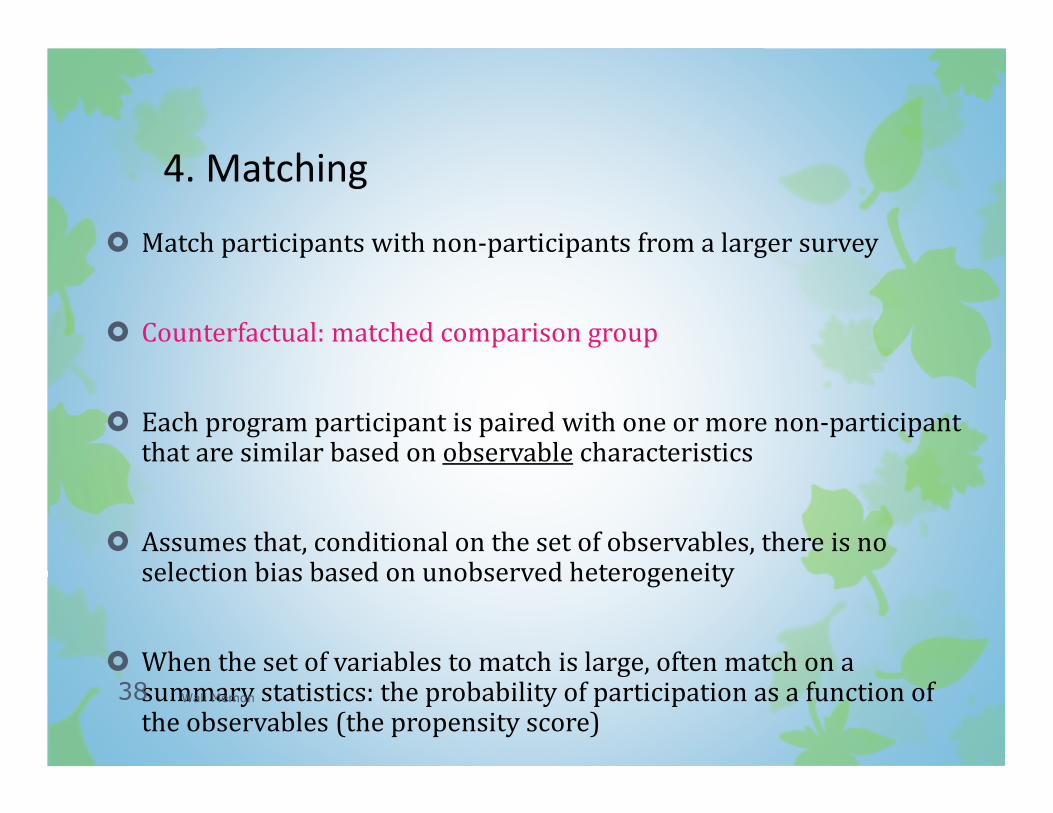
4. Matching
� Match participants with non-participants from a larger survey
� Counterfactual: matched comparison group
� Each program participant is paired with one or more non-participant that are similar based on observable characteristics
� Assumes that, conditional on the set of observables, there is no selection bias based on unobserved heterogeneity
� When the set of variables to match is large, often match on a summary statistics: the probability of participation as a function of the observables (the propensity score)
Wali Memon38
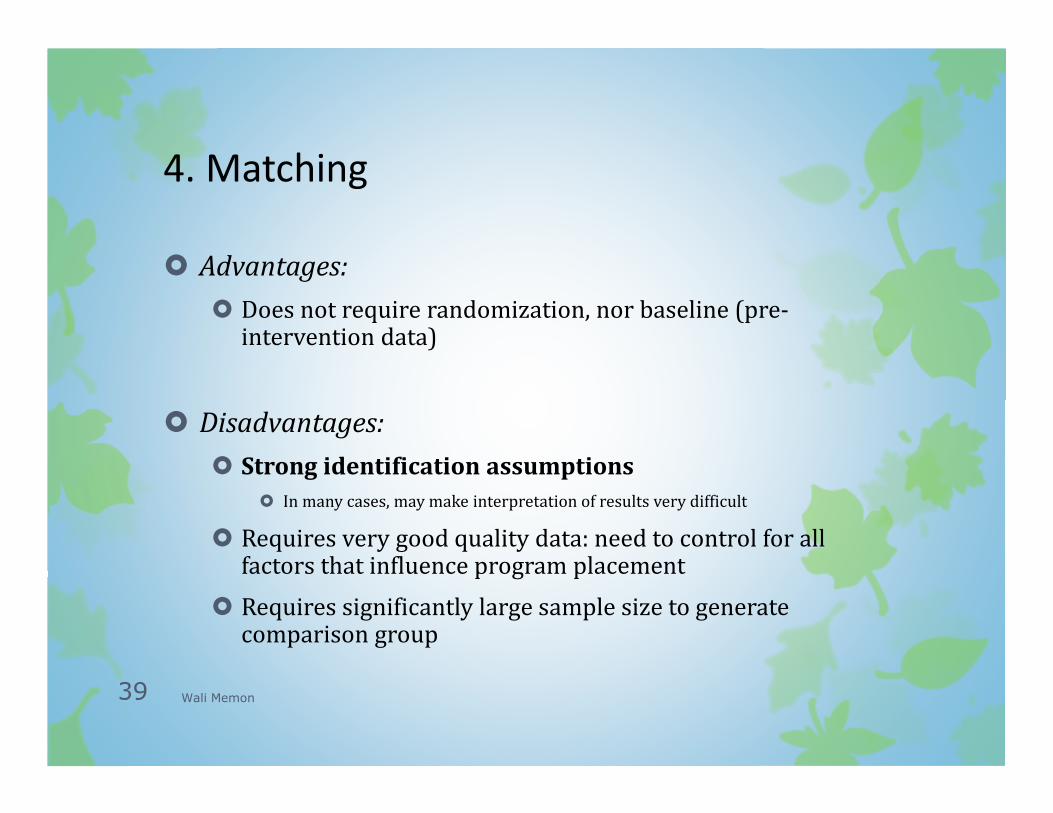
4. Matching
� Advantages:
� Does not require randomization, nor baseline (pre-intervention data)
� Disadvantages:
� Strong identification assumptions
� In many cases, may make interpretation of results very difficult
� Requires very good quality data: need to control for all factors that influence program placement
� Requires significantly large sample size to generate comparison group
Wali Memon39
Matching in Practice
� Using statistical techniques, we match a group of non-
participants with participants using variables like gender,
household size, education, experience, land size (rainfall to
control for drought), irrigation (as many observable
characteristics not affected by program intervention)
� One common method: Propensity Score Matching
Wali Memon40
Matching in Practice: 2
Approaches� Approach 1: After program implementation, we match
(within region) those who received ITNs with those who did not. Problem?
�Problem: likelihood of usage of different households is unobservable, so not included in propensity score
�This creates selection bias
� Approach 2: The program is allocated based on land size. After implementation, we match those eligible in region A with those in region B. Problem?
�Problems: same issues of individual unobservables, but lessened because we compare eligible to potential eligible
�Now problem of unobservable factors across regions
Wali Memon41
An extension of matching:
pipeline comparisons
� Idea: compare those just about to get an intervention with those getting it now
� Assumption: the stopping point of the intervention does not separate two fundamentally different populations
� Example: extending irrigation networks
� In ITN example: If only some communities within Zamfarareceive ITNs in round 1: compare them to nearby communities will receive ITNs in round 2
� Difficulty with Infrastructure: Spillover effects may be strong or anticipatory effect
Wali Memon42