METHODOLOGY SÃO PAULO FEBRUARY/2011 -...
42
METHODOLOGY SÃO PAULO FEBRUARY/2011
-
Upload
truongminh -
Category
Documents
-
view
216 -
download
0
Transcript of METHODOLOGY SÃO PAULO FEBRUARY/2011 -...

METHODOLOGY
SÃO PAULO
FEBRUARY/2011

CONTENTS
FOREWORD __________________________________________________________________________ 1
1. INTRODUCTION _________________________________________________________________ 3
2. DATA ___________________________________________________________________________ 4
2.1 DATA COLLECTION _____________________________________________________ 5
2.2 DATA FILTERING _______________________________________________________ 7
3. METHODOLOGY ________________________________________________________________ 9
3.1 REGIONAL INDEX CELLS: IBGE WEIGHTING AREAS ___________________________ 10
3.2 WEIGHTING CRITERIA __________________________________________________ 11
3.3 DEFINITION OF MONTHLY CELL VALUES ___________________________________ 13
3.4 IMPUTATION OF VALUES ________________________________________________ 13
3.5 CALCULATION OF SUBINDICES ___________________________________________ 14
3.6 CALCULATION OF THE COMPOSITE INDEX __________________________________ 14
3.7 RENTAL RATE ________________________________________________________ 15
4. DISCLOSURE OF INFORMATION ________________________________________________ 16
5. REFERENCES ___________________________________________________________________ 17
APPENDIX: WEIGHTS USED FOR THE 2008-2011 PERIOD; SALE PRICE INDICES _________ 18
5.1 SÃO PAULO __________________________________________________________ 18
5.2 RIO DE JANEIRO ______________________________________________________ 26
5.3 BELO HORIZONTE _____________________________________________________ 33
5.4 RECIFE _____________________________________________________________ 35
5.5 DISTRITO FEDERAL ____________________________________________________ 36
5.6 FORTALEZA __________________________________________________________ 37
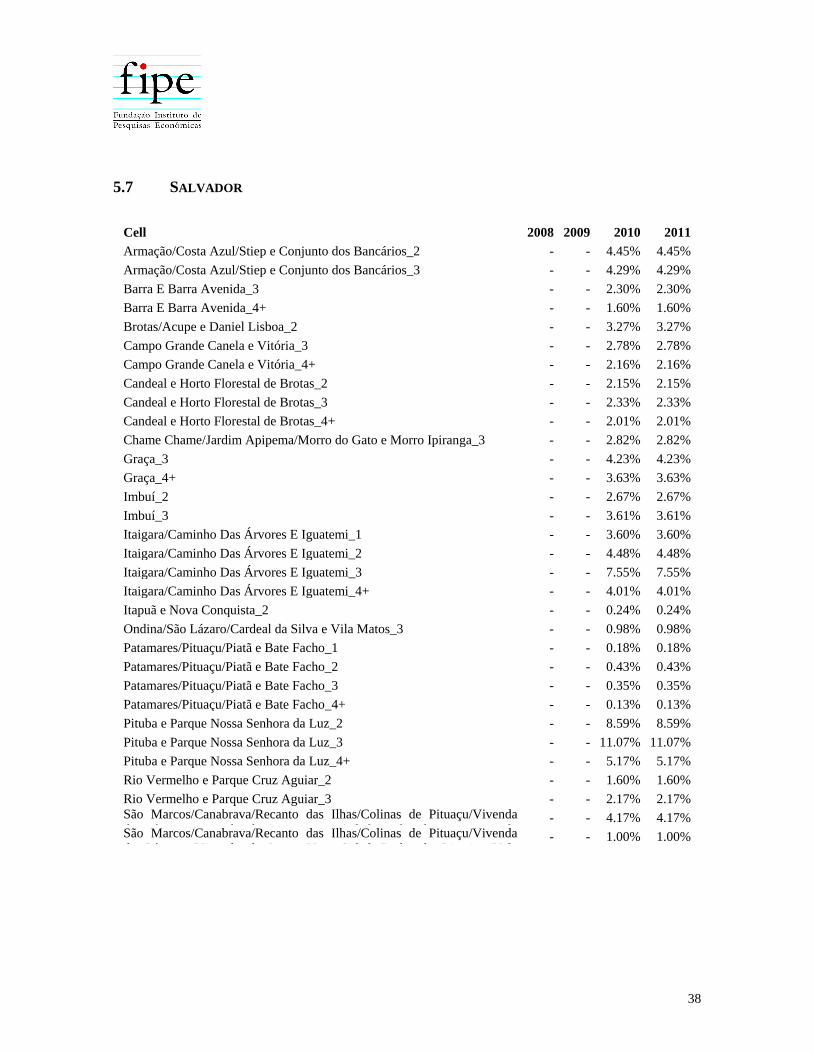
5.7 SALVADOR __________________________________________________________ 38
1
FOREWORD
Notwithstanding the importance of the real estate market to families and to the financial
system, Brazil still lacks comprehensive and reliable indicators that follow the price
behavior of residential properties. Fipe (Brazilian Institute of Economic Research) had been
trying to develop an index that enables this follow-up. In any country, the development of a
real estate price index poses a great challenge, due mainly to the difficulty in obtaining
reliable data sources which allow comparing the same property profile over time. In Brazil,
this challenge is even bigger. Registers of real property records do not have a public and
easily accessible database; and even if they did, it is well-known that many deeds
sometimes do not represent actual values.
An alternative to build an index would be to use data from financial organizations in charge
of real estate financing. However, this database would only provide a partial overview of
the market, as several transactions are carried out without financing. In addition, it may
take several months from the transaction itself until the financing contract is signed and the
information is available for research institutions.
Another alternative, used in England, Austria, Hungary, and Malta, for instance, is to use
real estate ads as a source of information. The major drawback with this source is the
evident gap between the advertised (offer) price and the realized price. Nonetheless, if one
assumes that both prices have a similar trend, at least in the medium and long run, an index
for the advertised prices could be regarded as reliable real estate market information. This
was the alternative chosen by Fipe.
To develop the index, Fipe went into partnership with ZAP, an online ads website. Zap
publishes a sizeable amount of offers, with nearly 200.000 real estate ads every month.
Moreover, in some cities (São Paulo and Rio de Janeiro, for example), the ads have been
available since December 2007.

2
With these data at hand, Fipe could develop a method for the construction of the FipeZap
House Asking Price Index. The methodology is described in the present document. Fipe’s
technical staff will be glad to provide any further information upon request.
Eduardo Zylberstajn Coordinator of the FipeZap House Asking Price Index
3
1. INTRODUCTION
The development of a price index for residential property presents a challenge to
economists and statisticians. There is no international consensus about the methodological
design, due mainly to the complexity of the price-setting process and to limitations
concerning the availability of information. For that reason, it is common to have countries
with a set of real estate indices calculated on a regular basis, usually based on different
methods (Eurostat, 2010).
Brazil still lacks a price index for real estate. With the FipeZap House Asking Price Index
(FipeZap Index), Fipe and ZAP seek to help bridge this gap by providing an accessible
and broad index for the follow-up of real estate prices across different regions of the
country, using a reliable and robust data source.
This paper describes the method used to calculate the FipeZap Index. Initially, seven
regional indices, which follow the cost per square meter of second-hand residential
apartments, are calculated. The following regions are included: the cities of Belo Horizonte,
Fortaleza, Recife, Rio de Janeiro, Salvador, São Paulo, and Distrito Federal (the Federal
District, which includes Brasília). Each of the regional indices is split into subindices,
which follow up price behavior based on the number of bedrooms in the apartment (one,
two, three, four or more).
The remainder of this document is organized as follows: Section 2 provides the source of
data on which the FipeZap Index is based and Section 3 describes the methodology used
to calculate the indices and their subindices. Section 4 explains the disclosure of results.
Finally, the Appendix shows the weights of the indices for the 2008-2011 period.

4
2. DATA
The FipeZap Index utilizes the ads for the sale or rental of readily available apartments
registered at the Zap Imóveis website as its exclusive data source.1 The data have been
collected and stored on a daily basis since December 1, 2007.
The real estate registered at the Zap Imóveis website can be announced by two different
types of customers: real estate agencies (most cases) and real estate owners (natural
persons, allowed to place their ads directly). The agencies advertise some or all the real
estate in their portfolio by placing their ads on the website. In both cases, there are nuggets
of information on the advertised real estate that must be provided, while some other
information is optional. Mandatory information includes: type of transaction (rental or
sale), type of real estate (apartment, house, building lot, etc.), subtype of real estate,
category (two-story or three-story house plans, penthouse, etc.), state, city/town,
neighborhood, address, total price (R$), net internal (usable) area (m2), maintenance fees
(R$), number of bedrooms, real estate with pending debt (yes/no), exchange of property
option (yes/no) and negotiable down payment (yes/no). Optional information includes Zip
code, property tax value (R$), number of parking spaces, year of construction, number of
floors, number of units per floor, among others.
For the classification and calculation of the FipeZap Index, only mandatory information is
taken into account. As the “age” of a real estate is optional, this piece of information, which
is relevant to price setting, cannot be used.
After collection, the data are filtered. Both processes – collection and filtering – are
described in the subsequent subsections.
1 http://www.zapimoveis.com.br

5
2.1 DATA COLLECTION
All ads available on the Zap Imóveis website are collected and stored at midnight, on a
daily basis. At the end of the month, the ads are transferred to a single database. This
database is checked by the information collection system of the Zap Imóveis website to
handle ads which were available online for more than one day but which were not
modified. This means that, if an ad was published, for instance, on the 10th but removed on
the 20th day, only one register will exist for this ad. On the other hand, if such an ad has
been modified (e.g., advertised price has changed) while it was still available on the site,
then two or more registers (depending on the number of modifications) will be taken into
consideration. The database after this first filtering process is designated as the gross
monthly database.
Tables 2.1 and 2.2 show some descriptive statistics of the gross database for the months of
December from 2007 to 2010, referring respectively to sale and rental ads. Figure 2.1
displays the histogram of prices (R$/m2) of apartments located in the city of São Paulo for
December 2010.

6
Table 2.1 – Descriptive statistics (sale ads)
Region São Paulo
Rio de
Janeiro
Belo
Horizonte DF Salvador Fortaleza Recife Other Total
Dec/2
007 # Total 70,554 13,634 1 0 0 6 0 2,480 86,675
# Repeated 20,615 978 0 0 0 0 0 210 21,803
# Not valid 143 96 0 0 0 1 0 63 303
# Valid 49,796 12,560 1 0 0 5 0 2,207 64,569
Dec/2
008 # Total 56,116 24,415 0 0 4 4 0 5,070 85,609
# Repeated 13,447 2,118 0 0 0 0 0 322 15,887
# Not valid 273 83 0 0 0 0 0 165 521
# Valid 42,396 22,214 0 0 4 4 0 4,583 69,201
Dec/2
009 # Total 67,929 26,569 3,543 2 45 10 7 7,299 105,404
# Repeated 13,685 2,459 237 0 0 0 0 568 16,949
# Not valid 242 175 10 0 0 0 3 179 609
# Valid 54,002 23,935 3,296 2 45 10 4 6,552 87,846
Dec/2
010 # Total 113,245 34,177 2,115 1,172 649 545 948 12,251 165,102
# Repeated 43,719 4,429 80 57 33 16 83 1,036 49,453
# Not valid 281 200 19 18 55 4 15 132 724
# Valid 69,245 29,548 2,016 1,097 561 525 850 11,083 114,925
Source: Zap Imóveis.
Table 2.2 – Descriptive statistics (rental ads)
Region São Paulo
Rio de
Janeiro
Belo
Horizonte DF Salvador Fortaleza Recife Other Total
Dec/2
007 # Total 8,667 437 0 0 0 0 0 247 9,351
# Repeated 1,723 11 0 0 0 0 0 21 1,755
# Not valid 46 34 0 0 0 0 0 28 108
# Valid 6,898 392 0 0 0 0 0 198 7,488
Dec/2
008 # Total 6,053 1,284 0 0 52 0 1 229 7,619
# Repeated 774 100 0 0 0 0 0 24 898
# Not valid 69 83 0 0 1 0 0 2 155
# Valid 5,210 1,101 0 0 51 0 1 203 6,566
Dec/2
009 # Total 7,525 1,815 69 0 50 107 6 402 9,974
# Repeated 958 136 2 0 0 12 0 17 1,125
# Not valid 83 32 0 0 0 7 5 4 131
# Valid 6,484 1,647 67 0 50 88 1 381 8,718
Dec/2
010 # Total 15,373 2,259 86 105 98 368 61 649 18,999
# Repeated 6,241 178 1 5 0 63 0 28 6,516
# Not valid 78 44 0 0 4 7 4 11 148
# Valid 9,054 2,037 85 100 94 298 57 610 12,335
Source: Zap Imóveis.

7
Table 2.1 reveals the large difference in the amount of real estate advertised in São Paulo,
in Rio de Janeiro and in other regions. In December 2010, for instance, the city of São
Paulo accounted for 60% of nearly 115,000 valid ads, whereas Rio de Janeiro represented
26% of this total. Based on the disparity in the amount of ads, it is possible to assert that the
indices of these two cities are more robust than those of other regions.
By comparing the number of sale and rental ads, one perceives that, regardless of the
analyzed region, the amount of available information is significantly larger for sale ads.
With respect to rental ads, only the cities of São Paulo and Rio de Janeiro have a sufficient
amount of ads for the index construction.
Figure 2.1 – Sale ads for apartments in the city of São Paulo
2.2 DATA FILTERING
The monthly data stored on the gross database are filtered again to eliminate ads with
inconsistent information. Typical examples of these inconsistencies include net internal
areas of 1 m2, prices without a reasonable value (R$ 1,000,000,000, for example) or
excessive number of bedrooms (e.g., 50). Possibly, system users try to ‘mislead’ the
advertising algorithm into displaying their ads first. To do that, they intentionally type some
inconsistent information. Unintentional typos are also likely while users are filling out the
8
information. Whatever the cause for inconsistency, these ads were excluded from the
sample to avoid any biases.
On the other hand, the definition of what an invalid or inconsistent ad is is ultimately
arbitrary. A sale ad for an apartment with an area of 1 m2 is obviously inconsistent. But
what about an apartment with 85 m2 to be sold for R$ 1,000,000? If the apartment is
located in the neighborhood of Jardins in São Paulo, for instance, the ad is plausible.
However, if it is located in the neighborhood of Cidade Tiradentes, it is very likely that the
ad contains some wrong information (e.g., the price, which could be R$ 100,000).
One of the major problems with the construction of an index is the bias towards the means
generated by inconsistent data. In the case of the FipeZap Index, two strategies were
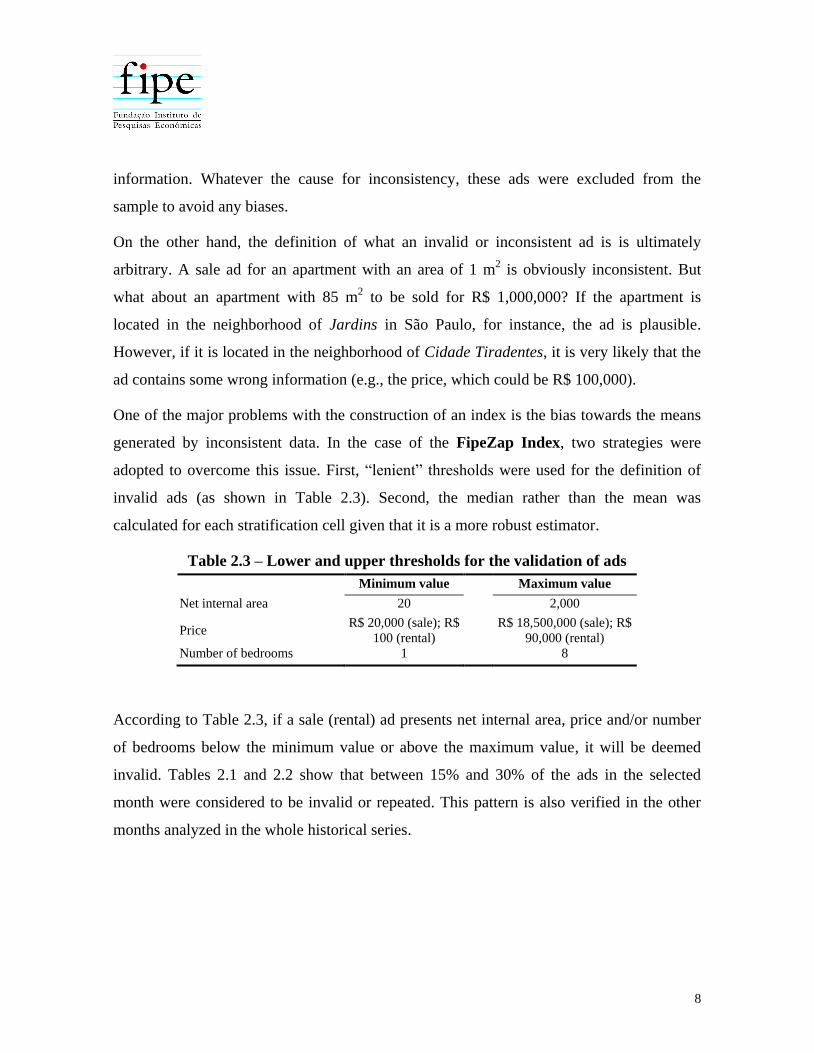
adopted to overcome this issue. First, “lenient” thresholds were used for the definition of
invalid ads (as shown in Table 2.3). Second, the median rather than the mean was
calculated for each stratification cell given that it is a more robust estimator.
Table 2.3 – Lower and upper thresholds for the validation of ads
Minimum value Maximum value
Net internal area 20 2,000
Price R$ 20,000 (sale); R$
100 (rental)
R$ 18,500,000 (sale); R$
90,000 (rental)
Number of bedrooms 1 8
According to Table 2.3, if a sale (rental) ad presents net internal area, price and/or number
of bedrooms below the minimum value or above the maximum value, it will be deemed
invalid. Tables 2.1 and 2.2 show that between 15% and 30% of the ads in the selected
month were considered to be invalid or repeated. This pattern is also verified in the other
months analyzed in the whole historical series.

9
3. METHODOLOGY
Stratification was the method used to calculate the FipeZap Index. According to this
method, weighting cells are established for each region for which the respective reference
prices (mean or median prices, for example) will be calculated every month. Ideally, the
weighting cells should be as distinct from each other as possible so that the registers that
comprise their reference prices designate real estate with homogenous features. On the
other hand, the use of too many criteria for the definition of cells may hinder the
determination of reference prices if the sampling of ads in the cells is not sufficiently large.
The cells were defined using two criteria: number of bedrooms (one, two, three, and four or
more) and a geographical component, which will be referred to as weighting area. The
weighting area is defined and used by the Brazilian Institute of Geography and Statistics
(IBGE) for the division of Brazilian municipalities. The reason for using the weighting area
to delimit the index cells geographically is twofold. First, because the weighting areas are
relatively homogenous in terms of its inhabitants’ socioeconomic characteristics. Second,
because the information on real estate and on the respective households collected by IBGE
in the Census can be added to these zones. As outlined previously, albeit desirable, it is not
possible to use the “age” of the real estate as a criterion for definition of the cells, as this
information is optional and, consequently, only a few ads provide it.
The FipeZap Index is a the Laspeyres-type index. At each time t, the index of is
calculated using the following formula:
(1)
Where is the mean price of region R at t. All regional indices and the composite index
have an arbitrary value of 100 in the month of August of 2010. This is the first month in
which all the seven regions currently comprised by the FipeZap Index have sufficient data
for the calculation.
In turn, the mean prices of each region are calculated by the following equation:

10
(2)
Where and are the weights and the median prices of each cell, defined by area i and
number of bedrooms D. The calculation of these values is explained in the subsequent
subsections.
3.1 REGIONAL INDEX CELLS: IBGE WEIGHTING AREAS
To define the geographical cells, the FipeZap Index converted the neighborhoods that
identify the ads into their respective IBGE weighting areas. To do that, a specific procedure
was adopted for each municipality, given that Brazilian municipalities have different
zoning rules. There are municipalities, such as Recife, where the neighborhoods are
officially defined zones. However, some other municipalities do not use neighborhoods, but
other political divisions instead. São Paulo, for instance, uses districts: there are 96 districts
in the city, and each one includes different neighborhoods and different weighting areas.
For each municipality covered by the FipeZap Index, tables were built for the conversion
of neighborhoods into the IBGE respective weighting areas. Also, there are some cases in
which a neighborhood can contain more than one weighting area. When that occurred, the
weighting areas were merged into a single one. The list of weighting areas and
neighborhoods is available from www.fipe.org.br.
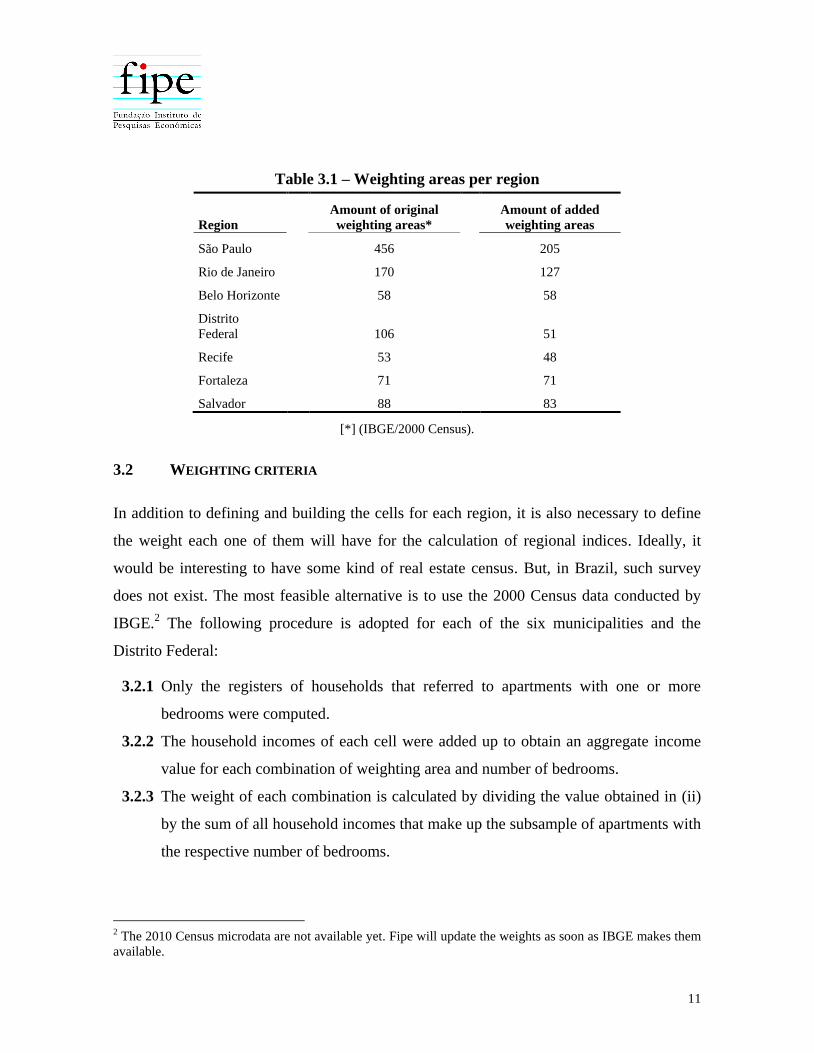
Table 3.1 shows the amount of weighting areas in each of the regions covered by the
FipeZap Index.
11
Table 3.1 – Weighting areas per region
Region
Amount of original
weighting areas*
Amount of added
weighting areas
São Paulo 456 205
Rio de Janeiro 170 127
Belo Horizonte 58 58
Distrito
Federal
106
51
Recife 53 48
Fortaleza 71 71
Salvador 88 83
[*] (IBGE/2000 Census).
3.2 WEIGHTING CRITERIA
In addition to defining and building the cells for each region, it is also necessary to define
the weight each one of them will have for the calculation of regional indices. Ideally, it
would be interesting to have some kind of real estate census. But, in Brazil, such survey
does not exist. The most feasible alternative is to use the 2000 Census data conducted by
IBGE.2 The following procedure is adopted for each of the six municipalities and the
Distrito Federal:
3.2.1 Only the registers of households that referred to apartments with one or more
bedrooms were computed.
3.2.2 The household incomes of each cell were added up to obtain an aggregate income
value for each combination of weighting area and number of bedrooms.
3.2.3 The weight of each combination is calculated by dividing the value obtained in (ii)
by the sum of all household incomes that make up the subsample of apartments with
the respective number of bedrooms.
2 The 2010 Census microdata are not available yet. Fipe will update the weights as soon as IBGE makes them
available.

12
3.2.4 Cells with number of bedrooms greater than or equal to 4 are combined into a single
cell; this also occurs when there is a combination of two or more weighting areas.
Table 3.1 shows the amount of weighting areas considered for the construction of regional
indices. However, the geographical coverage of the ads is not complete in any of the seven
regions. This means that there are cells which were not included because there was no
information about them. A simple procedure is then used to define which areas actually
make up each of the indices. This is necessary because, as with any Laspeyres index, the
weights must be fixed in order to guarantee that the same “basket” is being compared
between two periods.
This procedure is described in what follows. At the end of each year, the number of ads in
each of the cells and in each month of the year is counted. If the cell had at least five ads in
9 months, then this cell will be used for the index in the subsequent year. Otherwise, the
cell is left out (at least for the subsequent year). After this count, cells are reweighted so as
to ascertain that the sum of cell weights is always equal to 100%. Every January, the index
numbers are chained: the variation in these months is calculated using the mean price for
December recalculated with the new weight.3 This procedure is carried out separately for
the sale and rental indices. Therefore, the weights are different for the two indices.
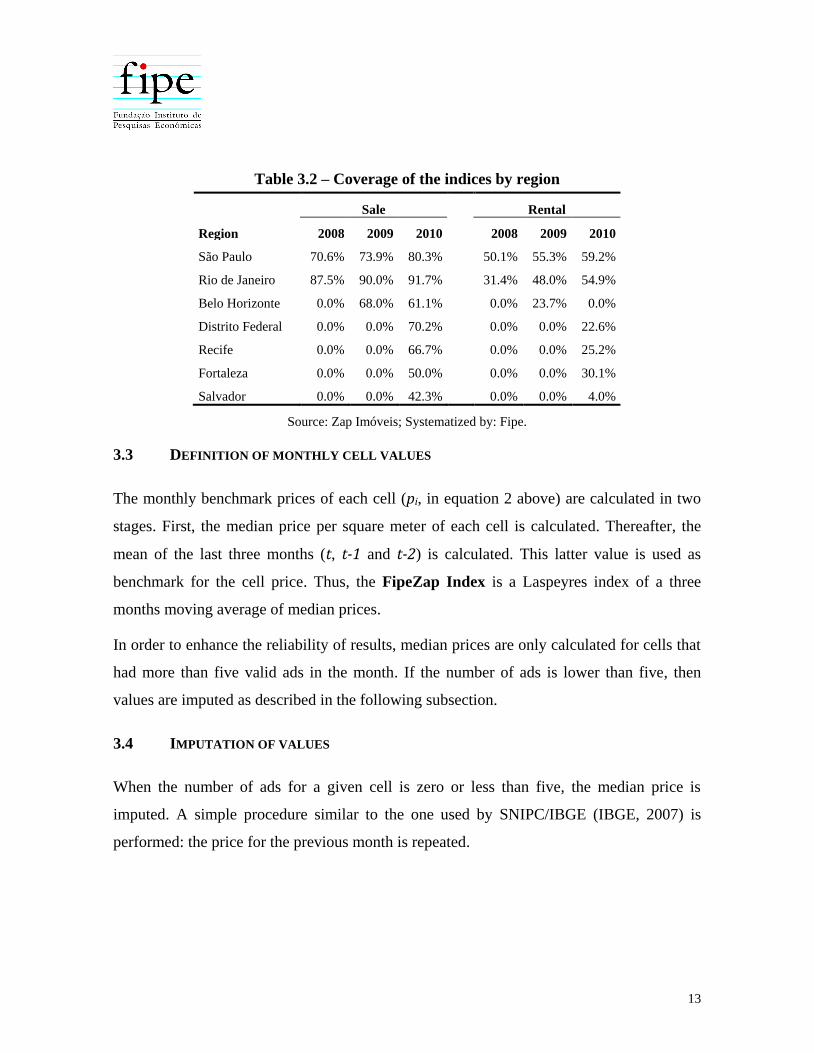
Table 3.2 shows the coverage of regional indices, obtained by the sum of original weights
of the cells that actually make up the index for the year at issue. The coverage thus reveals
the percentage of overall household income of the region represented by the index.
3 In the first year of each regional index, the initial year was used as reference. For instance, in the case of São
Paulo, 2008 and 2009 are based on the number of ads published in 2008. The 2009 count is used to calculate
the index for 2010 and that of 2010 is used to calculate the index for 2011.
13
Table 3.2 – Coverage of the indices by region
Sale Rental
Region 2008 2009 2010 2008 2009 2010
São Paulo 70.6% 73.9% 80.3% 50.1% 55.3% 59.2%
Rio de Janeiro 87.5% 90.0% 91.7% 31.4% 48.0% 54.9%
Belo Horizonte 0.0% 68.0% 61.1% 0.0% 23.7% 0.0%
Distrito Federal 0.0% 0.0% 70.2% 0.0% 0.0% 22.6%
Recife 0.0% 0.0% 66.7% 0.0% 0.0% 25.2%
Fortaleza 0.0% 0.0% 50.0% 0.0% 0.0% 30.1%
Salvador 0.0% 0.0% 42.3% 0.0% 0.0% 4.0%
Source: Zap Imóveis; Systematized by: Fipe.
3.3 DEFINITION OF MONTHLY CELL VALUES
The monthly benchmark prices of each cell (pi, in equation 2 above) are calculated in two
stages. First, the median price per square meter of each cell is calculated. Thereafter, the
mean of the last three months (t, t-1 and t-2) is calculated. This latter value is used as
benchmark for the cell price. Thus, the FipeZap Index is a Laspeyres index of a three
months moving average of median prices.
In order to enhance the reliability of results, median prices are only calculated for cells that
had more than five valid ads in the month. If the number of ads is lower than five, then
values are imputed as described in the following subsection.
3.4 IMPUTATION OF VALUES
When the number of ads for a given cell is zero or less than five, the median price is
imputed. A simple procedure similar to the one used by SNIPC/IBGE (IBGE, 2007) is
performed: the price for the previous month is repeated.

14
3.5 CALCULATION OF SUBINDICES
Each subindex is calculated similarly to the regional index (equations 1 and 2). The
difference is that the weight of each cell is adjusted so that only the cells referring to the
number d of bedrooms are taken into consideration. The modified weight ( ) is obtained
by equation:
(3)
In other words, the cell weights are reweighted such that:
In the case of the regional index, we had:
3.6 CALCULATION OF THE COMPOSITE INDEX
The composite FipeZap index is obtained by the following equation:
(4)
Where wR are the regional weights, shown in Table 3.3. These weights are obtained by
dividing the sum of household income of families that live in apartments of each region by
the sum of these regional total values.

15
Table 3.3 – Regional shares in the composite index
Region Weight
São Paulo 39.6%
Rio de Janeiro 29.9%
Belo Horizonte 8.7%
Distrito Federal 7.2%
Salvador 6.7%
Recife 4.4%
Fortaleza 3.5%
Total 100.0%
3.7 RENTAL YIELD
Besides sale and rental indices, Fipe also calculates the rental yield. This rate is the ratio
between the advertised rental and sale prices.
To compare rental and sale prices, it is necessary to guarantee that the weight used for the
calculation of both indices is the same. Therefore, the ads for each region are counted, but
using the minimum number of five sale ads and five rental ads for each cell as inclusion
criteria. Only cells that satisfy both requirements are included.
16
4. DISCLOSURE OF INFORMATION
Reports and press releases containing the results of variations of regional indices and of the
Composite FipeZap Index in the previous month will be disclosed in Portuguese every
month, following the timetable available at http://www.fipe.org.br.

17
5. REFERENCES
EUROSTAT, 2010. Handbook on Residential Property Price Indices. Available at:
http://epp.eurostat.ec.europa.eu/portal/page/portal/hicp/methodology/residential_pro
perty_price_indices.
IBGE, 2007. Sistema Nacional de Índices de Preços ao Consumidor: Métodos de
Cálculo. 5ª Edição. Disponível em:
ftp://ftp.ibge.gov.br/Precos_Indices_de_Precos_ao_Consumidor/Sistema_de_Indices_d
e_Precos_ao_Consumidor/Metodos_de_calculo/Metodos_de_Calculo_5ed.zip
18
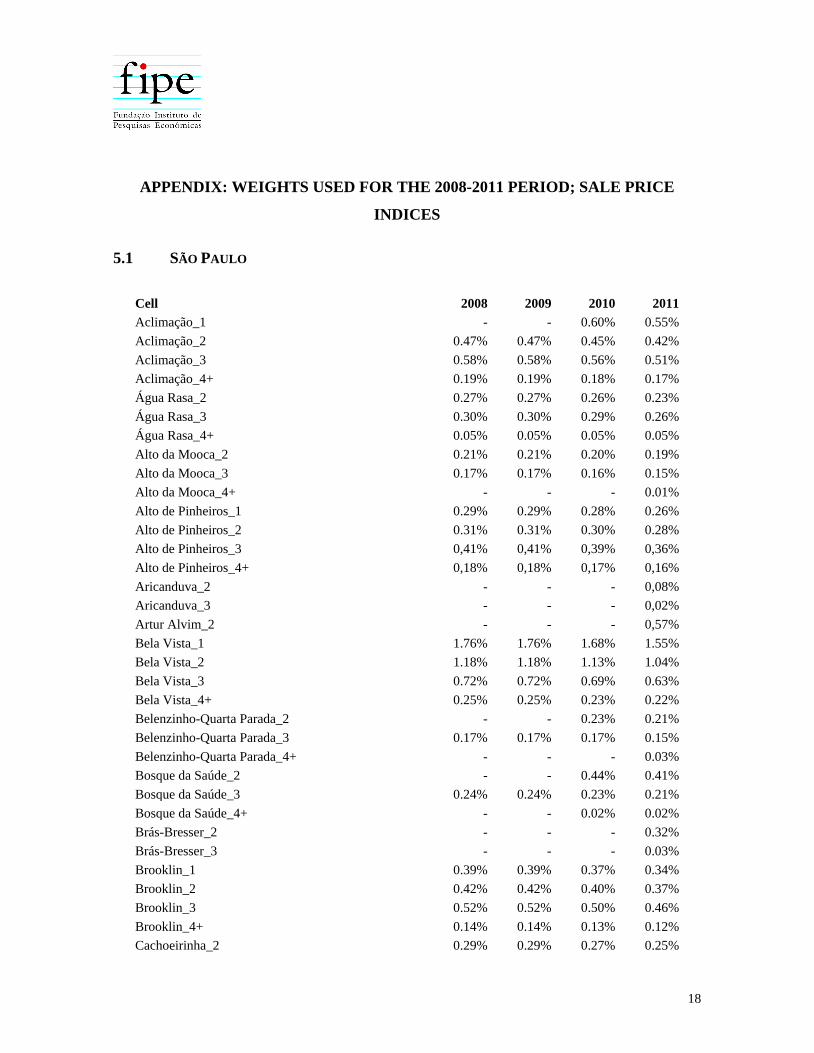
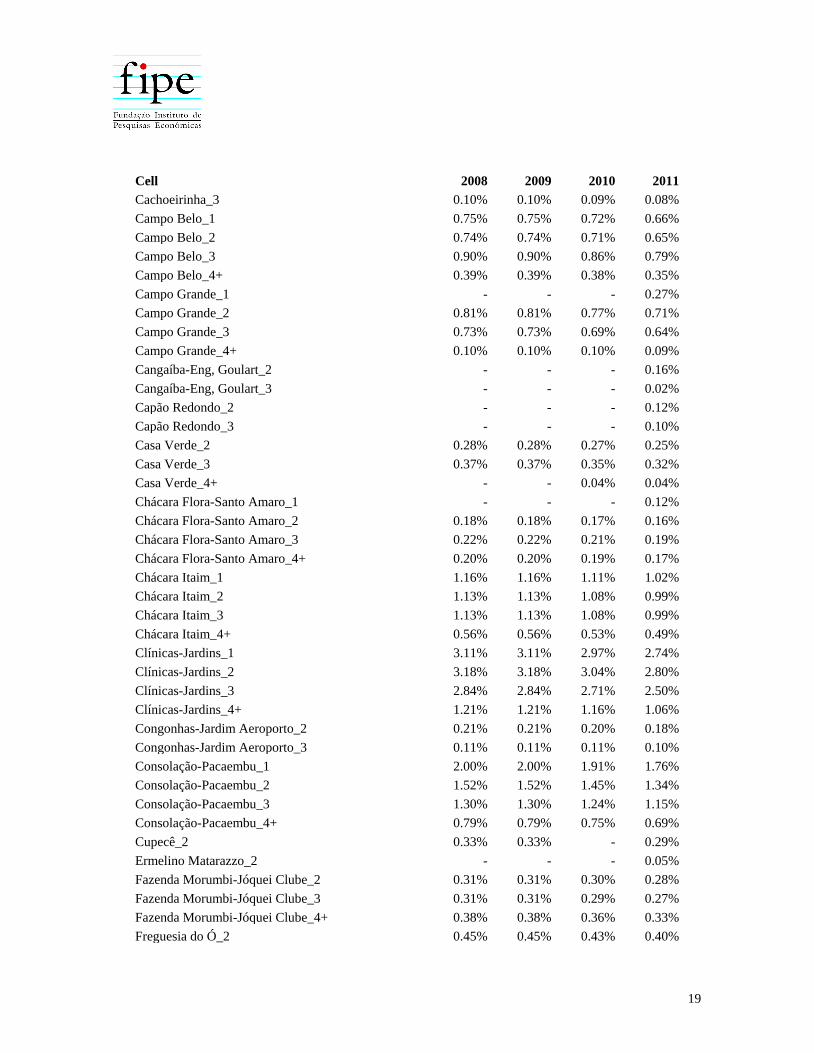
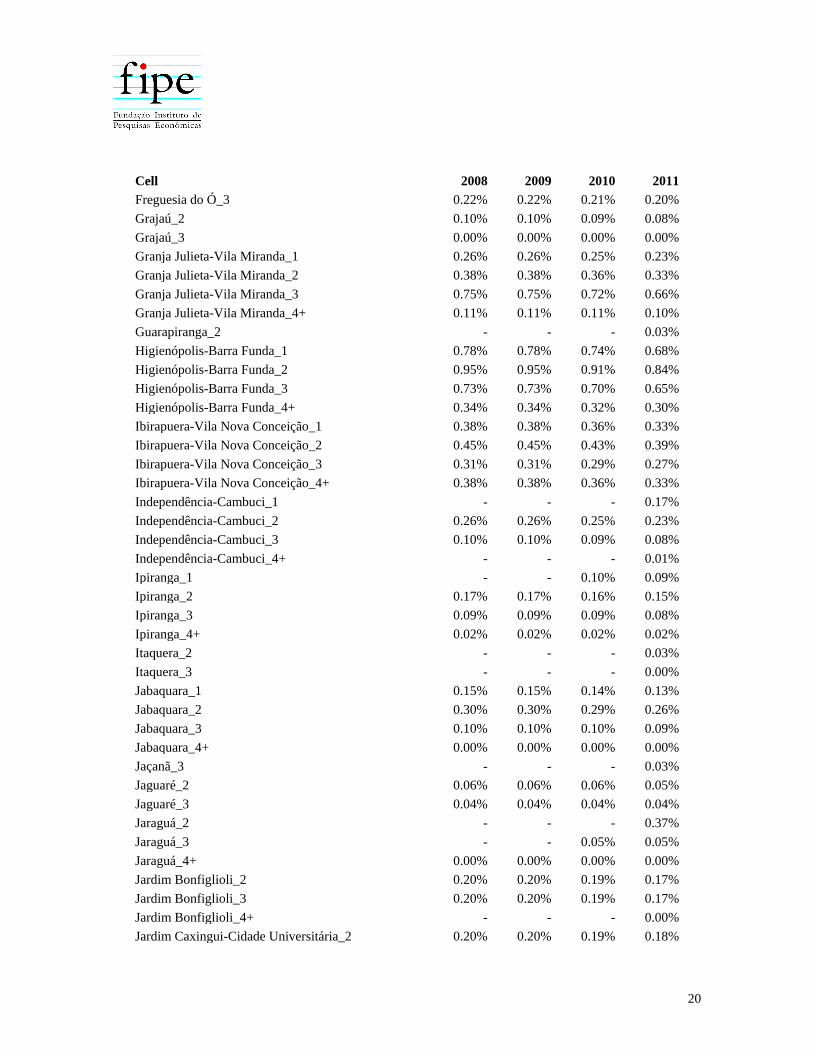
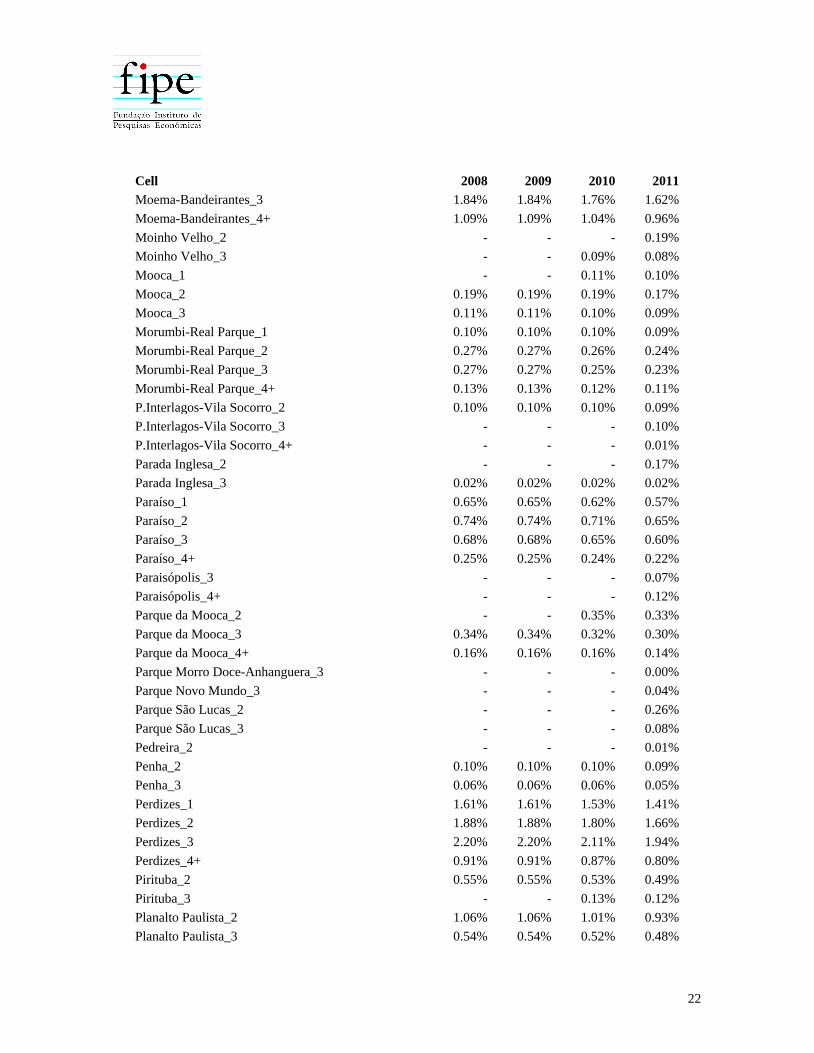
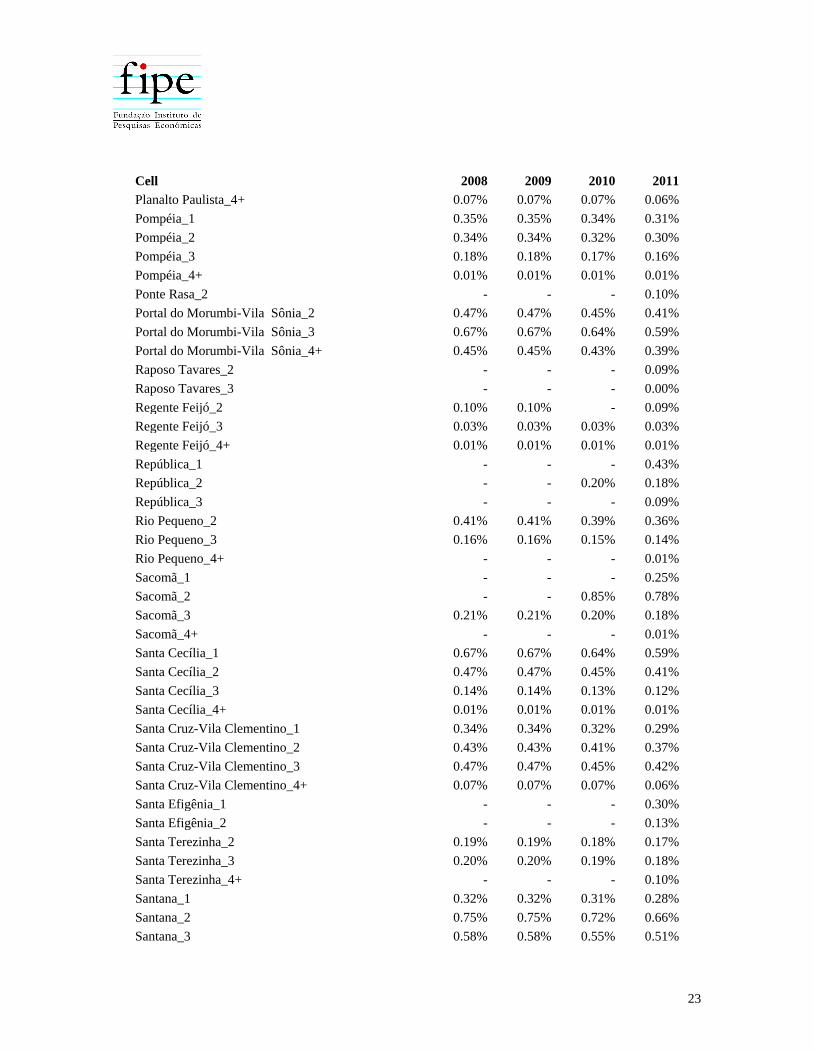
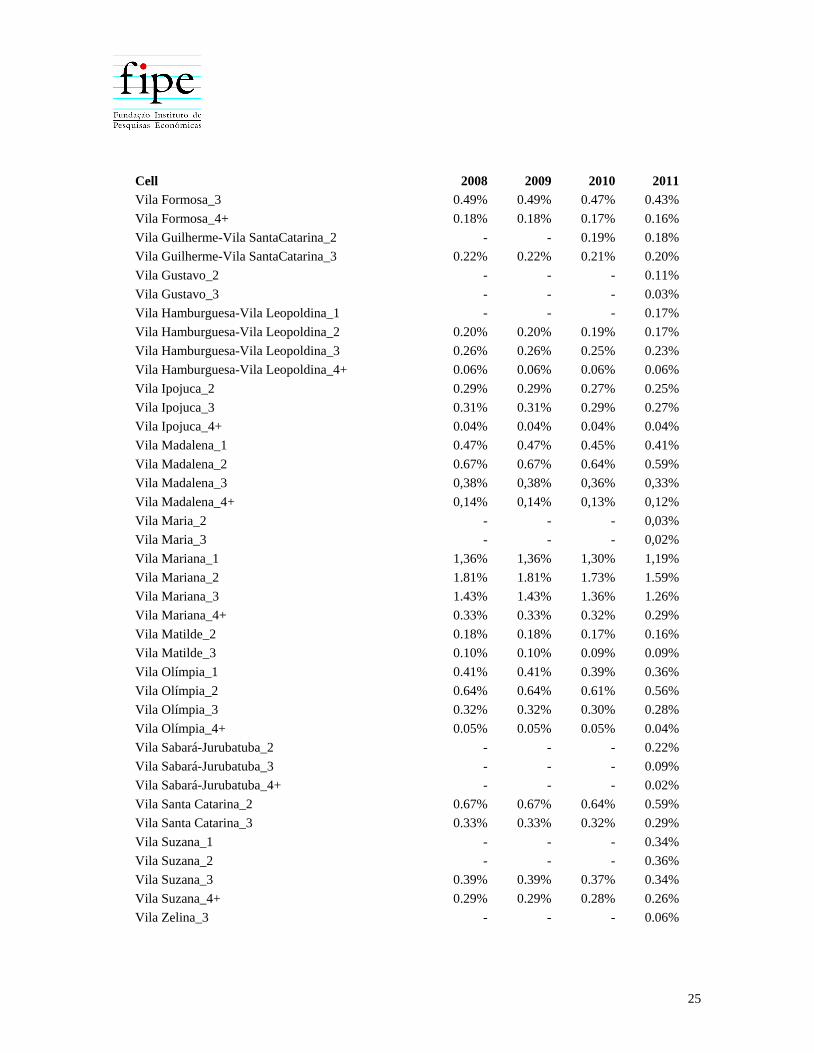
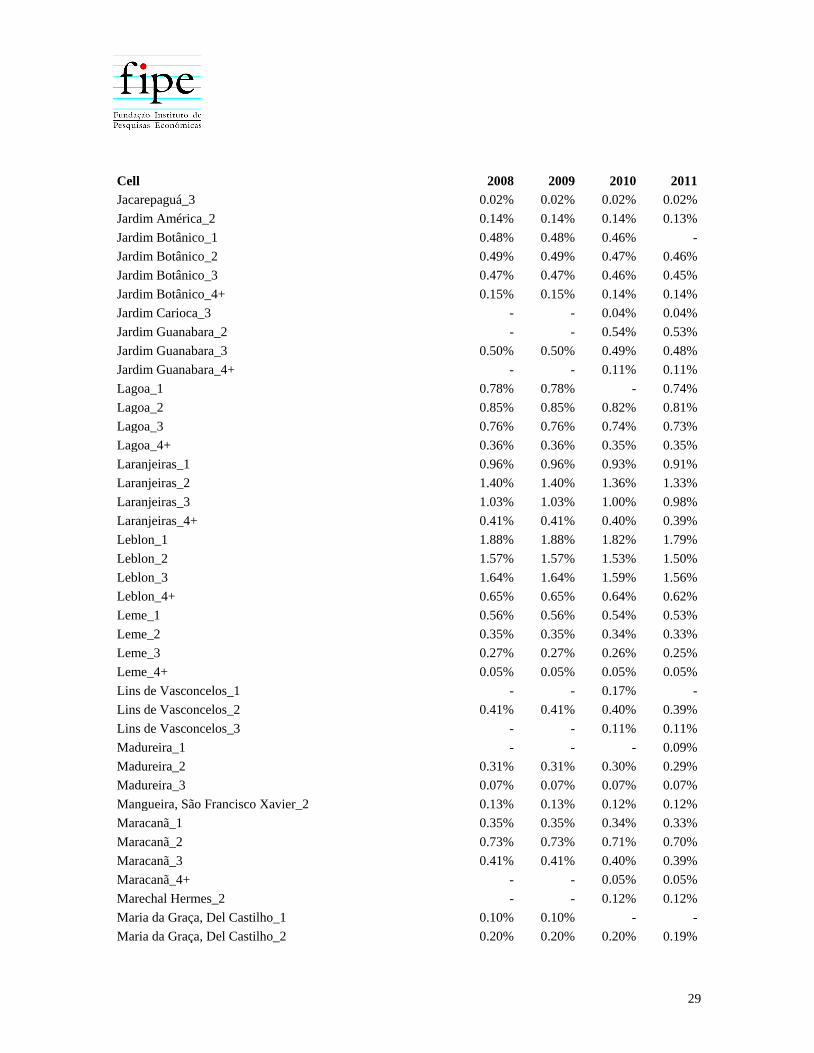
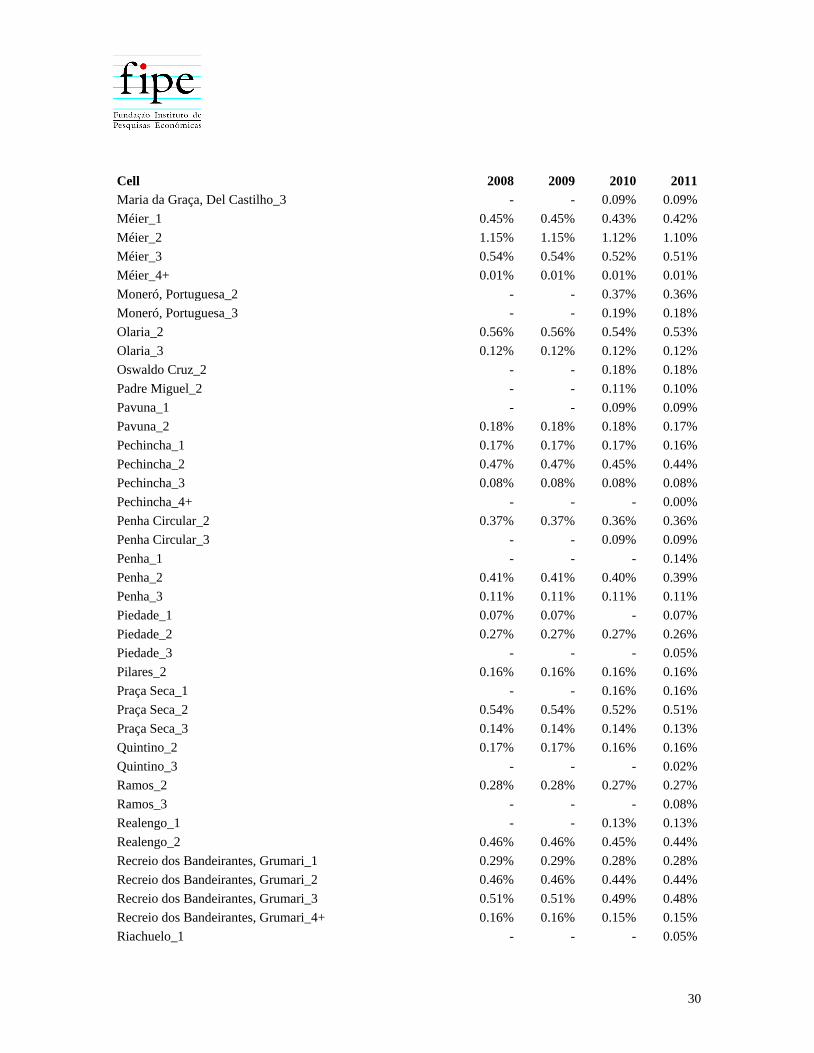
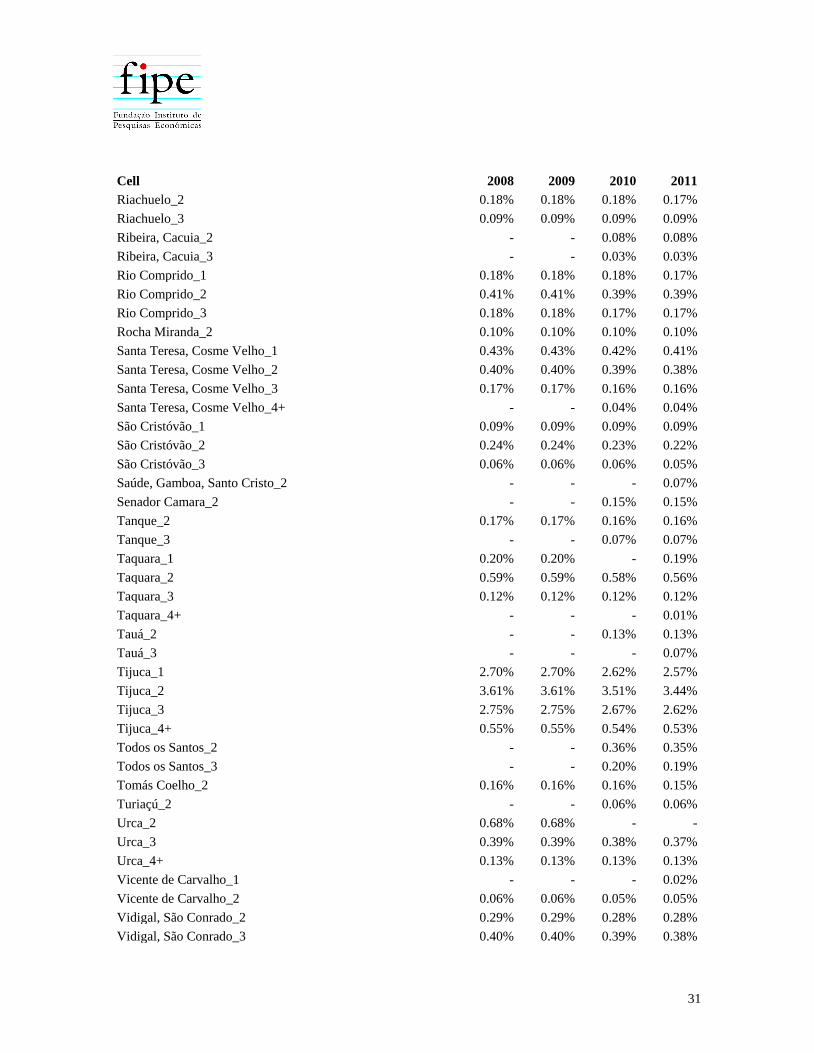
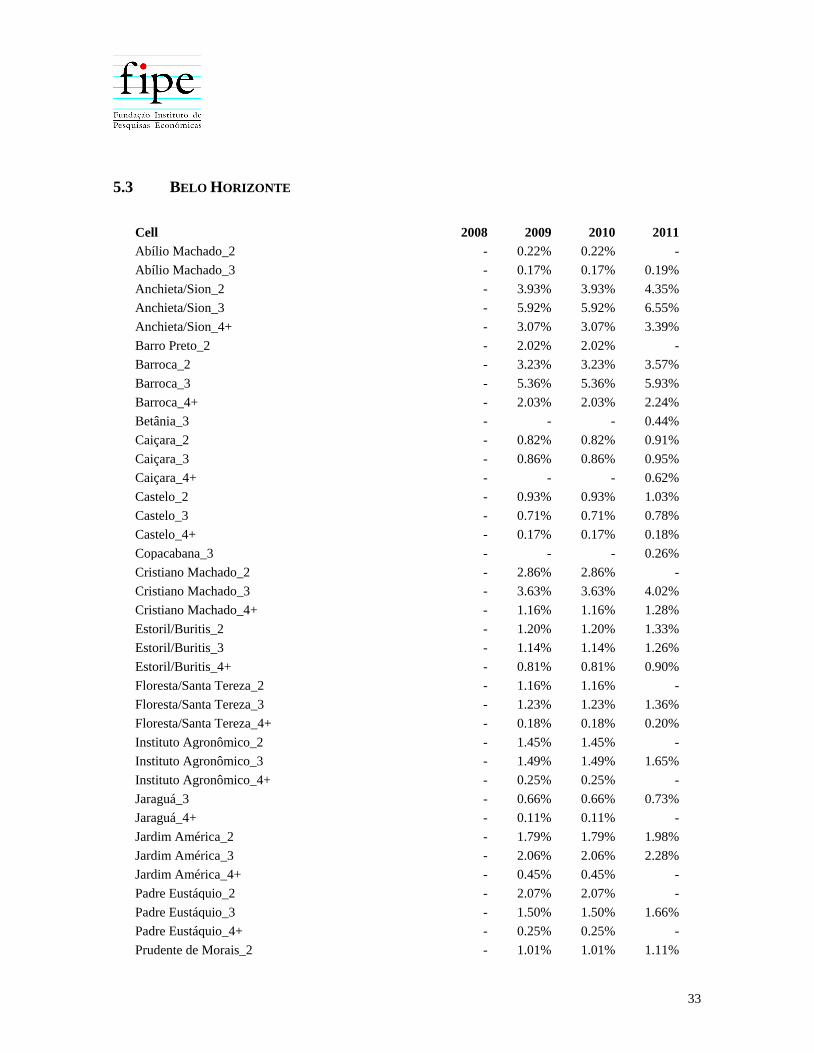
APPENDIX: WEIGHTS USED FOR THE 2008-2011 PERIOD; SALE PRICE
INDICES
5.1 SÃO PAULO
Cell 2008 2009 2010 2011
Aclimação_1 - - 0.60% 0.55%
Aclimação_2 0.47% 0.47% 0.45% 0.42%
Aclimação_3 0.58% 0.58% 0.56% 0.51%
Aclimação_4+ 0.19% 0.19% 0.18% 0.17%
Água Rasa_2 0.27% 0.27% 0.26% 0.23%
Água Rasa_3 0.30% 0.30% 0.29% 0.26%
Água Rasa_4+ 0.05% 0.05% 0.05% 0.05%
Alto da Mooca_2 0.21% 0.21% 0.20% 0.19%
Alto da Mooca_3 0.17% 0.17% 0.16% 0.15%
Alto da Mooca_4+ - - - 0.01%
Alto de Pinheiros_1 0.29% 0.29% 0.28% 0.26%
Alto de Pinheiros_2 0.31% 0.31% 0.30% 0.28%
Alto de Pinheiros_3 0,41% 0,41% 0,39% 0,36%
Alto de Pinheiros_4+ 0,18% 0,18% 0,17% 0,16%
Aricanduva_2 - - - 0,08%
Aricanduva_3 - - - 0,02%
Artur Alvim_2 - - - 0,57%
Bela Vista_1 1.76% 1.76% 1.68% 1.55%
Bela Vista_2 1.18% 1.18% 1.13% 1.04%
Bela Vista_3 0.72% 0.72% 0.69% 0.63%
Bela Vista_4+ 0.25% 0.25% 0.23% 0.22%
Belenzinho-Quarta Parada_2 - - 0.23% 0.21%
Belenzinho-Quarta Parada_3 0.17% 0.17% 0.17% 0.15%
Belenzinho-Quarta Parada_4+ - - - 0.03%
Bosque da Saúde_2 - - 0.44% 0.41%
Bosque da Saúde_3 0.24% 0.24% 0.23% 0.21%
Bosque da Saúde_4+ - - 0.02% 0.02%
Brás-Bresser_2 - - - 0.32%
Brás-Bresser_3 - - - 0.03%
Brooklin_1 0.39% 0.39% 0.37% 0.34%
Brooklin_2 0.42% 0.42% 0.40% 0.37%
Brooklin_3 0.52% 0.52% 0.50% 0.46%
Brooklin_4+ 0.14% 0.14% 0.13% 0.12%
Cachoeirinha_2 0.29% 0.29% 0.27% 0.25%
19
Cell 2008 2009 2010 2011
Cachoeirinha_3 0.10% 0.10% 0.09% 0.08%
Campo Belo_1 0.75% 0.75% 0.72% 0.66%
Campo Belo_2 0.74% 0.74% 0.71% 0.65%
Campo Belo_3 0.90% 0.90% 0.86% 0.79%
Campo Belo_4+ 0.39% 0.39% 0.38% 0.35%
Campo Grande_1 - - - 0.27%
Campo Grande_2 0.81% 0.81% 0.77% 0.71%
Campo Grande_3 0.73% 0.73% 0.69% 0.64%
Campo Grande_4+ 0.10% 0.10% 0.10% 0.09%
Cangaíba-Eng, Goulart_2 - - - 0.16%
Cangaíba-Eng, Goulart_3 - - - 0.02%
Capão Redondo_2 - - - 0.12%
Capão Redondo_3 - - - 0.10%
Casa Verde_2 0.28% 0.28% 0.27% 0.25%
Casa Verde_3 0.37% 0.37% 0.35% 0.32%
Casa Verde_4+ - - 0.04% 0.04%
Chácara Flora-Santo Amaro_1 - - - 0.12%
Chácara Flora-Santo Amaro_2 0.18% 0.18% 0.17% 0.16%
Chácara Flora-Santo Amaro_3 0.22% 0.22% 0.21% 0.19%
Chácara Flora-Santo Amaro_4+ 0.20% 0.20% 0.19% 0.17%
Chácara Itaim_1 1.16% 1.16% 1.11% 1.02%
Chácara Itaim_2 1.13% 1.13% 1.08% 0.99%
Chácara Itaim_3 1.13% 1.13% 1.08% 0.99%
Chácara Itaim_4+ 0.56% 0.56% 0.53% 0.49%
Clínicas-Jardins_1 3.11% 3.11% 2.97% 2.74%
Clínicas-Jardins_2 3.18% 3.18% 3.04% 2.80%
Clínicas-Jardins_3 2.84% 2.84% 2.71% 2.50%
Clínicas-Jardins_4+ 1.21% 1.21% 1.16% 1.06%
Congonhas-Jardim Aeroporto_2 0.21% 0.21% 0.20% 0.18%
Congonhas-Jardim Aeroporto_3 0.11% 0.11% 0.11% 0.10%
Consolação-Pacaembu_1 2.00% 2.00% 1.91% 1.76%
Consolação-Pacaembu_2 1.52% 1.52% 1.45% 1.34%
Consolação-Pacaembu_3 1.30% 1.30% 1.24% 1.15%
Consolação-Pacaembu_4+ 0.79% 0.79% 0.75% 0.69%
Cupecê_2 0.33% 0.33% - 0.29%
Ermelino Matarazzo_2 - - - 0.05%
Fazenda Morumbi-Jóquei Clube_2 0.31% 0.31% 0.30% 0.28%
Fazenda Morumbi-Jóquei Clube_3 0.31% 0.31% 0.29% 0.27%
Fazenda Morumbi-Jóquei Clube_4+ 0.38% 0.38% 0.36% 0.33%
Freguesia do Ó_2 0.45% 0.45% 0.43% 0.40%
20
Cell 2008 2009 2010 2011
Freguesia do Ó_3 0.22% 0.22% 0.21% 0.20%
Grajaú_2 0.10% 0.10% 0.09% 0.08%
Grajaú_3 0.00% 0.00% 0.00% 0.00%
Granja Julieta-Vila Miranda_1 0.26% 0.26% 0.25% 0.23%
Granja Julieta-Vila Miranda_2 0.38% 0.38% 0.36% 0.33%
Granja Julieta-Vila Miranda_3 0.75% 0.75% 0.72% 0.66%
Granja Julieta-Vila Miranda_4+ 0.11% 0.11% 0.11% 0.10%
Guarapiranga_2 - - - 0.03%
Higienópolis-Barra Funda_1 0.78% 0.78% 0.74% 0.68%
Higienópolis-Barra Funda_2 0.95% 0.95% 0.91% 0.84%
Higienópolis-Barra Funda_3 0.73% 0.73% 0.70% 0.65%
Higienópolis-Barra Funda_4+ 0.34% 0.34% 0.32% 0.30%
Ibirapuera-Vila Nova Conceição_1 0.38% 0.38% 0.36% 0.33%
Ibirapuera-Vila Nova Conceição_2 0.45% 0.45% 0.43% 0.39%
Ibirapuera-Vila Nova Conceição_3 0.31% 0.31% 0.29% 0.27%
Ibirapuera-Vila Nova Conceição_4+ 0.38% 0.38% 0.36% 0.33%
Independência-Cambuci_1 - - - 0.17%
Independência-Cambuci_2 0.26% 0.26% 0.25% 0.23%
Independência-Cambuci_3 0.10% 0.10% 0.09% 0.08%
Independência-Cambuci_4+ - - - 0.01%
Ipiranga_1 - - 0.10% 0.09%
Ipiranga_2 0.17% 0.17% 0.16% 0.15%
Ipiranga_3 0.09% 0.09% 0.09% 0.08%
Ipiranga_4+ 0.02% 0.02% 0.02% 0.02%
Itaquera_2 - - - 0.03%
Itaquera_3 - - - 0.00%
Jabaquara_1 0.15% 0.15% 0.14% 0.13%
Jabaquara_2 0.30% 0.30% 0.29% 0.26%
Jabaquara_3 0.10% 0.10% 0.10% 0.09%
Jabaquara_4+ 0.00% 0.00% 0.00% 0.00%
Jaçanã_3 - - - 0.03%
Jaguaré_2 0.06% 0.06% 0.06% 0.05%
Jaguaré_3 0.04% 0.04% 0.04% 0.04%
Jaraguá_2 - - - 0.37%
Jaraguá_3 - - 0.05% 0.05%
Jaraguá_4+ 0.00% 0.00% 0.00% 0.00%
Jardim Bonfiglioli_2 0.20% 0.20% 0.19% 0.17%
Jardim Bonfiglioli_3 0.20% 0.20% 0.19% 0.17%
Jardim Bonfiglioli_4+ - - - 0.00%
Jardim Caxingui-Cidade Universitária_2 0.20% 0.20% 0.19% 0.18%

21
Cell 2008 2009 2010 2011
Jardim Caxingui-Cidade Universitária_3 0.13% 0.13% 0.12% 0.11%
Jardim Caxingui-Cidade Universitária_4+ 0.03% 0.03% 0.03% 0.03%
Jardim da Saúde_1 0.17% 0.17% 0.16% 0.15%
Jardim da Saúde_2 0.83% 0.83% 0.79% 0.73%
Jardim da Saúde_3 0.31% 0.31% 0.30% 0.28%
Jardim da Saúde_4+ 0.12% 0.12% 0.12% 0.11%
Jardim Europa-Pinheiros_1 0.56% 0.56% 0.53% 0.49%
Jardim Europa-Pinheiros_2 0.52% 0.52% 0.49% 0.45%
Jardim Europa-Pinheiros_3 0.40% 0.40% 0.38% 0.35%
Jardim Europa-Pinheiros_4+ 0.21% 0.21% 0.20% 0.19%
Jardim Maria do Carmo_3 - - - 0.05%
Jardim Paulistano_2 0.70% 0.70% 0.67% -
Jardim Paulistano_3 0.42% 0.42% 0.40% 0.37%
Jardim Paulistano_4+ 0.04% 0.04% 0.04% 0.03%
Jardim São Luís_2 0.50% 0.50% 0.47% 0.44%
Jardim São Luís_3 - - - 0.03%
Jardim São Paulo_3 0.39% 0.39% 0.37% 0.34%
Jardim São Paulo_4+ - - 0.12% 0.11%
Jardim Vitoria Régia_3 - - - 0.26%
Jardim Vitoria Régia_4+ - - - 0.31%
Lapa-S, Marina_1 0.16% 0.16% - 0.14%
Lapa-S, Marina_2 0.42% 0.42% 0.40% 0.37%
Lapa-S, Marina_3 0.21% 0.21% 0.20% 0.19%
Lapa-S, Marina_4+ 0.02% 0.02% 0.02% 0.01%
Liberdade_1 - - 0.26% 0.24%
Liberdade_2 - - 0.21% 0.19%
Liberdade_3 0.07% 0.07% 0.07% 0.06%
Limão-Casa Verde Alta_2 0.33% 0.33% 0.31% 0.29%
Limão-Casa Verde Alta_3 0.09% 0.09% 0.09% 0.08%
Luz-Bom Retiro_2 0.31% 0.31% 0.30% 0.27%
Luz-Bom Retiro_3 0.14% 0.14% 0.13% 0.12%
Mandaqui_2 0.86% 0.86% 0.82% 0.75%
Mandaqui_3 0.39% 0.39% 0.38% 0.35%
Mandaqui_4+ 0.01% 0.01% 0.00% 0.00%
Mirandópolis_1 - - 0.44% -
Mirandópolis_2 0.54% 0.54% 0.51% 0.47%
Mirandópolis_3 0.30% 0.30% 0.29% 0.26%
Mirandópolis_4+ 0.07% 0.07% 0.06% 0.06%
Moema-Bandeirantes_1 2.15% 2.15% 2.06% 1.89%
Moema-Bandeirantes_2 1.99% 1.99% 1.90% 1.75%
22
Cell 2008 2009 2010 2011
Moema-Bandeirantes_3 1.84% 1.84% 1.76% 1.62%
Moema-Bandeirantes_4+ 1.09% 1.09% 1.04% 0.96%
Moinho Velho_2 - - - 0.19%
Moinho Velho_3 - - 0.09% 0.08%
Mooca_1 - - 0.11% 0.10%
Mooca_2 0.19% 0.19% 0.19% 0.17%
Mooca_3 0.11% 0.11% 0.10% 0.09%
Morumbi-Real Parque_1 0.10% 0.10% 0.10% 0.09%
Morumbi-Real Parque_2 0.27% 0.27% 0.26% 0.24%
Morumbi-Real Parque_3 0.27% 0.27% 0.25% 0.23%
Morumbi-Real Parque_4+ 0.13% 0.13% 0.12% 0.11%
P.Interlagos-Vila Socorro_2 0.10% 0.10% 0.10% 0.09%
P.Interlagos-Vila Socorro_3 - - - 0.10%
P.Interlagos-Vila Socorro_4+ - - - 0.01%
Parada Inglesa_2 - - - 0.17%
Parada Inglesa_3 0.02% 0.02% 0.02% 0.02%
Paraíso_1 0.65% 0.65% 0.62% 0.57%
Paraíso_2 0.74% 0.74% 0.71% 0.65%
Paraíso_3 0.68% 0.68% 0.65% 0.60%
Paraíso_4+ 0.25% 0.25% 0.24% 0.22%
Paraisópolis_3 - - - 0.07%
Paraisópolis_4+ - - - 0.12%
Parque da Mooca_2 - - 0.35% 0.33%
Parque da Mooca_3 0.34% 0.34% 0.32% 0.30%
Parque da Mooca_4+ 0.16% 0.16% 0.16% 0.14%
Parque Morro Doce-Anhanguera_3 - - - 0.00%
Parque Novo Mundo_3 - - - 0.04%
Parque São Lucas_2 - - - 0.26%
Parque São Lucas_3 - - - 0.08%
Pedreira_2 - - - 0.01%
Penha_2 0.10% 0.10% 0.10% 0.09%
Penha_3 0.06% 0.06% 0.06% 0.05%
Perdizes_1 1.61% 1.61% 1.53% 1.41%
Perdizes_2 1.88% 1.88% 1.80% 1.66%
Perdizes_3 2.20% 2.20% 2.11% 1.94%
Perdizes_4+ 0.91% 0.91% 0.87% 0.80%
Pirituba_2 0.55% 0.55% 0.53% 0.49%
Pirituba_3 - - 0.13% 0.12%
Planalto Paulista_2 1.06% 1.06% 1.01% 0.93%
Planalto Paulista_3 0.54% 0.54% 0.52% 0.48%
23
Cell 2008 2009 2010 2011
Planalto Paulista_4+ 0.07% 0.07% 0.07% 0.06%
Pompéia_1 0.35% 0.35% 0.34% 0.31%
Pompéia_2 0.34% 0.34% 0.32% 0.30%
Pompéia_3 0.18% 0.18% 0.17% 0.16%
Pompéia_4+ 0.01% 0.01% 0.01% 0.01%
Ponte Rasa_2 - - - 0.10%
Portal do Morumbi-Vila Sônia_2 0.47% 0.47% 0.45% 0.41%
Portal do Morumbi-Vila Sônia_3 0.67% 0.67% 0.64% 0.59%
Portal do Morumbi-Vila Sônia_4+ 0.45% 0.45% 0.43% 0.39%
Raposo Tavares_2 - - - 0.09%
Raposo Tavares_3 - - - 0.00%
Regente Feijó_2 0.10% 0.10% - 0.09%
Regente Feijó_3 0.03% 0.03% 0.03% 0.03%
Regente Feijó_4+ 0.01% 0.01% 0.01% 0.01%
República_1 - - - 0.43%
República_2 - - 0.20% 0.18%
República_3 - - - 0.09%
Rio Pequeno_2 0.41% 0.41% 0.39% 0.36%
Rio Pequeno_3 0.16% 0.16% 0.15% 0.14%
Rio Pequeno_4+ - - - 0.01%
Sacomã_1 - - - 0.25%
Sacomã_2 - - 0.85% 0.78%
Sacomã_3 0.21% 0.21% 0.20% 0.18%
Sacomã_4+ - - - 0.01%
Santa Cecília_1 0.67% 0.67% 0.64% 0.59%
Santa Cecília_2 0.47% 0.47% 0.45% 0.41%
Santa Cecília_3 0.14% 0.14% 0.13% 0.12%
Santa Cecília_4+ 0.01% 0.01% 0.01% 0.01%
Santa Cruz-Vila Clementino_1 0.34% 0.34% 0.32% 0.29%
Santa Cruz-Vila Clementino_2 0.43% 0.43% 0.41% 0.37%
Santa Cruz-Vila Clementino_3 0.47% 0.47% 0.45% 0.42%
Santa Cruz-Vila Clementino_4+ 0.07% 0.07% 0.07% 0.06%
Santa Efigênia_1 - - - 0.30%
Santa Efigênia_2 - - - 0.13%
Santa Terezinha_2 0.19% 0.19% 0.18% 0.17%
Santa Terezinha_3 0.20% 0.20% 0.19% 0.18%
Santa Terezinha_4+ - - - 0.10%
Santana_1 0.32% 0.32% 0.31% 0.28%
Santana_2 0.75% 0.75% 0.72% 0.66%
Santana_3 0.58% 0.58% 0.55% 0.51%

24
Cell 2008 2009 2010 2011
Santana_4+ 0.20% 0.20% 0.19% 0.18%
São Domingos_2 - - - 0.16%
São Domingos_3 0.06% 0.06% 0.06% 0.06%
São Mateus_2 - - - 0.03%
São Miguel Paulista_2 - - - 0.01%
Sé_1 0.53% 0.53% 0.50% 0.46%
Sé_2 0.47% 0.47% 0.45% 0.42%
Sé_3 0.11% 0.11% 0.11% 0.10%
Sé_4+ - - 0.02% 0.02%
SESC Interlagos_2 - - 0.04% 0.04%
SESC Interlagos_4+ - - - 0.00%
Sumaré-Água Branca_1 0.17% 0.17% 0.16% 0.15%
Sumaré-Água Branca_2 0.20% 0.20% 0.19% 0.18%
Sumaré-Água Branca_3 0.14% 0.14% 0.13% 0.12%
Sumaré-Água Branca_4+ 0.03% 0.03% 0.03% 0.02%
Tatuapé_1 - - - 0.43%
Tatuapé_2 1.03% 1.03% 0.99% 0.91%
Tatuapé_3 0.95% 0.95% 0.91% 0.83%
Tatuapé_4+ 0.27% 0.27% 0.26% 0.24%
Tremembé_2 - - 0.19% 0.17%
Tremembé_3 - - 0.04% 0.04%
Tucuruvi_2 0.15% 0.15% 0.14% 0.13%
Tucuruvi_3 0.13% 0.13% 0.12% 0.11%
V.Independência-V.Monumento_2 - - 0.24% 0.22%
V.Independência-V.Monumento_3 0.24% 0.24% 0.23% 0.21%
V.Independência-V.Monumento_4+ - - - 0.07%
Vila Beatriz_2 - - 0.26% -
Vila Beatriz_3 - - - 0.21%
Vila Beatriz_4+ 0.21% 0.21% - -
Vila Califórnia_3 - - - 0.11%
Vila Carmosina_2 - - - 0.01%
Vila Carrão_2 - - 0.10% 0.09%
Vila Carrão_3 0.05% 0.05% 0.05% 0.05%
Vila Carrão_4+ 0.09% 0.09% - 0.08%
Vila Curuçá_3 0.03% 0.03% - -
Vila Ema_2 - - - 0.14%
Vila Ema_3 - - - 0.06%
Vila Esperança_2 - - - 0.16%
Vila Esperança_3 - - - 0.03%
Vila Formosa_2 0.30% 0.30% 0.29% 0.26%
25
Cell 2008 2009 2010 2011
Vila Formosa_3 0.49% 0.49% 0.47% 0.43%
Vila Formosa_4+ 0.18% 0.18% 0.17% 0.16%
Vila Guilherme-Vila SantaCatarina_2 - - 0.19% 0.18%
Vila Guilherme-Vila SantaCatarina_3 0.22% 0.22% 0.21% 0.20%
Vila Gustavo_2 - - - 0.11%
Vila Gustavo_3 - - - 0.03%
Vila Hamburguesa-Vila Leopoldina_1 - - - 0.17%
Vila Hamburguesa-Vila Leopoldina_2 0.20% 0.20% 0.19% 0.17%
Vila Hamburguesa-Vila Leopoldina_3 0.26% 0.26% 0.25% 0.23%
Vila Hamburguesa-Vila Leopoldina_4+ 0.06% 0.06% 0.06% 0.06%
Vila Ipojuca_2 0.29% 0.29% 0.27% 0.25%
Vila Ipojuca_3 0.31% 0.31% 0.29% 0.27%
Vila Ipojuca_4+ 0.04% 0.04% 0.04% 0.04%
Vila Madalena_1 0.47% 0.47% 0.45% 0.41%
Vila Madalena_2 0.67% 0.67% 0.64% 0.59%
Vila Madalena_3 0,38% 0,38% 0,36% 0,33%
Vila Madalena_4+ 0,14% 0,14% 0,13% 0,12%
Vila Maria_2 - - - 0,03%
Vila Maria_3 - - - 0,02%
Vila Mariana_1 1,36% 1,36% 1,30% 1,19%
Vila Mariana_2 1.81% 1.81% 1.73% 1.59%
Vila Mariana_3 1.43% 1.43% 1.36% 1.26%
Vila Mariana_4+ 0.33% 0.33% 0.32% 0.29%
Vila Matilde_2 0.18% 0.18% 0.17% 0.16%
Vila Matilde_3 0.10% 0.10% 0.09% 0.09%
Vila Olímpia_1 0.41% 0.41% 0.39% 0.36%
Vila Olímpia_2 0.64% 0.64% 0.61% 0.56%
Vila Olímpia_3 0.32% 0.32% 0.30% 0.28%
Vila Olímpia_4+ 0.05% 0.05% 0.05% 0.04%
Vila Sabará-Jurubatuba_2 - - - 0.22%
Vila Sabará-Jurubatuba_3 - - - 0.09%
Vila Sabará-Jurubatuba_4+ - - - 0.02%
Vila Santa Catarina_2 0.67% 0.67% 0.64% 0.59%
Vila Santa Catarina_3 0.33% 0.33% 0.32% 0.29%
Vila Suzana_1 - - - 0.34%
Vila Suzana_2 - - - 0.36%
Vila Suzana_3 0.39% 0.39% 0.37% 0.34%
Vila Suzana_4+ 0.29% 0.29% 0.28% 0.26%
Vila Zelina_3 - - - 0.06%
26
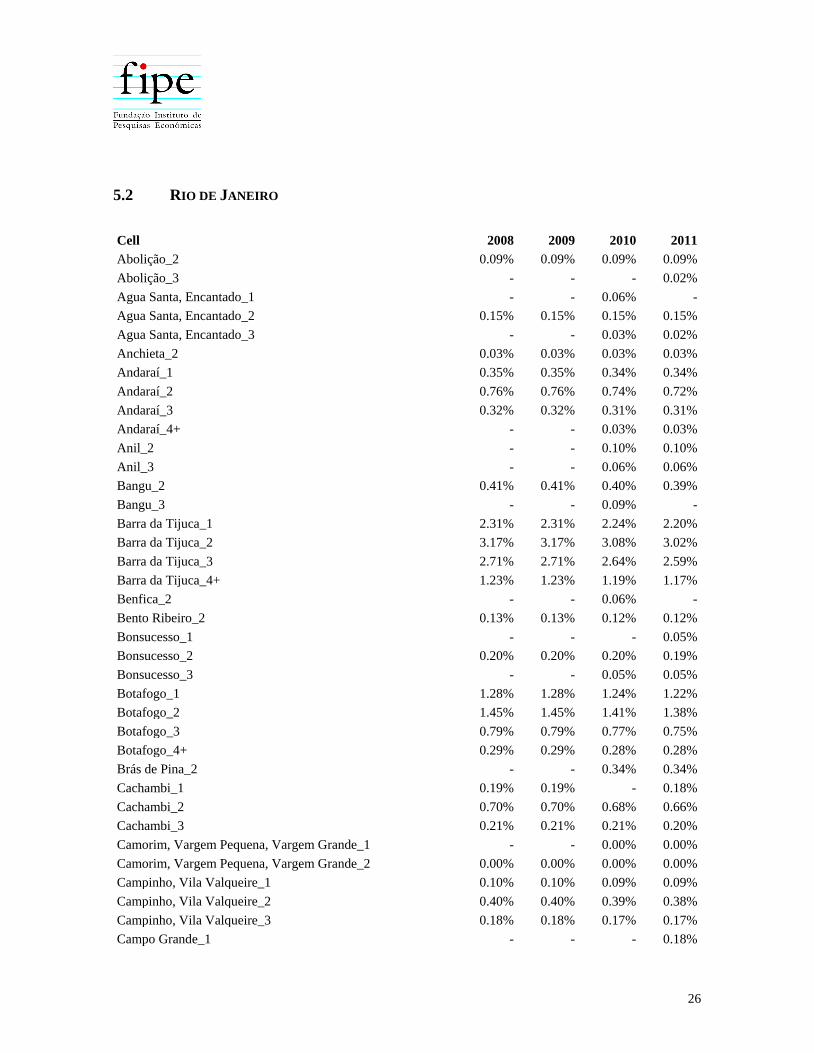
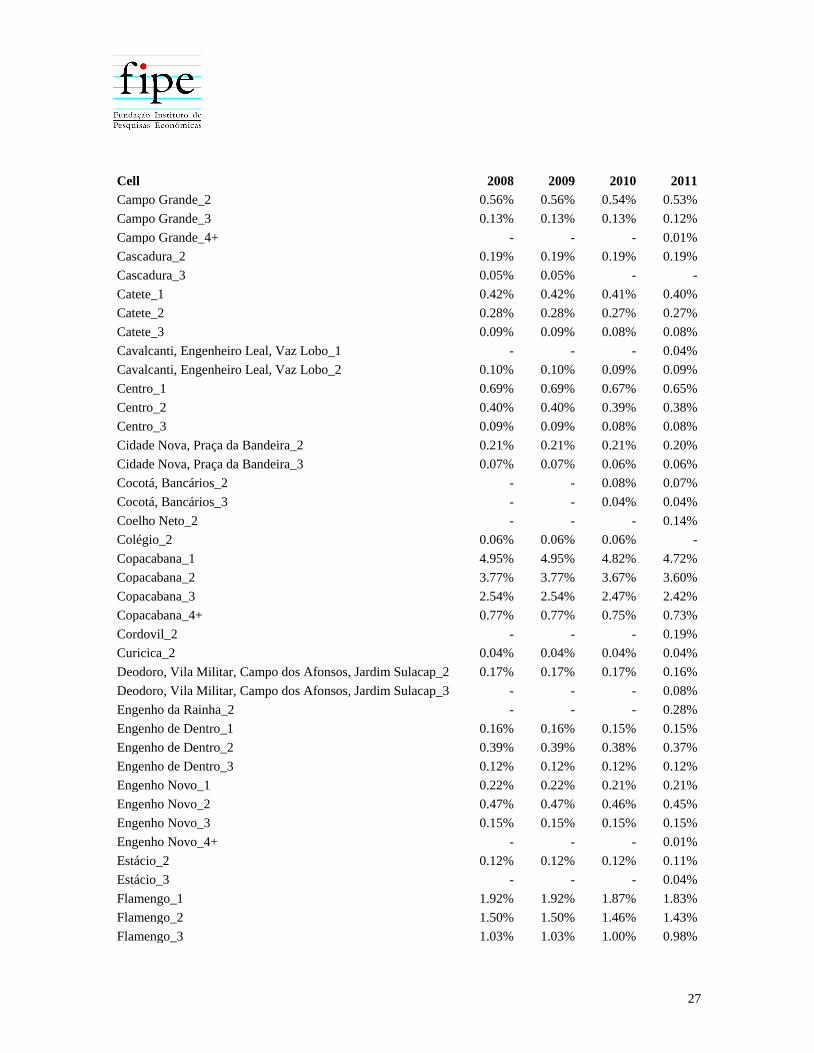
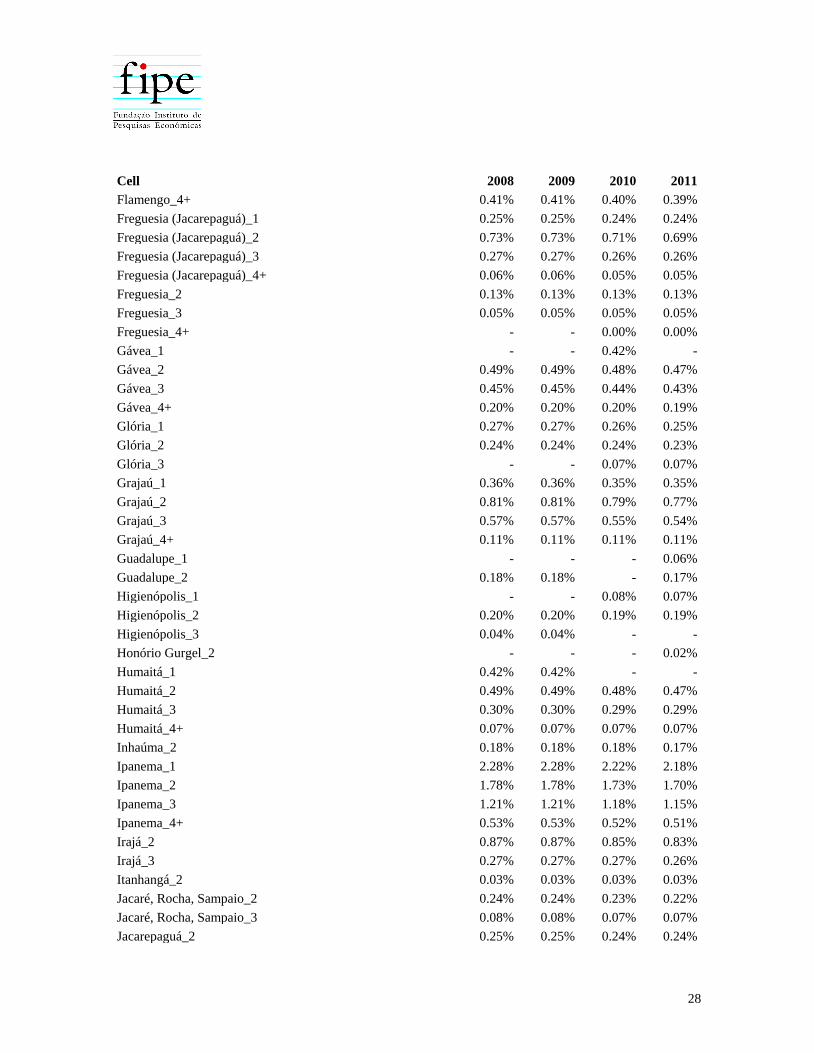
5.2 RIO DE JANEIRO
Cell 2008 2009 2010 2011
Abolição_2 0.09% 0.09% 0.09% 0.09%
Abolição_3 - - - 0.02%
Agua Santa, Encantado_1 - - 0.06% -
Agua Santa, Encantado_2 0.15% 0.15% 0.15% 0.15%
Agua Santa, Encantado_3 - - 0.03% 0.02%
Anchieta_2 0.03% 0.03% 0.03% 0.03%
Andaraí_1 0.35% 0.35% 0.34% 0.34%
Andaraí_2 0.76% 0.76% 0.74% 0.72%
Andaraí_3 0.32% 0.32% 0.31% 0.31%
Andaraí_4+ - - 0.03% 0.03%
Anil_2 - - 0.10% 0.10%
Anil_3 - - 0.06% 0.06%
Bangu_2 0.41% 0.41% 0.40% 0.39%
Bangu_3 - - 0.09% -
Barra da Tijuca_1 2.31% 2.31% 2.24% 2.20%
Barra da Tijuca_2 3.17% 3.17% 3.08% 3.02%
Barra da Tijuca_3 2.71% 2.71% 2.64% 2.59%
Barra da Tijuca_4+ 1.23% 1.23% 1.19% 1.17%
Benfica_2 - - 0.06% -
Bento Ribeiro_2 0.13% 0.13% 0.12% 0.12%
Bonsucesso_1 - - - 0.05%
Bonsucesso_2 0.20% 0.20% 0.20% 0.19%
Bonsucesso_3 - - 0.05% 0.05%
Botafogo_1 1.28% 1.28% 1.24% 1.22%
Botafogo_2 1.45% 1.45% 1.41% 1.38%
Botafogo_3 0.79% 0.79% 0.77% 0.75%
Botafogo_4+ 0.29% 0.29% 0.28% 0.28%
Brás de Pina_2 - - 0.34% 0.34%
Cachambi_1 0.19% 0.19% - 0.18%
Cachambi_2 0.70% 0.70% 0.68% 0.66%
Cachambi_3 0.21% 0.21% 0.21% 0.20%
Camorim, Vargem Pequena, Vargem Grande_1 - - 0.00% 0.00%
Camorim, Vargem Pequena, Vargem Grande_2 0.00% 0.00% 0.00% 0.00%
Campinho, Vila Valqueire_1 0.10% 0.10% 0.09% 0.09%
Campinho, Vila Valqueire_2 0.40% 0.40% 0.39% 0.38%
Campinho, Vila Valqueire_3 0.18% 0.18% 0.17% 0.17%
Campo Grande_1 - - - 0.18%
27
Cell 2008 2009 2010 2011
Campo Grande_2 0.56% 0.56% 0.54% 0.53%
Campo Grande_3 0.13% 0.13% 0.13% 0.12%
Campo Grande_4+ - - - 0.01%
Cascadura_2 0.19% 0.19% 0.19% 0.19%
Cascadura_3 0.05% 0.05% - -
Catete_1 0.42% 0.42% 0.41% 0.40%
Catete_2 0.28% 0.28% 0.27% 0.27%
Catete_3 0.09% 0.09% 0.08% 0.08%
Cavalcanti, Engenheiro Leal, Vaz Lobo_1 - - - 0.04%
Cavalcanti, Engenheiro Leal, Vaz Lobo_2 0.10% 0.10% 0.09% 0.09%
Centro_1 0.69% 0.69% 0.67% 0.65%
Centro_2 0.40% 0.40% 0.39% 0.38%
Centro_3 0.09% 0.09% 0.08% 0.08%
Cidade Nova, Praça da Bandeira_2 0.21% 0.21% 0.21% 0.20%
Cidade Nova, Praça da Bandeira_3 0.07% 0.07% 0.06% 0.06%
Cocotá, Bancários_2 - - 0.08% 0.07%
Cocotá, Bancários_3 - - 0.04% 0.04%
Coelho Neto_2 - - - 0.14%
Colégio_2 0.06% 0.06% 0.06% -
Copacabana_1 4.95% 4.95% 4.82% 4.72%
Copacabana_2 3.77% 3.77% 3.67% 3.60%
Copacabana_3 2.54% 2.54% 2.47% 2.42%
Copacabana_4+ 0.77% 0.77% 0.75% 0.73%
Cordovil_2 - - - 0.19%
Curicica_2 0.04% 0.04% 0.04% 0.04%
Deodoro, Vila Militar, Campo dos Afonsos, Jardim Sulacap_2 0.17% 0.17% 0.17% 0.16%
Deodoro, Vila Militar, Campo dos Afonsos, Jardim Sulacap_3 - - - 0.08%
Engenho da Rainha_2 - - - 0.28%
Engenho de Dentro_1 0.16% 0.16% 0.15% 0.15%
Engenho de Dentro_2 0.39% 0.39% 0.38% 0.37%
Engenho de Dentro_3 0.12% 0.12% 0.12% 0.12%
Engenho Novo_1 0.22% 0.22% 0.21% 0.21%
Engenho Novo_2 0.47% 0.47% 0.46% 0.45%
Engenho Novo_3 0.15% 0.15% 0.15% 0.15%
Engenho Novo_4+ - - - 0.01%
Estácio_2 0.12% 0.12% 0.12% 0.11%
Estácio_3 - - - 0.04%
Flamengo_1 1.92% 1.92% 1.87% 1.83%
Flamengo_2 1.50% 1.50% 1.46% 1.43%
Flamengo_3 1.03% 1.03% 1.00% 0.98%
28
Cell 2008 2009 2010 2011
Flamengo_4+ 0.41% 0.41% 0.40% 0.39%
Freguesia (Jacarepaguá)_1 0.25% 0.25% 0.24% 0.24%
Freguesia (Jacarepaguá)_2 0.73% 0.73% 0.71% 0.69%
Freguesia (Jacarepaguá)_3 0.27% 0.27% 0.26% 0.26%
Freguesia (Jacarepaguá)_4+ 0.06% 0.06% 0.05% 0.05%
Freguesia_2 0.13% 0.13% 0.13% 0.13%
Freguesia_3 0.05% 0.05% 0.05% 0.05%
Freguesia_4+ - - 0.00% 0.00%
Gávea_1 - - 0.42% -
Gávea_2 0.49% 0.49% 0.48% 0.47%
Gávea_3 0.45% 0.45% 0.44% 0.43%
Gávea_4+ 0.20% 0.20% 0.20% 0.19%
Glória_1 0.27% 0.27% 0.26% 0.25%
Glória_2 0.24% 0.24% 0.24% 0.23%
Glória_3 - - 0.07% 0.07%
Grajaú_1 0.36% 0.36% 0.35% 0.35%
Grajaú_2 0.81% 0.81% 0.79% 0.77%
Grajaú_3 0.57% 0.57% 0.55% 0.54%
Grajaú_4+ 0.11% 0.11% 0.11% 0.11%
Guadalupe_1 - - - 0.06%
Guadalupe_2 0.18% 0.18% - 0.17%
Higienópolis_1 - - 0.08% 0.07%
Higienópolis_2 0.20% 0.20% 0.19% 0.19%
Higienópolis_3 0.04% 0.04% - -
Honório Gurgel_2 - - - 0.02%
Humaitá_1 0.42% 0.42% - -
Humaitá_2 0.49% 0.49% 0.48% 0.47%
Humaitá_3 0.30% 0.30% 0.29% 0.29%
Humaitá_4+ 0.07% 0.07% 0.07% 0.07%
Inhaúma_2 0.18% 0.18% 0.18% 0.17%
Ipanema_1 2.28% 2.28% 2.22% 2.18%
Ipanema_2 1.78% 1.78% 1.73% 1.70%
Ipanema_3 1.21% 1.21% 1.18% 1.15%
Ipanema_4+ 0.53% 0.53% 0.52% 0.51%
Irajá_2 0.87% 0.87% 0.85% 0.83%
Irajá_3 0.27% 0.27% 0.27% 0.26%
Itanhangá_2 0.03% 0.03% 0.03% 0.03%
Jacaré, Rocha, Sampaio_2 0.24% 0.24% 0.23% 0.22%
Jacaré, Rocha, Sampaio_3 0.08% 0.08% 0.07% 0.07%
Jacarepaguá_2 0.25% 0.25% 0.24% 0.24%
29
Cell 2008 2009 2010 2011
Jacarepaguá_3 0.02% 0.02% 0.02% 0.02%
Jardim América_2 0.14% 0.14% 0.14% 0.13%
Jardim Botânico_1 0.48% 0.48% 0.46% -
Jardim Botânico_2 0.49% 0.49% 0.47% 0.46%
Jardim Botânico_3 0.47% 0.47% 0.46% 0.45%
Jardim Botânico_4+ 0.15% 0.15% 0.14% 0.14%
Jardim Carioca_3 - - 0.04% 0.04%
Jardim Guanabara_2 - - 0.54% 0.53%
Jardim Guanabara_3 0.50% 0.50% 0.49% 0.48%
Jardim Guanabara_4+ - - 0.11% 0.11%
Lagoa_1 0.78% 0.78% - 0.74%
Lagoa_2 0.85% 0.85% 0.82% 0.81%
Lagoa_3 0.76% 0.76% 0.74% 0.73%
Lagoa_4+ 0.36% 0.36% 0.35% 0.35%
Laranjeiras_1 0.96% 0.96% 0.93% 0.91%
Laranjeiras_2 1.40% 1.40% 1.36% 1.33%
Laranjeiras_3 1.03% 1.03% 1.00% 0.98%
Laranjeiras_4+ 0.41% 0.41% 0.40% 0.39%
Leblon_1 1.88% 1.88% 1.82% 1.79%
Leblon_2 1.57% 1.57% 1.53% 1.50%
Leblon_3 1.64% 1.64% 1.59% 1.56%
Leblon_4+ 0.65% 0.65% 0.64% 0.62%
Leme_1 0.56% 0.56% 0.54% 0.53%
Leme_2 0.35% 0.35% 0.34% 0.33%
Leme_3 0.27% 0.27% 0.26% 0.25%
Leme_4+ 0.05% 0.05% 0.05% 0.05%
Lins de Vasconcelos_1 - - 0.17% -
Lins de Vasconcelos_2 0.41% 0.41% 0.40% 0.39%
Lins de Vasconcelos_3 - - 0.11% 0.11%
Madureira_1 - - - 0.09%
Madureira_2 0.31% 0.31% 0.30% 0.29%
Madureira_3 0.07% 0.07% 0.07% 0.07%
Mangueira, São Francisco Xavier_2 0.13% 0.13% 0.12% 0.12%
Maracanã_1 0.35% 0.35% 0.34% 0.33%
Maracanã_2 0.73% 0.73% 0.71% 0.70%
Maracanã_3 0.41% 0.41% 0.40% 0.39%
Maracanã_4+ - - 0.05% 0.05%
Marechal Hermes_2 - - 0.12% 0.12%
Maria da Graça, Del Castilho_1 0.10% 0.10% - -
Maria da Graça, Del Castilho_2 0.20% 0.20% 0.20% 0.19%
30
Cell 2008 2009 2010 2011
Maria da Graça, Del Castilho_3 - - 0.09% 0.09%
Méier_1 0.45% 0.45% 0.43% 0.42%
Méier_2 1.15% 1.15% 1.12% 1.10%
Méier_3 0.54% 0.54% 0.52% 0.51%
Méier_4+ 0.01% 0.01% 0.01% 0.01%
Moneró, Portuguesa_2 - - 0.37% 0.36%
Moneró, Portuguesa_3 - - 0.19% 0.18%
Olaria_2 0.56% 0.56% 0.54% 0.53%
Olaria_3 0.12% 0.12% 0.12% 0.12%
Oswaldo Cruz_2 - - 0.18% 0.18%
Padre Miguel_2 - - 0.11% 0.10%
Pavuna_1 - - 0.09% 0.09%
Pavuna_2 0.18% 0.18% 0.18% 0.17%
Pechincha_1 0.17% 0.17% 0.17% 0.16%
Pechincha_2 0.47% 0.47% 0.45% 0.44%
Pechincha_3 0.08% 0.08% 0.08% 0.08%
Pechincha_4+ - - - 0.00%
Penha Circular_2 0.37% 0.37% 0.36% 0.36%
Penha Circular_3 - - 0.09% 0.09%
Penha_1 - - - 0.14%
Penha_2 0.41% 0.41% 0.40% 0.39%
Penha_3 0.11% 0.11% 0.11% 0.11%
Piedade_1 0.07% 0.07% - 0.07%
Piedade_2 0.27% 0.27% 0.27% 0.26%
Piedade_3 - - - 0.05%
Pilares_2 0.16% 0.16% 0.16% 0.16%
Praça Seca_1 - - 0.16% 0.16%
Praça Seca_2 0.54% 0.54% 0.52% 0.51%
Praça Seca_3 0.14% 0.14% 0.14% 0.13%
Quintino_2 0.17% 0.17% 0.16% 0.16%
Quintino_3 - - - 0.02%
Ramos_2 0.28% 0.28% 0.27% 0.27%
Ramos_3 - - - 0.08%
Realengo_1 - - 0.13% 0.13%
Realengo_2 0.46% 0.46% 0.45% 0.44%
Recreio dos Bandeirantes, Grumari_1 0.29% 0.29% 0.28% 0.28%
Recreio dos Bandeirantes, Grumari_2 0.46% 0.46% 0.44% 0.44%
Recreio dos Bandeirantes, Grumari_3 0.51% 0.51% 0.49% 0.48%
Recreio dos Bandeirantes, Grumari_4+ 0.16% 0.16% 0.15% 0.15%
Riachuelo_1 - - - 0.05%
31
Cell 2008 2009 2010 2011
Riachuelo_2 0.18% 0.18% 0.18% 0.17%
Riachuelo_3 0.09% 0.09% 0.09% 0.09%
Ribeira, Cacuia_2 - - 0.08% 0.08%
Ribeira, Cacuia_3 - - 0.03% 0.03%
Rio Comprido_1 0.18% 0.18% 0.18% 0.17%
Rio Comprido_2 0.41% 0.41% 0.39% 0.39%
Rio Comprido_3 0.18% 0.18% 0.17% 0.17%
Rocha Miranda_2 0.10% 0.10% 0.10% 0.10%
Santa Teresa, Cosme Velho_1 0.43% 0.43% 0.42% 0.41%
Santa Teresa, Cosme Velho_2 0.40% 0.40% 0.39% 0.38%
Santa Teresa, Cosme Velho_3 0.17% 0.17% 0.16% 0.16%
Santa Teresa, Cosme Velho_4+ - - 0.04% 0.04%
São Cristóvão_1 0.09% 0.09% 0.09% 0.09%
São Cristóvão_2 0.24% 0.24% 0.23% 0.22%
São Cristóvão_3 0.06% 0.06% 0.06% 0.05%
Saúde, Gamboa, Santo Cristo_2 - - - 0.07%
Senador Camara_2 - - 0.15% 0.15%
Tanque_2 0.17% 0.17% 0.16% 0.16%
Tanque_3 - - 0.07% 0.07%
Taquara_1 0.20% 0.20% - 0.19%
Taquara_2 0.59% 0.59% 0.58% 0.56%
Taquara_3 0.12% 0.12% 0.12% 0.12%
Taquara_4+ - - - 0.01%
Tauá_2 - - 0.13% 0.13%
Tauá_3 - - - 0.07%
Tijuca_1 2.70% 2.70% 2.62% 2.57%
Tijuca_2 3.61% 3.61% 3.51% 3.44%
Tijuca_3 2.75% 2.75% 2.67% 2.62%
Tijuca_4+ 0.55% 0.55% 0.54% 0.53%
Todos os Santos_2 - - 0.36% 0.35%
Todos os Santos_3 - - 0.20% 0.19%
Tomás Coelho_2 0.16% 0.16% 0.16% 0.15%
Turiaçú_2 - - 0.06% 0.06%
Urca_2 0.68% 0.68% - -
Urca_3 0.39% 0.39% 0.38% 0.37%
Urca_4+ 0.13% 0.13% 0.13% 0.13%
Vicente de Carvalho_1 - - - 0.02%
Vicente de Carvalho_2 0.06% 0.06% 0.05% 0.05%
Vidigal, São Conrado_2 0.29% 0.29% 0.28% 0.28%
Vidigal, São Conrado_3 0.40% 0.40% 0.39% 0.38%

32
Cell 2008 2009 2010 2011
Vidigal, São Conrado_4+ 0.22% 0.22% 0.21% 0.21%
Vila da Penha_1 0.13% 0.13% - 0.13%
Vila da Penha_2 0.32% 0.32% 0.31% 0.30%
Vila da Penha_3 0.11% 0.11% 0.11% 0.11%
Vila Isabel_1 0.77% 0.77% 0.74% 0.73%
Vila Isabel_2 1.54% 1.54% 1.50% 1.47%
Vila Isabel_3 0.95% 0.95% 0.92% 0.90%
Vila Isabel_4+ - - 0.09% 0.09%
Vila Kosmos_2 0.11% 0.11% 0.11% 0.10%
Zumbi, Pitangueiras, Praia da Bandeira_1 - - - 0.06%
Zumbi, Pitangueiras, Praia da Bandeira_2 - - 0.16% 0.16%
Zumbi, Pitangueiras, Praia da Bandeira_3 - - 0.07% 0.07%
33
5.3 BELO HORIZONTE
Cell 2008 2009 2010 2011
Abílio Machado_2 - 0.22% 0.22% -
Abílio Machado_3 - 0.17% 0.17% 0.19%
Anchieta/Sion_2 - 3.93% 3.93% 4.35%
Anchieta/Sion_3 - 5.92% 5.92% 6.55%
Anchieta/Sion_4+ - 3.07% 3.07% 3.39%
Barro Preto_2 - 2.02% 2.02% -
Barroca_2 - 3.23% 3.23% 3.57%
Barroca_3 - 5.36% 5.36% 5.93%
Barroca_4+ - 2.03% 2.03% 2.24%
Betânia_3 - - - 0.44%
Caiçara_2 - 0.82% 0.82% 0.91%
Caiçara_3 - 0.86% 0.86% 0.95%
Caiçara_4+ - - - 0.62%
Castelo_2 - 0.93% 0.93% 1.03%
Castelo_3 - 0.71% 0.71% 0.78%
Castelo_4+ - 0.17% 0.17% 0.18%
Copacabana_3 - - - 0.26%
Cristiano Machado_2 - 2.86% 2.86% -
Cristiano Machado_3 - 3.63% 3.63% 4.02%
Cristiano Machado_4+ - 1.16% 1.16% 1.28%
Estoril/Buritis_2 - 1.20% 1.20% 1.33%
Estoril/Buritis_3 - 1.14% 1.14% 1.26%
Estoril/Buritis_4+ - 0.81% 0.81% 0.90%
Floresta/Santa Tereza_2 - 1.16% 1.16% -
Floresta/Santa Tereza_3 - 1.23% 1.23% 1.36%
Floresta/Santa Tereza_4+ - 0.18% 0.18% 0.20%
Instituto Agronômico_2 - 1.45% 1.45% -
Instituto Agronômico_3 - 1.49% 1.49% 1.65%
Instituto Agronômico_4+ - 0.25% 0.25% -
Jaraguá_3 - 0.66% 0.66% 0.73%
Jaraguá_4+ - 0.11% 0.11% -
Jardim América_2 - 1.79% 1.79% 1.98%
Jardim América_3 - 2.06% 2.06% 2.28%
Jardim América_4+ - 0.45% 0.45% -
Padre Eustáquio_2 - 2.07% 2.07% -
Padre Eustáquio_3 - 1.50% 1.50% 1.66%
Padre Eustáquio_4+ - 0.25% 0.25% -
Prudente de Morais_2 - 1.01% 1.01% 1.11%

34
Cell 2008 2009 2010 2011
Prudente de Morais_3 - 2.29% 2.29% 2.54%
Prudente de Morais_4+ - 1.28% 1.28% 1.42%
PUC_3 - 0.98% 0.98% 1.08%
Santa Amélia_3 - 0.33% 0.33% 0.37%
Santa Efigênia_2 - 0.74% 0.74% 0.82%
Santa Efigênia_3 - 0.84% 0.84% 0.93%
Santa Efigênia_4+ - 0.29% 0.29% 0.32%
Santo Antônio_2 - 2.59% 2.59% 2.86%
Santo Antônio_3 - 3.46% 3.46% 3.82%
Santo Antônio_4+ - 1.45% 1.45% 1.61%
Savassi_1 - 6.38% 6.38% 7.06%
Savassi_2 - 5.25% 5.25% 5.81%
Savassi_3 - 6.59% 6.59% 7.29%
Savassi_4+ - 5.19% 5.19% 5.74%
Serra_2 - 1.81% 1.81% 2.01%
Serra_3 - 2.74% 2.74% 3.03%
Serra_4+ - 1.91% 1.91% 2.11%

35
5.4 RECIFE
Cell 2008 2009 2010 2011
Aflitos/Espinheiro_2 - - 2.19% 2.19%
Aflitos/Espinheiro_3 - - 3.29% 3.29%
Aflitos/Espinheiro_4+ - - 1.65% 1.65%
Boa Viagem_1 - - 9.91% 9.91%
Boa Viagem_2 - - 19.70% 19.70%
Boa Viagem_3 - - 18.09% 18.09%
Boa Viagem_4+ - - 13.19% 13.19%
Derby/Graças/Jaqueira_3 - - 5.53% 5.53%
Derby/Graças/Jaqueira_4+ - - 2.28% 2.28%
Dois Irmãos/S. dos Pintos/Poço/Monteiro/Apipucos_4+ - - 0.60% 0.60%
Encruzilhada/Hipódromo/P.Parada/Rosarinho/Torreão_2 - - 1.27% 1.27%
Encruzilhada/Hipódromo/P.Parada/Rosarinho/Torreão_3 - - 1.19% 1.19%
Encruzilhada/Hipódromo/P.Parada/Rosarinho/Torreão_4+ - - 0.38% 0.38%
Iputinga_3 - - 1.10% 1.10%
Madalena/Ilha do Retiro_2 - - 1.79% 1.79%
Madalena/Ilha do Retiro_3 - - 2.01% 2.01%
Madalena/Ilha do Retiro_4+ - - 1.08% 1.08%
Tamarineira/Parnamirim/Casa Forte/Santana_2 - - 2.88% 2.88%
Tamarineira/Parnamirim/Casa Forte/Santana_3 - - 3.88% 3.88%
Tamarineira/Parnamirim/Casa Forte/Santana_4+ - - 2.91% 2.91%
Tejipió/Barro_3 - - 0.10% 0.10%
Tor2 - - 1.48% 1.48%
Tor3 - - 1.23% 1.23%
Tor4+ - - 0.20% 0.20%
Várzea Leste/Cde. Universit/Caxangá_2 - - 2.08% 2.08%

36
5.5 DISTRITO FEDERAL
Cell 2008 2009 2010 2011
Ra1 - AN_1 - - 11.85% 11.85%
Ra1 - AN_2 - - 11.12% 11.12%
Ra1 - AN_3 - - 14.82% 14.82%
Ra1 - AN_4+ - - 4.86% 4.86%
Ra1 - AS_1 - - 8.66% 8.66%
Ra1 - AS_2 - - 10.91% 10.91%
Ra1 - AS_3 - - 16.25% 16.25%
Ra1 - AS_4+ - - 7.80% 7.80%
Ra12_2 - - 0.19% 0.19%
Ra12_3 - - 0.05% 0.05%
Ra3_1 - - 2.54% 2.54%
Ra3_2 - - 6.00% 6.00%
Ra3_3 - - 4.00% 4.00%
Ra3_4+ - - 0.46% 0.46%
Ra9_2 - - 0.49% 0.49%

37
5.6 FORTALEZA
Cell 2008 2009 2010 2011
Alagadiço Novo / Cambeba / Parque Iracema_3 - - 0.20% 0.20%
Aldeota_2 - - 6.30% 6.30%
Aldeota_3 - - 9.52% 9.52%
Aldeota_4+ - - 12.79% 12.79%
Centro / Arraial Moura Brasil / Praia de Iracema_2 - - 2.34% 2.34%
Cidade Dos Funcionários / Cajazeiras_3 - - 0.96% 0.96%
Dendê / Jardim Cearense / Maraponga_3 - - 0.26% 0.26%
Dionísio Torres / Cocó_2 - - 3.42% 3.42%
Dionísio Torres / Cocó_3 - - 8.05% 8.05%
Dionísio Torres / Cocó_4+ - - 9.65% 9.65%
Fátima_2 - - 2.41% 2.41%
Fátima_3 - - 3.65% 3.65%
Meireles_2 - - 7.83% 7.83%
Meireles_3 - - 10.96% 10.96%
Meireles_4+ - - 12.09% 12.09%
Papicu_3 - - 2.76% 2.76%
Parque Manibura / Eng. Luciano Cavalcanti / Guarapés /
Salinas_3 - - 1.12% 1.12%
Passaré_3 - - 0.14% 0.14%
Varjota / Mucuripe_2 - - 2.38% 2.38%
Varjota / Mucuripe_3 - - 3.17% 3.17%
38
5.7 SALVADOR
Cell 2008 2009 2010 2011
Armação/Costa Azul/Stiep e Conjunto dos Bancários_2 - - 4.45% 4.45%
Armação/Costa Azul/Stiep e Conjunto dos Bancários_3 - - 4.29% 4.29%
Barra E Barra Avenida_3 - - 2.30% 2.30%
Barra E Barra Avenida_4+ - - 1.60% 1.60%
Brotas/Acupe e Daniel Lisboa_2 - - 3.27% 3.27%
Campo Grande Canela e Vitória_3 - - 2.78% 2.78%
Campo Grande Canela e Vitória_4+ - - 2.16% 2.16%
Candeal e Horto Florestal de Brotas_2 - - 2.15% 2.15%
Candeal e Horto Florestal de Brotas_3 - - 2.33% 2.33%
Candeal e Horto Florestal de Brotas_4+ - - 2.01% 2.01%
Chame Chame/Jardim Apipema/Morro do Gato e Morro Ipiranga_3 - - 2.82% 2.82%
Graça_3 - - 4.23% 4.23%
Graça_4+ - - 3.63% 3.63%
Imbuí_2 - - 2.67% 2.67%
Imbuí_3 - - 3.61% 3.61%
Itaigara/Caminho Das Árvores E Iguatemi_1 - - 3.60% 3.60%
Itaigara/Caminho Das Árvores E Iguatemi_2 - - 4.48% 4.48%
Itaigara/Caminho Das Árvores E Iguatemi_3 - - 7.55% 7.55%
Itaigara/Caminho Das Árvores E Iguatemi_4+ - - 4.01% 4.01%
Itapuã e Nova Conquista_2 - - 0.24% 0.24%
Ondina/São Lázaro/Cardeal da Silva e Vila Matos_3 - - 0.98% 0.98%
Patamares/Pituaçu/Piatã e Bate Facho_1 - - 0.18% 0.18%
Patamares/Pituaçu/Piatã e Bate Facho_2 - - 0.43% 0.43%
Patamares/Pituaçu/Piatã e Bate Facho_3 - - 0.35% 0.35%
Patamares/Pituaçu/Piatã e Bate Facho_4+ - - 0.13% 0.13%
Pituba e Parque Nossa Senhora da Luz_2 - - 8.59% 8.59%
Pituba e Parque Nossa Senhora da Luz_3 - - 11.07% 11.07%
Pituba e Parque Nossa Senhora da Luz_4+ - - 5.17% 5.17%
Rio Vermelho e Parque Cruz Aguiar_2 - - 1.60% 1.60%
Rio Vermelho e Parque Cruz Aguiar_3 - - 2.17% 2.17%
São Marcos/Canabrava/Recanto das Ilhas/Colinas de Pituaçu/Vivenda
dos Pássaros/Vivendas do Campo/Nova Cidade/Jardim das Limeiras/Vale
dos Lagos/ Paralela Park e Lagoa Verde_2
- - 4.17% 4.17%
São Marcos/Canabrava/Recanto das Ilhas/Colinas de Pituaçu/Vivenda
dos Pássaros/Vivendas do Campo/Nova Cidade/Jardim das Limeiras/Vale
dos Lagos/ Paralela Park e Lagoa Verde_3
- - 1.00% 1.00%