Methodology for Determining Pavement Reflectivity for...
7
80 visual scene in the field study has a significant number of light sources in the field of view as well as periodically heavy traffic in both directions that seemed to be affecting target contrast and veiling luminance. None of these effects are ac- counted for in the computer-predicted VI. Do these factors influence our adaptation in a way that is not accounted for in the CIE 19/2 model? These last questions indicate the need for fur- ther study to correlate field conditions with the measurement techniques and with prediction models. It is hoped that this additional study can be done within the next year. CONCLUSIONS Although further study is warranted to fine-tune the results of varying specific physical parameters re- lated to pavement luminance and VI figures of merit, the study to date was rigorous enough to draw some basic conclusions. These are as follows: 1. Average pavement luminance is not a predictor of average visibility of the small target used based on the model of CIE 19/2, 2. Uniformity of pavement luminance is not a predictor of improved VI figures of merit based on the model of CIE 19/2 for this target, and 3. Many application techniques commonly used to improve the figures of merit for pavement luminance cause reductions in the figures of merit for VI based on CIE 19/2 for this target. Transportation Research Record 904 REFERENCES 1. American National Standard Practice for Roadway Lighting. American National Standards Insti- tute, New York, Rept. !ES/ANSI RP8-1977, 1977. 2. An Analytic Model for Describing the Influence of Lighting Parameters upon Visual Performance. International Commission on Illumination, Paris, France, Publ. CIE 19/2 (TC-3.1), 1980. 3. V.P. Gallagher. A Visibility Metric for Safe Lighting of City Streets. Journal of the Illu- minating Engineering Society, Jan. 1976. 4. O.M. Blackwell and H.R. Blackwell. A Proposed Procedure for Predicting Performance Aspects of Roadway Lighting in Terms of Visibility. Jour- nal of the Illuminating Engineering Society, 1977. 5. Recommendations for the Lighting of Roads for Motorized Traffic. International Commission on Illumination, Paris, France, CIE Rept. 12-2, 1977. 6. H.R. Blackwell. A Comprehensive Quantitative Method for Prediction of Visual Performance Po- tential as a Function of Reference Luminance. Journal of the Illuminating Engineering Society, Oct. 1982. Publication of this paper sponsored by Committee on Visibility. Methodology for Determining Pavement Reflectivity for Roadway Luminance Calculation RONALD N. HELMS The field test procedures for determining the reflective properties and the macro· structure of a pavement surface are described. The light-reflecting characteristics of roadway surfaces affect the quantity and quality of light reflected (luminance) from the pavement. The luminance of the pavement surface and its uniformity affect the visibility of objects on the roadway surface. The uniformity of lumi- nance patterns reduces confusion and clutter and stabilizes the driver's adapta- tion state. Improved visibility through better roadway lighting can result in in· creased safety for the nighttime driver. The luminance of the pavement is the product of the light arriving at a point (illumination) multiplied by the luminance factor. The luminance factor represents the directional reflectivity of the pave- ment, which is a function of light source location, observer location, and macro· structure or microstructure of the pavement. The parameters used for test-site selection and a matrix of test-site variables are presented. Once a test site has been selected, the test-site locations for reflectance measurements, British portable tester, and sand patch are defined, and the preparation and measurement tech· niques are described. As reported in the paper, problems were discovered in the reflectometer mechanism electronics that invalidated the test data. The method· ology presented provides insight into the complexities of making pavement reflec· tance measurements. The procedures described lay the foundation for subsequent field measurements. The measurements are required to establish a simplified pavement reflectance classification system that is crucial to roadway luminance calculations. Fixed roadway lighting is important to the nighttime driver= The safety of a dri 1 !er at night is depen- dent on visibility, visual comfort, and driver alertness. These factors affect the driver's ability to see objects on the roadway with sufficient warn- ing to take appropriate and safe action. The visi- bility of an object on the roadway is dependent on the contrast between the object and its background (the pavement). The size and shape of the object, the state of driver adaptation, and the movement (versus stability) of the object also contribute to the visibility of the object. Headlight penetration limits the driver's visi- bility to distances that are marginal for safe stop- ping. Vehicle stopping distance consists of reac- t ion distance (reaction time x velocity) and braking distance. The reaction time is directly related to object visibility. The object must be detected and recognized by the driver. The driver must respond to the recognition of the object and then initiate some form of action. The response to the recogni- tion of the object and the initiation of action are related to the physiology of the individual driver. The detection and recognition are dependent on the visibility of the object. The size and shape of the object and whether the object is stationary or mov- ing are beyond the control of the driver or the agency responsible for safety on the highway. How- ever; fixed eygtems can increase object contrast, driver adaptation state, and detection distance. The improved visibility can reduce reac-
Transcript of Methodology for Determining Pavement Reflectivity for...

80
visual scene in the field study has a significant number of light sources in the field of view as well as periodically heavy traffic in both directions that seemed to be affecting target contrast and veiling luminance. None of these effects are accounted for in the computer-predicted VI. Do these factors influence our adaptation in a way that is not accounted for in the CIE 19/2 model?
These last questions indicate the need for further study to correlate field conditions with the measurement techniques and with prediction models. It is hoped that this additional study can be done within the next year.
CONCLUSIONS
Although further study is warranted to fine-tune the results of varying specific physical parameters related to pavement luminance and VI figures of merit, the study to date was rigorous enough to draw some basic conclusions. These are as follows:
1. Average pavement luminance is not a predictor of average visibility of the small target used based on the model of CIE 19/2,
2. Uniformity of pavement luminance is not a predictor of improved VI figures of merit based on the model of CIE 19/2 for this target, and
3. Many application techniques commonly used to improve the figures of merit for pavement luminance cause reductions in the figures of merit for VI based on CIE 19/2 for this target.
Transportation Research Record 904
REFERENCES
1 . American National Standard Practice for Roadway Lighting. American National Standards Insti-tute, New York, Rept. !ES/ANSI RP8-1977, 1977.
2. An Analytic Model for Describing the Influence of Lighting Parameters upon Visual Performance. International Commission on Illumination, Paris, France, Publ. CIE 19/2 (TC-3.1), 1980.
3. V.P. Gallagher. A Visibility Metric for Safe Lighting of City Streets. Journal of the Illuminating Engineering Society, Jan. 1976.
4. O.M. Blackwell and H.R. Blackwell. A Proposed Procedure for Predicting Performance Aspects of Roadway Lighting in Terms of Visibility. Journal of the Illuminating Engineering Society, 1977.
5. Recommendations for the Lighting of Roads for Motorized Traffic. International Commission on Illumination, Paris, France, CIE Rept. 12-2, 1977.
6. H.R. Blackwell. A Comprehensive Quantitative Method for Prediction of Visual Performance Potential as a Function of Reference Luminance. Journal of the Illuminating Engineering Society, Oct. 1982.
Publication of this paper sponsored by Committee on Visibility.
Methodology for Determining Pavement Reflectivity for
Roadway Luminance Calculation
RONALD N. HELMS
The field test procedures for determining the reflective properties and the macro· structure of a pavement surface are described. The light-reflecting characteristics of roadway surfaces affect the quantity and quality of light reflected (luminance) from the pavement. The luminance of the pavement surface and its uniformity affect the visibility of objects on the roadway surface. The uniformity of luminance patterns reduces confusion and clutter and stabilizes the driver's adaptation state. Improved visibility through better roadway lighting can result in in· creased safety for the nighttime driver. The luminance of the pavement is the product of the light arriving at a point (illumination) multiplied by the luminance factor. The luminance factor represents the directional reflectivity of the pavement, which is a function of light source location, observer location, and macro· structure or microstructure of the pavement. The parameters used for test-site selection and a matrix of test-site variables are presented. Once a test site has been selected, the test-site locations for reflectance measurements, British portable tester, and sand patch are defined, and the preparation and measurement tech· niques are described. As reported in the paper, problems were discovered in the reflectometer mechanism electronics that invalidated the test data. The method· ology presented provides insight into the complexities of making pavement reflec· tance measurements. The procedures described lay the foundation for subsequent field measurements. The measurements are required to establish a simplified pavement reflectance classification system that is crucial to roadway luminance calculations.
Fixed roadway lighting is important to the nighttime driver= The safety of a dri 1!er at night is dependent on visibility, visual comfort, and driver alertness. These factors affect the driver's ability
to see objects on the roadway with sufficient warning to take appropriate and safe action. The visibility of an object on the roadway is dependent on the contrast between the object and its background (the pavement). The size and shape of the object, the state of driver adaptation, and the movement (versus stability) of the object also contribute to the visibility of the object.
Headlight penetration limits the driver's visibility to distances that are marginal for safe stopping. Vehicle stopping distance consists of react ion distance (reaction time x velocity) and braking distance. The reaction time is directly related to object visibility. The object must be detected and recognized by the driver. The driver must respond to the recognition of the object and then initiate some form of action. The response to the recognition of the object and the initiation of action are related to the physiology of the individual driver. The detection and recognition are dependent on the visibility of the object. The size and shape of the object and whether the object is stationary or moving are beyond the control of the driver or the agency responsible for safety on the highway. However; fixed li~hting eygtems can increase object contrast, driver adaptation state, and detection distance. The improved visibility can reduce reac-

Transportation Research Record 904
tion time and hence reaction distance. The increased detection distance will result in an increased margin of safety to allow the driver to take appropriate and safe action.
The level of background luminance and its uniformity affect the contrast discrimination and one's sensitivity to contrast. The background luminance is a function of the reflective properties of the pavement. Light that strikes the macrostructure or microstructure of the pavement will cause different quantities of light to be reflected toward the driver. The quantity of light leaving (luminance) the roadway is a function of the direction from which the light is arriving (illumination) and the reflecting properties of the surface for a given viewing direction and angle. The term "luminance factor" is used to describe the reflected component from a nondiffuse reflecting surface. The luminance factor, which is denoted by the symbol B, varies as a function of the location of the light source, the location of the observer (driver), and the macrostructure or microstructure of the pavement. This means that the luminance of a point (Lp) is the sum of the products of the illumination that arrive at the point multiplied by the corresponding luminance factor, i.e.,
(I)
where B (v0 , Vs• h) defines a specific luminance factor for a given viewing position (v
0) and
light source location (vs, h) (see Figure 1). Reid and Channon (1,2), Kraehenbuehl (3), Finch
and Marxheimer (4), Wyatt (5), and King ( 6, 7) are some of the researchers in the United States that have made laboratory measurements of pavement reflectivity and developed classification schemes for calculating pavement luminance. The major problem in applying these techniques is the lack of a method for quickly relating the existing roadway conditions to those pavements measured in the laboratory. Past measurements of the reflectivity properties of pavements have been accomplished by removing the pavement sample to the laboratory or by extensive and bulky field instrumentation. When samples are removed from the pavement, there can be gross changes in the macrostructure of the sample that could affect its reflecting properties and hence the validity of the data.
Problems with the instrument electronics necessitated a change in electronics subcontractors six months into the project. Because problems with the electronics had already delayed data collection by three months, it was decided that the new subcontractor should salvage as much of the existing reflectometer mechanism electronics as possible. In hindsight, this was a mistake. The change in subcontractors and the modification of the electronics resulted in a six-month delay in data collection. This resulted in a reduction in the test period from the original 12 months to only 7 months.
Data collected during the first three months of field measurements were consistent with previous laboratory data ( 6, 7) • The subcontractor, who was responsible for dat a- analysis, got behind in analyzing data due to delays in scheduled computer system maintenance and modification. The data collected during the last four months were analyzed during the seventh month of testing. The analysis of the last four months of data indicated that another malfunction had occurred in the original reflectometer mechanism electronics during the time the dataanalysis computer was down.
This paper describes the instrumentation and methodology developed under a research grant from the Federal Highway Administration (FHWA) (~) for
Bl
Figure 1. Measurement terminology.
_l Li\tlt Sotrce
Figure 2. Cl E definition of beta and gamma.
making in situ measurements of the reflecting properties (luminance factors) for roadway surfaces. The paper does not deal with the data collected during the seven-month test period. The basic reflectometer mechanism operation, control electronics (interface) , and data-collection system were flawless in their operation. The concepts and methodology were judged significant enough that FHWA chose to fund a second phase of this research proiect. The second phase involves the modification of the reflectometer mechanism electronics, which is under way at this time.
The instrument used to measure the luminance factors is called a gonio-reflectometer. By using the procedures described in this paper and the gonio-reflectometer, a large in situ data base could be developed. These data, combined with the large base of existing laboratory data, could be used to develop a pavement reflectance classification system and a light-weight, simple field instrument for classifying unlit roadways.
In Europe, researchers (.2_-11) have developed a classification system that has evolved into the International Commission on Illumination (CIE) method (12). The CIE method uses the terminology "luminance- coefficient" rather than "luminance factor" to describe the reflecting characteristics of nondiffuse surfaces. The symbol B is used to describe a horizontal angle in the CIE method (Figure 2) , while B is the symbol used to denote luminance factors in the United States. In the CIE method, each luminance coefficient (luminance factor) is multiplied by cos'y (Figure 2) and 10' to produce a reduced luminance coefficient, which is reported in a tabular form called an r-table. The CIE method uses a viewing angle (a) of 1°. Figure 3 shows the standard format for an r-table in the CIE method. The data reported in an r-table are limited to a portion of the hemispherical data, which limits luminance calculations to points that fall within a defined area. Luminance calculations that involve
82 Transportation Research Record 904
Figure 3. CIE beta and gamma angles. B
tany y 0 - 5 - 10 - 15 - 20 - 25 - 30 - 35 - 40 - 45 - 60 - 75 - 90 - 105 - 120 - 135 - 150 - 165 - 180
-o ft x • • • • 0. 2< 1• .04 x • • • x
l.k 2657 . . • • • ~.KT x x x x • - i •~M x . • . ~
l.25 .... x x x • x -m :.io • .)I . . x • x 1:75" "10:!"0 x • . x ' ·2- , .... x x x . ' -n- 68.>n • . • • " i;= IT:S x x x x x
/11.n< • . • • x
~T ~ ~~} x x x x x x . x • •
' :&'l x • x . x :;;ir 70 x x • x x
~ E !.,_~4 "--~--·--• .. 8 .2S • • • x • µ: 5 ::{l- • x • x x "ll . -.--.--. x ' -nnT • • • • • :µ:: ~ x " • x x ~ ..!..-l'.. x x x I
~ .• ... •• • • • x x I 10 84.29 x x x --{ : ·I {fl- &I~ • • . lHf x x x x x I rr:r • x • • IZ- ·~. x x x
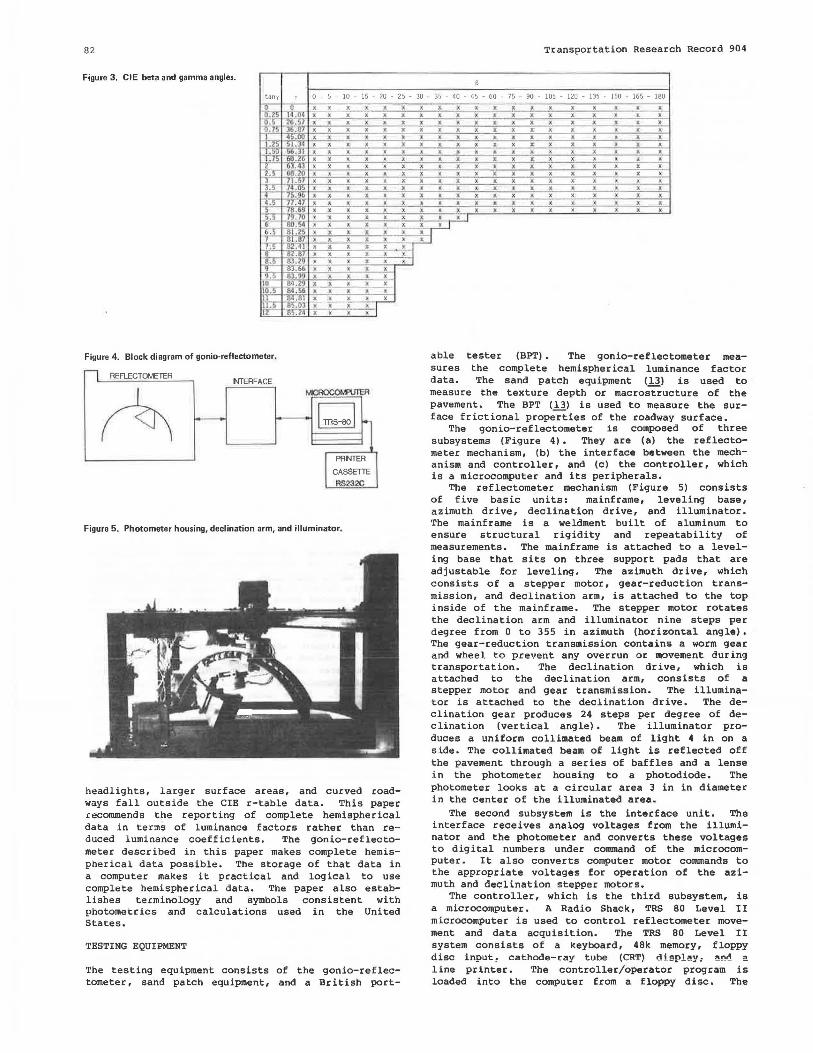
Figure 4. Block diagram of gonio-reflectometer.
REFLECTrn..E1ER NTERFACE
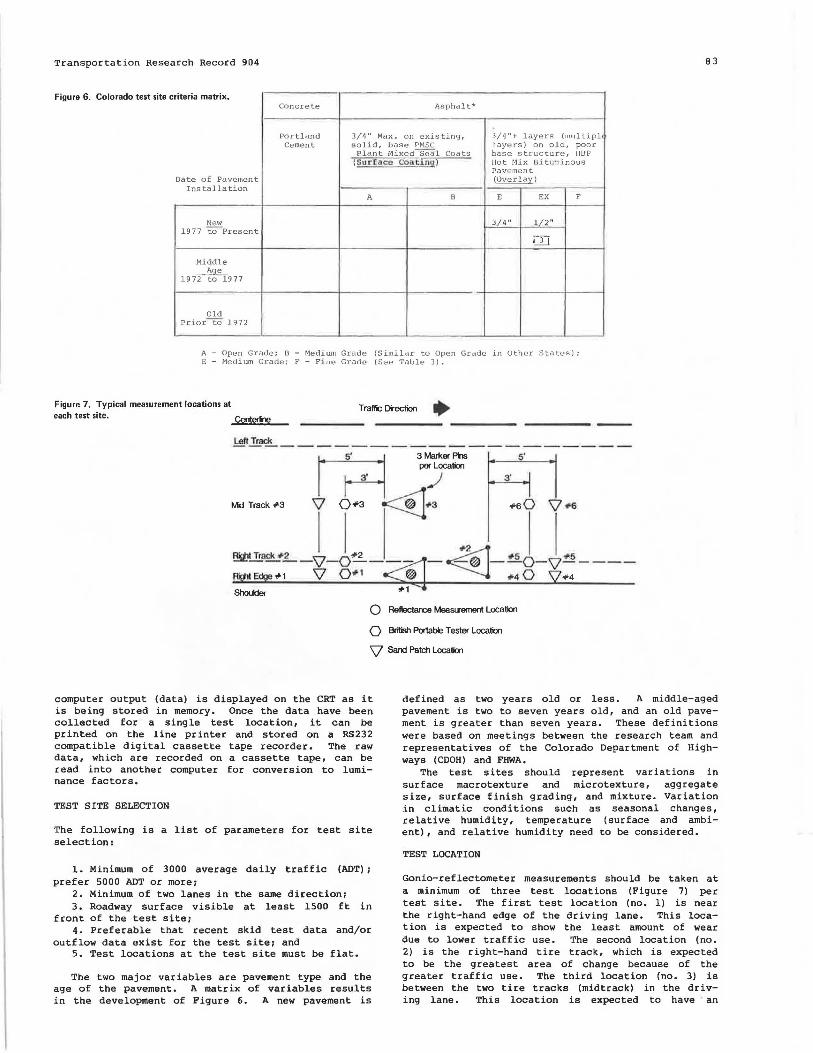
Figure 5. Photometer housing, declination arm, and illuminator.
headlights, larger surface areas, and curved roadways fall outside the CIE r-table data. This paper reconunends the reporting of complete hemispherical data in terms of luminance factors rather than reduced luminance coefficients. The gonio-reflectometer described in this paper makes complete hemispherical data possible. The storage of that data in a computer makes it practical and logical to use complete hemispherical data. The paper also establishes terminology and symbols consistent with photometrics and calculations used in the United States.
TESTING EQUIPMENT
The testing equipment consists of the gonio-reflectometer, sand patch equipment, and a British port-
• x • x . x . . . x x x x x x • x x x • x x x x x x • • • . • x x x x x • x • . x x x • • • • x x x x . x • x x
" • • • • • • • • . . . • • • • • • • x x x x x • • • x • • . • • . • x • • • ~ • . • • • • . x x x x x x x • • ' x x • x • x x • x x x • I x • ' x x • x x x x x x x • x • • x x • • x • • • . . . x . • • . _. . • • • . • x • x x x x x x x x x x x x • x • • • • x . . • • • • • . • • " . x • x x • x x • x x • x x • 1t
: i.-U x
• x • l
• I
able tester (BPT) . The gonio-ref lectometer measures the complete hemispherical luminance factor data. The sand patch equipment (13) is used to measure the texture depth or macrostructure of the pavement. The BPT (13) is used to measure the surface frictional prope-;ties of the roadway surface.
The gonio-ref lectometer is composed of three subsystems (Figure 4). They are (a) the reflectometer mechanism, (b) the interface between the mechanism and controller, and (c) the controller, which is a microcomputer and its peripherals.
The reflectometer mechanism (Figure 5) consists of five basic units: mainframe, leveling base, azimuth drive, declination drive, and illuminator. The mainframe is a weldment built of aluminum to ensure structural rigidity and repeatability of measurements. The mainframe is attached to a leveling base that sits on three support pads that are adjustable for leveling. The azimuth drive, which consists of a stepper motor, gear-reduction transmission, and declination arm, is attached to the top inside of the mainframe. The stepper motor rotates the declination arm and illuminator nine steps per degree from Oto 355 in azimuth (horizontal angle). The gear-reduction transmission contains a worm gear and wheel to prevent any overrun or movement during transportation. The declination drive, which is attached to the declination arm, consists of a stepper motor and gear transmission. The illuminator is attached to the declination drive. The declination gear produces 24 steps per degree of declination (vertical angle) • The illuminator produces a uniform collimated beam of light 4 in on a side. The collimated beam of light is reflected off the pavement through a series of baffles and a lense in the photometer housing to a photodiode. The photometer looks at a circular area 3 in in diameter in the center of the illuminated area.
The second subsystem is the interface unit. The interface receives analog voltages from the illuminator and the photometer and converts these voltages to digital numbers under command of the microcomputer. It also converts computer motor commands to the appropriate voltages for operation of the azimuth and declination stepper motors.
The controller, which is the third subsystem, is a microcomputer. A Radio Shack, TRS 80 Level I I microcomputer is used to control reflectometer movement and data acquisition. The TRS 80 Level II system consists of a keyboard, 48k memory, floppy disc input, cathode-ray 1;:1_1be (CRT) display, and a line printer. The controller/operator program is loaded into the computer from a floppy disc. The
Transportation Research Record 904 83
Figure 6. Colorado test site c riteria matrix. Concrete Asphalt*
Portland 3/4 " Max. on existing, 3/4"+ layers (mul tiplo Cement solid, base PMSC layers) on old, poor
Plant Mixed~l Coats base s t ruc ture, HBP (Surfac:c coating ) Hot Mix Bituminous
Pave me nt Date of Pavement (Overlay)
Installation A B E EX F
New 3/4 " 1/2 " 1977 ~Present
OJ Middle
~ 1972 to 1977
Old Prior"tO 1972
A - Open Grade; O - Medium Grade (Similar to Open Grade in Other States); E - Medium Grade; F - Fine Grode (See Table 3).
Figure 7. Typic:al measurement locations at each test site. Centeme
Traffic Di"eclion • Lelt T~-------------------
Md-Track #3
~ ~I
#6 0 'V # 6
<>w-.t Track # 2 '7 #2 ~ +5 #<5
;~-::-v-g~-~-~-:g-~:----ShoukJer #1
0 Reftectarce MeaSlJ'ement Location
0 British Portable Tester Location
\J Sand Patch Location
computer output (data) is displayed on the CRT as it is being stored in memory. Once the data have been collected for a single test location, it can be printed on the line printer and stored on a RS232 compatible digital cassette tape recorder. The raw data, which are recorded on a cassette tape, can be read into another computer for conversion to luminance factors.
TEST SITE SELECTION
The following is a list of parameters for test site selection:
l. Minimum of 3000 average daily traffic (ADT) ; prefer 5000 ADT or more;
2. Minimum of two lanes in the same direction; 3. Roadway surface visible at least 1500 ft in
front of the test site; 4. Preferable that recent skid test data and/or
outflow data exist for the test site ; and 5. Test locations at the test site must be flat.
The two major variables are pavement type and the age of the pavement. A matrix of variables results in the development of Figure 6. A new pavement is
defined as two years old or less. A middle-aged pavement is two to seven years old, and an old pavement is greater than seven years. These definitions were based on meetings between the research team and representatives of the Colorado Department of Highways (CDOH) and FHWA.
The test sites should represent variations in surface macrotexture and microtexture, aggregate size, surface finish grading, and mixture. Variation in climatic conditions such as seasonal changes, relative humidity, temperature (surface and ambient), and relative humidity need to be considered.
TEST LOCATION
Gonio-reflectometer measurements should be taken at a minimum of three test locations (Figure 7) per test site. The first test location (no. l) is near the right-hand edge of the driving lane. This location is expected to show the least amount of wear due to lower traffic use. The second location (no. 2) is the right-hand tire track, which is expected to be the greatest area of change because of the greater traffic use. The third location (no. 3) is between the two tire tracks (midtrack) in the driving lane. This location is expected to have · an

84
intermediate level of use, since ic is most commonly used during lane changes.
Figure 7 shows the recommended test locations for sand patch and BPT measurements. A minimum of six measurements for sand patch and six for BPT is recommended with three in front of the gonio-reflectometer test locations and three behind.
•rESTING PROCEDURE
The testing procedure can be described in three phases or parts. The first phase involves the pretraffic control setup for closure of the right-hand lane. The second phase involves data collection with the gonio-reflectometer, sand patch, and BPT. The third phase consists of posttraffic control, which involves removal of the barricades and signs.
The pretraffic control consists of the placement of signs and barricades to close the right-hand lane of traffic. Sign and barricade placement must meet the guidelines of the local highway safety engineer. Once the lane-closure guidelines have been estab-1 ished, a pretest site visit allows the position of each of the signs and barricades to be marked with safety orange paint. Pretest marking of sign and barricade placement speeds up placement on subsequent visits.
Before the first data-collection visit, the test site and test locations are determined during the pretest site visit. The pretest site visit involves the preparation and marking of the three gonio-ref lectometer test locations, the six sand patch test locations, and the six BPT test locations. Once the right-hand lane is closed, the pretest site preparation begins. The three gonio-reflectometer test locations are selected based on macrotexture, levelness, and consistency of pavement surface. A template (Figure 8) , which has three machined steel drill guides that match the three gonio-reflectometer support pads, is placed at the test location. Three holes are drilled into the pavement by using the drill guides in the template. Round magnetic stainless-steel pins are driven into the drilled holes in the pavement. These pins will be used in subsequent site visits to allow for more precise positioning of the gonio-reflectometer at each of the test locations. The pins are painted with safety orange paint. Orange markings are painted along the shoulder to help identify pin, sand patch, and BPT locations. This completes the initial or pretest site visit.
The data-collection phase begins during the next site visit once the right-hand lane has been closed. The gonio-reflectometer is removed from the trans-
Figure 8. Base pin template and hammer drill.
Trannportation Research Record 904
port ven1c~e and made ready for operation. The test locations are prepared by a second member of the research team. Test-location preparation consists of washing the reflectance measurement area with a mild soap solution, then thoroughly rinsing and air-drying the area. Once the area has dried, the pavement marker template is positioned over the three stainless-steel pins. The template is used to position a circular masking disc over the measurement area (Figure 8). With the masking disc in position, the template is removed and the pavement area enclosed by the gonio-reflectometer is sprayed with a fast-drying flat black paint. The masking disc is removed (Figure 9), which leaves the natural pavement in the measurement area clean and ready for measurements. The flat black paint is used to minimize stray light from reaching the photodiode.
While the test locations are being prepared, the project director is connecting the various computer components and the gonio-reflectometer. The gonioreflectometer is positioned on the calibration platform and the operating program is read into the computer. The reflectance working standard, which was calibrated against a known National Bureau of Standards reflectance tile, is placed in the support block that is fixed to the calibration platform (Figure 10). A reading is taken by the computer of the calibration valve.
The gonio-reflectometer is moved from the calibration platform to the first test location. To prevent light leaks between the base of the gonioreflectometer and the pavement, a black velvet cloth
Figure 9. Painted test location and painting disc.
Figure 10. Working standard in calibration platform.

Transportation Research Record 904
is placed around the base of the instrument (Figure 11). The operating program is initiated and the reflectance measurement sequence begins. The operating program moves the light source in preprogranuned steps and records the data. Figure 12 shows
Figure 11. Ginio-reflectometer in 111sting position.
Figure 12. Measurement angles and increments.
Figure 13. Sand patch field data sheet.
Horizontal Angles Vertical Angles (hi 1v,1
o• to 140°. 10° 0°1010°,s• 145° to 220° , 5° 71° to 89°, 1° 230° to 350°. 10°
Test Site No.: 3
Test Date: 11/6/80
Pavement Type: Asphalt-EX
Remarks
Diameter of Circle Sand
BS
the measurement angles and increments for both the horizontal (azimuth) and vertical (declination) angles. This results in 44 horizontal planes and 34 declination angles per horizontal plane for a total of 1496 data points. Once the data are collected, they are printed on the line printer and recorded on a cassette tape for later analysis. This completes the reflectance measurement at a single test location. The gonio-reflectometer is moved back to the calibration platform and the entire process is repeated for each of the remaining two test locations at each test site.
While the gonio-reflectometer measurements are being taken, one assistant is performing sand patch measurements at each of the six sand patch test locations and another assistant is making BPT measurements at the six BPT test locations. The sand patch data are recorded on a field data sheet, as shown in Figure 13. Figure 14 shows a field data sheet used with the BPT. Field test site data and testing conditions are recorded on a project test data sheet (Figure 15).
Once all the data have been recorded and the equipment stored in the transport vehicle, the painted test position markers are repainted with orange paint. The posttraffic phase is completed when the signs and barricades are removed. This completes a single test site visit.
CONCLUSIONS
The purpose of th i s paper is to describe the instrumentation and methodology for making pavement reflectance measurements. Modifications to the reflectometer electronics are currently under way. The
(cm) Radius
Patch Mean Individual Rad. Of Texture Test Location Mean Circle Depth by
No. 1 2 3 4 5 (cm) (mm)
1 30 30 . 5 29.S 30 30 30 15.0 .376 AG 2 31.5 32 31 32 30. S 31.4 15.7 .343 AG 3 30 29 . s 29 30 31 29 . 9 14.95 .378 AG 4 27 27 28 29 28 27 . 8 13.9 • 437 AG 5 34 34 34 34 34 34 17.0 .292 AG 6 30 30 29.5 28 29 .5 29 . 4 14. 7 .391 AG
Figure 14. BPT field data sheet. Test Site No: 3
Test Date: 1/6/80
Pavement Type: Asphalt-EX
Remark:
Skid Resistance Temperature
of Mean Individual Rad. Location Surface Water Mean
No. Texture (•ci l .2 3 4 5
1 E 20.79 68 67 68 68 68 67 . 8 2 E 20 . 03 65 65 64 65 65 64.8 3 E 20.57 63 63 65 65 63 63 . 8 4 E 16.18 63 63 62 63 63 62. 8 5 1 E 17.41 60 59 60 61 61 60. 2 6 E 17.63 67 67 68 68 68 67. 6

86
Figure 15. Sample fie!d test data sheet.
FHWA. Contract DOT-FH-11-9482 Project Teet Data Sheet File Name - D00311
Transportation Research Record 904
Test Site No. 3 Test Date 11/06/80 Project Director RNH
Weather Conditions Warm Pavement Type EX-ASPH
Tape I.D. Dl2B BPT Sheet No. 11 SP Sheet No. , 11
SEQ NO. CAL NO. LAMP AMB-TEM PAV-TEM BOX-TEM DIODE-TEM TIME
317 14464. 7568. 22.20 17.54 18.80 . oo 1115 327 14232. 7308. 22.20 19.19 21.70 .oo 1205 337 13880. 7440. 27.20 22.57 25.50 .oo 1345
BPT SUMMARY LOC NO. SURFACE TEXT H20 TEMP MEA.N SKID RESIST
1 E 20.79 2 E 20.03 3 E 20.57 4 E 16.18 5 E 17.41 6 E 17.63
SP SUMMARY LOC NO. MEAN DIAM RADIUS CIRCLE
1 30.00 15.00 2 31. 40 15.70 3 29.90 14.95 4 27.80 13.90 5 34.00 17.00 6 29.40 14.70
modified gonio-reflectometer will be used in subsequent research projects to collect in situ reflectance data by using the methodology described in this paper. Collection of reflectance, sand patch, and BPT data in conjunction with existing laboratory data can result in the development of a pavement reflectance classification system. The pavement reflectance classification system can be used to establish the reflecting properties of a roadway surface. Luminance factor data are used to calculate the luminance of the pavement, which is critical to object visibility on the roadway. Pavement luminance (background luminance) affects adaptation state and contrast discrimination, which in turn affect visibility and safety on the highway at night.
ACKNOWLEDGMENT
The research reported in this paper was supported by FHWA. The opinions, findings, and conclusions are mine and are not necessarily endorsed by FHWA. I am indebted to several people and agencies who provided technical assistance during this research, including CDOH, the University of Colorado (where the research was conducted), Instrument Design Labs, Independent Test Labs, Gary Emerson, and the field research team of Dave, Peter, Ali, and Lee. The assistance of FHwA contract manager Richard Schwab is also greatly appreciated and acknowledged.
REFERENCES
1. K.M. Reid and H.J. Channon. Determination of Visibility on Lighted Highways. Trans., Illuminating Engineering Society, Vol. 32, No. 2, Feb. 1937.
2. K .M. Reid and H.J. Channon. Evaluation of Street Lighting. Trans., Illuminating Engineering Society, Vol. 34, No. 10, Dec. 1939.
3. J.O. Kraehenbuehl. Measurement of Pavement Surface Characteristics. Illuminating Engineering, Vol. 47, No. 5, May 1952.
4 ; D:ftL Finch and E;B: Marxheimer= Pavement Brightness Measurements. Illuminating Engineering, Vol. 48, No. 2, Feb. 1953.
67.96 64.81 63.91 63.04 60.68 68.13
TEXTURE DEPTH
.38
.34
.38
.44
.29
.39
s. F.D. Wyatt. Pavement Texture and Brightness, Part l. Illuminating Engineering, Vol. 43, No. 10, Dec. 1948.
6. L.E. King and D.M. Finch. Roadway Surface Classification. Illuminating Engineering, Vol. 63, No. 12, Dec. 1968.
7. L.E. King. Measurement of Directional Reflectance of Pavement Surfaces and Development of Computer Techniques for Calculating Luminance. Journal of the Illuminating Engineering Society, Vol. 5, No. 2, Jan. 1976, pp. 118-126.
8. Determining Pavement Reflectance for Road Lighting. FHWA, Rept. RFP-215-8, HCP-30, March 1978.
9. J.D. deBoer and A. Oostrijck. Reflection Properties of Dry and wet Road Surfaces and a Simple Method for Their Measurement. Philips Company, Eindhoven, Netherlands, Philips Res. Rept., Vol. 9, pp. 209-224, no date.
H.O. Westermann. Public Lighting.
10. Van Bononel, J.M. wout, and Luminance Calculations for Philips Company, Eindhoven, neering Rept. 27, 1974.
Netherlands, Engi-
ll. J .D. deBoer and J. Vermeulen. Simple Luminance Calculation Based on Road Surface Classification. International Conunission on Illumination, Paris, France, Paper P-67.14, 1967.
12. Calculation and Measurement of Luminance and Illuminance in Road Lighting. International Commission on Illumination, Paris, France, Publ. 30 (TC 4.6), 1975.
13. R.N. Helms. Determining Pavement for Road Lighting Design. FHWA, RD-81/187, March 1982.
Reflectivity Rept. FHWA/
Publication of this paper sponsored by Committee on Visibility.
lVotice: The T;w.;;portatio;; R.esewcli Board doe;; not endorse products or manufacturers. Trade and manufacturers' names appear in this paper because they are considered essential to its object.