
Effect of Variations in Reflectivity-Rainfall ...
25
Effect of Variations in Reflectivity-Rainfall Relationships on Runoff Predictions Chakradhar G. Malakpet, Emad Habib (*), Ehab A. Meselhe Department of Civil Engineering, University of Louisiana at Lafayette, Lafayette, Louisiana (*) [email protected] Ali Tokay Joint Center for Earth Systems and Technology, University of Maryland, Baltimore County, Baltimore, Maryland
Transcript of Effect of Variations in Reflectivity-Rainfall ...
Effect of Variations in Reflectivity-Rainfall Relationships on Runoff Predictions
Chakradhar G. Malakpet, Emad Habib (*), Ehab A. MeselheDepartment of Civil Engineering,
University of Louisiana at Lafayette, Lafayette, Louisiana(*) [email protected]
Ali TokayJoint Center for Earth Systems and Technology,
University of Maryland, Baltimore County, Baltimore, Maryland
Motivation• To use weather radar data in hydrological applications, radar reflectivity (Z)
need to be transformed into surface rainfall estimates (R).
• Estimation of the Z-R relationships is subject to several sources of uncertainties including the storm-to-storm and within the storm variations in raindrop size distributions (DSD).
• Previous studies demonstrated that accounting for temporal/spatial variability in DSD and Z-R relations affect the overall accuracy of rainfall estimates. - (e.g., Uijelenhoet et al. 2003; Lee and Zawadzki 2005)
• Despite the recognized effect of DSD and Z-R variability, less attention has been dedicated to their effect on hydrologic predictions.
• Some early analysis was reported (Winchell et al., 1998) but focused only on total aggregate runoff volumes.
• Most hydrologic modeling studies use a single Z-R relationship.
• It is not well understood how the variability in DSD and Z-R relationships affect the accuracy of the hydrologic predictions.
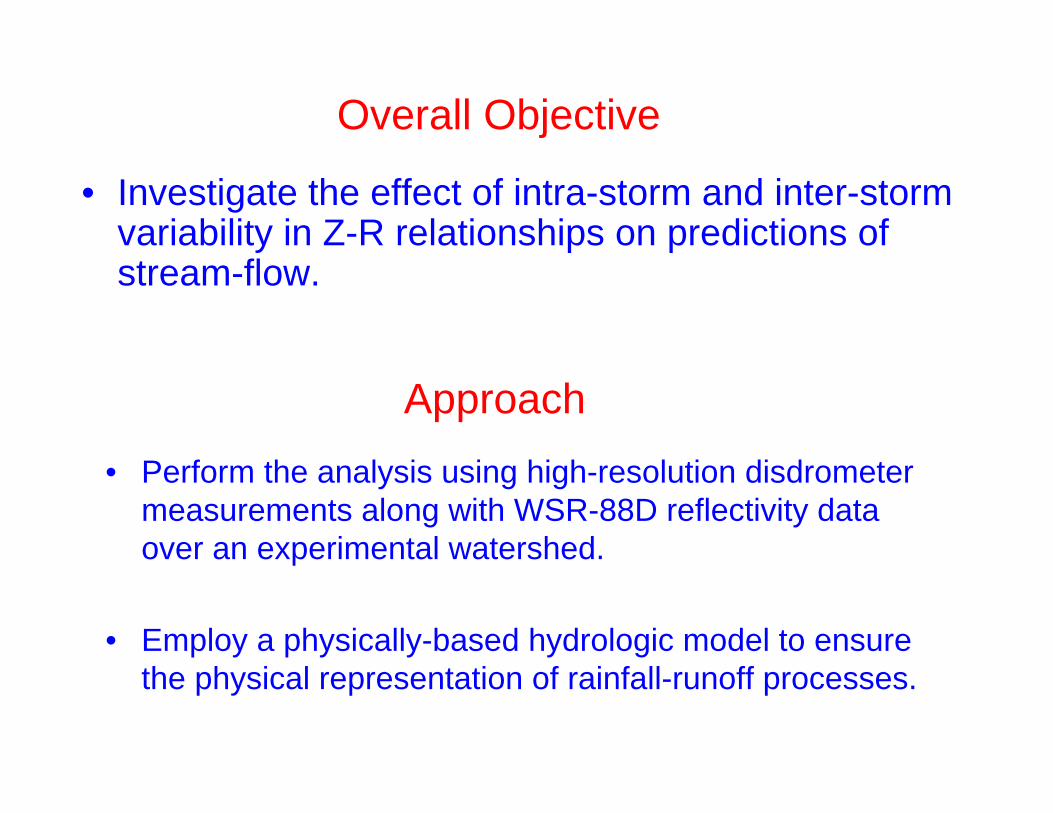
Overall Objective
• Investigate the effect of intra-storm and inter-storm variability in Z-R relationships on predictions of stream-flow.
Approach• Perform the analysis using high-resolution disdrometer
measurements along with WSR-88D reflectivity data over an experimental watershed.
• Employ a physically-based hydrologic model to ensure the physical representation of rainfall-runoff processes.
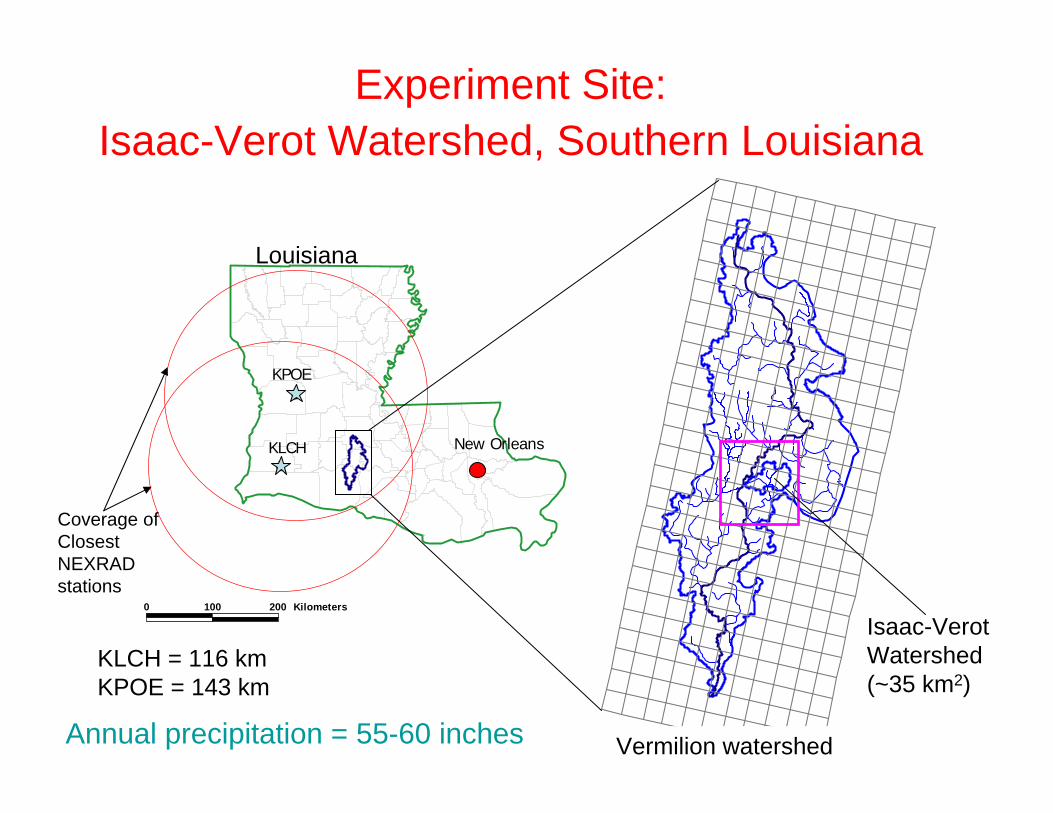
Experiment Site:Isaac-Verot Watershed, Southern Louisiana
ÊÚ
ÊÚ
0 100 200 Kilometers
KPOE
KLCH New Orleans
Louisiana
Vermilion watershed
Isaac-Verot Watershed(~35 km2)
Coverage of Closest NEXRAD stations
KLCH = 116 kmKPOE = 143 km
Annual precipitation = 55-60 inches
Data are been continuously collected since early-20042 Km
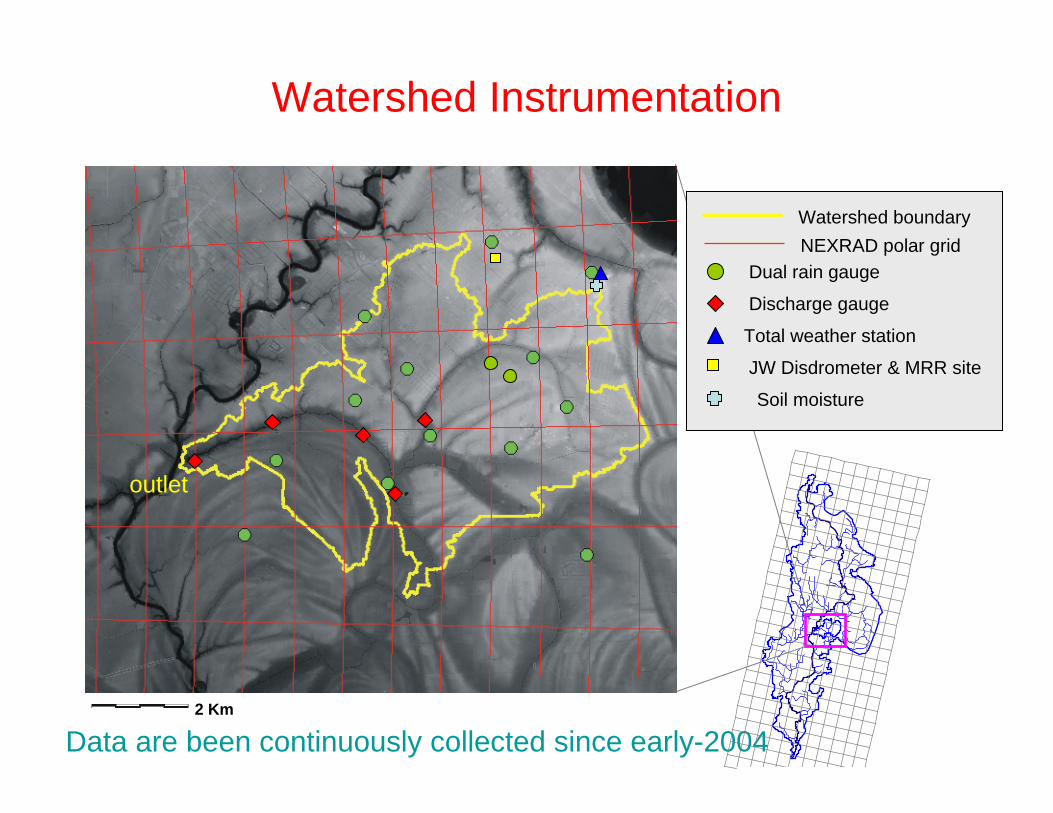
Watershed Instrumentation
Watershed boundaryNEXRAD polar grid
Dual rain gauge
Discharge gauge
Total weather station
JW Disdrometer & MRR site
Soil moisture
outlet
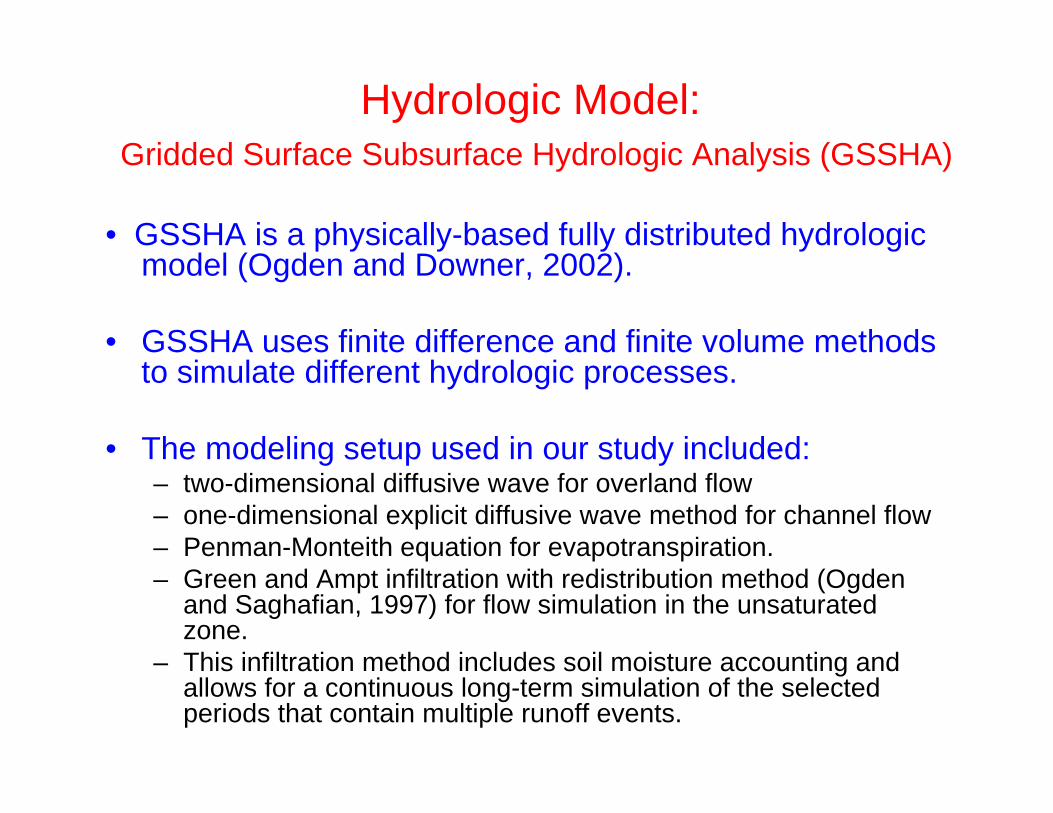
Hydrologic Model: Gridded Surface Subsurface Hydrologic Analysis (GSSHA)
• GSSHA is a physically-based fully distributed hydrologic model (Ogden and Downer, 2002).
• GSSHA uses finite difference and finite volume methods to simulate different hydrologic processes.
• The modeling setup used in our study included: – two-dimensional diffusive wave for overland flow– one-dimensional explicit diffusive wave method for channel flow– Penman-Monteith equation for evapotranspiration. – Green and Ampt infiltration with redistribution method (Ogden
and Saghafian, 1997) for flow simulation in the unsaturated zone.
– This infiltration method includes soil moisture accounting and allows for a continuous long-term simulation of the selected periods that contain multiple runoff events.
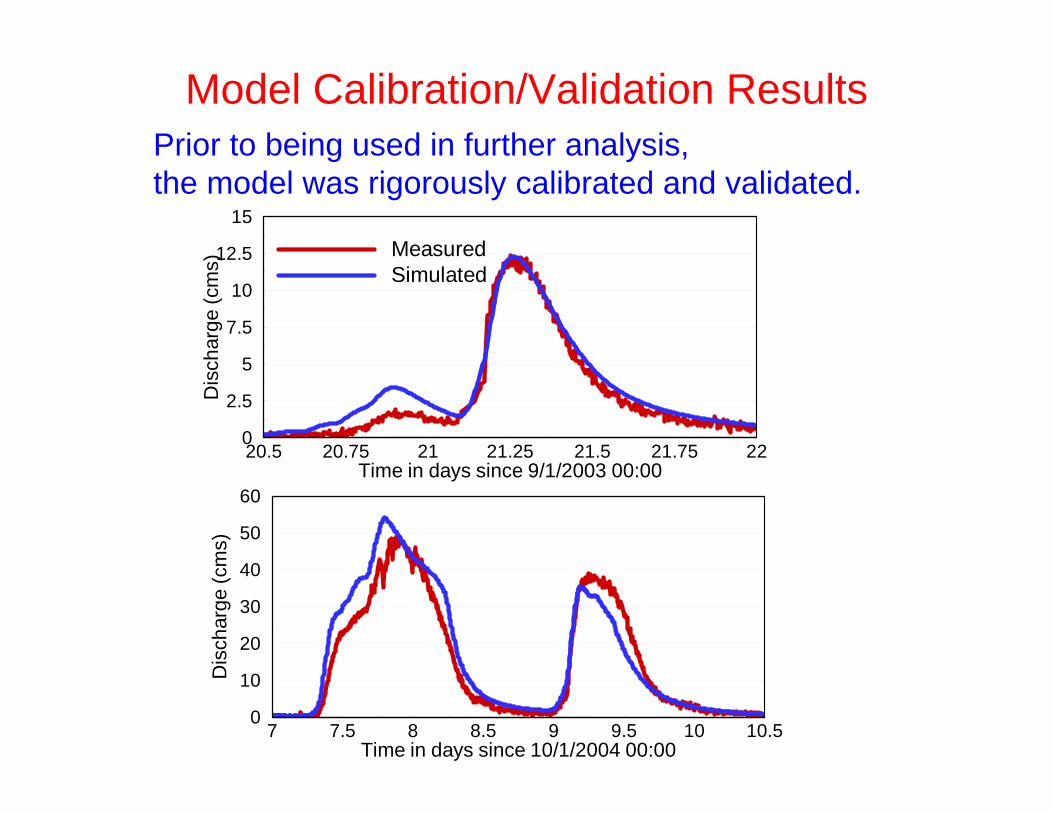
Model Calibration/Validation Results
Time in days since 9/1/2003 00:00
Dis
char
ge(c
ms)
20.5 20.75 21 21.25 21.5 21.75 220
2.5
5
7.5
10
12.5
15
MeasuredSimulated
Time in days since 10/1/2004 00:00
Dis
char
ge(c
ms)
7 7.5 8 8.5 9 9.5 10 10.50
10
20
30
40
50
60
Prior to being used in further analysis, the model was rigorously calibrated and validated.
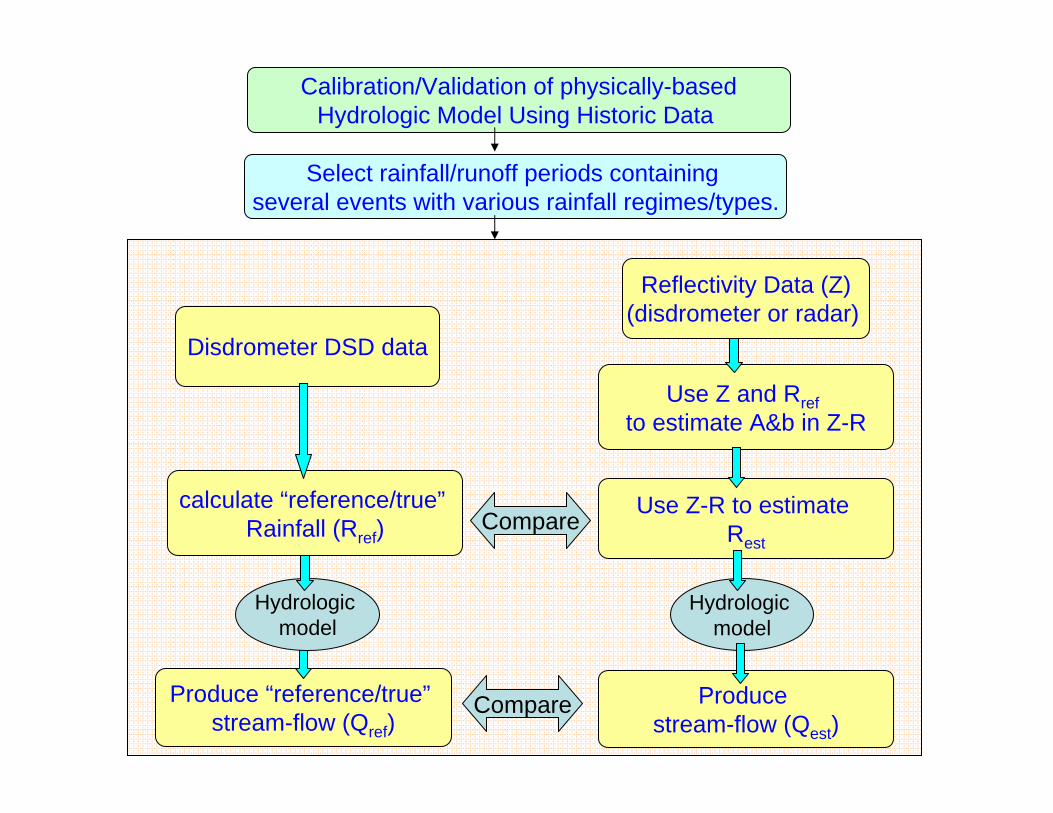
Produce “reference/true”stream-flow (Qref)
Hydrologic model
Use Z and Rrefto estimate A&b in Z-R
Reflectivity Data (Z)(disdrometer or radar)
Compare
Compare
MethodologyCalibration/Validation of physically-basedHydrologic Model Using Historic Data
Select rainfall/runoff periods containing several events with various rainfall regimes/types.
Use Z-R to estimate Rest
Produce stream-flow (Qest)
Hydrologic model
Disdrometer DSD data
calculate “reference/true”Rainfall (Rref)
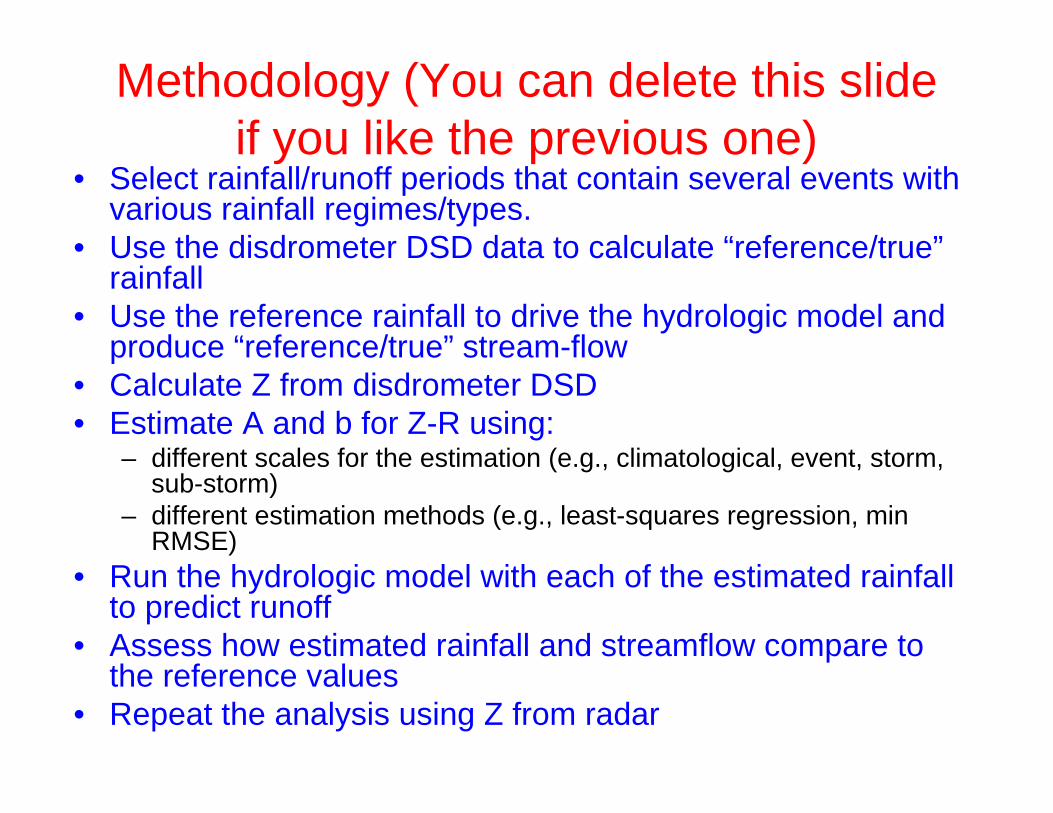
Methodology (You can delete this slide if you like the previous one)
• Select rainfall/runoff periods that contain several events with various rainfall regimes/types.
• Use the disdrometer DSD data to calculate “reference/true”rainfall
• Use the reference rainfall to drive the hydrologic model and produce “reference/true” stream-flow
• Calculate Z from disdrometer DSD• Estimate A and b for Z-R using:
– different scales for the estimation (e.g., climatological, event, storm, sub-storm)
– different estimation methods (e.g., least-squares regression, min RMSE)
• Run the hydrologic model with each of the estimated rainfall to predict runoff
• Assess how estimated rainfall and streamflow compare to the reference values
• Repeat the analysis using Z from radar
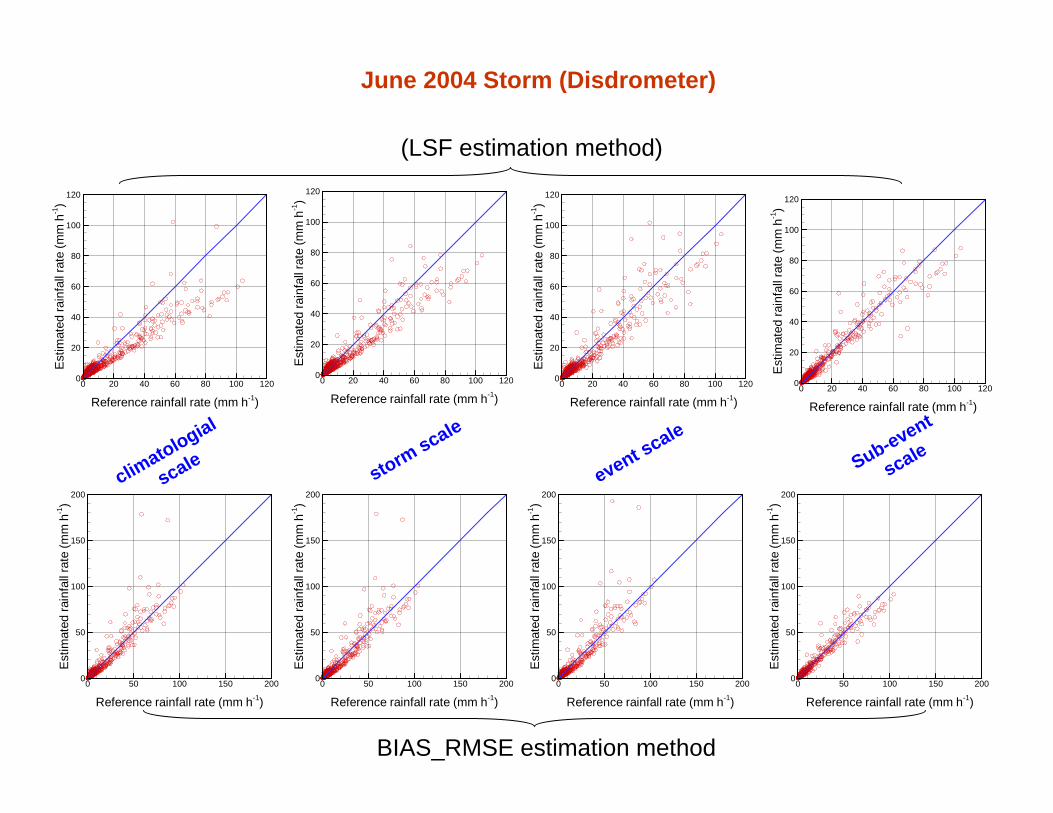
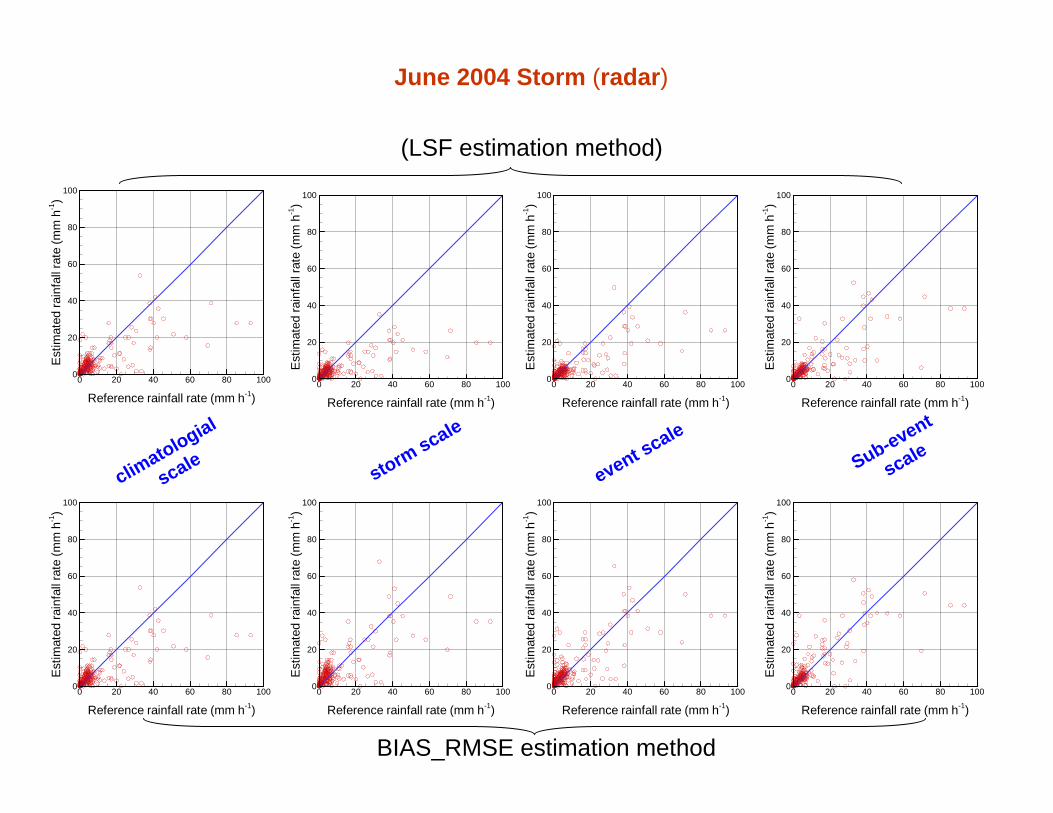
Different Time Scales for Estimating Coefficient and Exponent of Z = A Rb
• Climatological:– Estimate A and b using combined long-term disdrometer
data (e.g., one year).• Storm scale:
– Estimate A and b using Z-R data from each storm.• Event scale:
– Estimate A and b for each event with a storm.• Sub-event scale:
– Split the event into convective/stratiform/transitional periods and estimate A and b for each period.
Different Methods for Estimating Coefficient and Exponent of Z = A Rb
• Least Squares Fit (LSF):– Estimate A and b using linear least squares regression
fitting.• Bias corrected LSF:
– Fix b (e.g., 1.2 or 1.4) and estimate A by removing the overall bias.
• BIAS_RMSE:– Estimate A and b by removing the bias and optimization
for minimum RMSE.• Default:
– Z=300 R1.4; Z=250 R1.2
Selected Storms
• June 22-27, 2004:– included of a sequence of high-intensity and short-duration convective
squall line storms.– A total of ~ 7 inches of rainfall accumulations.
• October 7-10, 2004: – includes Tropical Storm Matthew (10 inches of rain). – Storm Matthew resulted in significant runoff as high as 2.6 m3/sec/km2.
• November 17-27, 2004: – An extensively wet period of scattered and squall line storms.– Five distinct rain storms are observed in this period. – A total of ~ 6 inches of rainfall accumulations. – Runoff generated not very high but had consistent response to rainfall.
Julian day of 2004
Rai
nfal
lAcc
umul
atio
n(m
m)
280 281 282 283 2840
50
100
150
200
250
Julian day of 2004
Rai
nfal
lInt
ensi
ty(m
mh-1
)
280 281 282 283 2840
20
40
60
Julian day of 2004
Ref
lect
ivity
Z(d
bZ)
280 281 282 283 28410
20
30
40
50 RadarDisdrometer
October 2004 Storm (TS Matthew)
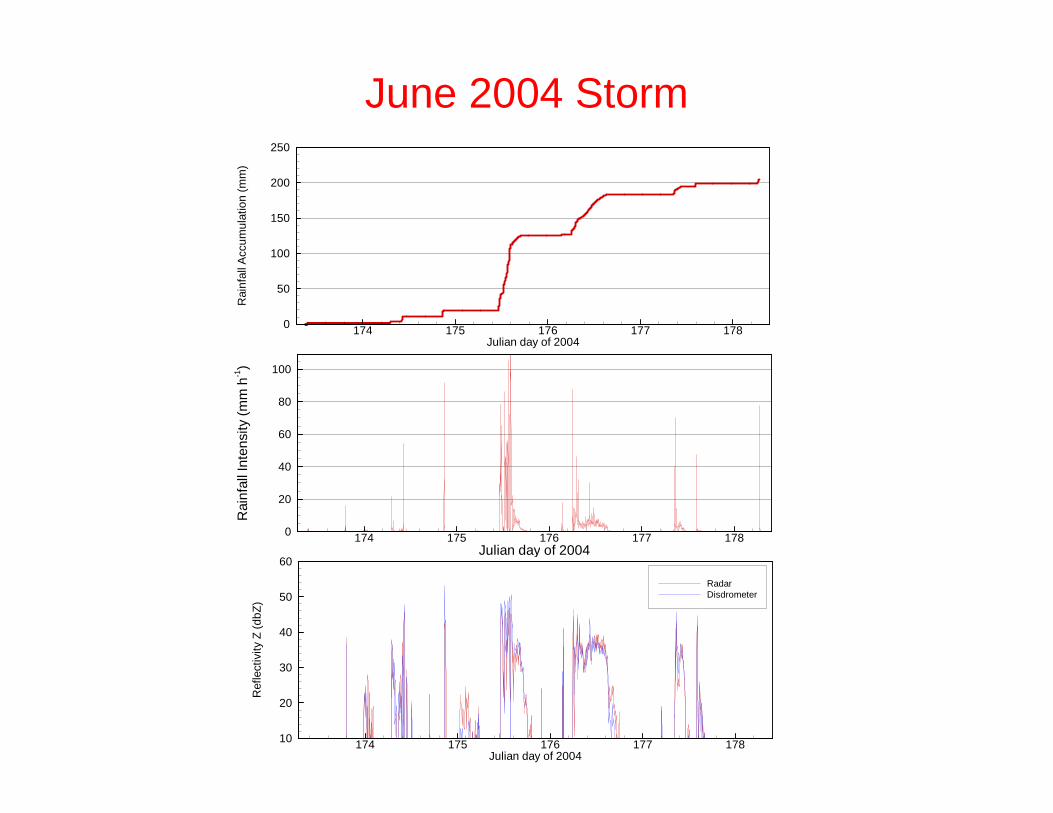
June 2004 Storm
Julian day of 2004
Rai
nfal
lInt
ensi
ty(m
mh-1
)
174 175 176 177 1780
20
40
60
80
100
Julian day of 2004
Ref
lect
ivity
Z(d
bZ)
174 175 176 177 17810
20
30
40
50
60
RadarDisdrometer
Julian day of 2004
Rai
nfal
lAcc
umul
atio
n(m
m)
174 175 176 177 1780
50
100
150
200
250
Radar Reflectivity Z (mm6 m-3)
Rai
nfal
lrat
e(m
mh-1
)
101 102 103 104 10510-1
100
101
102
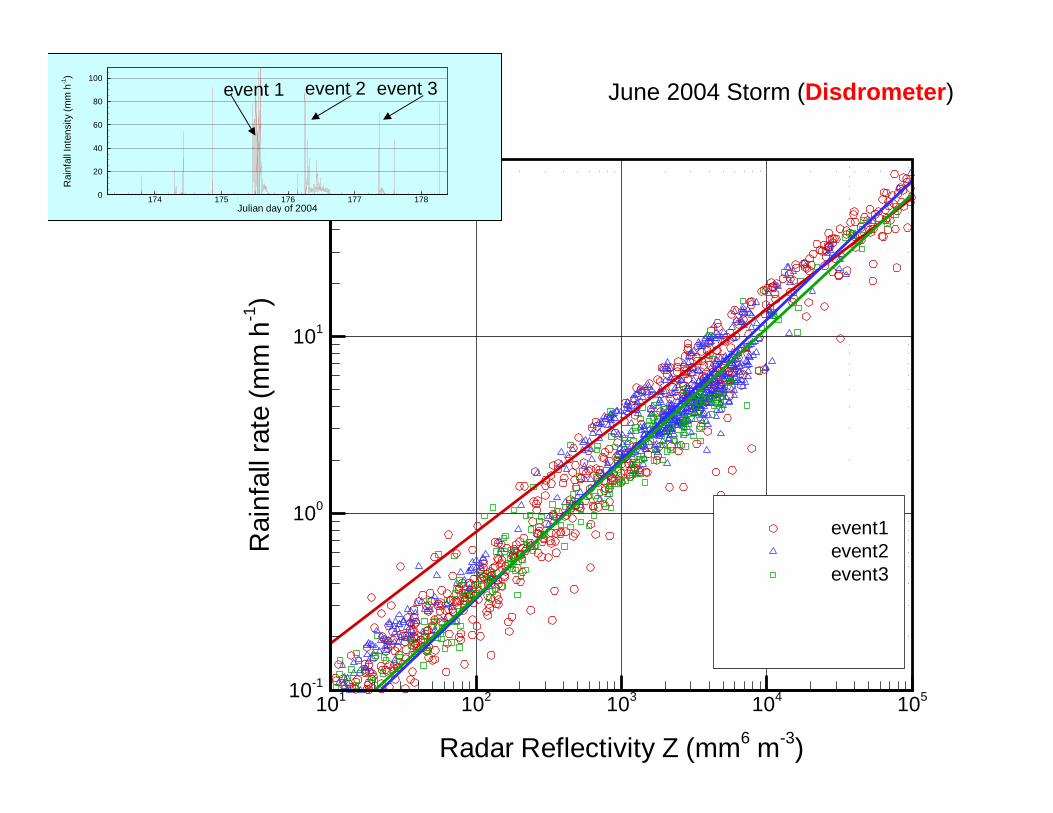
event1event2event3zln1zln2zln3
June 2004 Storm (Disdrometer)
Julian day of 2004
Rai
nfal
lInt
ensi
ty(m
mh-1
)
174 175 176 177 1780
20
40
60
80
100
event 1 event 2 event 3
Radar Reflectivity Z (mm6 m-3)
Rai
nfal
lrat
e(m
mh-1
)
101 102 103 104 10510-1
100
101
102
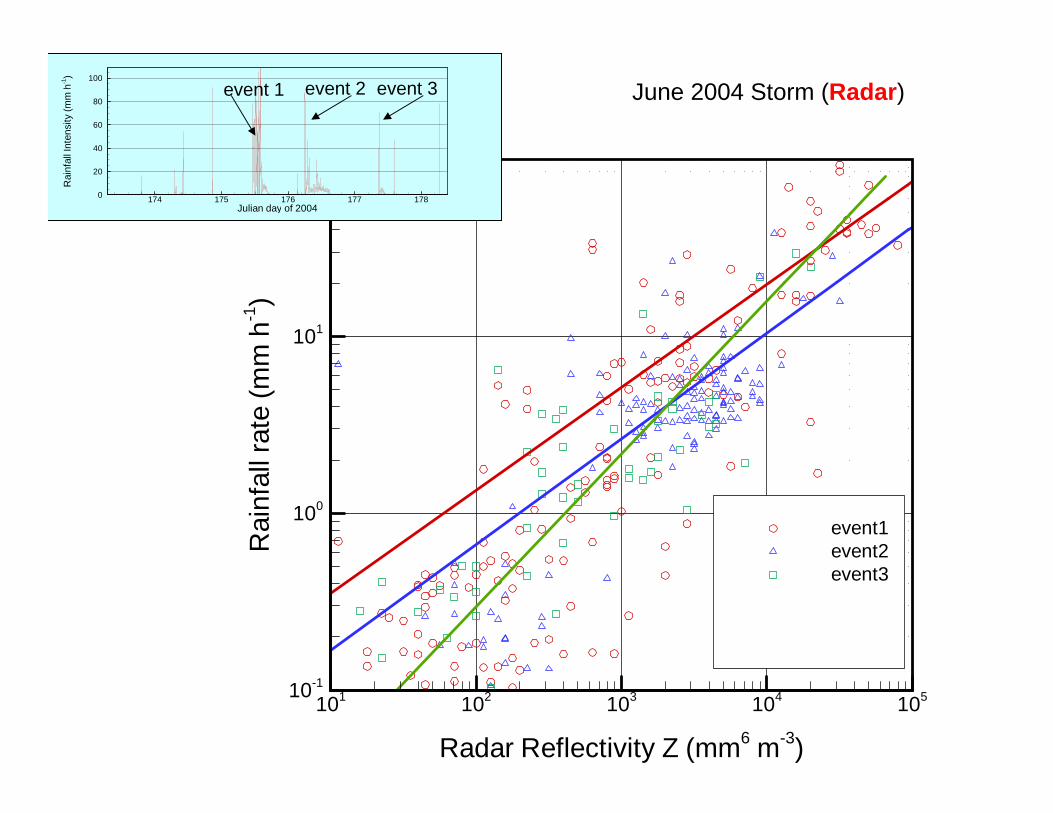
event1event2event3zln1zln2zln3
June 2004 Storm (Radar)
Julian day of 2004
Rai
nfal
lInt
ensi
ty(m
mh-1
)
174 175 176 177 1780
20
40
60
80
100
event 1 event 2 event 3
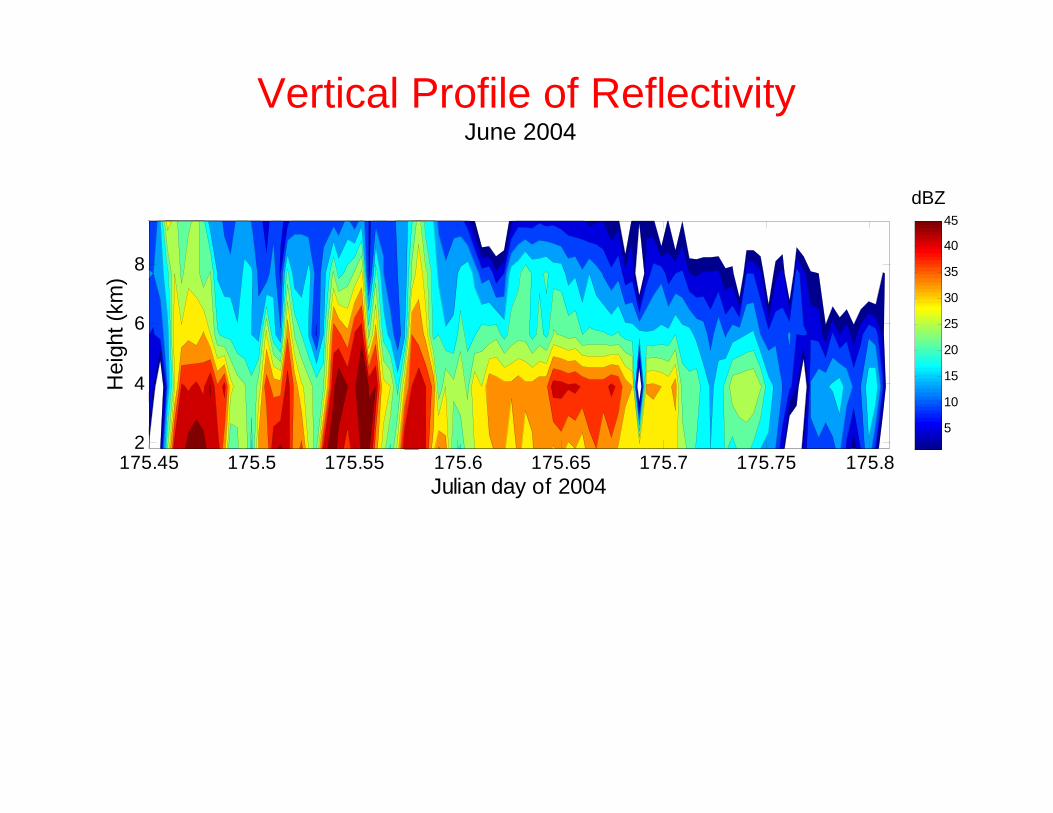
Julian day of 2004
Hei
ght (
km)
175.45 175.5 175.55 175.6 175.65 175.7 175.75 175.82
4
6
8
5
10
15
20
25
30
35
40
45
Vertical Profile of ReflectivityJune 2004
dBZ
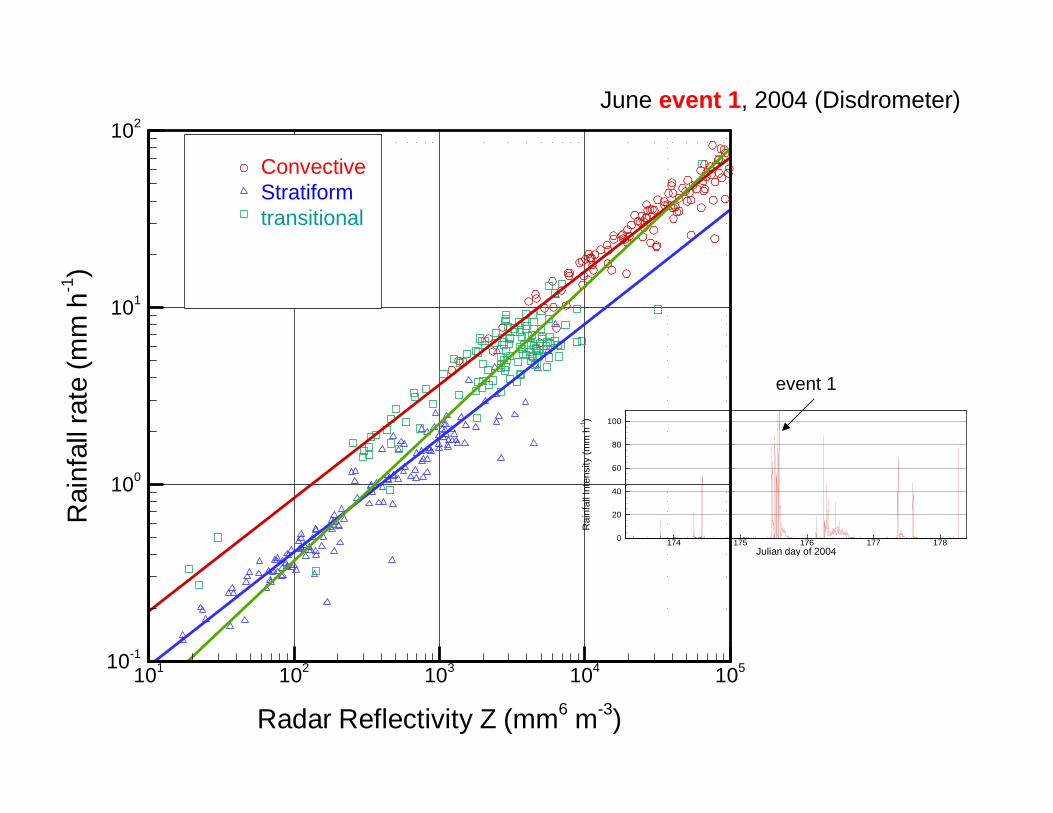
June event 1, 2004 (Disdrometer)
Julian day of 2004
Rai
nfal
lInt
ensi
ty(m
mh-1
)
174 175 176 177 1780
20
40
60
80
100
event 1
Radar Reflectivity Z (mm6 m-3)
Rai
nfal
lrat
e(m
mh-1
)
101 102 103 104 10510-1
100
101
102
convstrtrnsconvftdstrftdtrns
ConvectiveStratiformtransitional
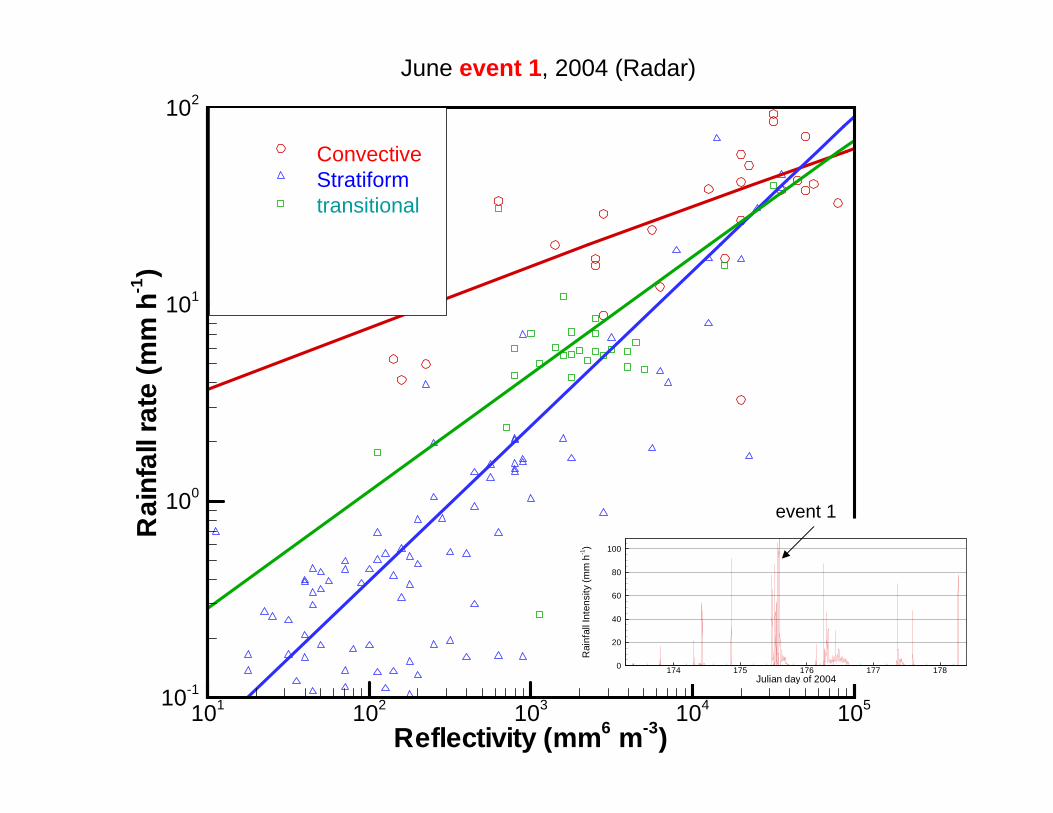
June event 1, 2004 (Radar)
Reflectivity (mm6 m-3)
Rai
nfal
lrat
e(m
mh-1
)
101 102 103 104 10510-1
100
101
102
convecstrfmtrsnlconvlnstrlntrsnln
ConvectiveStratiformtransitional
Julian day of 2004
Rai
nfal
lInt
ensi
ty(m
mh-1
)
174 175 176 177 1780
20
40
60
80
100
event 1
Reference rainfall rate (mm h-1)
Est
imat
edra
infa
llra
te(m
mh-1
)
0 20 40 60 80 100 1200
20
40
60
80
100
120
Reference rainfall rate (mm h-1)
Est
imat
edra
infa
llra
te(m
mh-1
)
0 20 40 60 80 100 1200
20
40
60
80
100
120
Reference rainfall rate (mm h-1)
Est
imat
edra
infa
llra
te(m
mh-1
)
0 20 40 60 80 100 1200
20
40
60
80
100
120
Reference rainfall rate (mm h-1)
Est
imat
edra
infa
llra
te(m
mh-1
)
0 20 40 60 80 100 1200
20
40
60
80
100
120
Reference rainfall rate (mm h-1)
Est
imat
edra
infa
llra
te(m
mh-1
)
0 50 100 150 2000
50
100
150
200
Reference rainfall rate (mm h-1)
Est
imat
edra
infa
llra
te(m
mh-1
)
0 50 100 150 2000
50
100
150
200
Reference rainfall rate (mm h-1)
Est
imat
edra
infa
llra
te(m
mh-1
)
0 50 100 150 2000
50
100
150
200
Reference rainfall rate (mm h-1)
Est
imat
edra
infa
llra
te(m
mh-1
)
0 50 100 150 2000
50
100
150
200
(LSF estimation method)
BIAS_RMSE estimation method
June 2004 Storm (Disdrometer)
event scaleSub-event
scalestorm scale
climatologial
scale
Reference rainfall rate (mm h-1)
Est
imat
edra
infa
llra
te(m
mh-1
)
0 20 40 60 80 1000
20
40
60
80
100
Reference rainfall rate (mm h-1)
Est
imat
edra
infa
llra
te(m
mh-1
)
0 20 40 60 80 1000
20
40
60
80
100
Reference rainfall rate (mm h-1)
Est
imat
edra
infa
llra
te(m
mh-1
)
0 20 40 60 80 1000
20
40
60
80
100
Reference rainfall rate (mm h-1)
Est
imat
edra
infa
llra
te(m
mh-1
)
0 20 40 60 80 1000
20
40
60
80
100
Reference rainfall rate (mm h-1)
Est
imat
edra
infa
llra
te(m
mh-1
)
0 20 40 60 80 1000
20
40
60
80
100
Reference rainfall rate (mm h-1)
Est
imat
edra
infa
llra
te(m
mh-1
)
0 20 40 60 80 1000
20
40
60
80
100
Reference rainfall rate (mm h-1)
Est
imat
edra
infa
llra
te(m
mh-1
)
0 20 40 60 80 1000
20
40
60
80
100
Reference rainfall rate (mm h-1)
Est
imat
edra
infa
llra
te(m
mh-1
)
0 20 40 60 80 1000
20
40
60
80
100
(LSF estimation method)
BIAS_RMSE estimation method
June 2004 Storm (radar)
event scaleSub-event
scalestorm scale
climatologial
scale
Julian day of 2004
Run
off(
m3 /s
ec)
175 176 177 178 1790
10
20
30
40
50ReferenceClimatologicalStormEventPhy Process
Julian day of 2004
Run
off(
m3 /s
ec)
175 176 177 178 1790
10
20
30
40
50ReferenceClimatologicalStormEventPhy Process
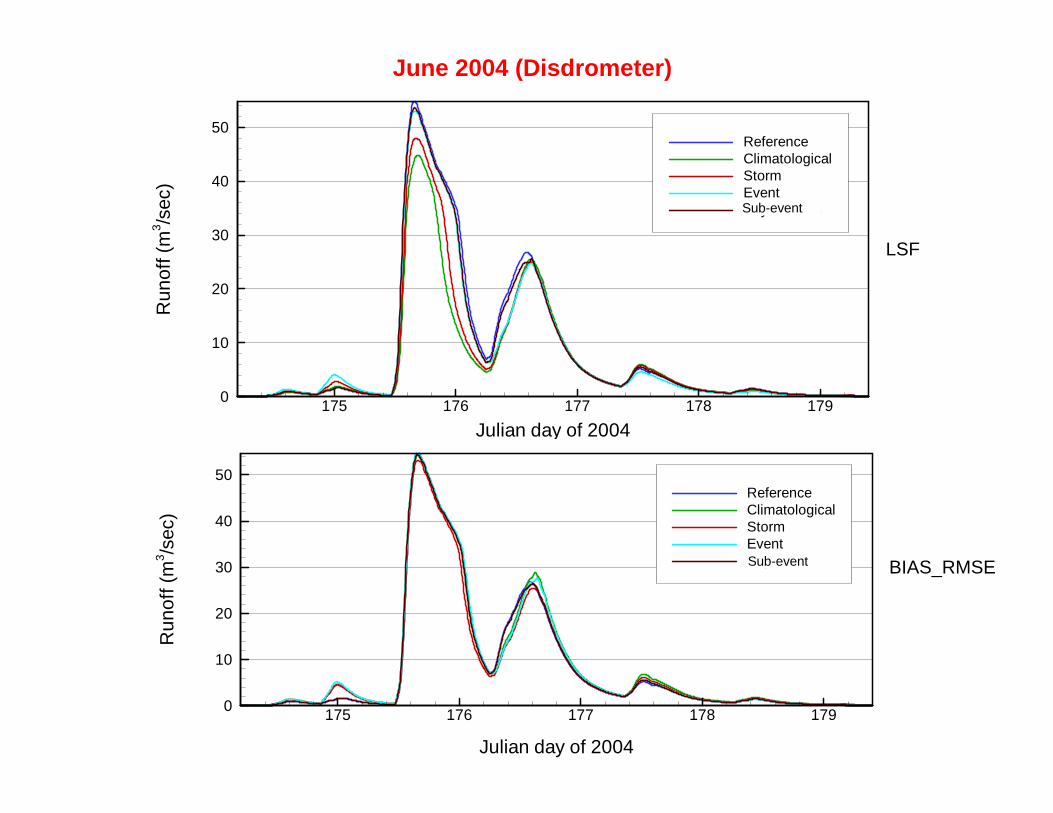
June 2004 (Disdrometer)
LSF
BIAS_RMSE
Sub-event
Sub-event
Julian day of 2004
Run
off(
m3 /s
ec)
175 176 177 1780
10
20
30
40
50 ReferenceDefaultStormEventPhy Process
Julian day of 2004
Run
off(
m3 /s
ec)
175 176 177 1780
10
20
30
40
50 ReferenceDefaultStormEventPhy Process
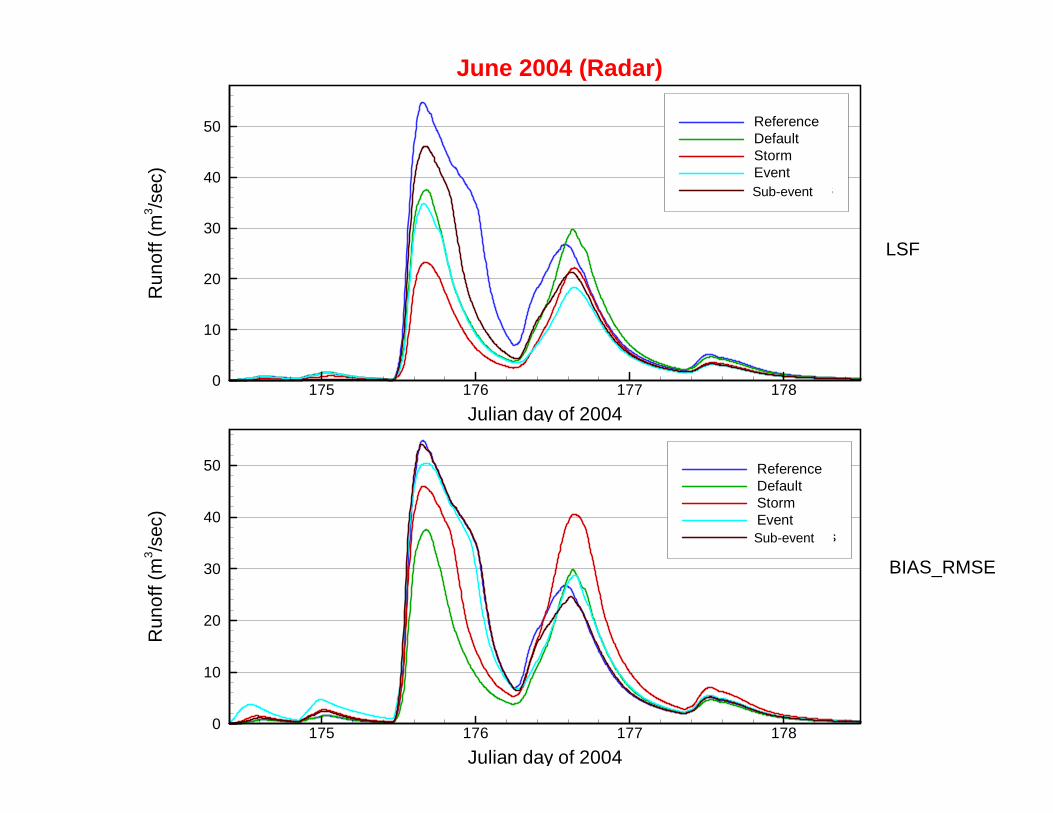
June 2004 (Radar)
LSF
BIAS_RMSE
Sub-event
Sub-event
Conclusions• Z-R parameters show strong dependence on the estimation time
scale and on the method of estimation.
• Use of least-squares fitting resulted in relatively inaccurate rainfall estimates and poor runoff predictions especially when coarse estimation time scales were used (e.g., storm or event).
• The least-squares fitting method gives improved results only when the estimation is performed on a sub-event time scale that accounts for convective/stratiform classification.
• Estimation based on bias removal and minimization of random differences (BIAS_RMSE) shows superior accuracy even when using coarse estimation time scales.
• Estimation time-scales that account for variations in the sub-event rainfall physical processes do not necessarily result in significant improvements in runoff predictions.
• A simple estimation method based only on bias removing and selection of a climatological representative exponent has resulted in acceptable runoff predictions.