METHOD DEVELOPMENT - DiVA portal1147172/FULLTEXT01.pdf · Method development ..... 21 5.1 Test...
52
1 METHOD DEVELOPMENT -FOLLOW LIQUID DISTRIBUTION IN REAL TIME Report number: 2017.24.02 Bachelor thesis – Bachelor of Science in Chemical Engineering Chemical engineering Issa Tammar Ndahimana Joice
Transcript of METHOD DEVELOPMENT - DiVA portal1147172/FULLTEXT01.pdf · Method development ..... 21 5.1 Test...
1
METHOD DEVELOPMENT
-FOLLOW LIQUID DISTRIBUTION IN REAL TIME
Report number: 2017.24.02
Bachelor thesis – Bachelor of Science in Chemical Engineering
Chemical engineering
Issa Tammar
Ndahimana Joice
2
Svensk titel: Metodutveckling för vätskespridning
Engelsk titel: Method development – follow liquid distribution in real time
Utgivningsår: 2017
Författare: Issa Tammar & Ndahimana Joice
Handledare: Falk Torgny
Examinator: Ahlström Peter

3
Abstract
Continuous development and improvement of the modern disposable diaper is crucial for the
optimization of product performance. Several methods are used for evaluation and
improvements to sustain high quality diapers being produced. The aim of this thesis was to
develop a new test method that follows liquid distribution in real time by combining two pre-
existing measurement systems.
Rewet is the amount of liquid that returns to the surface of diapers when subjected to pressure.
Distribution of absorption material is examined by exposing the product core to radiation. These
two measurement systems don’t convey anything about the course of the liquid in the diaper
when tested separately. This method development is meant to be beneficial for research and
development purposes at SCA, working as a complement to the pre-existing methods being
used in the laboratory. The following questions are of interest:
• Can the rewet test method be performed on a baby diaper while simultaneously exposing
the product core to radiation so the course of the liquid can be followed in real time?
• Is the liquid distribution (wet area) affected by different product compositions e.g. SAP or
thickness?
By modifying the current methods, rewet can be performed inside the x-ray equipment while
studying the consistency of absorption material and following the liquid behavior in the product
core. The developed method was verified by testing on handmade products with different
compositions. The developed method’s rewet value has proved to be equivalent to the one tested
outside, showing no significant difference between the two.
Keywords: Absorption, diaper, diffusion, liquid distribution, method development,
permeability, pulp, rewet, SAP, skin health, thickness, wet area, x-ray.

4
Sammanfattning
Kontinuerlig utveckling och förbättring av den moderna blöjan är avgörande för optimering av
produktprestanda. Flera metoder används för utvärdering och förbättring i avsikt att
upprätthålla den höga kvaliteten vid blöjproduktionen. Syftet med detta arbete var att utveckla
en ny testmetod som följer vätskespridning i realtid genom att kombinera två befintliga
mätsystem.
Rewet, återvätning, är den mängd vätska som återvänder till blöjans yta vid tryck. Distribution
av absorptionsmaterial studeras genom att utsätta produktens kärna för strålning. Dessa två
system säger inget om vätskeförloppet i en blöja när de testas separat. Denna metodutveckling
ska vara till nytta för forsknings- och utvecklingsändamål på SCA, för att kunna användas som
ett komplement till befintliga metoder. Följande frågor är av intresse:
• Kan återvätningsmetoden utföras på en barnblöja samtidigt som man utsätter kärnan
för strålning så att man följer vätskeförloppet i realtid?
• Påverkas vätskefördelningen (våt area) av olika produktsammansättningar såsom SAP
eller tjocklek?
Genom att modifiera de nuvarande metoderna kan metoden som mäter återvätning utföras
inuti röntgenutrustning, samtidigt som man undersöker konsistensen av absorptionsmaterialet
och hur vätskan beter sig i produktkärnan. Den utvecklade metoden verifierades genom att
testa handgjorda produkter med olika sammansättning. Den utvecklade metodens rewet värde
är likvärdigt med det som testas utanför röntgenmaskinen, då ingen signifikant skillnad
förekommer mellan dessa två.
Nyckelord: Absorption, blöja, diffusion, hud hälsa, massa, metodutveckling, permeabilitet,
SAP, tjocklek, vätskeförlopp, vätskefördelning, vått område, återvätning.
5
Abbreviaitions
ADL Acquisition and distribution layer
ANOVA Analysis of variance
COO− Carboxylate
COOH Carboxylic Acid
COONa Sodium acetate
CRC Centrifuge retention capacity
FSC Free swell capacity
SAP Superabsorbent polymer
SCA Svenska Cellulosa Aktiebolaget
Dictionary
2nd rewet The second rewet measurement of the mass of liquid
that is absorbed by a filter paper.
Between-group variation The inconsistency in quantities between all groups.
Rewet The mass of liquid that is absorbed by a filter paper.
Tukey method Looks for all differences in pairs of group means at
once assuming equal variances.
Within-group variation The inconsistency in quantities within individual
groups.
6
Acknowledgements
We would like to express our gratitude to our supervisor Torgny Falk and senior scientist expert
in absorption, Charlotta Hanson for all her support, motivation and knowledge. Her guidance
helped us make this project possible.
Many thanks to our examiner, Peter Ahlström, who helped us with this project with his
scientific knowledge.
Thanks to the laboratory support group and senior scientists who provided us with their
expertise.
Special thanks to SCA for founding and making our project possible and our gratitude to all
employees at the baby laboratory.
7
Contents 1. Introduction.......................................................................................................................... 9
1.1 Background .............................................................................................................................. 9
1.1.1 SCA ................................................................................................................................... 9
1.1.2 The modern disposable diaper ........................................................................................ 9
1.2 Purpose .................................................................................................................................. 11
1.3 Aim......................................................................................................................................... 11
1.4 Questions ............................................................................................................................... 11
1.5 Demarcation .......................................................................................................................... 11
2. Methodology ...................................................................................................................... 12
3. The Product ........................................................................................................................ 13
3.1 Product design ....................................................................................................................... 13
3.2 Product Performance ............................................................................................................ 14
3.3 Pulp ........................................................................................................................................ 14
3.4 Superabsorbent polymer (SAP) ............................................................................................. 14
3.5 Free swell capacity (FSC) and centrifuge retention capacity (CRC) ....................................... 16
3.6 Permeability .......................................................................................................................... 16
3.7 Breathability .......................................................................................................................... 17
4. Measurements .................................................................................................................... 19
4.1 Distribution, absorption material, X-ray ............................................................................... 19
4.2 Rewet ..................................................................................................................................... 20
5. Method development ......................................................................................................... 21
5.1 Test products ......................................................................................................................... 21
Table 1: The difference between the test products performance capacity based on permeability. 22
Table 2: Equipment used during testing. .......................................................................................... 22
5.2 Sample preparation ............................................................................................................... 22
5.3 Test liquid and dosage ........................................................................................................... 23
5.4 Data analysis and calculation ................................................................................................ 23
5.5 Equipment setup ................................................................................................................... 24
5.6 Procedure .............................................................................................................................. 25
6. Results ................................................................................................................................ 27
6.1 Pre-study ............................................................................................................................... 27
6.2 Verification of core evenness ................................................................................................ 29
6.3 Measurement system comparison: existing vs developed ................................................... 31
6.4 Liquid distribution ................................................................................................................. 33
8
6.5 Correlation analyses .............................................................................................................. 39
7. Discussion ........................................................................................................................... 42
7.1 Can the rewet test method be performed on a baby diaper while simultaneously exposing
the product core to radiation so the course of the liquid can be followed in real time? ................. 42
7.1.1 Rewet method modifications ........................................................................................ 42
7.1.2 Distribution, absorption material and Rewet ................................................................ 43
7.1.3 Time consumption to perform the method .................................................................. 43
7.1.4 Requirements for test materials ................................................................................... 44
7.1.5 Handmade vs factory produced products ..................................................................... 45
7.2 Is the liquid distribution (wet area) affected by different product compositions e.g. SAP or
thickness? .......................................................................................................................................... 45
7.2.1 Reasons for deviating values/results ............................................................................. 46
7.2.2 Evaluation of methods and data accuracy .................................................................... 47
7.3 Additional improvements ...................................................................................................... 47
8. Conclusion .......................................................................................................................... 49
9. References .......................................................................................................................... 50
9
1. Introduction
1.1 Background
1.1.1 SCA
SCA (Svenska Cellulosa Aktiebolaget) is Europe’s most prominent forest and hygiene products
company (Svenska Cellulosa Aktiebolaget SCA 2016). What started as a forest company has
today developed into three large branches i.e. forest, personal care products and tissue (Svenska
Cellulosa Aktiebolaget SCA 2016). TENA, Tork, Libero and Libresse, to name a few, are some
of SCA’s leading brands sold in over 100 countries. Baby diapers manufactured by SCA go
under brands names such as Libero, Komili bebe and Drypers (Svenska Cellulosa Aktiebolaget
SCA 2016). SCA will be splitting into two companies where the hygiene section will be named
Essity and the forest part remains as SCA.
There has been several years of extensive research behind the modern disposable diaper due to
the high demands from the client and the consumer. In order to sustain a high quality of
products, new methods are constantly being developed for evaluation, but most importantly
improvements. This way of continuous development is because there are several competing
actors in the baby diaper market. This study is required by SCA Hygiene Products because the
baby laboratory needs a new operational test method that helps them understand how the fluid
behaves in a diaper when performing the rewet method.
A basic function for the diaper is to handle the liquid, therefore, the baby laboratory is
constantly working towards further improvements. A thinner product with better absorption
capacity and consequently more effective is a goal. Comfort, hygiene and an efficient utilization
are other qualities that are taken into consideration.
1.1.2 The modern disposable diaper
For leakage security, babies used to be wrapped in cotton-based toweling that were washed and
reused before the first modern diaper was developed, 1936. The efficiency of the modern
disposable diaper has increased by continuous innovation as well as new demands on the
developers. The baby diaper must have certain attributes that meet the target audience’s needs.
In addition to the diaper being able to handle urine and stools, the diaper’s function must solve
more definite problems that has significance to the consumer and customer, e.g. easy handling.
The introduction of SAP (super absorbent polymers) was the breakthrough for development of
thinner and more effective modern products that give better comfort to the baby. With this
groundbreaking material, the liquid is absorbed and distributed more, solving several consumer
10
problems e.g. higher absorption capacity and a drier product. The thinness of the product does
not compromise its absorption performance because of the SAP’s characteristics. Using less
material makes it possible to reduce the environmental impact. The advancement of hygiene
products must also consider the social and economic aspects as well (The absorbent hygiene
products manufactures committee of EDANA 2007-2008).
The modern disposable diaper should offer a good dynamic and static fitting for the baby,
implicating the right size, shape as well as the freedom to move comfortably. The diaper should
be breathable, allowing movement while matching the shape of the body to prevent friction,
e.g. chafing. This benefits the baby’s skin comfort since it is repeatedly exposed to moisture.
The nature of the baby’s skin makes it more prone to irritation when wearing a diaper. The skin
acts as a protective barrier and the baby’s skin is more fragile than an adult since it has not yet
fully developed. Thus, the skin’s contact with moisture needs to be at a minimum to avoid skin
irritation and maintain a healthy skin. With the usage of the modern baby diaper it is possible
to reduce skin irritation (The absorbent hygiene products manufactures committee of EDANA
2007-2008).
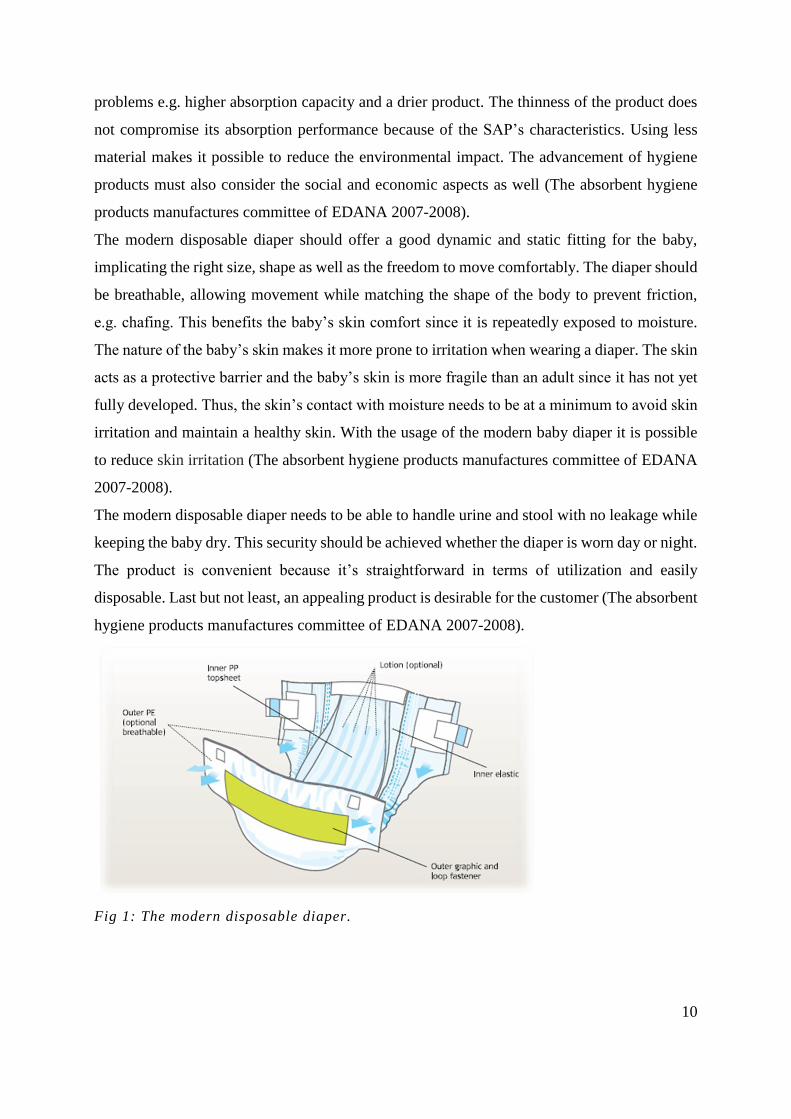
The modern disposable diaper needs to be able to handle urine and stool with no leakage while
keeping the baby dry. This security should be achieved whether the diaper is worn day or night.
The product is convenient because it’s straightforward in terms of utilization and easily
disposable. Last but not least, an appealing product is desirable for the customer (The absorbent
hygiene products manufactures committee of EDANA 2007-2008).
Fig 1: The modern disposable diaper.
11
1.2 Purpose
The existing measurement systems don’t convey anything about the course of the liquid in a
baby diaper. For research and development purposes, an additional method for advanced
analysis or studying new products regarding liquid distribution in real time is beneficial. Thus,
a method development is needed to meet that demand based on two existing test methods. A
wet and dry measurement system that are analyzed separately will be combined, fulfilling the
purpose of following an absorption method with a distribution method in real time.
1.3 Aim
The aim is to design a new test method and equipment for baby laboratory by combining the
two existing measurement systems to serve our purpose. The main goal of this study is to
develop a test method that is reliable and functional for laboratory testing. To perform an
accurate statistical analysis of raw data, the measurement uncertainty must be low. The target
is to see whether a difference is detected in the liquid distribution depending on the product
concept e.g. material composition and position of materials.
1.4 Questions
• Can the rewet test method be performed on a baby diaper while simultaneously exposing
the product core to radiation so the course of the liquid can be followed in real time?
• Is the liquid distribution (wet area) affected by different product compositions e.g. SAP or
thickness?
1.5 Demarcation
This study’s main objective will be to design a new test method to be able to study the wet area.
The laboratory equipment engineers provided us with technical support in modifying the
equipment to implement the stated aim.
12
2. Methodology
This method development combined two pre-existing measurements systems, rewet and
distribution of absorption material. Rewet means a measurement of the liquid that returns to the
surface of the diaper. A consistent distribution of absorption material is studied by exposing the
product core to radiation, the x-ray method. These two combined gives a method that can
examine the liquid distribution in real time using the x-ray equipment. The assignment at hand
required knowledge of the existing test methods to proceed. A literature and database search
was initially performed for understanding of how the methods work separately. This would
offer a better background and comprehension on the area of interest. SCA provided internal and
external material e.g. standard procedures and equipment instructions. Laboratory reports and
preceding thesis were offered for better insight of the problem at hand. Interviews were done
with senior scientists that specializes in absorption, laboratory managers as well as laboratory
engineers at SCA that are experts in the field. Due to the limited timeframe brainstorming with
expert scientists that have done method developments using the same equipment was
advantageous to disregard already tested theories.
With the competence needed for the assignment, a pre-study was performed to test various
designs of the methods. Experiments with different hypotheses were tested for the method
development and once approved, the modification of the methods commenced. The developed
measurement system was later verified by testing on handmade diapers with different qualities.

13
3. The Product
An important stage in method development is to know the composition of the test product, i.e.
the diaper, to know how its properties can affect or be affected by the analysis.
3.1 Product design
Apart from the other materials that are needed to add comfort and help simplify the use, there
are four main functional components in the modern disposable diaper. The diaper consists of 4
layers, a porous topsheet, an acquisition and distribution layer (ADL), an absorbent core and an
impermeable backsheet (The absorbent hygiene products manufactures committee of EDANA
2007-2008).
The topsheet is a porous hydrophilic or hydrophobic layer that is in contact with the infant’s
skin. A hydrophilic layer has an affinity for absorbing water whereas a hydrophobic one lacks
that ability. The topsheet allows for the liquid to pass through to the core of the diaper rapidly,
wicking away moisture, minimizing prolonged skin contact with wetness (Edana 2015). The
facing should be soft so the comfort is obtained for the baby.
After the fluid enters the topsheet it flows into the distribution layer where it is briefly contained
and spread by capillary action. Since it takes a little while for the superabsorbent polymers
(SAP) to absorb the liquid completely, the ADL’s function is required during this phase.
The absorbent core contains a suitable mix of SAP and pulp which absorb and hold the liquid.
The purpose of the backsheet is to prevent leakage by containing the wetness inside, functioning
as an impermeable barrier. It's made of a soft nonwoven cover and polymer based material that
can be breathable and colored (The absorbent hygiene products manufactures committee of
EDANA 2007-2008).
Fig 2: The 4 layers of a modern disposable diaper.
14
3.2 Product Performance
There are different parameters that are of interest when evaluating product performance/quality.
The softness or thickness of the product are important to measure, but one of the significant
areas of testing is absorption. Some of the most common parameters that need to be frequently
verified are the rate of absorbency, the retention capacity and the surface dryness.
The absorption rate is the time it takes a test product to fully absorb liquid. Consequently, faster
absorption rate provides comfort and prevents leakage. The retention capacity determines how
well the product holds the liquid in the core, since a good retention keeps the skin of the baby
dry. It handles larger volumes of liquid and determines the amount of liquid trapped in the SAP.
The surface dryness is a value of the wetness of the material that has skin-contact, as this affects
how long the skin is in contact with moisture (SCA 2017). All three characteristics are mutually
dependent for best performance. A balanced compromise gives comfort and dry skin for the
baby and if not an improvement has to occur.
3.3 Pulp
Pulp, made of cellulose fibers from wood, initially has high absorption capacity per weight and
fast absorption rate. The fibers are structured so there is space between them that work as strong
capillary forces with hydrophilic walls that absorb and transport the liquid through the pulp.
Although pulp has excellent absorption properties and offers a better integrity of the core, it has
its limitations. The absorption capacity of pulp is completely removed when pressure is applied
because the compression lowers the capillary effect (Buchholz & Graham 1998). That’s where
the quality of SAP comes into play and the two complement each other for a better absorption.
3.4 Superabsorbent polymer (SAP)
Superabsorbent polymers (SAPs) are cross-linked networks of flexible polymer chains that can
absorb up to 1000 g of water per gram of SAP and up to about 100 g of dilute salt solution per
gram of SAP. When the SAP comes in contact with water or aqueous solutions they start
swelling, forming a hydrogel. The hydrogel does not perform like a saturated cotton or sponge
and does not release the liquid under pressure (Buchholz & Graham 1998).
SAP absorbs fluid through a process controlled by diffusion, unlike absorbents such as cotton
that absorb fluid by a flow or a convective process. As the liquid is absorbed by the network,
the volume of the particle changes making the chains in the network elongate. Liquid stops
moving into the particle when there is a concentration equilibrium from the inside and outside
15
of the SAP particle. Fick’s law gives a description of the diffusion mechanism relating the
diffusional flow rate to the concentration gradient of the diffusing fluid in the sample (ibid).
𝑓
𝐴= −𝐷
𝑑𝑐
𝑑𝑥
f = the flow rate
x = the direction
A= the cross-sectional area of the sample
D = the diffusion coefficient (proportionality constant)
c = concentration
Diffusion is the random, non-organized movement of molecules that depends on their thermal
energy. The rate of the process is affected by the salt in the solution and affects the capacity of
the SAP. The long polymer chains have a large amount of ionic carboxylate functional groups
(COO−, COONa, COOH) with an ability to bind to water. The osmotic pressure makes the
molecules, i.e. liquid, move into the SAP’s membrane and stick to the ions preventing the liquid
from going back. The liquid absorbed by the SAP dilutes the carboxylic groups and the sodium
ions releasing the tension. This process is slow since the polymers are crosslinked and must
move cooperatively, compared to if they were moving separately (ibid).
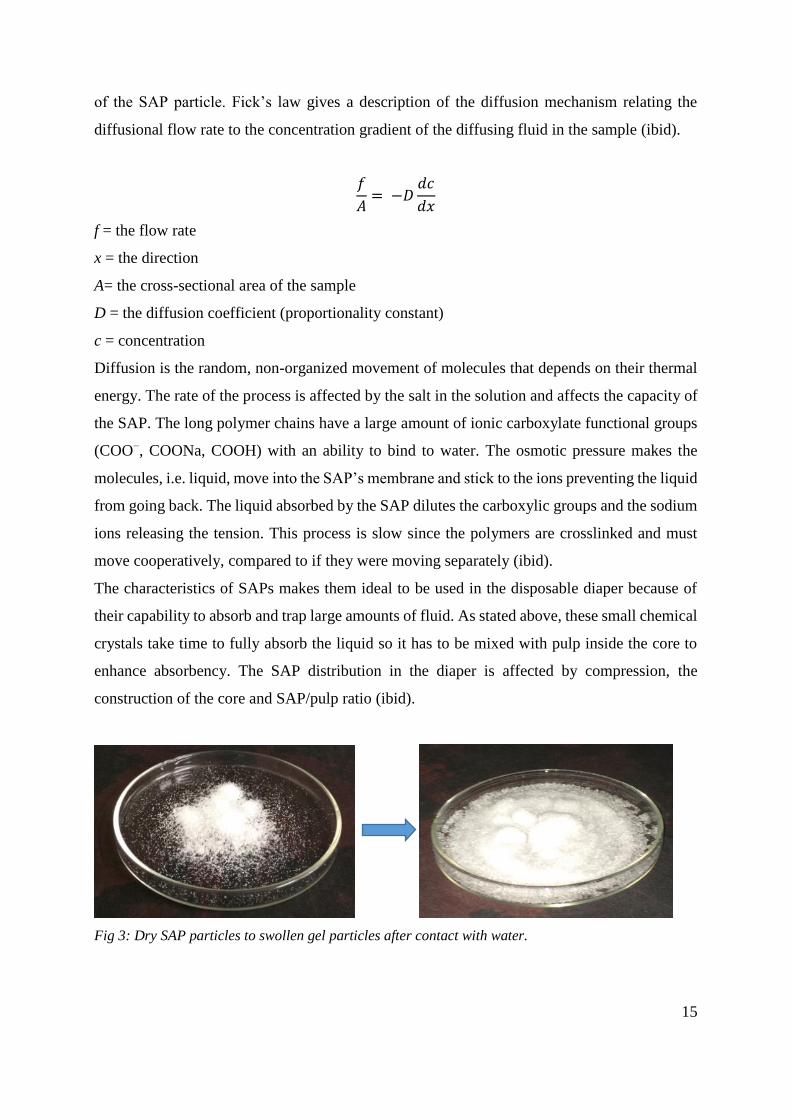
The characteristics of SAPs makes them ideal to be used in the disposable diaper because of
their capability to absorb and trap large amounts of fluid. As stated above, these small chemical
crystals take time to fully absorb the liquid so it has to be mixed with pulp inside the core to
enhance absorbency. The SAP distribution in the diaper is affected by compression, the
construction of the core and SAP/pulp ratio (ibid).
Fig 3: Dry SAP particles to swollen gel particles after contact with water.

16
3.5 Free swell capacity (FSC) and centrifuge retention capacity (CRC)
In order for a diaper to have a good performance the SAP amount is crucial to prevent wetness
and leakage. There are evaluation methods meant to determine the free swelling capacity (FSC)
and the centrifuge retention capacity (CRC) for super absorbents. In an absorption concept,
these variables give insight on how the material can be expected to perform. The properties of
the SAP influences how the product is perceived by the client (INDA, 2015).
Free swell capacity (FSC) is a measure that describes to which extent the SAP can absorb when
soaked for a defined period. A bag with a fixed amount of SAPs is allowed to absorb liquid
freely in a bath for a certain time. The amount of fluid absorbed is determined by weighing the
sample after being removed from the bath. Centrifuge retention capacity (CRC) is used to
determine the amount of liquid that is trapped within the SAP, following centrifugation of a test
product. After being soaked, the sample is centrifuged and weighed to calculate how much
liquid the sample has retained (ibid).
3.6 Permeability
The rate of absorption is critical in modern disposable diapers since this keeps the skin of the
baby dry. The disposable diaper’s capacity for transmitting liquid is expressed as permeability.
This is a measure of the flow rate at which liquid passes through absorbent materials. The
permeability depends on fluid viscosity, pressure, expansion porosity, thickness, particle size
and distribution. Darcy’s law explains the relationship of the main features that affect the flow
through a porous medium in general (Buchholz & Graham 1998).
𝑑𝑉
𝑑𝑡= −
𝐾𝐷𝐴∆𝑃
µ𝐿
𝑑𝑉
𝑑𝑡= the volumetric flow rate also known as q.
KD = the specific permeability of the sample
A = the cross-sectional area of the sample where the discharge occurs.
∆P = the pressure difference driving the flow process.
µ = the viscosity of the fluid
L = the length of the sample
The transportation of the fluid to the dry sample is dependent on many different features. In
absorbing materials, capillary pressure is very significant since it “pulls” the liquid into the dry
sample instantly. The absorbent material’s wicking process is due to capillary pressure for the
initial transportation of the fluid into the the open spaces. Other factors that act on the liquid

17
are gravity and hydrostatic pressure. Hydrostatic pressure differs from capillary pressure by
“pushing” the fluid into the pore (Buchholz & Graham 1998).
The difference of forces between two liquids across the surface of an absorbing material is what
defines capillary pressure. The forces in the process depend on which of the fluids’ surface
tension is stronger since this affects the wettability. Wettability per definition is the liquid of
preference a solid surface attracts, where the solid surface enables the liquid to spread. When
the liquid spreads on the surface, it’s surface tension has been reduced. However, when the
liquid’s surface tension is strong, it becomes droplets preventing the liquid from wetting the
solid surface (ibid).
θ
θ
Poor wettability Good wettability
Fig 4: Wettability: liquid in contact with solid surface showing its contact angle, θ.
𝑝𝑐 =2𝛾𝑐𝑜𝑠𝜃
𝑟
pc = the capillary pressure
γ = surface tension
θ = contact angle of the liquid on the surface of the capillary
r = effective radius
The efficiency of the capillary force depends on the pore size of the surface since smaller pores
holds larger volumes of liquid. The pore with a larger radius will have less pressure regardless
of the surface tension optimizing the capillary networks wicking capacity (ibid)
3.7 Breathability
Disposable diapers were not initially developed to provide comfort for the baby, it was mainly
to ease and simplify diaper usage. Even though the disposable diaper offered convenience,
babies were experiencing skin irritation due to the dampness and warmth. After years of
research and development more breathable products are available and this has improved skin
health. Since the baby wears the diaper for a prolonged amount of time, an upgraded backsheet
made of breathable plastic film or non-woven laminate has allowed skin respiration. Studies
have shown that wearing a breathable diaper significantly decreases skin irritants such as diaper
dermatitis and growth of Candida albicans (Atkin et. al. 2001).

18
Breathability can be measured by the air’s flowrate at a given area of material and at a given
pressure over a period of time. A breathable topsheet has micropores that cause water vapor to
pass through without compromising the diaper’s ability to contain the droplets (SCA 2017).
Rewet and breathability go hand in hand for a healthy skin without skin irritation that comes
from dampness. Allowing air to go through the fabric keeps the climate inside the diaper cool,
therefore a breathable disposable diaper is preferable.
19
4. Measurements
A product is developed according to the requirements of the consumer/customer and its function
has to be evaluated to make sure the attributes are achieved. In order to test the diaper’s
attributes and constraints, its performance can be verified in laboratory environment where
simulations are made through various test methods. There are wet and dry test methods that
measures the product’s performance. The methods mentioned below are some of the
measurement systems that evaluate the baby diaper.
4.1 Distribution, absorption material, X-ray
The x-ray equipment is used to examine the consistency of absorption material distribution in
the product core. During sample preparation, all unnecessary material is removed to make sure
the product core is fully visible. The width of the core is measured and a center line is drawn
from the front of the product to the back. The center line of the product is to be matched to the
frame’s midpoint. Unnecessary tampering of the product to be tested is avoided since this can
affect the absorbing material´s distribution (SCA 2017).
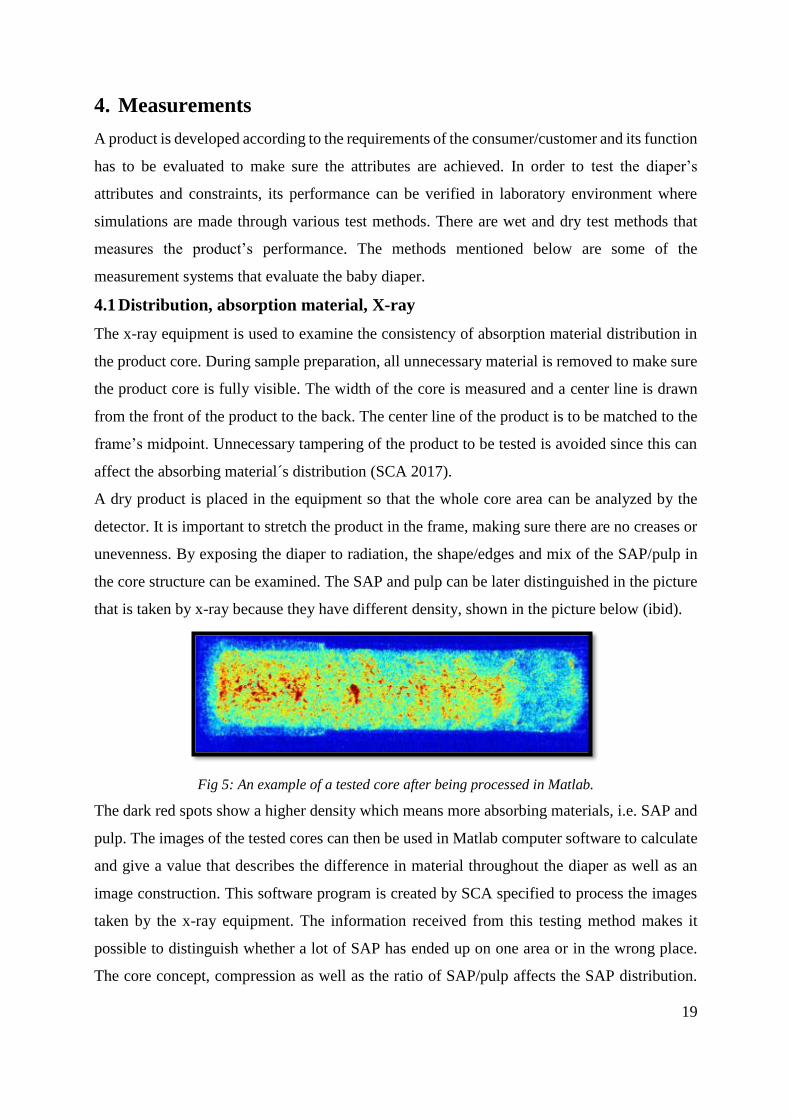
A dry product is placed in the equipment so that the whole core area can be analyzed by the
detector. It is important to stretch the product in the frame, making sure there are no creases or
unevenness. By exposing the diaper to radiation, the shape/edges and mix of the SAP/pulp in
the core structure can be examined. The SAP and pulp can be later distinguished in the picture
that is taken by x-ray because they have different density, shown in the picture below (ibid).
Fig 5: An example of a tested core after being processed in Matlab.
The dark red spots show a higher density which means more absorbing materials, i.e. SAP and
pulp. The images of the tested cores can then be used in Matlab computer software to calculate
and give a value that describes the difference in material throughout the diaper as well as an
image construction. This software program is created by SCA specified to process the images
taken by the x-ray equipment. The information received from this testing method makes it
possible to distinguish whether a lot of SAP has ended up on one area or in the wrong place.
The core concept, compression as well as the ratio of SAP/pulp affects the SAP distribution.
20
Having weak points in the core area can cause for example leakage since they affect liquid
distribution. To achieve a product with good absorption capacity, an even distribution of
absorbent materials is desired. This also prevents hard areas in the diaper and gives a soft
product that doesn’t cause irritation on baby’s skin. There is no radiation when the x-ray cabinet
door is open and none is accumulated in the tested products so it’s safe to perform the method
(ibid).
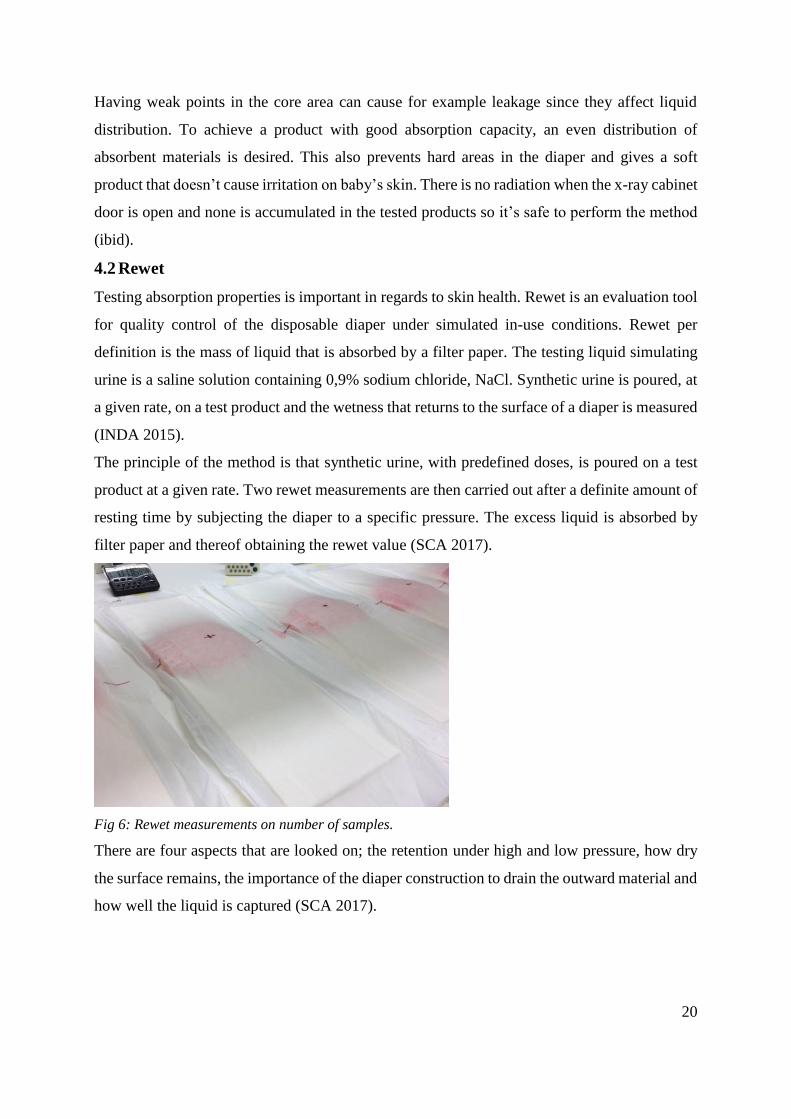
4.2 Rewet
Testing absorption properties is important in regards to skin health. Rewet is an evaluation tool
for quality control of the disposable diaper under simulated in-use conditions. Rewet per
definition is the mass of liquid that is absorbed by a filter paper. The testing liquid simulating
urine is a saline solution containing 0,9% sodium chloride, NaCl. Synthetic urine is poured, at
a given rate, on a test product and the wetness that returns to the surface of a diaper is measured
(INDA 2015).
The principle of the method is that synthetic urine, with predefined doses, is poured on a test
product at a given rate. Two rewet measurements are then carried out after a definite amount of
resting time by subjecting the diaper to a specific pressure. The excess liquid is absorbed by
filter paper and thereof obtaining the rewet value (SCA 2017).
Fig 6: Rewet measurements on number of samples.
There are four aspects that are looked on; the retention under high and low pressure, how dry
the surface remains, the importance of the diaper construction to drain the outward material and
how well the liquid is captured (SCA 2017).
21
5. Method development
The given purpose is to develop a method that is to be able to analyze the course of the liquid
in the baby diaper. There are a few variables that are required to take into consideration to make
this method viable. Several experimental conditions have been measured to create a good, as
well as operational analysis of the product. An understanding of the composition and properties
of the baby diaper to be studied is essential for a well-thought-out method procedure. For the
end results to be reliable, the diaper’s properties have been taken into consideration. The method
has been developed accordingly so that the diaper properties that can be affected or affect the
process during the analysis are controlled. The different variants were tested by two operators
on both methods to minimize operator dependency.
5.1 Test products
The product cores used during the pre-study were from unopened diaper packages that have
been produced in the factory. For the method development, three types of product cores with
different qualities were tested in the modified equipment. These product cores were handmade,
having all 4 layers, without additional materials such as waist elastics, standing gather and leg
elastics.
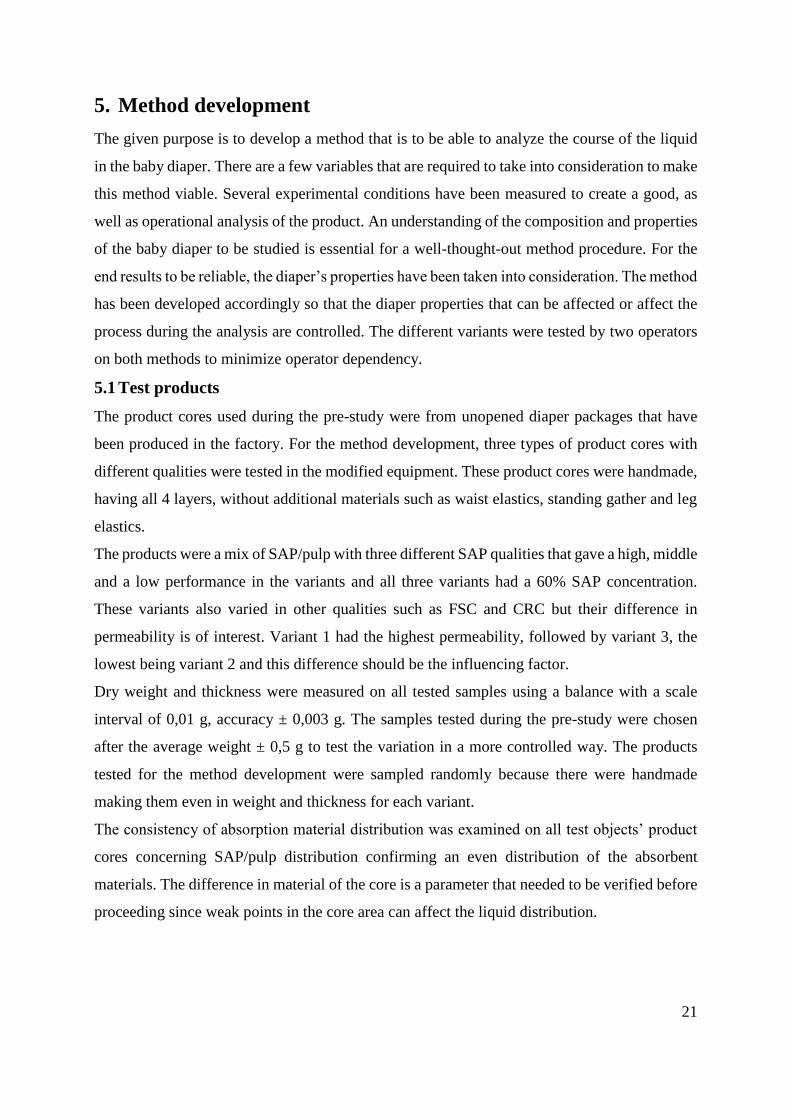
The products were a mix of SAP/pulp with three different SAP qualities that gave a high, middle
and a low performance in the variants and all three variants had a 60% SAP concentration.
These variants also varied in other qualities such as FSC and CRC but their difference in
permeability is of interest. Variant 1 had the highest permeability, followed by variant 3, the
lowest being variant 2 and this difference should be the influencing factor.
Dry weight and thickness were measured on all tested samples using a balance with a scale
interval of 0,01 g, accuracy ± 0,003 g. The samples tested during the pre-study were chosen
after the average weight ± 0,5 g to test the variation in a more controlled way. The products
tested for the method development were sampled randomly because there were handmade
making them even in weight and thickness for each variant.
The consistency of absorption material distribution was examined on all test objects’ product
cores concerning SAP/pulp distribution confirming an even distribution of the absorbent
materials. The difference in material of the core is a parameter that needed to be verified before
proceeding since weak points in the core area can affect the liquid distribution.
22
Sample description
High Variant 1
Middle Variant 2
Low Variant 3
Table 1: The difference between the test products performance capacity based on permeability.
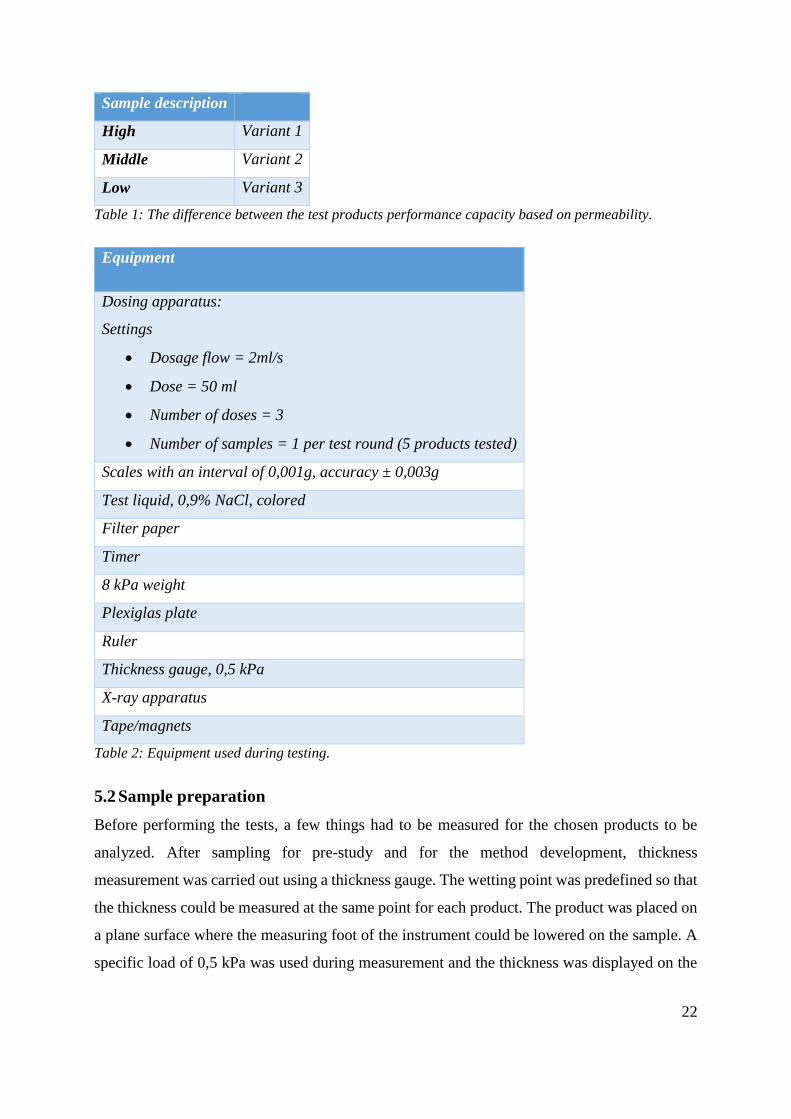
Equipment
Dosing apparatus:
Settings
• Dosage flow = 2ml/s
• Dose = 50 ml
• Number of doses = 3
• Number of samples = 1 per test round (5 products tested)
Scales with an interval of 0,001g, accuracy ± 0,003g
Test liquid, 0,9% NaCl, colored
Filter paper
Timer
8 kPa weight
Plexiglas plate
Ruler
Thickness gauge, 0,5 kPa
X-ray apparatus
Tape/magnets
Table 2: Equipment used during testing.
5.2 Sample preparation
Before performing the tests, a few things had to be measured for the chosen products to be
analyzed. After sampling for pre-study and for the method development, thickness
measurement was carried out using a thickness gauge. The wetting point was predefined so that
the thickness could be measured at the same point for each product. The product was placed on
a plane surface where the measuring foot of the instrument could be lowered on the sample. A
specific load of 0,5 kPa was used during measurement and the thickness was displayed on the
23
instrument. Unnecessary handling of the products was avoided to not tamper with the end
results.
5.3 Test liquid and dosage
The test liquid used on all tested samples is colored 0,9% NaCl that works as synthetic urine.
The flowrate used was 2 ml/sec and the amount per dosage was 50 ml. The distance between
the diaper and the dosing tube was 36 ±0,5 mm.
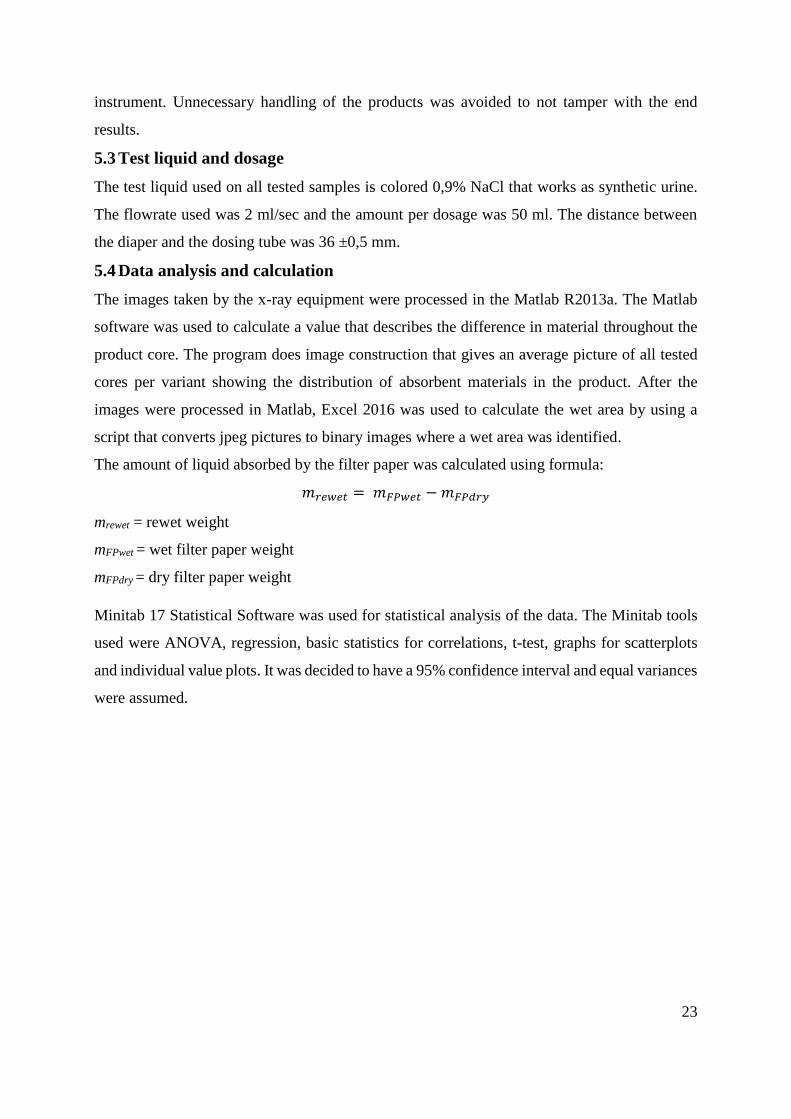
5.4 Data analysis and calculation
The images taken by the x-ray equipment were processed in the Matlab R2013a. The Matlab
software was used to calculate a value that describes the difference in material throughout the
product core. The program does image construction that gives an average picture of all tested
cores per variant showing the distribution of absorbent materials in the product. After the
images were processed in Matlab, Excel 2016 was used to calculate the wet area by using a
script that converts jpeg pictures to binary images where a wet area was identified.
The amount of liquid absorbed by the filter paper was calculated using formula:
𝑚𝑟𝑒𝑤𝑒𝑡 = 𝑚𝐹𝑃𝑤𝑒𝑡 − 𝑚𝐹𝑃𝑑𝑟𝑦
mrewet = rewet weight
mFPwet = wet filter paper weight
mFPdry = dry filter paper weight
Minitab 17 Statistical Software was used for statistical analysis of the data. The Minitab tools
used were ANOVA, regression, basic statistics for correlations, t-test, graphs for scatterplots
and individual value plots. It was decided to have a 95% confidence interval and equal variances
were assumed.
24
5.5 Equipment setup
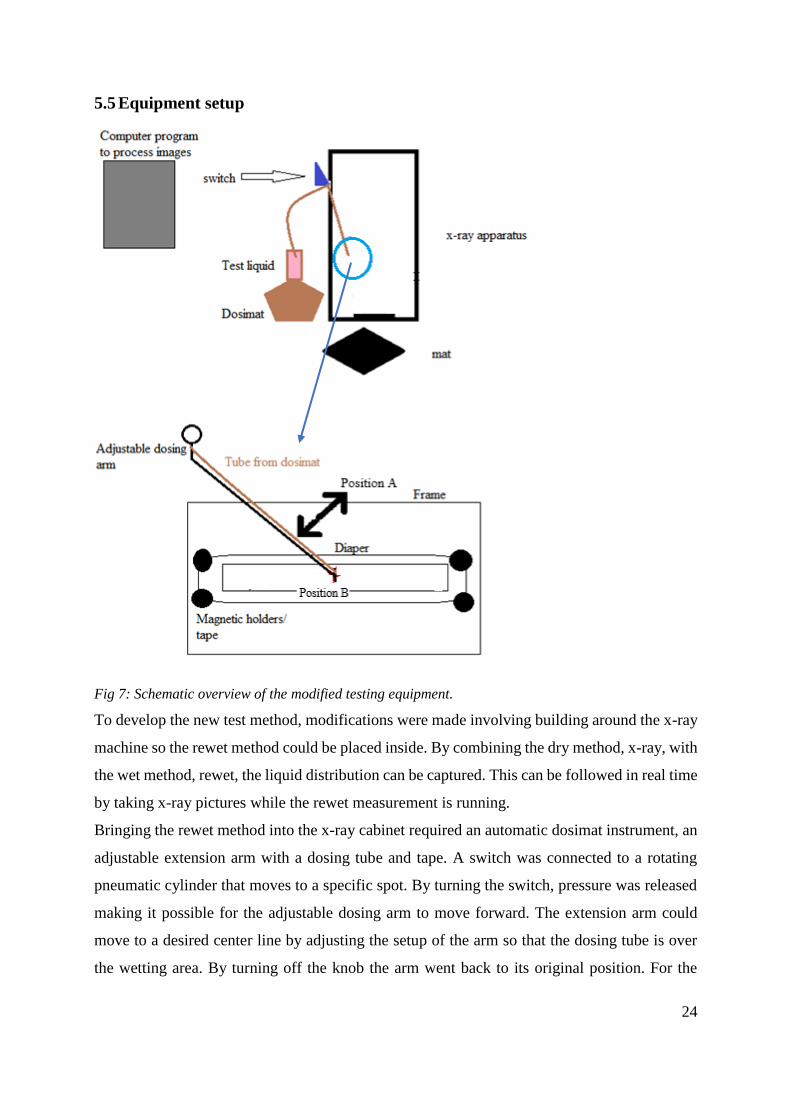
Fig 7: Schematic overview of the modified testing equipment.
To develop the new test method, modifications were made involving building around the x-ray
machine so the rewet method could be placed inside. By combining the dry method, x-ray, with
the wet method, rewet, the liquid distribution can be captured. This can be followed in real time
by taking x-ray pictures while the rewet measurement is running.
Bringing the rewet method into the x-ray cabinet required an automatic dosimat instrument, an
adjustable extension arm with a dosing tube and tape. A switch was connected to a rotating
pneumatic cylinder that moves to a specific spot. By turning the switch, pressure was released
making it possible for the adjustable dosing arm to move forward. The extension arm could
move to a desired center line by adjusting the setup of the arm so that the dosing tube is over
the wetting area. By turning off the knob the arm went back to its original position. For the
25
method itself filter paper, timer, a specific weight and Plexiglas plate were used. These
modifications were constructed with the help of the laboratory equipment engineers.
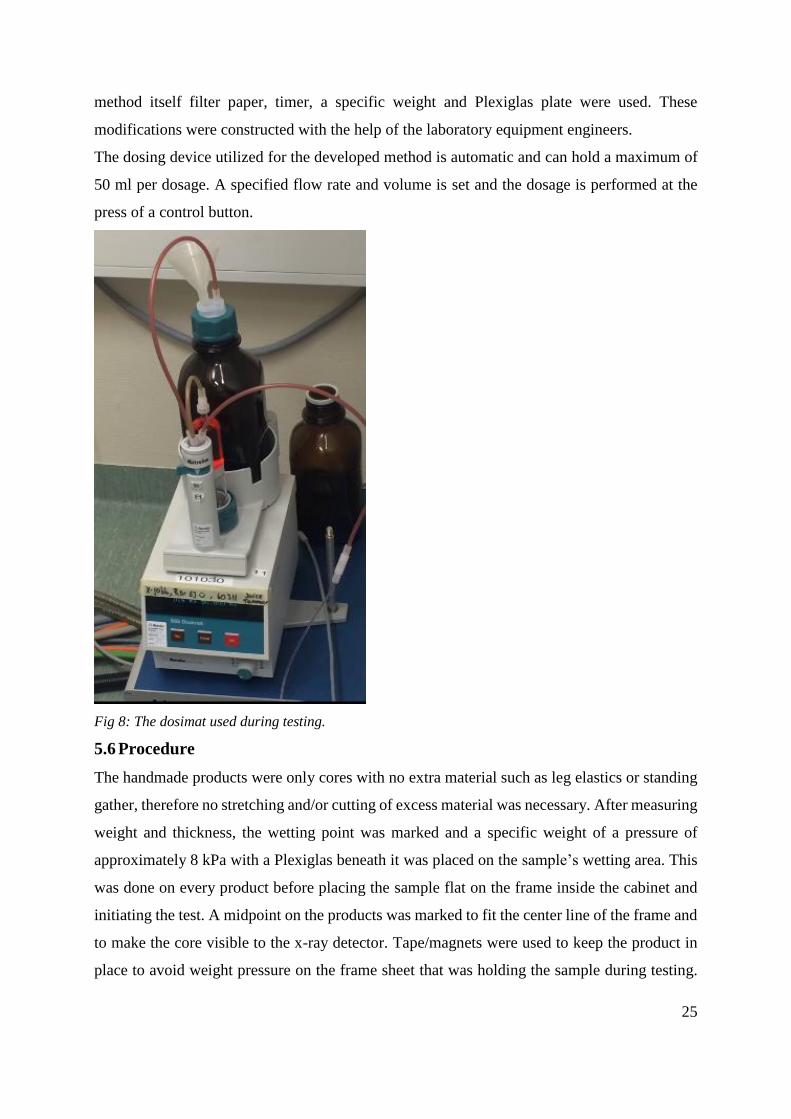
The dosing device utilized for the developed method is automatic and can hold a maximum of
50 ml per dosage. A specified flow rate and volume is set and the dosage is performed at the
press of a control button.
Fig 8: The dosimat used during testing.
5.6 Procedure
The handmade products were only cores with no extra material such as leg elastics or standing
gather, therefore no stretching and/or cutting of excess material was necessary. After measuring
weight and thickness, the wetting point was marked and a specific weight of a pressure of
approximately 8 kPa with a Plexiglas beneath it was placed on the sample’s wetting area. This
was done on every product before placing the sample flat on the frame inside the cabinet and
initiating the test. A midpoint on the products was marked to fit the center line of the frame and
to make the core visible to the x-ray detector. Tape/magnets were used to keep the product in
place to avoid weight pressure on the frame sheet that was holding the sample during testing.
26
The specific flowrate and volume was fed in the dosimat program and the dosing arm was
adjusted at the desired wetting point as well as the distance to the sample.
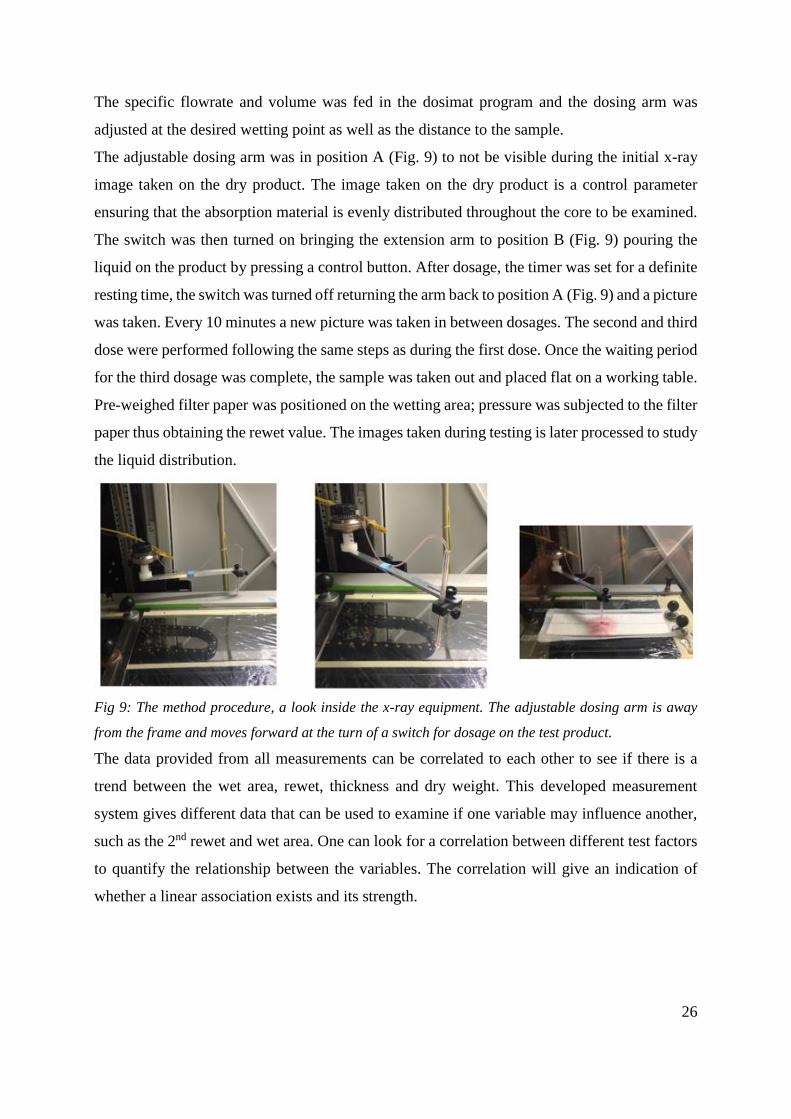
The adjustable dosing arm was in position A (Fig. 9) to not be visible during the initial x-ray
image taken on the dry product. The image taken on the dry product is a control parameter
ensuring that the absorption material is evenly distributed throughout the core to be examined.
The switch was then turned on bringing the extension arm to position B (Fig. 9) pouring the
liquid on the product by pressing a control button. After dosage, the timer was set for a definite
resting time, the switch was turned off returning the arm back to position A (Fig. 9) and a picture
was taken. Every 10 minutes a new picture was taken in between dosages. The second and third
dose were performed following the same steps as during the first dose. Once the waiting period
for the third dosage was complete, the sample was taken out and placed flat on a working table.
Pre-weighed filter paper was positioned on the wetting area; pressure was subjected to the filter
paper thus obtaining the rewet value. The images taken during testing is later processed to study
the liquid distribution.
Fig 9: The method procedure, a look inside the x-ray equipment. The adjustable dosing arm is away
from the frame and moves forward at the turn of a switch for dosage on the test product.
The data provided from all measurements can be correlated to each other to see if there is a
trend between the wet area, rewet, thickness and dry weight. This developed measurement
system gives different data that can be used to examine if one variable may influence another,
such as the 2nd rewet and wet area. One can look for a correlation between different test factors
to quantify the relationship between the variables. The correlation will give an indication of
whether a linear association exists and its strength.
27
6. Results
The purpose was to recreate the rewet method inside the x-ray cabinet while performing the
distribution method of absorbing material simultaneously. This required the rewet method to
be modified to place it inside the x-ray equipment. A pre-study was performed to verify if the
modification of the rewet method affected its end results. When testing with the developed
method, a verification of the dry sample was initially analyzed on the handmade products to
confirm an even core distribution. The images taken during testing of the developed method
were then processed, giving a definite wet area. All data was later analyzed with a statistical
comparison between the results from the designed method and the regular rewet verified that
this was an accurate testing measurement.
6.1 Pre-study
The purpose of this pre-study was to test if by modifying the current rewet method, this would
not affect the rewet result when combined with the x-ray method.
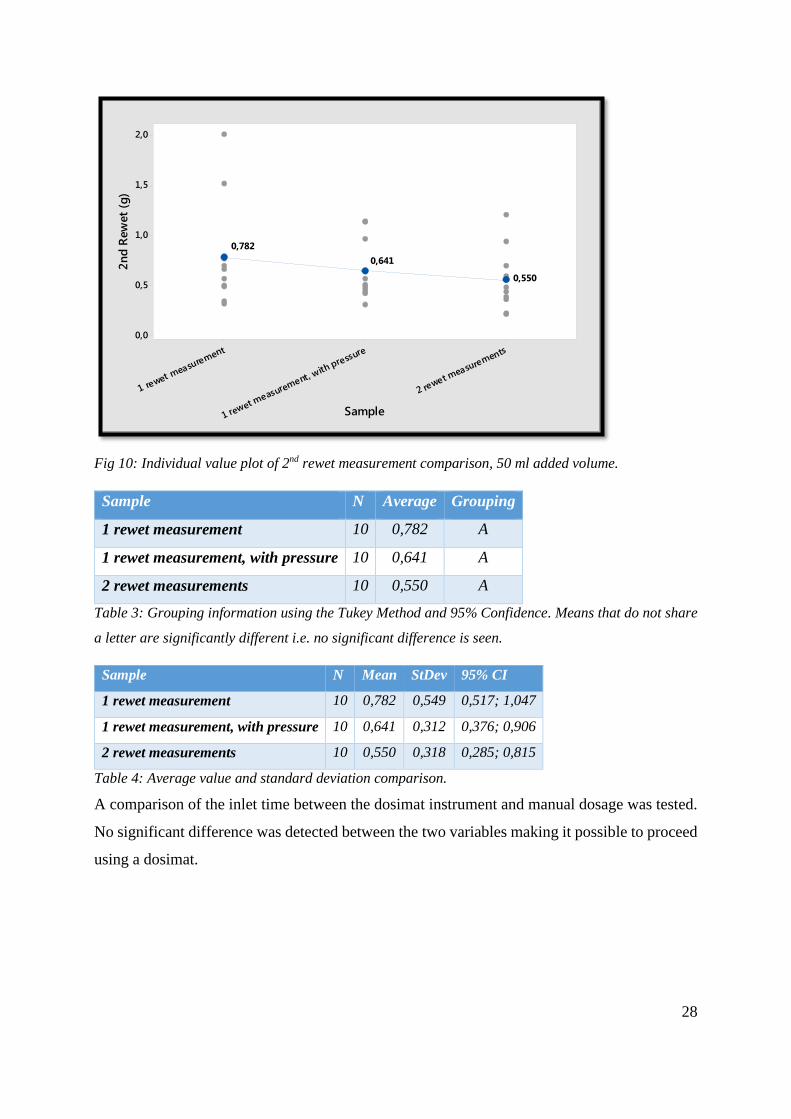
When performing the developed method, one rewet measurement was performed to avoid
tampering with the product and simplify the process. This approach does not disturb the
procedure as well as the end result, i.e. 2nd rewet.
A measurement where 1st and 2nd rewet was performed to be compared with the modified
version where only 2nd rewet was tested. This comparison showed no significant difference
between the two, but the standard deviation indicated that removing the 1st rewet had an effect.
By removing 1st rewet, the 2nd rewet values were scattered out over a wider range as shown in
figure 10.
The between-group variation comparison showed no statistical difference of the 2nd rewet but
there was a within-group variation. It was assumed that the within-group variation was due to
something unusual in the process, i.e. the pressure the sample is subjected to during the 1st
rewet. This led to the third trial where a specific pressure was placed on the sample before the
test was initiated. The standard deviation was now similar between the modified version with
pressure and the method that has two rewet measurements.
28
Fig 10: Individual value plot of 2nd rewet measurement comparison, 50 ml added volume.
Sample N Average Grouping
1 rewet measurement 10 0,782 A
1 rewet measurement, with pressure 10 0,641 A
2 rewet measurements 10 0,550 A
Table 3: Grouping information using the Tukey Method and 95% Confidence. Means that do not share
a letter are significantly different i.e. no significant difference is seen.
Sample N Mean StDev 95% CI
1 rewet measurement 10 0,782 0,549 0,517; 1,047
1 rewet measurement, with pressure 10 0,641 0,312 0,376; 0,906
2 rewet measurements 10 0,550 0,318 0,285; 0,815
Table 4: Average value and standard deviation comparison.
A comparison of the inlet time between the dosimat instrument and manual dosage was tested.
No significant difference was detected between the two variables making it possible to proceed
using a dosimat.
2 rewet m
easurements
1 rewet m
easurement, with pressure
1 rewet m
easurement
2,0
1,5
1,0
0,5
0,0
Sample
2n
d R
ew
et
(g)
0,550
0,641
0,782

29
Variable Sample Mean StDev Minimum Maximum
Inlet time 1 (s) 1 rewet measurement 20,241 0,193 20,000 20,490
1 rewet measurement, with pressure 20,384 0,269 20,040 20,950
2 rewet measurements 20,370 0,242 20,090 20,750
Inlet time 2 (s) 1 rewet measurement 20,411 0,126 20,230 20,640
1 rewet measurement, with pressure 20,429 0,271 20,090 20,880
2 rewet measurements 20,595 0,298 20,230 21,300
Inlet time 3 (s) 1 rewet measurement 20,433 0,266 20,170 20,880
1 rewet measurement, with pressure 20,328 0,145 20,060 20,530
2 rewet measurements 20,420 0,153 20,240 20,740
Table 5: Descriptive statistics of inlet time, 50 ml added volume.
6.2 Verification of core evenness
An image of the dry product was initially taken before dosage to verify the material distribution
throughout the product core of the handmade products. The absorbing materials are evenly
distributed as seen on the figure below.
Fig 11: The image is an average picture of tested cores in Variant 2 after being processed in Matlab.
30
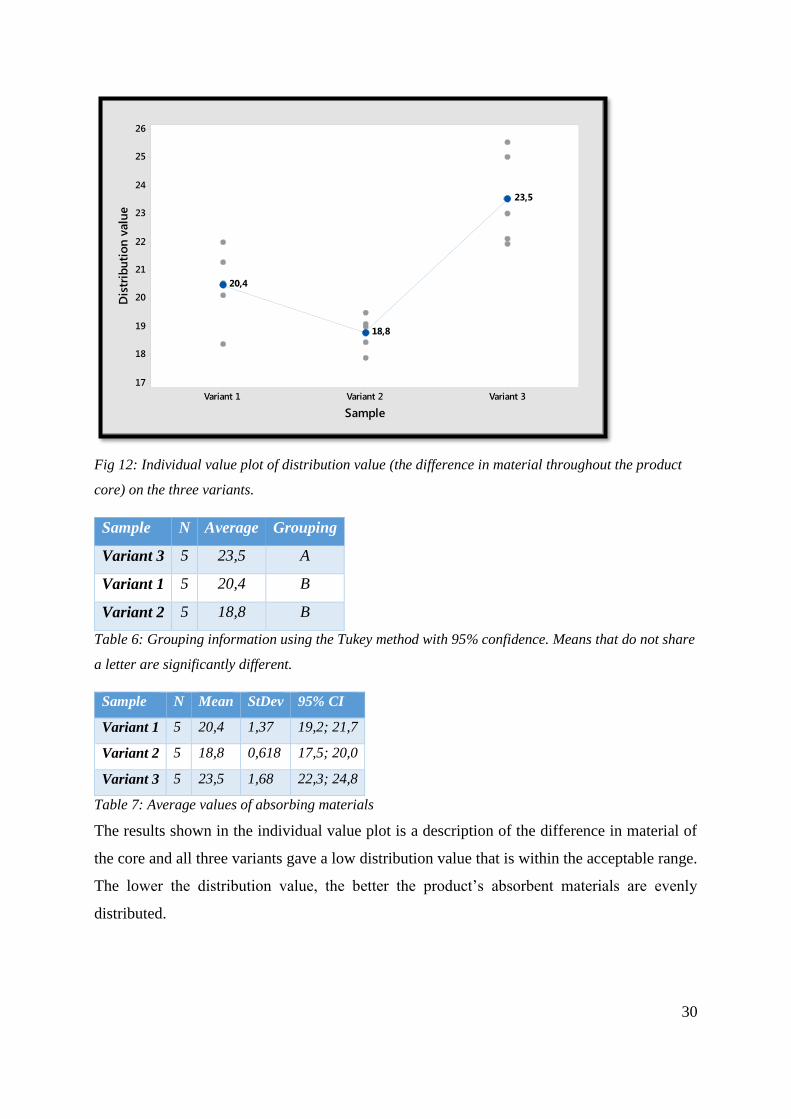
Fig 12: Individual value plot of distribution value (the difference in material throughout the product
core) on the three variants.
Sample N Average Grouping
Variant 3 5 23,5 A
Variant 1 5 20,4 B
Variant 2 5 18,8 B
Table 6: Grouping information using the Tukey method with 95% confidence. Means that do not share
a letter are significantly different.
Sample N Mean StDev 95% CI
Variant 1 5 20,4 1,37 19,2; 21,7
Variant 2 5 18,8 0,618 17,5; 20,0
Variant 3 5 23,5 1,68 22,3; 24,8
Table 7: Average values of absorbing materials
The results shown in the individual value plot is a description of the difference in material of
the core and all three variants gave a low distribution value that is within the acceptable range.
The lower the distribution value, the better the product’s absorbent materials are evenly
distributed.
Variant 3Variant 2Variant 1
26
25
24
23
22
21
20
19
18
17
Sample
Dis
trib
uti
on
valu
e
23,5
18,8
20,4
31
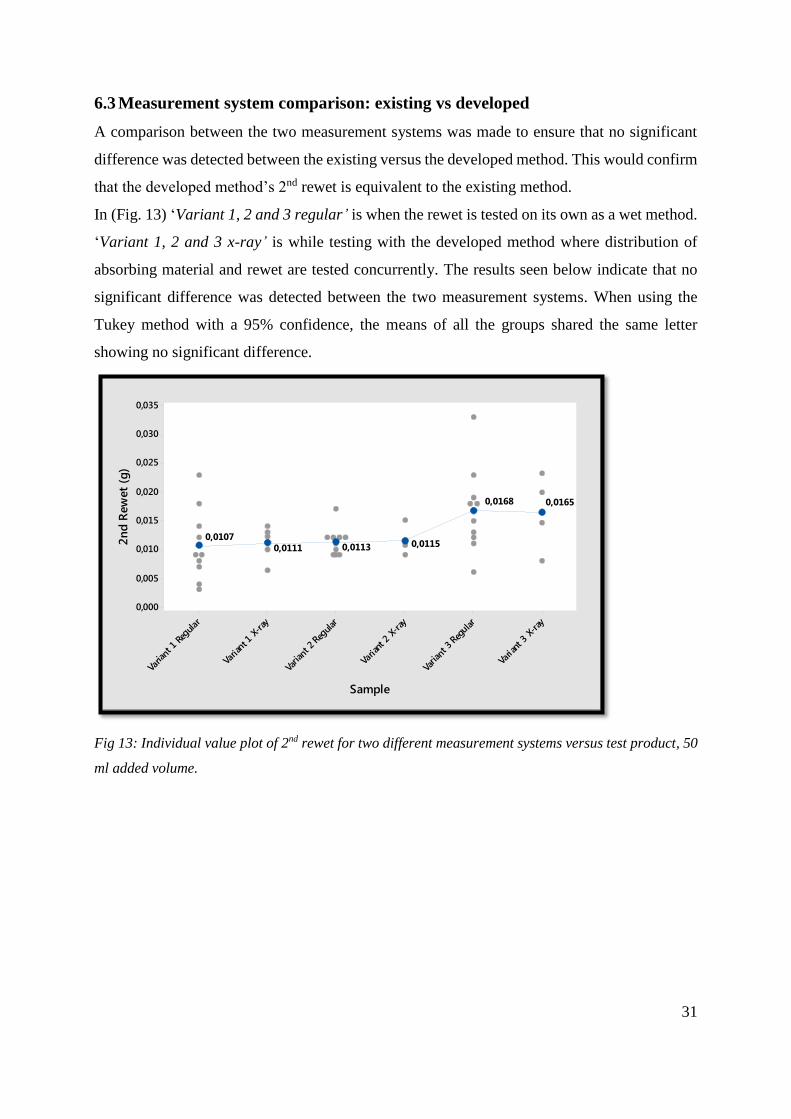
6.3 Measurement system comparison: existing vs developed
A comparison between the two measurement systems was made to ensure that no significant
difference was detected between the existing versus the developed method. This would confirm
that the developed method’s 2nd rewet is equivalent to the existing method.
In (Fig. 13) ‘Variant 1, 2 and 3 regular’ is when the rewet is tested on its own as a wet method.
‘Variant 1, 2 and 3 x-ray’ is while testing with the developed method where distribution of
absorbing material and rewet are tested concurrently. The results seen below indicate that no
significant difference was detected between the two measurement systems. When using the
Tukey method with a 95% confidence, the means of all the groups shared the same letter
showing no significant difference.
Fig 13: Individual value plot of 2nd rewet for two different measurement systems versus test product, 50
ml added volume.
Varia
nt 3
X-ray
Varia
nt 3 R
egula
r
Varia
nt 2
X-ray
Varia
nt 2 R
egular
Varia
nt 1 X-ray
Varia
nt 1 R
egular
0,035
0,030
0,025
0,020
0,015
0,010
0,005
0,000
Sample
2n
d R
ew
et
(g)
0,01650,0168
0,01150,01130,0111
0,0107
32
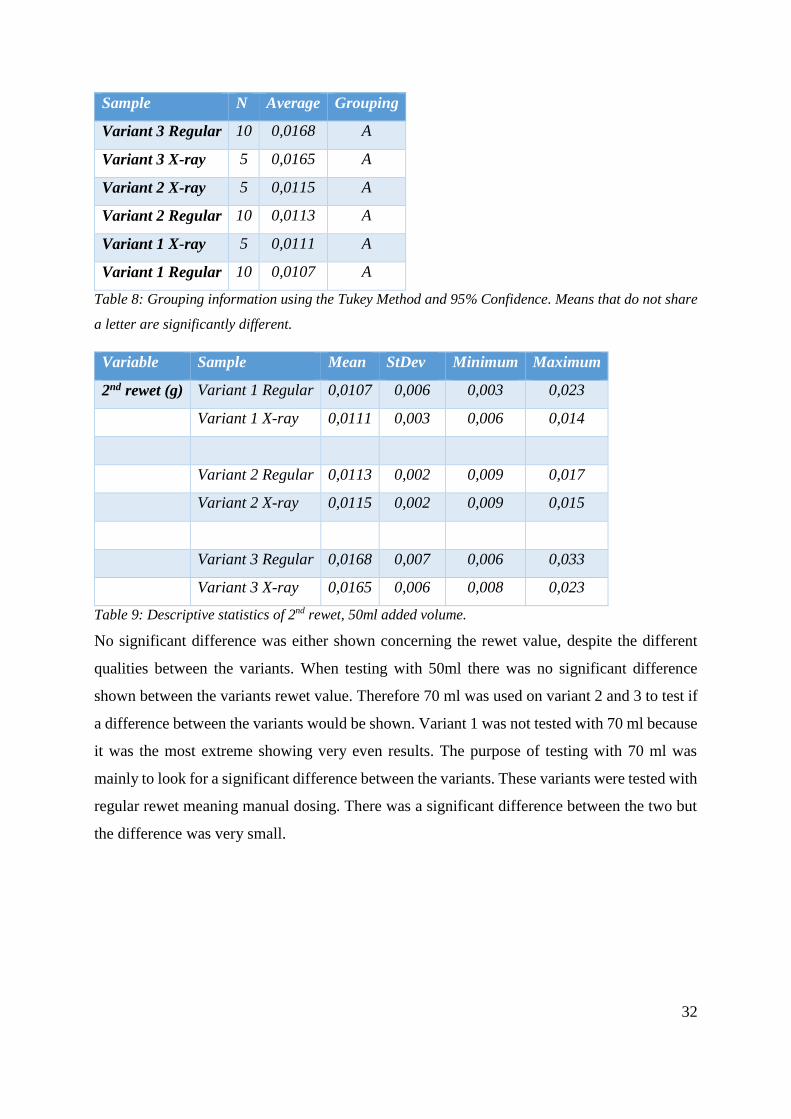
Sample N Average Grouping
Variant 3 Regular 10 0,0168 A
Variant 3 X-ray 5 0,0165 A
Variant 2 X-ray 5 0,0115 A
Variant 2 Regular 10 0,0113 A
Variant 1 X-ray 5 0,0111 A
Variant 1 Regular 10 0,0107 A
Table 8: Grouping information using the Tukey Method and 95% Confidence. Means that do not share
a letter are significantly different.
Variable Sample Mean StDev Minimum Maximum
2nd rewet (g) Variant 1 Regular 0,0107 0,006 0,003 0,023
Variant 1 X-ray 0,0111 0,003 0,006 0,014
Variant 2 Regular 0,0113 0,002 0,009 0,017
Variant 2 X-ray 0,0115 0,002 0,009 0,015
Variant 3 Regular 0,0168 0,007 0,006 0,033
Variant 3 X-ray 0,0165 0,006 0,008 0,023
Table 9: Descriptive statistics of 2nd rewet, 50ml added volume.
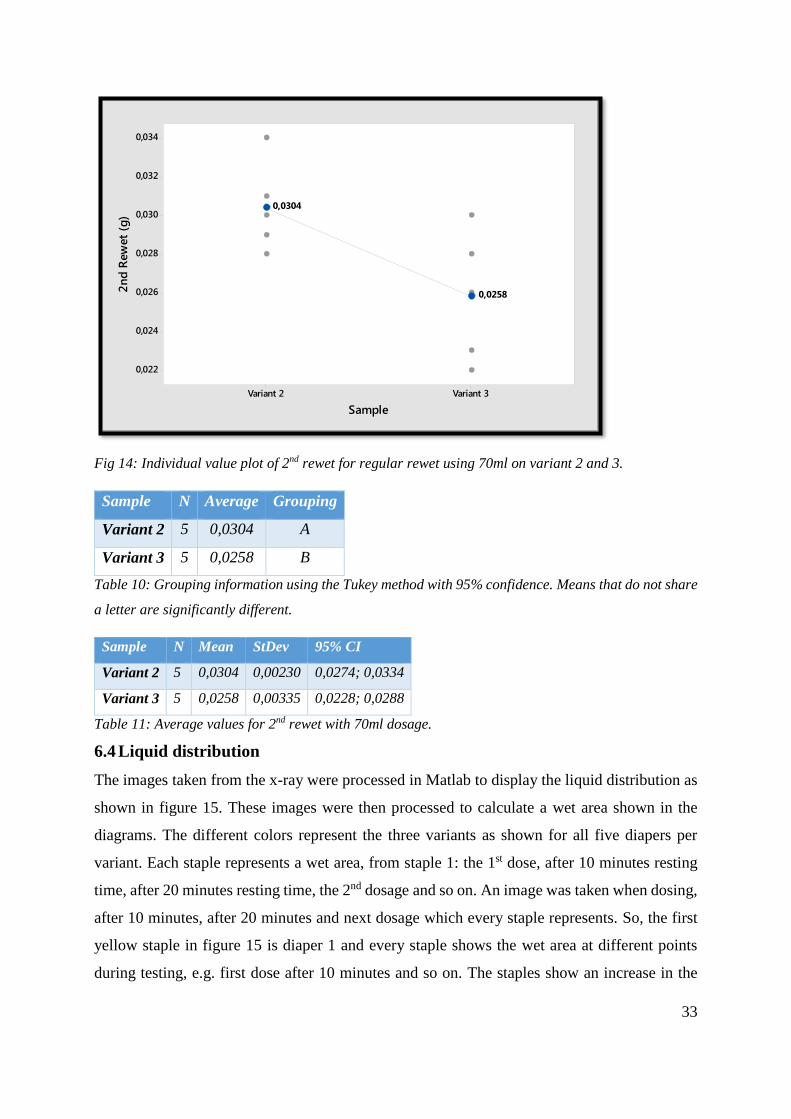
No significant difference was either shown concerning the rewet value, despite the different
qualities between the variants. When testing with 50ml there was no significant difference
shown between the variants rewet value. Therefore 70 ml was used on variant 2 and 3 to test if
a difference between the variants would be shown. Variant 1 was not tested with 70 ml because
it was the most extreme showing very even results. The purpose of testing with 70 ml was
mainly to look for a significant difference between the variants. These variants were tested with
regular rewet meaning manual dosing. There was a significant difference between the two but
the difference was very small.
33
Fig 14: Individual value plot of 2nd rewet for regular rewet using 70ml on variant 2 and 3.
Sample N Average Grouping
Variant 2 5 0,0304 A
Variant 3 5 0,0258 B
Table 10: Grouping information using the Tukey method with 95% confidence. Means that do not share
a letter are significantly different.
Sample N Mean StDev 95% CI
Variant 2 5 0,0304 0,00230 0,0274; 0,0334
Variant 3 5 0,0258 0,00335 0,0228; 0,0288
Table 11: Average values for 2nd rewet with 70ml dosage.
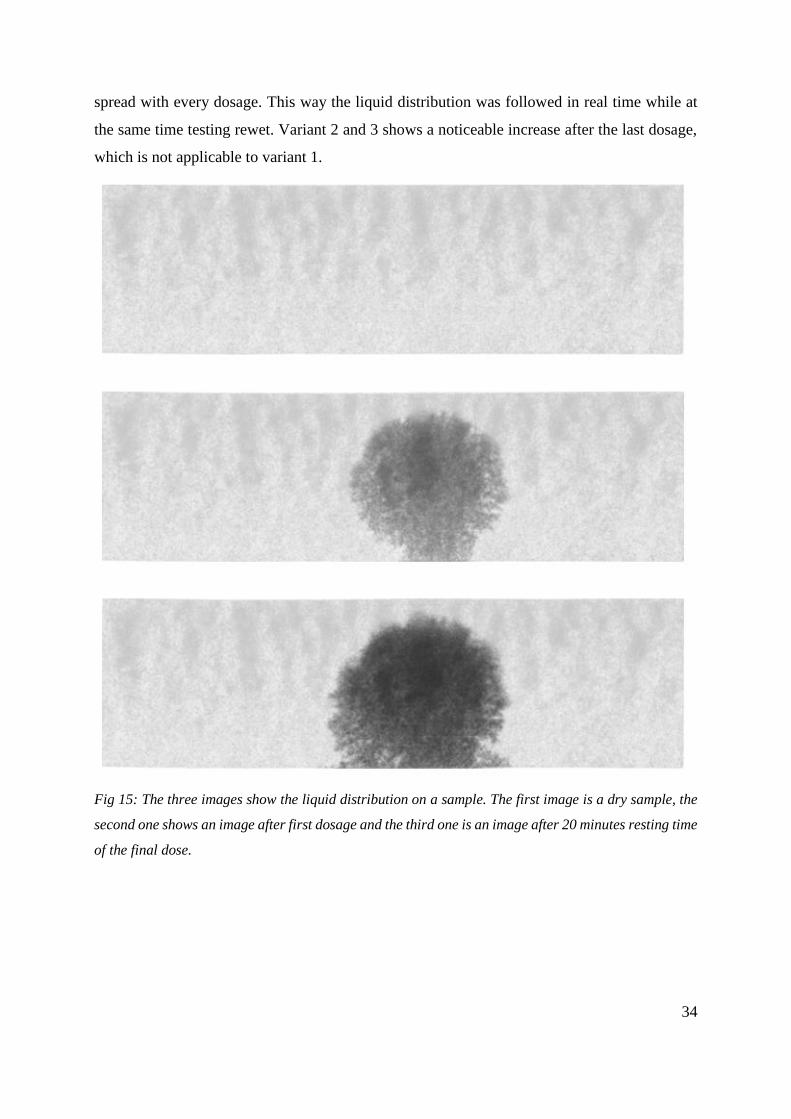
6.4 Liquid distribution
The images taken from the x-ray were processed in Matlab to display the liquid distribution as
shown in figure 15. These images were then processed to calculate a wet area shown in the
diagrams. The different colors represent the three variants as shown for all five diapers per
variant. Each staple represents a wet area, from staple 1: the 1st dose, after 10 minutes resting
time, after 20 minutes resting time, the 2nd dosage and so on. An image was taken when dosing,
after 10 minutes, after 20 minutes and next dosage which every staple represents. So, the first
yellow staple in figure 15 is diaper 1 and every staple shows the wet area at different points
during testing, e.g. first dose after 10 minutes and so on. The staples show an increase in the
Variant 3Variant 2
0,034
0,032
0,030
0,028
0,026
0,024
0,022
Sample
2n
d R
ew
et
(g)
0,0258
0,0304
34
spread with every dosage. This way the liquid distribution was followed in real time while at
the same time testing rewet. Variant 2 and 3 shows a noticeable increase after the last dosage,
which is not applicable to variant 1.
Fig 15: The three images show the liquid distribution on a sample. The first image is a dry sample, the
second one shows an image after first dosage and the third one is an image after 20 minutes resting time
of the final dose.
35
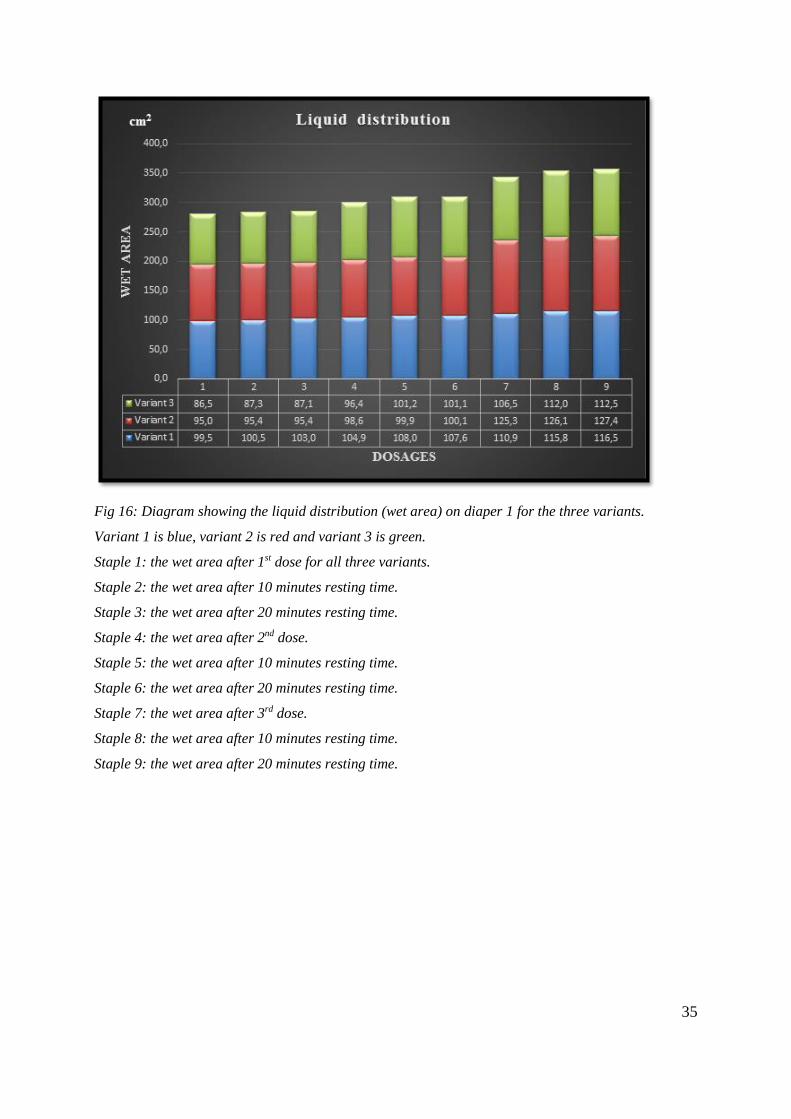
Fig 16: Diagram showing the liquid distribution (wet area) on diaper 1 for the three variants.
Variant 1 is blue, variant 2 is red and variant 3 is green.
Staple 1: the wet area after 1st dose for all three variants.
Staple 2: the wet area after 10 minutes resting time.
Staple 3: the wet area after 20 minutes resting time.
Staple 4: the wet area after 2nd dose.
Staple 5: the wet area after 10 minutes resting time.
Staple 6: the wet area after 20 minutes resting time.
Staple 7: the wet area after 3rd dose.
Staple 8: the wet area after 10 minutes resting time.
Staple 9: the wet area after 20 minutes resting time.

36
Fig 17: Diagram showing the liquid distribution (wet area) on diaper 2 for the three variants.
Variant 1 is blue, variant 2 is red and variant 3 is green.
Staple 1: the wet area after 1st dose for all three variants.
Staple 2: the wet area after 10 minutes resting time.
Staple 3: the wet area after 20 minutes resting time.
Staple 4: the wet area after 2nd dose.
Staple 5: the wet area after 10 minutes resting time.
Staple 6: the wet area after 20 minutes resting time.
Staple 7: the wet area after 3rd dose.
Staple 8: the wet area after 10 minutes resting time.
Staple 9: the wet area after 20 minutes resting time.
37
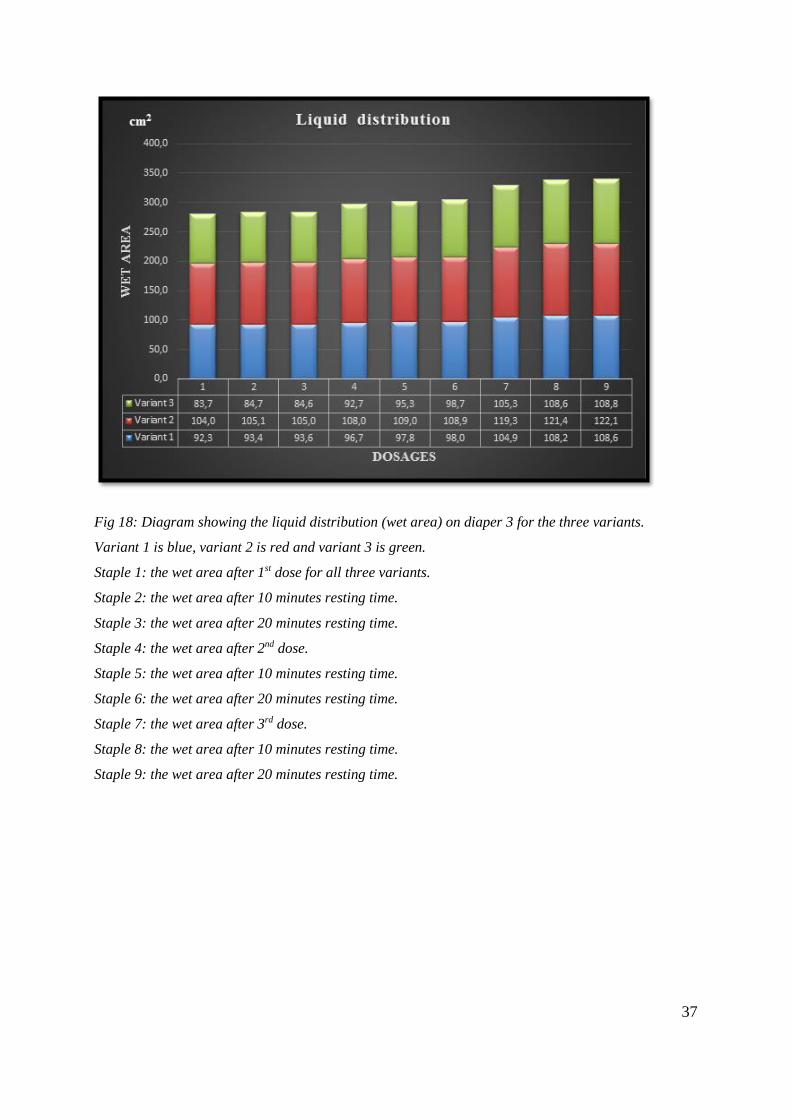
Fig 18: Diagram showing the liquid distribution (wet area) on diaper 3 for the three variants.
Variant 1 is blue, variant 2 is red and variant 3 is green.
Staple 1: the wet area after 1st dose for all three variants.
Staple 2: the wet area after 10 minutes resting time.
Staple 3: the wet area after 20 minutes resting time.
Staple 4: the wet area after 2nd dose.
Staple 5: the wet area after 10 minutes resting time.
Staple 6: the wet area after 20 minutes resting time.
Staple 7: the wet area after 3rd dose.
Staple 8: the wet area after 10 minutes resting time.
Staple 9: the wet area after 20 minutes resting time.
38
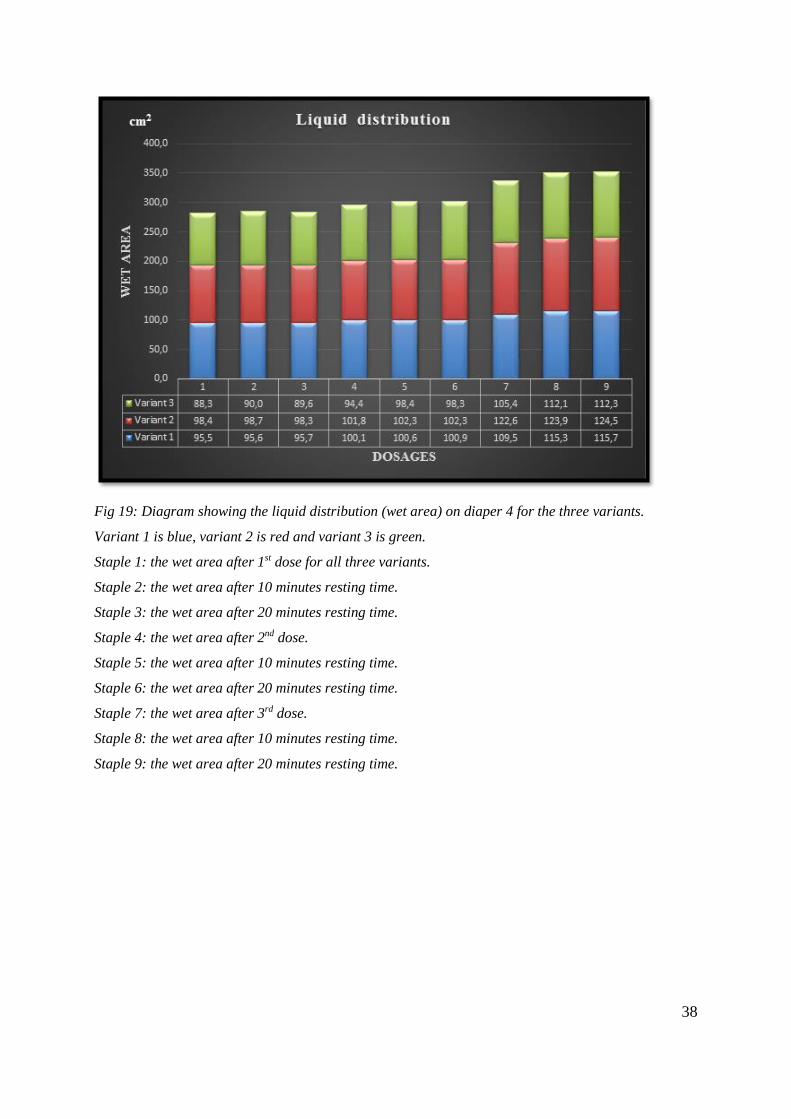
Fig 19: Diagram showing the liquid distribution (wet area) on diaper 4 for the three variants.
Variant 1 is blue, variant 2 is red and variant 3 is green.
Staple 1: the wet area after 1st dose for all three variants.
Staple 2: the wet area after 10 minutes resting time.
Staple 3: the wet area after 20 minutes resting time.
Staple 4: the wet area after 2nd dose.
Staple 5: the wet area after 10 minutes resting time.
Staple 6: the wet area after 20 minutes resting time.
Staple 7: the wet area after 3rd dose.
Staple 8: the wet area after 10 minutes resting time.
Staple 9: the wet area after 20 minutes resting time.
39
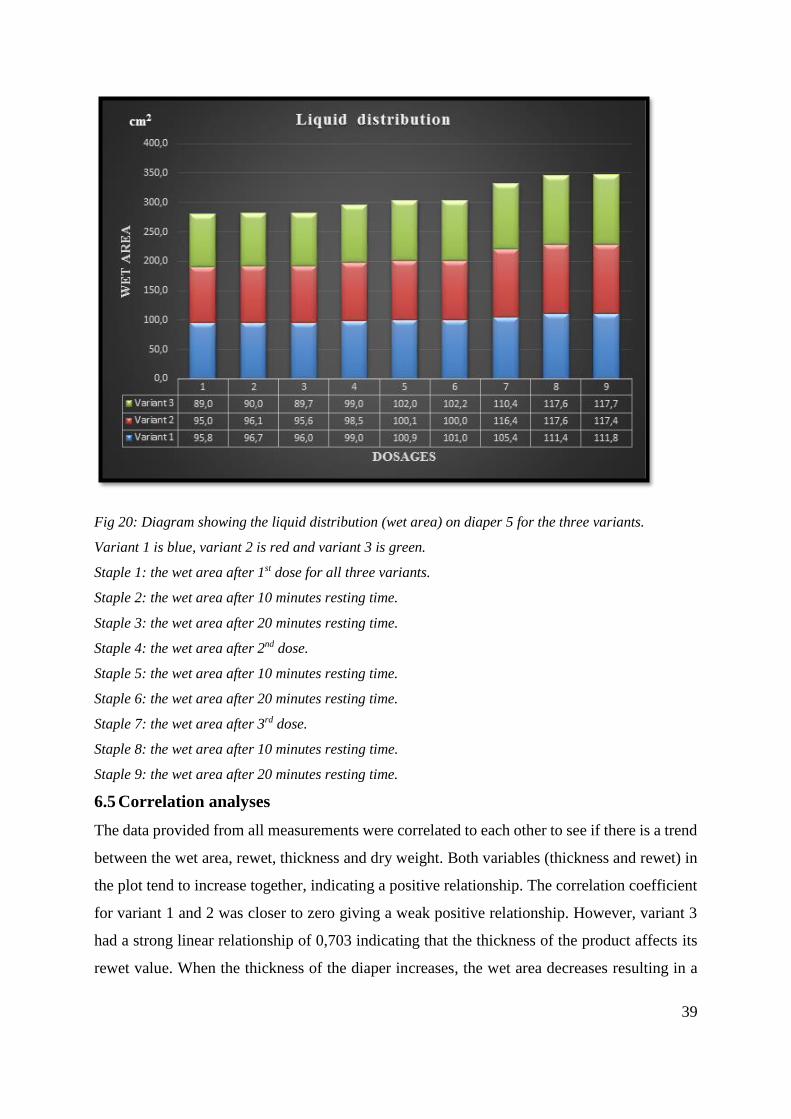
Fig 20: Diagram showing the liquid distribution (wet area) on diaper 5 for the three variants.
Variant 1 is blue, variant 2 is red and variant 3 is green.
Staple 1: the wet area after 1st dose for all three variants.
Staple 2: the wet area after 10 minutes resting time.
Staple 3: the wet area after 20 minutes resting time.
Staple 4: the wet area after 2nd dose.
Staple 5: the wet area after 10 minutes resting time.
Staple 6: the wet area after 20 minutes resting time.
Staple 7: the wet area after 3rd dose.
Staple 8: the wet area after 10 minutes resting time.
Staple 9: the wet area after 20 minutes resting time.
6.5 Correlation analyses
The data provided from all measurements were correlated to each other to see if there is a trend
between the wet area, rewet, thickness and dry weight. Both variables (thickness and rewet) in
the plot tend to increase together, indicating a positive relationship. The correlation coefficient
for variant 1 and 2 was closer to zero giving a weak positive relationship. However, variant 3
had a strong linear relationship of 0,703 indicating that the thickness of the product affects its
rewet value. When the thickness of the diaper increases, the wet area decreases resulting in a
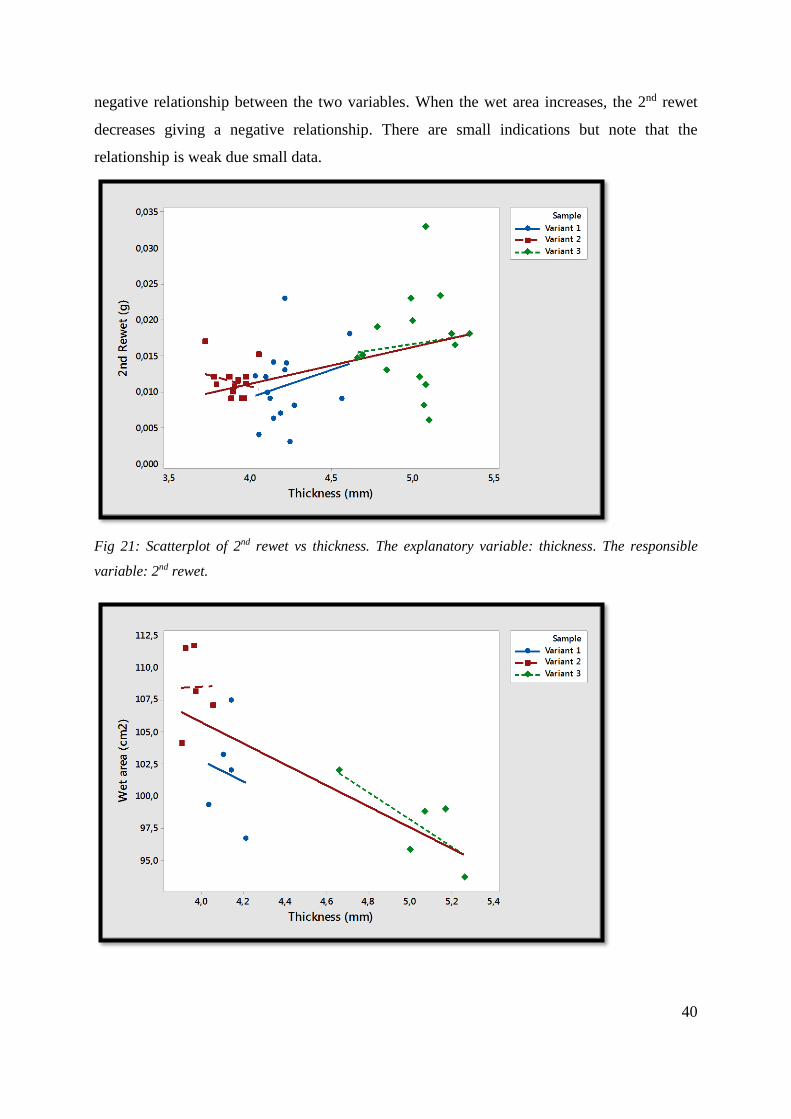
40
negative relationship between the two variables. When the wet area increases, the 2nd rewet
decreases giving a negative relationship. There are small indications but note that the
relationship is weak due small data.
Fig 21: Scatterplot of 2nd rewet vs thickness. The explanatory variable: thickness. The responsible
variable: 2nd rewet.
41
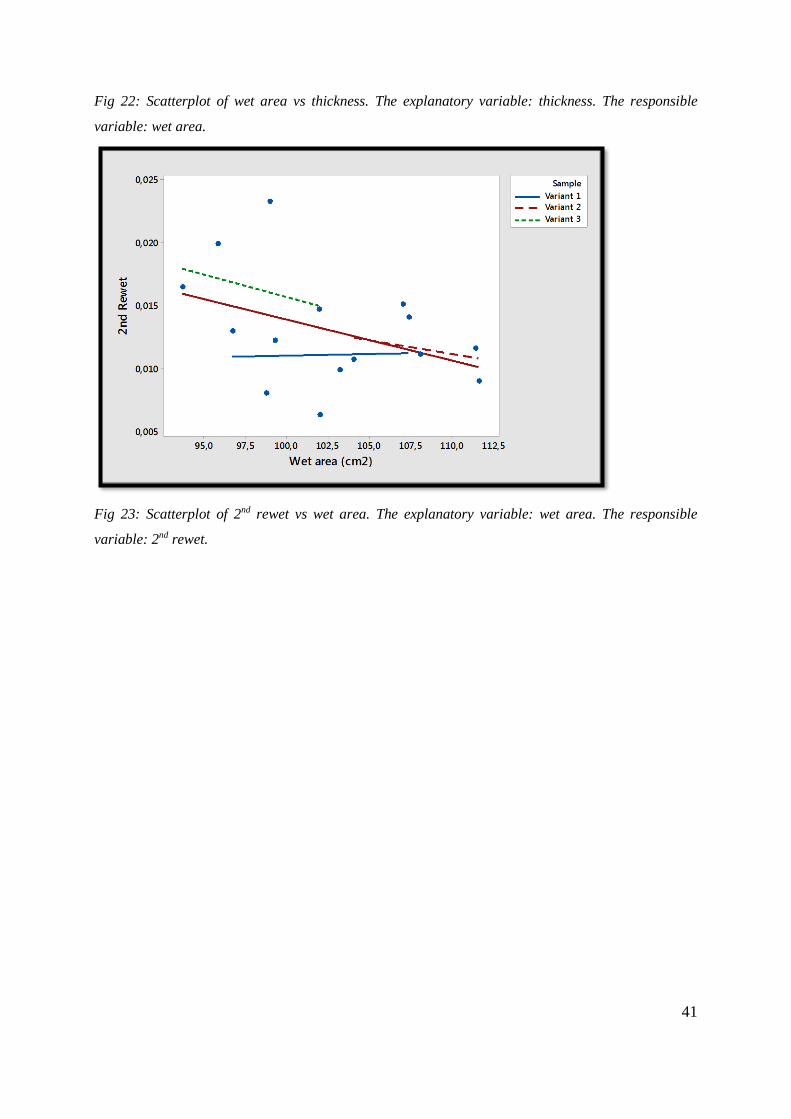
Fig 22: Scatterplot of wet area vs thickness. The explanatory variable: thickness. The responsible
variable: wet area.
Fig 23: Scatterplot of 2nd rewet vs wet area. The explanatory variable: wet area. The responsible
variable: 2nd rewet.
42
7. Discussion
The aim with this thesis has been to design a method that studies the spreading behavior of the
liquid in a baby diaper. By merging the rewet method with the distribution of material method,
liquid distribution could then be examined in real time. The rewet method would be placed in
the x-ray equipment that is used to examine product cores and perform these two measurements
simultaneously. The developed method will examine the core appearance, follow liquid
distribution as well measure the rewet. This method will be able to be used for advanced
analysis, studying new products and quality control. The methods have been modified so that
the developed testing methods is efficient, avoiding to do unnecessary steps to offer reliable
results.
7.1 Can the rewet test method be performed on a baby diaper while simultaneously
exposing the product core to radiation so the course of the liquid can be followed
in real time?
The developed method makes it possible to perform the rewet test method inside the x-ray
cabinet. This means one can perform dosages while exposing the product core to radiation in
order to follow the liquid distribution.
7.1.1 Rewet method modifications
The limitation of performing rewet inside the x-ray cabinet was that the system had to be
disturbed as little as possible during testing. This entails that the person performing the
laboratory analysis cannot go inside the x-ray cabinet for sample adjustments and/or further
testing during the process too often. Disturbing the procedure should be held at a minimum to
not tamper with the products being tested but also to have a quick and smooth process.
When testing the rewet, one can perform two rewet measurements giving 1st and 2nd rewet.
When analyzing a sample’s material distribution, the product is placed in the x-ray equipment
and the cabinet door is shut during the test period. This step was to be recreated while
performing rewet simultaneously inside the equipment. After studying the equipment and
discussing with experts in the field, performing one rewet measurement was preferable to avoid
unnecessary tampering with the product, disturbing the process since it did not affect the end
result, i.e. 2nd rewet and x-ray images.
Since this decision pointed toward removing the 1st rewet, a pre-study was conducted to ensure
that this modification on the method did not affect the 2nd rewet value. It was proved that
removing the 1st rewet did not affect the final results but it did affect the standard deviation.
43
Adding pressure to the test products before being placed in the x-ray cabinet was an added
element that took away the interference of the 2nd rewet value, which is the result of interest.
The results from the developed method and the two rewet measurements were comparable and
acceptable as shown in figure 10. The rewet method was simplified by removing the 1st rewet
so that only one rewet measurement would be performed as a final step. This would simplify
the method offering operational efficiency and minimize product disturbances, thus avoiding
deviating results.
The 2nd rewet is the value of interest and it was important to adjust the changes so the end results
were not altered significantly. Figure 10 proved that there was no significant difference between
them nor was a difference detected in the group making it possible to replicate the rewet inside
the x-ray cabinet.
When testing rewet, the dosages were being done manually and this was not ideal when the
method would be performed inside the x-ray cabinet. Therefore, manual dosage would not be
used during the method development, so an additional pre-study on the inlet time had to be
done. Table 5 presented no significant difference in the inlet time when dosing manually or
with a dosimat, making the results acceptable. This was a positive result that made the process
easier while providing time efficiency. These verifications proved that this was a reliable
process that follows liquid distribution in real time.
7.1.2 Distribution, absorption material and Rewet
All three variants showed low rewet values confirming that there was an even material
distribution throughout the product core. As mentioned before, it is important that the
distribution value is low ensuring that the SAP has not ended up in the wrong area. If the x-ray
images display weak points in the core area, it can explain a wet product, i.e. high rewet values,
since the liquid distribution would have been affected. When testing with 50 ml, there was a
positive relationship between the distribution value and the rewet value. The variant with the
significantly highest material distribution value also showed the highest rewet value (figure 12
and 13), giving a wetter product among the three variants. The highest distribution value means
that this variant had the lowest evenness of absorbent materials of the three variants.
7.1.3 Time consumption to perform the method
The developed method can be used to test handmade product cores, open and/or pants diapers,
so depending on which sample is to be tested, sample preparation differs among products. It
takes one hour to test one diaper so it’s more time-consuming compared to the rewet method
44
that tests 10 products per test run. The time it takes for analyzing the images taken and
calculations varies depending on the sample size. For technical optimization, the x-ray
equipment could be made bigger so more than one sample can be tested during one test run for
time optimization.
7.1.4 Requirements for test materials
When testing rewet outside the x-ray equipment, leakage is prevented during dosage because
the product has standing gather that works as a barrier to prevent leakage. Even though the
product is stretched when testing, the operator can make adjustments such as lifting the standing
gather so the liquid does not spill outside. When studying the product core in the x-ray cabinet,
all unnecessary materials are removed from the product so that the core is fully exposed. The
sample is not easily accessible for the operator when performing the rewet inside the x-ray
equipment which limits the method. Even if the standing gather is not cut off, it’s still stretched
and may not completely fulfill its purpose of preventing leakage.
A combination of the wet and dry method could cause leakage during the dosage due to the
limitations mentioned above. The wettability of material in the products will affect the wicking
and the run-off can affect the final value since the defined amount to be dosed has not been
absorbed. This could currently randomize the results of this method depending on the product,
especially for the 1st dose on a dry surface. The material can also become more hydrophobic
thereby increasing risk of run-off if the laboratory is dry, affecting the wettability.
The main concept of a diaper affects the SAP amount in the product in matters of SAP/pulp
mix and whether there is a core wrap or not. If there is chassis around the core, the tightness of
the chassis can restrain the SAP from swelling enough during the testing and the correct amount
cannot be determined. For future testing this should be taken in consideration making it
important to know if the diaper is more hydrophobic. The handmade products that were tested
had no standing gather but there was no run-off during the analysis, making the results accurate.
The handmade diapers contained a known amount of SAP/pulp mix that complement each other
to prevent leakage and to trap the liquid inside the diaper. The pulp’s fast absorption rate and
absorption capacity is complemented with the SAP’s flexible polymer chains that do not release
the liquid under pressure. The diffusional mechanism of SAP together with the capillary force
of pulp work together giving a better absorption and thereby very low rewet value as seen in
the results. With a known FSC and CRC it was possible to predict that the handmade diapers
would give a good performance ensuring unfluctuating results. When getting the products, it
45
was known which diaper had the highest SAP value and which had the lowest of the three.
Knowing the properties of the variant’s different qualities gave insight on how the diapers
should perform. Variant 1 being the most extreme with the highest permeability of the three,
showed as expected the lowest rewet. Variant 1 expanded more the other two because it
contained more SAP and permeability played a crucial part in transmitting and trapping the
liquid when pressure was added to the diaper prior to the dosage. The negative part of a diaper
when containing as much SAP as variant 1 is that the diaper is not comfortable nor wearable
for the child. For the method development, however, this was not a priority.
7.1.5 Handmade vs factory produced products
There are differences in the product depending on handmade or factory produced diapers. The
handmade products’ material is evenly distributed (Fig. 11) giving even results. This was not
the case for products produced by the factory as they vary more. The variation in results can
therefore be affected depending on the production of the sample. Although there is a difference
between the handmade and factory produced products, the variation has no statistical
significance when testing many samples. Overall, the end results of this developed method are
not affected by the production of the products but the operator should be aware of this
difference.
7.2 Is the liquid distribution (wet area) affected by different product compositions
e.g. SAP or thickness?
There was a positive relationship between the thickness and 2nd rewet variables when correlated,
tending to increase together. Although the linear relationship was weak, there was an indication
that product thickness is an important parameter that affects its rewet value. A thick product
versus a thinner product depends on how much space the SAP/pulp takes up in the product, i.e.
the density of the diaper. The thicker diaper, with a lower density, gives a wetter product
because compression affects the capillary effect. A thicker diaper has less compression thus
giving a higher rewet value because a larger radius has less momentum making the product
wetter. Lower rewet is achieved with a thinner product since it has a smaller radius, affecting
the capillary effect which entails a higher momentum.
An indication of a negative relationship was found between the wet area and thickness. When
the thickness of the diaper increased, the wet area decreased. The way the liquid spreads is
affected by a thicker product as mentioned above since the driving force deteriorates with a
larger radius. When the wet area increases, the 2nd rewet decreases, giving a negative
relationship showing that the more the liquid spreads, the drier the product. A thinner product
46
resulted in a higher wet area as well as a lower rewet value meaning a dry product. This is
explained by Fick's law diffusion mechanism that means that the rate is determined by the
materials’ flow structure.
A strong relationship between variables is when the data gives a straight, sloped line. The
scatterplots were linear but the correlation coefficients are all closer to zero giving a weak linear
relationship for the variables. Nevertheless, the results indicated that the liquid distribution, wet
area, is affected by different product qualities. Thinner products give better absorption capacity
and thereby an effective product.
The rewet is also affected by the rate of absorption and this capacity of liquid spreading is the
permeability explained by Darcy’s law. The permeability rest on thickness and distribution to
name a few as the results have shown. Darcy’s law explains the relationship of various features,
e.g. thickness or particle size, that affect the flowrate through the diaper. This is important in
modern disposable diapers for keeping the skin of the baby dry.
These correlations can predict future events when studying the liquid distribution. The results
have shown the importance of measuring thickness. A definite wet area from the developed
method has shown a more specific measure of how the liquid has distributed.
7.2.1 Reasons for deviating values/results
Different parameters can affect the results of the method and this can be apparatus, performance
or product related. An uneven distribution of absorbing materials can be a reason for deviating
values. The results can be altered if the products are taken out during testing for every dosage
so using the dosimat made it possible to do the dosing inside the equipment. Also, since the
course of the liquid is of interest, an image was taken during dosing which is not possible with
the x-ray cabinet door open. An adjustable dosing arm was used to dose and before taking a
picture the arm was the returned to its regular position, shown in figure 9. The background area
in the x-ray was verified to ensure that the dosing arm did not affect the x-ray images taken.
The background was controlled regularly throughout the process making sure that there were
no irregularities and no differences before the dosing arm was placed inside the x-ray
equipment. If the product is not placed correctly in the frame, this inconsistency of placement
in the x-ray cabinet disturbs the results.
47
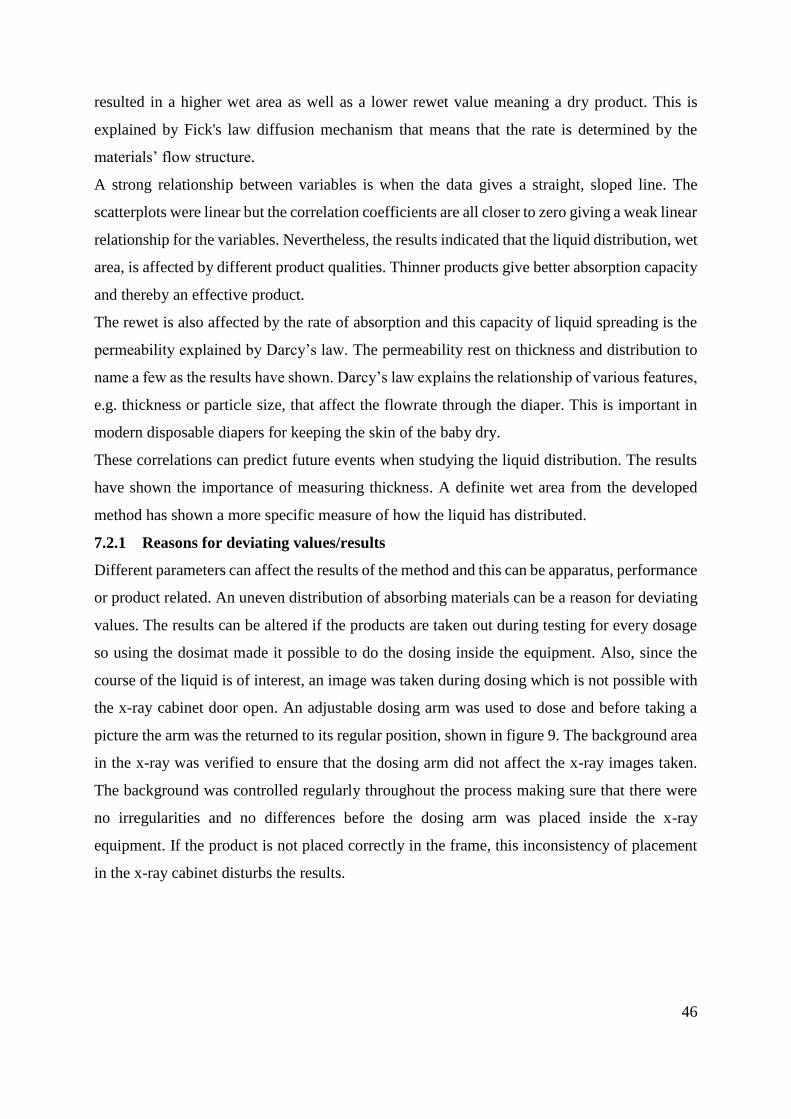
Parameter Optimum
Dose 3 × 50 ml (can differ depending on product size)
Pressure for rewet measurement 8 kPa
Pressure for thickness measurement 0,5 kPa
Resting time after 3rd dose 20 minutes
Resting time between doses 20 minutes
Waiting time for pressure on the sample 15 seconds
Table 12: Optimal parameter combination for the developed method.
7.2.2 Evaluation of methods and data accuracy
There are some parameters that need to be under control during testing of the developed method
to ensure reliable results that are comparable to the pre-existing methods. A critical procedure
is the placement, giving the same position, of the diaper in the frame of the x-ray cabinet or else
the average picture will not be correct. The wrong placement will also affect the wetting point
during dosing which will give uneven rewet and wet area values. The pressure subjected to the
sample before placing it inside the cabinet is important in order for the rewet value measured
at the end to be equivalent to the pre-existing rewet method. The design of this experiment has
been tested and the results have been cross-referenced with the pre-existing methods to confirm
their accuracy.
7.3 Additional improvements
The added volume usually depends on the size of the product but in this case 50 ml was the
maximum of the dosimat at hand. There was no equipment that could take 70 ml which is
typically used on these kinds of products. For future testing, a dosimat that can take more could
be used since manual dosing is not preferable. Perhaps a difference between the variants was
not detected since the SAP did not have time to fully work since it has a slow process when
capsuling liquid. The size of the tested products would need 70 ml dosage and this was shown
when variant 2 and 3 were tested with 70 ml showing then a significant difference between the
two. This difference was not seen before when dosing with 50 ml. Although the rewet
measurement with 70 ml showed a significant difference between the variants, it was rather
small and could be a randomized difference.
Testing more products for better data analysis could be the next step for this study. The
developed method has made it possible to study liquid distribution, use the data to analyze and
make future predictions. There is room for improvement in the method such as an automated
process when placing the weight on the dry sample before placing it in the x-ray cabinet. The

48
products were tested one product at a time which was time consuming. Perhaps a bigger x-ray
cabinet could make it possible to test more samples in during a test run. Unnecessary handling
of the products before and during testing should be held at a minim since it can affect the
materials distribution. These are disposable products that should be handled with care and since
it’s hard to perform several measurements on the same product this method combination is
valuable.
49
8. Conclusion
This study’s main objective was to design a test method that studies the wet area by combining
two pre-existing test methods. The modified equipment shown in figure 7 was created for the
baby laboratory at SCA and can be used to follow liquid distribution. This developed method
will be beneficial for advanced analysis or when studying new products in terms of liquid
distribution. The method was successfully designed by combining the two existing
measurements systems with minor changes for a functional process.
For technical optimization, the x-ray equipment could be made bigger so several diapers can be
tested during one test run making the method more efficient. It takes one hour to test one diaper
so it’s more time-consuming compared to the rewet method that tests 10 products per test run.
If the pressure subjected to the dry sample is automated, then there is no need for heavy lifting
and all the testing can be made inside the cabinet. The method has been simplified by removing
the 1st rewet but these further improvements can make it more time-efficient.
A dosimat that can take more than 50 ml volume would not restrict the method to testing on
specific sizes and enable this method to be used on different diapers regardless of size.
Thickness seemed to have a significant influence so it’s important to be aware of the
compression and permeability of the product. Permeability is not the only controlling factor so
other properties should be taken into account. Decreasing the rewet value gives a drier diaper
keeping the baby's skin dry. The breathability of the diaper allows air to go through the fabric
cooling the climate inside the diaper. Rewet, or relatively the experienced skin wetness is
lowered by breathability preventing skin irritation that comes from dampness.
The weight placed on the product could be automated for further development. This way the
pressure can be more evenly distributed over the wetting area without being affected by core
unevenness such as when being placed manually.
In this thesis, an alternative method has been developed to be applied for following the liquid
distribution while testing rewet, which didn’t exist prior to this experiment. Since the aim was
to combine the rewet method with the distribution of absorption material method, rewet has
been recreated inside the x-ray equipment. The method has been verified by comparing the
results from the developed method to the pre-existing rewet method results. This method will
be a beneficial addition for further understanding and development. The environmental impact
can be reduced when using this method since two measurement systems could now be tested
once, consequently using less products.
50
9. References
Akin, F., Spraker, M., Aly, R., Leyden, J., Raynor, W. & Landin, W. (2001). Effects of
Breathable Disposable Diapers: Reduced Prevalence of Candida and Common Diaper
Dermatitis. Pediatric Dermatology, 18, pp. 282-290. DOI: 10.1046/j.1525-1470.2001.01929.x
Anspach, J., Loftus, J. E. (2015). Association of the nonwoven fabrics industry. ISO 17190‐
5:2001 Polyacrylate Superabsorbent Powders‐ Free Swell Capacity in Saline by Gravimetric
Determination. (INDA).
Anspach, J., Loftus, J. E. (2015). Association of the nonwoven fabrics industry. ISO 17190‐
6:2001 Polyacrylate Superabsorbent Powders‐ Gravimetric Determination of Fluid Retention
Capacity in Saline Solution After Centrifugation. (INDA).
Buchholz, F.L. & Graham, A.T. (1998). Modern superabsorbent polymer technology. New
York: Wiley-VCH.
Edana (2015). GUIDANCE DOCUMENT: NWSP 001.0.R1 (15) Terminology Relating to the
Nonwoven Industry. http://www.inda.org/BIO/htm2015_938.pdf [2017-02-14]
Petrophysics MSc Course Notes. Fluid Saturation and Capillary Pressure.
http://homepages.see.leeds.ac.uk/~earpwjg/PG_EN/CD%20Contents/GGL-
66565%20Petrophysics%20English/Chapter%204.PDF [2017-02-15]
Svenska Cellulosa Aktiebolaget SCA (2016). History.
http://www.sca.com/en/About_SCA/SCA_in_Brief/History/ [2016-10-15]
Svenska Cellulosa Aktiebolaget SCA (2016). Market.
http://www.sca.com/en/About_SCA/SCAs-business-and-operations-
worldwide/Personal_care/Market-SCA-Personal-Care/ [2016-10-14]
Svenska Cellulosa Aktiebolaget SCA (2016). Our history. http://www.sca.com/en/uk/Our-
Company/Our-history/ [2016-10-14]
Svenska Cellulosa Aktiebolaget SCA (2016). SCA at a glance.
http://www.sca.com/en/About_SCA/SCA_in_Brief/ [2016-10-15]
51
SCA (2017). Test method for rewet. [internal material]. Gothenburg: SCA.
SCA (2017). Test method for distribution, absorption material, x-ray. [internal material].
Gothenburg: SCA.
The absorbent hygiene products manufactures committee of EDANA (2007-2008).
Sustainability Report. http://www.edana.org/docs/default-source/default-document-
library/sustainability-report-2007-2008-absorbent-hygiene-products.pdf?sfvrsn=2 [2016-11-
10]
52
Visiting address: Allégatan 1 · Postal address: 501 90 Borås · Contact: 033-435 40 00 · E-mail: [email protected] · Web: www.hb.se