Methane in ocean waters of the Bay of Bengal: its sources ... · its sources and exchange with the...
26
Deep-Sea Research II 50 (2003) 925–950 Methane in ocean waters of the Bay of Bengal: its sources and exchange with the atmosphere Ulrich Berner a, *, J . urgen Poggenburg a , Eckhard Faber a , Detlef Quadfasel b , Andrea Frische c a BGR, Federal Institute for Geosciences and Natural Resources, Stilleweg 2, D-300631 Hannover, Germany b Niels Bohr Institute for Astronomy, Physics and Geophysics, University of Copenhagen, Juliane Maries Vej 30, 2100 Copenhagen, Denmark c IfM, Institute of Oceanography, University of Hamburg, TroplowitzstraX e 7, 22529 Hamburg, Germany Received 29 November 1999; accepted 12 September 2000 Abstract Three legs of cruise SO93 of the German research vessel R/V SONNE provided information on the methane distribution along different profiles of the Bay of Bengal during the NE monsoon in January 1994. A 650-km-long profile from the Sri Lankan coast to the Equator revealed maximum methane concentrations clearly associated with different water masses. Peak concentrations of 105 nl/l occur below 45 m water depth. A 2600-km-long profile from the Equator to the shelf of Bangladesh showed elevated concentrations in the surface waters (up to 800 nl/l on the shelf close to the Ganges/Brahmaputra mouth). Waters at 700 and 2100 m off Bangladesh are enriched in methane. Seismic profiles of the Parasound system point to the existence of a mud diapir at 2100 m, and a seismic wipe out at 700 m points to gas-charged sediments. Sediment gases are assumed to be the source of the methane in the deep water of this area. However, no exchange with the surface waters was observed. Methane contents of the surface waters are related to bacterial processes as shown by isotope data of methane. This newly generated methane only partly contributes to the atmospheric methane concentrations, especially on the shelf of Bangladesh close to the Ganges/Brahmaputra mouth with flux rates of 145 kg km 2 year 1 . Large sections of the profiles, however, showed near-equilibrium conditions and even undersaturation of methane with respect to the atmosphere. r 2003 Elsevier Science Ltd. All rights reserved. 1. Introduction Atmospheric water vapor and carbon dioxide, as they appear in larger quantities in the atmo- sphere, are unquestionably the major absorbers of radiative energy that build up the Earth’s green- house (Graedel and Crutzen, 1993). Among other trace gases, like ozone, nitrous oxide, and chloro- fluorocarbons, that add to the greenhouse-effect, methane plays a significant role and estimates of Houghton et al. (1990) suggest a contribution of 1.7 W m 2 from the present atmospheric methane concentration of 1.73 ppmV (parts per million, atmospheric mixing ratio). *Corresponding author. Fax: +49-511-643-3664. E-mail addresses: [email protected] (U. Berner), dq@gfy. ku.dk (D. Quadfasel), [email protected] (A. Frische). 0967-0645/03/$ - see front matter r 2003 Elsevier Science Ltd. All rights reserved. doi:10.1016/S0967-0645(02)00613-6
Transcript of Methane in ocean waters of the Bay of Bengal: its sources ... · its sources and exchange with the...
Deep-Sea Research II 50 (2003) 925–950
Methane in ocean waters of the Bay of Bengal:its sources and exchange with the atmosphere
Ulrich Bernera,*, J .urgen Poggenburga, Eckhard Fabera,Detlef Quadfaselb, Andrea Frischec
a BGR, Federal Institute for Geosciences and Natural Resources, Stilleweg 2, D-300631 Hannover, Germanyb Niels Bohr Institute for Astronomy, Physics and Geophysics, University of Copenhagen, Juliane Maries Vej 30,
2100 Copenhagen, Denmarkc IfM, Institute of Oceanography, University of Hamburg, TroplowitzstraX e 7, 22529 Hamburg, Germany
Received 29 November 1999; accepted 12 September 2000
Abstract
Three legs of cruise SO93 of the German research vessel R/V SONNE provided information on the methane
distribution along different profiles of the Bay of Bengal during the NE monsoon in January 1994. A 650-km-long
profile from the Sri Lankan coast to the Equator revealed maximum methane concentrations clearly associated with
different water masses. Peak concentrations of 105 nl/l occur below 45 m water depth. A 2600-km-long profile from the
Equator to the shelf of Bangladesh showed elevated concentrations in the surface waters (up to 800 nl/l on the shelf
close to the Ganges/Brahmaputra mouth). Waters at 700 and 2100 m off Bangladesh are enriched in methane. Seismic
profiles of the Parasound system point to the existence of a mud diapir at 2100 m, and a seismic wipe out at 700 m points
to gas-charged sediments. Sediment gases are assumed to be the source of the methane in the deep water of this area.
However, no exchange with the surface waters was observed. Methane contents of the surface waters are related to
bacterial processes as shown by isotope data of methane. This newly generated methane only partly contributes to the
atmospheric methane concentrations, especially on the shelf of Bangladesh close to the Ganges/Brahmaputra mouth
with flux rates of 145 kg km�2 year�1. Large sections of the profiles, however, showed near-equilibrium conditions and
even undersaturation of methane with respect to the atmosphere.
r 2003 Elsevier Science Ltd. All rights reserved.
1. Introduction
Atmospheric water vapor and carbon dioxide,as they appear in larger quantities in the atmo-sphere, are unquestionably the major absorbers of
radiative energy that build up the Earth’s green-house (Graedel and Crutzen, 1993). Among othertrace gases, like ozone, nitrous oxide, and chloro-fluorocarbons, that add to the greenhouse-effect,methane plays a significant role and estimates ofHoughton et al. (1990) suggest a contribution of1.7 W m�2 from the present atmospheric methaneconcentration of 1.73 ppmV (parts per million,atmospheric mixing ratio).
*Corresponding author. Fax: +49-511-643-3664.
E-mail addresses: [email protected] (U. Berner), dq@gfy.
ku.dk (D. Quadfasel), [email protected] (A. Frische).
0967-0645/03/$ - see front matter r 2003 Elsevier Science Ltd. All rights reserved.
doi:10.1016/S0967-0645(02)00613-6

Although methane concentrations are small andthe related present-day greenhouse effect seems tobe low, compared the major constituents watervapor and carbon dioxide, quantifying even theseminor contributions is essential for the under-standing and modeling of climatic changes.Particularly since estimates by Houghton et al.(1990) suggest that methane has a 21-fold higherpotential for global warming than an equalamount of carbon dioxide.
Methane concentrations have increased signifi-cantly during the last 200 years, from 0.7 to1.73 ppmV, especially since 1930 (Rasmussen andKhalil, 1981; Houghton et al., 1990). However, themethane increases nearly stopped at the beginningof this decade for reasons not fully understood.
The increase in concentration relates partly toanthropogenic source; however, data form icecores (Raynaud et al., 1988; Chappellaz, 1990;Chappellaz et al., 1990, 1993, 1997) show that wealso must consider natural fluctuations as theyhave occurred during changes between glacial andinterglacial times. In order to understand thenatural variability of atmospheric methane con-centrations, it is essential to determine thevariability of the natural methane sources andsinks. One uncertainty concerning the globalmethane budget is the estimate of the global fluxfrom the different sources, such as terrestrial andmarine ecosystems, and the contribution ofanthropogenic methane production (fossil fuelcombustion, forest burning, cattle breeding, ricefields). Hein et al. (1997) have given a summaryand demonstrated that methane flux into theatmosphere from different natural sources ishighly variable. However, Hein et al. (1997) didnot incorporate into their considerations theoceanic sources and sinks, as the uncertaintiesare high. According to Crutzen’s (1991) estimates,total methane emissions amount to 640 Tg CH4
per year, while Dlugokencky et al. (1998) calcu-lated 549 Tg CH4 per year on the basis ofatmospheric measurements and Heimann (1997)reports a slightly higher value of 575 Tg CH4 peryear. Modeling of methane emissions amounts,depending on the scenario, to values between 562and 592 Tg CH4 per year, which shows thatuncertainties on global methane emissions are still
high and are in the order of the global atmosphericincreases of more than 33 Tg CH4 per year (Heinet al., 1997; Heimann, 1997).
Oceans and marine coastal areas are a potentialsource of methane and cannot be neglected forconsideration of the global methane balance(Atkinson and Richards, 1967; Scranton andFarrington, 1977; Scranton and Brewer, 1977;Ward et al., 1987; Conrad and Seiler, 1988;Welhan, 1988; Owens et al., 1991; Bange et al.,1994; Faber et al., 1994; Faber et al., 1995; Bangeet al., 1998a, b; Suess et al., 1998). Bange et al.(1998a, b) showed in their compilation (using dataof Ericksson III, 1993 and Liss and Merlivat,1986) that 10.9–17.8 Tg CH4 are emitted from theworld oceans per year, nearly half the atmosphericincrease of 33.4 Tg CH4 per year (Crutzen, 1991;Hein et al., 1997).
Besides being a source of methane, especially incoastal areas, the world oceans also represent asink of this atmospheric trace gas (Faber et al.,1995), which is neglected in global methanebalance considerations and modeling (Heimann,1997; Hein et al., 1997; Dlugokencky et al., 1998)that relay largely on atmospheric hydroxyl-reac-tions and soil uptake as sinks for methane.Significant uncertainties about the amount ofmethane emitted and consumed by the oceans stillexist, due to the high seasonality of methaneemissions and also due to the unknown distributionand the patchiness of marine sources and sinks.
One of the objectives of cruise SO93 of theGerman research vessel R/V SONNE in January1994 to investigate the potential of the Bay ofBengal as a source and/or sink for atmosphericmethane. Three legs provided information fromdifferent areas of the Bay of Bengal not only onthe methane concentrations in the water columnand the atmospheric exchange, but also the possibleexchanges between sediment and ocean waters.The intention of this paper is to give an overviewof the methane inventory of the Bay of Bengal.
2. Oceanographic and regional geological setting
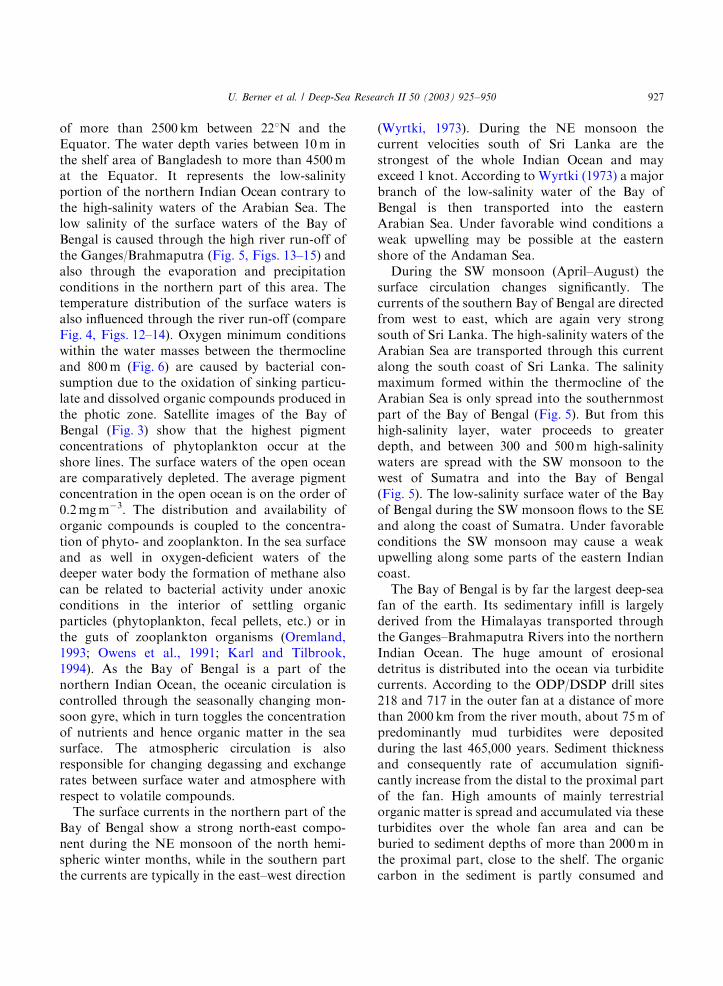
The Bay of Bengal comprises the NE part of theIndian Ocean (Fig. 1) and extends over a distance
U. Berner et al. / Deep-Sea Research II 50 (2003) 925–950926
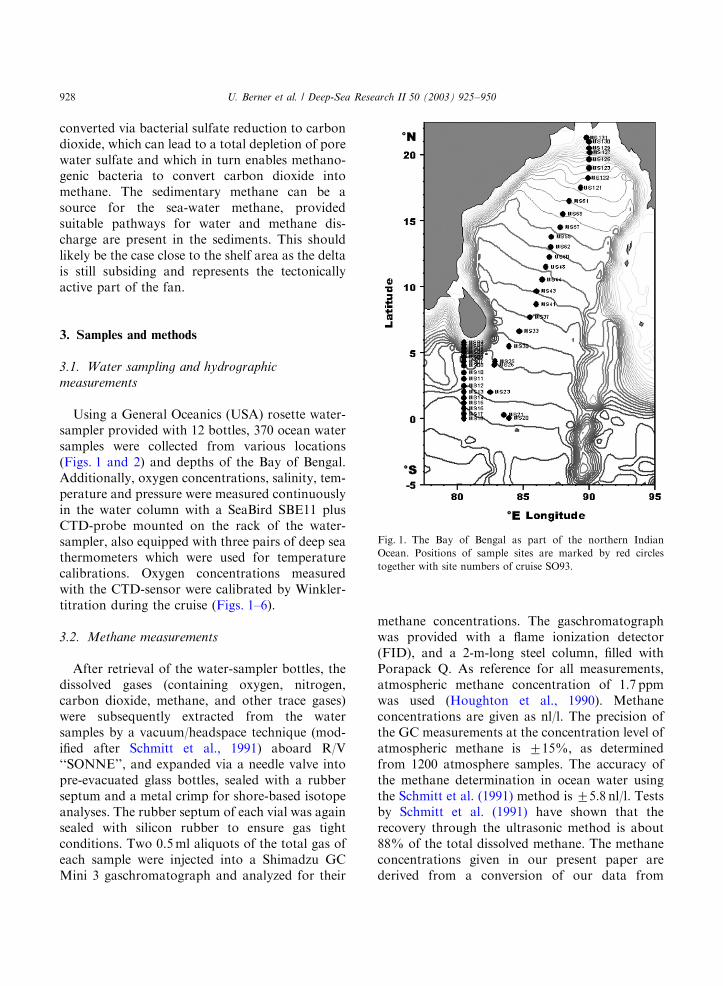
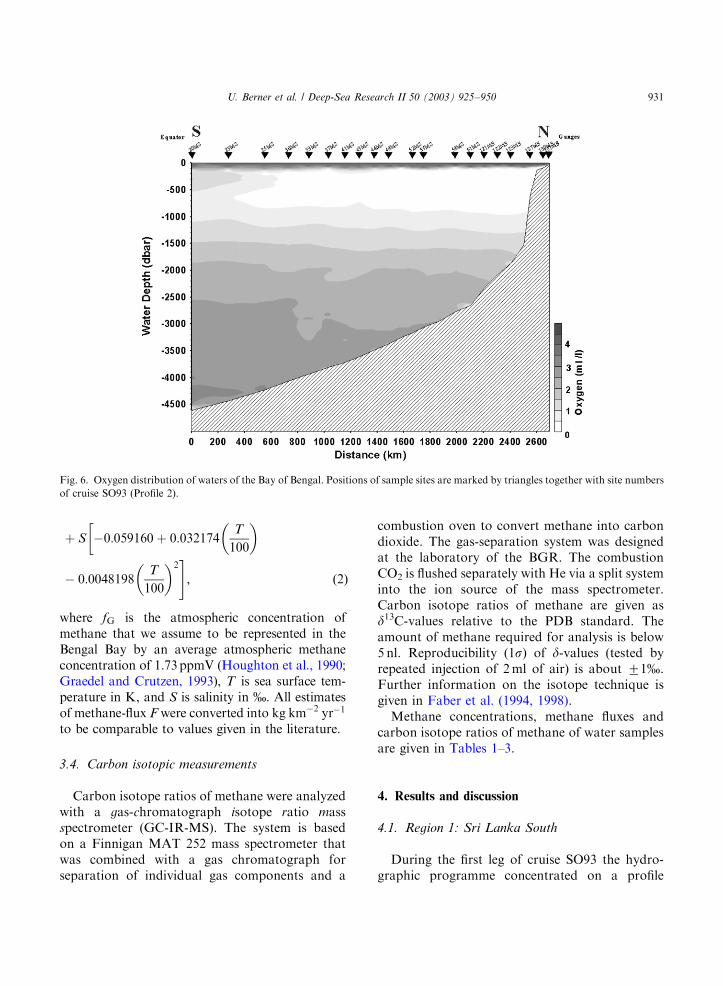
of more than 2500 km between 221N and theEquator. The water depth varies between 10 m inthe shelf area of Bangladesh to more than 4500 mat the Equator. It represents the low-salinityportion of the northern Indian Ocean contrary tothe high-salinity waters of the Arabian Sea. Thelow salinity of the surface waters of the Bay ofBengal is caused through the high river run-off ofthe Ganges/Brahmaputra (Fig. 5, Figs. 13–15) andalso through the evaporation and precipitationconditions in the northern part of this area. Thetemperature distribution of the surface waters isalso influenced through the river run-off (compareFig. 4, Figs. 12–14). Oxygen minimum conditionswithin the water masses between the thermoclineand 800 m (Fig. 6) are caused by bacterial con-sumption due to the oxidation of sinking particu-late and dissolved organic compounds produced inthe photic zone. Satellite images of the Bay ofBengal (Fig. 3) show that the highest pigmentconcentrations of phytoplankton occur at theshore lines. The surface waters of the open oceanare comparatively depleted. The average pigmentconcentration in the open ocean is on the order of0.2 mg m�3. The distribution and availability oforganic compounds is coupled to the concentra-tion of phyto- and zooplankton. In the sea surfaceand as well in oxygen-deficient waters of thedeeper water body the formation of methane alsocan be related to bacterial activity under anoxicconditions in the interior of settling organicparticles (phytoplankton, fecal pellets, etc.) or inthe guts of zooplankton organisms (Oremland,1993; Owens et al., 1991; Karl and Tilbrook,1994). As the Bay of Bengal is a part of thenorthern Indian Ocean, the oceanic circulation iscontrolled through the seasonally changing mon-soon gyre, which in turn toggles the concentrationof nutrients and hence organic matter in the seasurface. The atmospheric circulation is alsoresponsible for changing degassing and exchangerates between surface water and atmosphere withrespect to volatile compounds.
The surface currents in the northern part of theBay of Bengal show a strong north-east compo-nent during the NE monsoon of the north hemi-spheric winter months, while in the southern partthe currents are typically in the east–west direction
(Wyrtki, 1973). During the NE monsoon thecurrent velocities south of Sri Lanka are thestrongest of the whole Indian Ocean and mayexceed 1 knot. According to Wyrtki (1973) a majorbranch of the low-salinity water of the Bay ofBengal is then transported into the easternArabian Sea. Under favorable wind conditions aweak upwelling may be possible at the easternshore of the Andaman Sea.
During the SW monsoon (April–August) thesurface circulation changes significantly. Thecurrents of the southern Bay of Bengal are directedfrom west to east, which are again very strongsouth of Sri Lanka. The high-salinity waters of theArabian Sea are transported through this currentalong the south coast of Sri Lanka. The salinitymaximum formed within the thermocline of theArabian Sea is only spread into the southernmostpart of the Bay of Bengal (Fig. 5). But from thishigh-salinity layer, water proceeds to greaterdepth, and between 300 and 500 m high-salinitywaters are spread with the SW monsoon to thewest of Sumatra and into the Bay of Bengal(Fig. 5). The low-salinity surface water of the Bayof Bengal during the SW monsoon flows to the SEand along the coast of Sumatra. Under favorableconditions the SW monsoon may cause a weakupwelling along some parts of the eastern Indiancoast.
The Bay of Bengal is by far the largest deep-seafan of the earth. Its sedimentary infill is largelyderived from the Himalayas transported throughthe Ganges–Brahmaputra Rivers into the northernIndian Ocean. The huge amount of erosionaldetritus is distributed into the ocean via turbiditecurrents. According to the ODP/DSDP drill sites218 and 717 in the outer fan at a distance of morethan 2000 km from the river mouth, about 75 m ofpredominantly mud turbidites were depositedduring the last 465,000 years. Sediment thicknessand consequently rate of accumulation signifi-cantly increase from the distal to the proximal partof the fan. High amounts of mainly terrestrialorganic matter is spread and accumulated via theseturbidites over the whole fan area and can beburied to sediment depths of more than 2000 m inthe proximal part, close to the shelf. The organiccarbon in the sediment is partly consumed and
U. Berner et al. / Deep-Sea Research II 50 (2003) 925–950 927
converted via bacterial sulfate reduction to carbondioxide, which can lead to a total depletion of porewater sulfate and which in turn enables methano-genic bacteria to convert carbon dioxide intomethane. The sedimentary methane can be asource for the sea-water methane, providedsuitable pathways for water and methane dis-charge are present in the sediments. This shouldlikely be the case close to the shelf area as the deltais still subsiding and represents the tectonicallyactive part of the fan.
3. Samples and methods
3.1. Water sampling and hydrographic
measurements
Using a General Oceanics (USA) rosette water-sampler provided with 12 bottles, 370 ocean watersamples were collected from various locations(Figs. 1 and 2) and depths of the Bay of Bengal.Additionally, oxygen concentrations, salinity, tem-perature and pressure were measured continuouslyin the water column with a SeaBird SBE11 plusCTD-probe mounted on the rack of the water-sampler, also equipped with three pairs of deep seathermometers which were used for temperaturecalibrations. Oxygen concentrations measuredwith the CTD-sensor were calibrated by Winkler-titration during the cruise (Figs. 1–6).
3.2. Methane measurements
After retrieval of the water-sampler bottles, thedissolved gases (containing oxygen, nitrogen,carbon dioxide, methane, and other trace gases)were subsequently extracted from the watersamples by a vacuum/headspace technique (mod-ified after Schmitt et al., 1991) aboard R/V‘‘SONNE’’, and expanded via a needle valve intopre-evacuated glass bottles, sealed with a rubberseptum and a metal crimp for shore-based isotopeanalyses. The rubber septum of each vial was againsealed with silicon rubber to ensure gas tightconditions. Two 0.5 ml aliquots of the total gas ofeach sample were injected into a Shimadzu GCMini 3 gaschromatograph and analyzed for their
methane concentrations. The gaschromatographwas provided with a flame ionization detector(FID), and a 2-m-long steel column, filled withPorapack Q. As reference for all measurements,atmospheric methane concentration of 1.7 ppmwas used (Houghton et al., 1990). Methaneconcentrations are given as nl/l. The precision ofthe GC measurements at the concentration level ofatmospheric methane is 715%, as determinedfrom 1200 atmosphere samples. The accuracy ofthe methane determination in ocean water usingthe Schmitt et al. (1991) method is 75.8 nl/l. Testsby Schmitt et al. (1991) have shown that therecovery through the ultrasonic method is about88% of the total dissolved methane. The methaneconcentrations given in our present paper arederived from a conversion of our data from
Fig. 1. The Bay of Bengal as part of the northern Indian
Ocean. Positions of sample sites are marked by red circles
together with site numbers of cruise SO93.
U. Berner et al. / Deep-Sea Research II 50 (2003) 925–950928

ultrasonic treatment into absolute values based ona calibration study between different laboratoriesin Hamburg (Institute for Biogeochemistry andMarine Chemistry), Kiel (GEOMAR) and Hann-over (BGR) (cf. Michaelis et al., 1993).
3.3. Methane flux calculations
The flux of gas from the sea surface to theatmosphere is controlled by wind speed, sea-surface temperature, and equilibrium conditionsbetween sea and atmosphere. We calculate thesea–air flux of methane F from the equation ofWanninkhof (1992)
F ¼0:31u2DCffiffiffiffiffiffiffiffiffiffiffiffiffiffiffiffiffiffiffiffiffiffiffiffiffiffiffiffiffiffiffiffiffiffiffiffiffiffiffiffiffiffiffiffiffiffiffiffiffiffiffiffiffiffiffiffiffiffiffiffiffiffiffiffiffiffiffiffiffiffiffiffiffiffiffiffiffiffiffiffiffiffiffiffiffiffiffiffiffiffiffiffiffi
2039:2 � 120:31TC þ 3:4209T2C � 0:040437T3
C
660
rð1Þ
where u is the wind speed (m/s), TC is the sea-surface temperature in 1C, and DC is the differencebetween measured concentrations and equilibriumsolubility of methane. Wind speed and sea-surfacetemperature were monitored routinely during thecruise. Equilibrium solubilities C (nl/l) that arerelated to sea surface temperature and salinitywere computed from the equation of Wiesenburgand Guinasso (1979)
ln C ¼ ln fG � 412:171 þ 596:8104100
T
� �
þ 379:2599 lnT
100
� �� 62:0757
T
100
� �
Fig. 2. The Ganges–Brahmaputra delta of the northern Bay of Bengal. Positions of shelf sites are marked by red circles together with
the site numbers of cruise SO93.
Fig. 3. Composite satellite image of the phytoplankton pigment
distribution of surface waters of the western Bay of Bengal on
December 29, 1985 (courtesy CRSA, USA).
U. Berner et al. / Deep-Sea Research II 50 (2003) 925–950 929
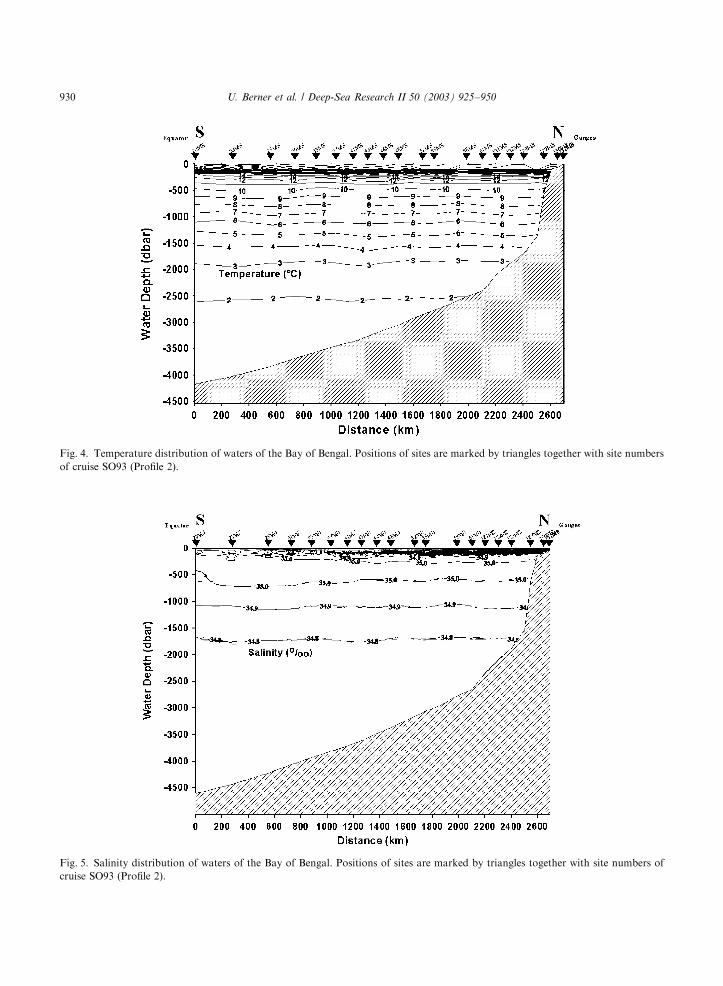
Fig. 4. Temperature distribution of waters of the Bay of Bengal. Positions of sites are marked by triangles together with site numbers
of cruise SO93 (Profile 2).
Fig. 5. Salinity distribution of waters of the Bay of Bengal. Positions of sites are marked by triangles together with site numbers of
cruise SO93 (Profile 2).
U. Berner et al. / Deep-Sea Research II 50 (2003) 925–950930
þ S �0:059160 þ 0:032174T
100
� ��
� 0:0048198T
100
� �2#; ð2Þ
where fG is the atmospheric concentration ofmethane that we assume to be represented in theBengal Bay by an average atmospheric methaneconcentration of 1.73 ppmV (Houghton et al., 1990;Graedel and Crutzen, 1993), T is sea surface tem-perature in K, and S is salinity in %. All estimatesof methane-flux F were converted into kg km�2 yr�1
to be comparable to values given in the literature.
3.4. Carbon isotopic measurements
Carbon isotope ratios of methane were analyzedwith a gas-chromatograph isotope ratio massspectrometer (GC-IR-MS). The system is basedon a Finnigan MAT 252 mass spectrometer thatwas combined with a gas chromatograph forseparation of individual gas components and a
combustion oven to convert methane into carbondioxide. The gas-separation system was designedat the laboratory of the BGR. The combustionCO2 is flushed separately with He via a split systeminto the ion source of the mass spectrometer.Carbon isotope ratios of methane are given asd13C-values relative to the PDB standard. Theamount of methane required for analysis is below5 nl. Reproducibility (1s) of d-values (tested byrepeated injection of 2 ml of air) is about 71%.Further information on the isotope technique isgiven in Faber et al. (1994, 1998).
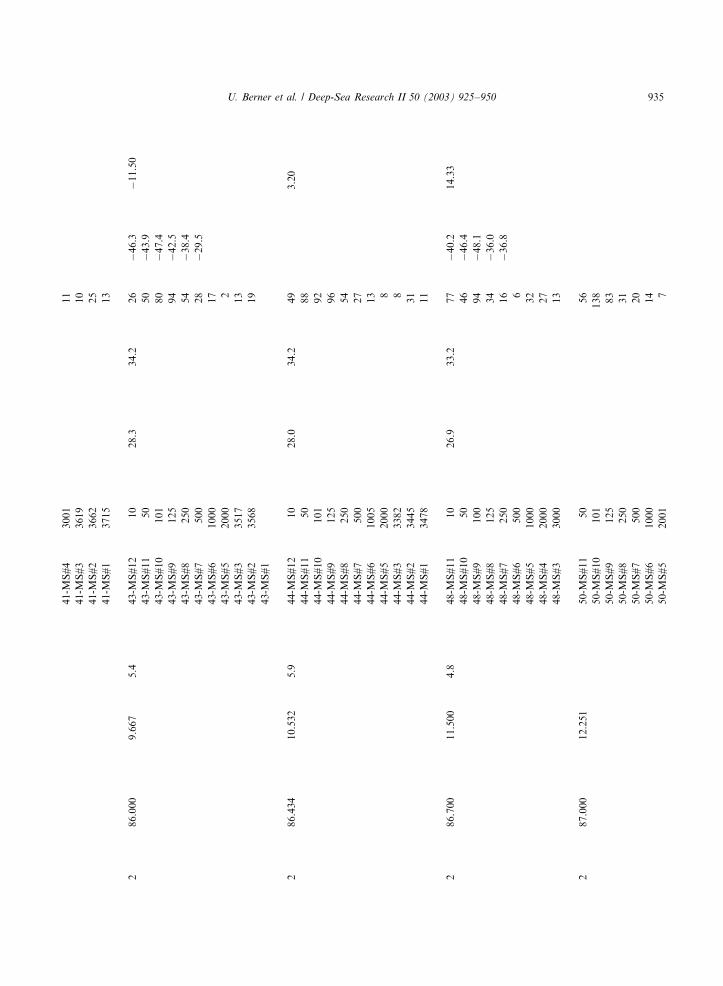
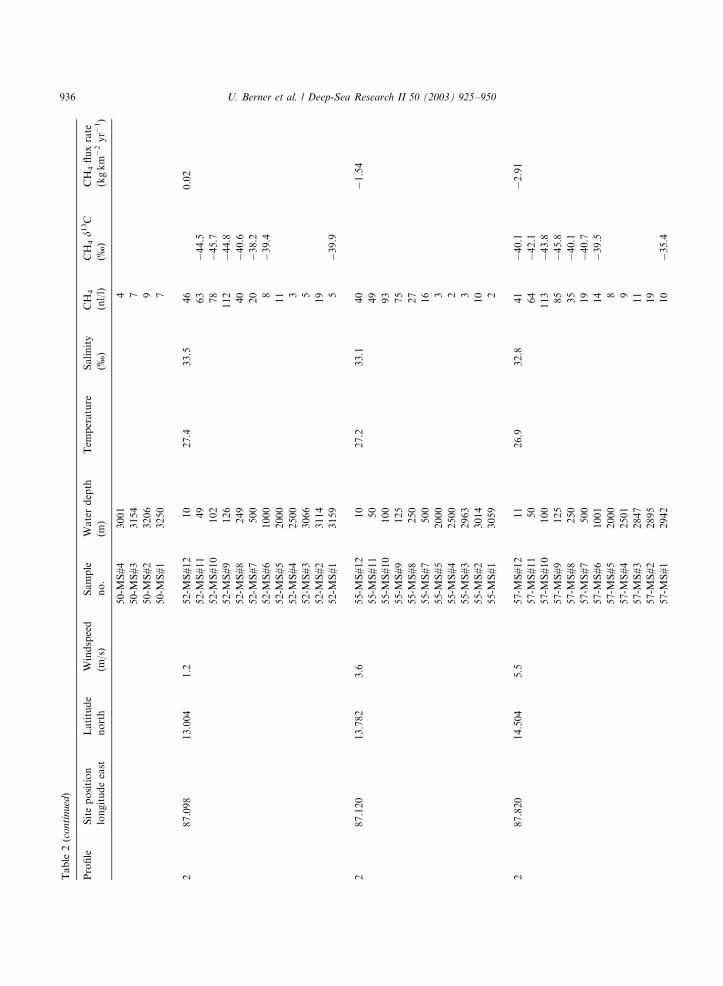
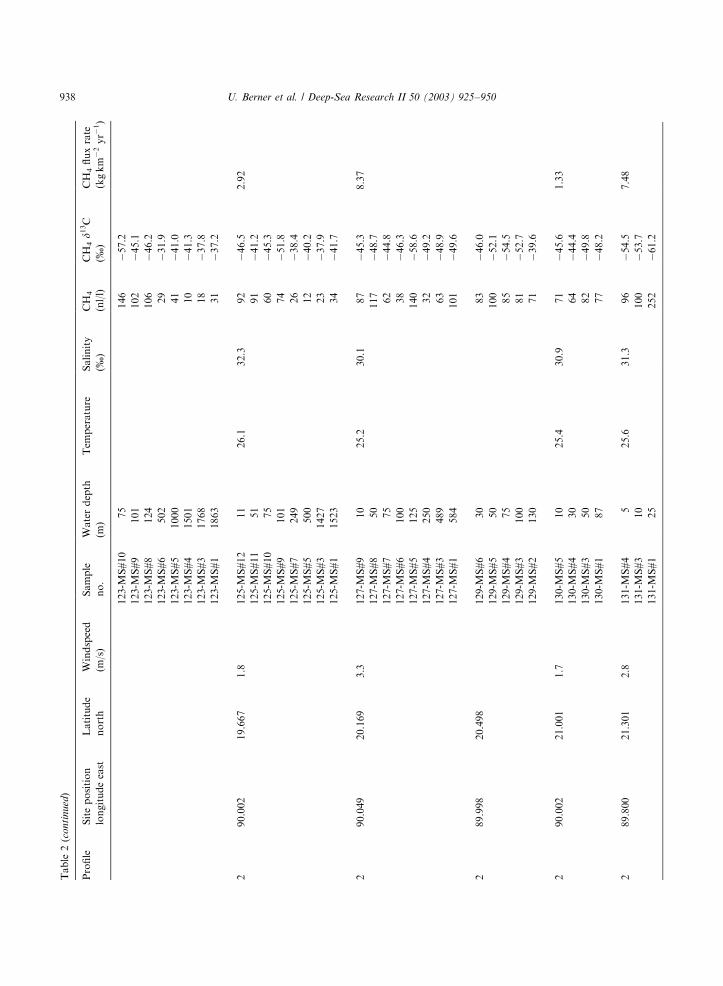
Methane concentrations, methane fluxes andcarbon isotope ratios of methane of water samplesare given in Tables 1–3.
4. Results and discussion
4.1. Region 1: Sri Lanka South
During the first leg of cruise SO93 the hydro-graphic programme concentrated on a profile
Fig. 6. Oxygen distribution of waters of the Bay of Bengal. Positions of sample sites are marked by triangles together with site numbers
of cruise SO93 (Profile 2).
U. Berner et al. / Deep-Sea Research II 50 (2003) 925–950 931

Tab
le1
Sam
ple
site
so
fth
eso
uth
ern
Bay
of
Ben
gal
off
sho
reS
hri
Lan
ka
(Pro
file
1,
Cru
ise
SO
93)
Pro
file
no
.
Sit
ep
osi
tio
n
lon
git
ud
eea
st
Latt
itu
de
no
rth
Win
dsp
eed
(m/s
)
Sam
ple
no
.
Wate
rd
epth
(m)
Tem
per
atu
re
(1C
)
Salin
ity
(%)
M! et
han
e
(nl/
l)
Met
han
efl
ux
rate
(kg
km
�2
yr�
1)
180.4
85
5.6
36
0.8
03-M
S#
12
10
27.0
33.1
73
0.3
5
03-M
S#
11
50
52
03-M
S#
9100
109
180.4
93
5.3
36
0.9
04-M
S#
12
10
27.7
34.1
55
0.1
7
04-M
S#
11
50
63
04-M
S#
10
100
79
04-M
S#
9150
78
180.4
91
5.0
36
05-M
S#
11
50
60
05-M
S#
10
100
76
05-M
S#
9125
59
180.4
97
4.6
70
4.8
06-M
S#
12
10
28.3
35.4
48
1.6
9
06-M
S#
11
50
56
06-M
S#
10
100
78
06-M
S#
9125
56
180.4
98
4.0
40
8.4
08-M
S#
12
10
28.1
35.4
38
�9.9
8
08-M
S#
11
50
68
08-M
S#
10
100
70
08-M
S#
9125
96
180.4
96
3.4
97
3.9
10-M
S#
12
10
28.1
35.4
37
�2.3
9
10-M
S#
11
50
71
10-M
S#
10
100
59
10-M
S#
9125
60
180.4
99
2.0
31
2.1
13-M
S#
12
10
28.2
35.2
39
�0.4
8
13-M
S#
11
50
35
13-M
S#
10
100
46
13-M
S#
9125
39
180.4
93
1.5
79
6.2
14-M
S#
12
10
28.1
35.2
32
�9.5
2
14-M
S#
10
100
44
14-M
S#
9125
58
180.5
03
1.1
86
5.0
15-M
S#
12
10
28.3
35.0
37
�3.6
5
15-M
S#
11
50
97
15-M
S#
10
100
93
15-M
S#
9125
56
180.4
99
0.0
30
3.7
18-M
S#
12
10
28.4
35.2
32
�3.4
7
18-M
S#
11
50
65
18-M
S#
10
100
51
18-M
S#
9125
34
U. Berner et al. / Deep-Sea Research II 50 (2003) 925–950932

Tab
le2
Sam
ple
site
so
fth
eB
ay
of
Ben
gal
(Pro
file
2,
Cru
ise
SO
93)
Pro
file
Sit
ep
osi
tio
n
lon
git
ud
eea
st
Lati
tud
e
no
rth
Win
dsp
eed
(m/s
)
Sam
ple
no
.
Wate
rd
epth
(m)
Tem
per
atu
re
(1C
)
Salin
ity
(%)
CH
4
(nl/
l)
CH
4d1
3C
(%)
CH
4fl
ux
rate
(kg
km
�2
yr�
1)
283.9
20
0.0
45
5.1
20-M
S#
10
10
28.7
35.1
75
�45.5
�0.3
8
20-M
S#
9100
58
20-M
S#
8125
85
�38.4
20-M
S#
7500
48
20-M
S#
61000
96
�26.4
20-M
S#
52000
47
�25.7
20-M
S#
43000
9
20-M
S#
24511
133
20-M
S#
14606
35
�31.4
282.4
97
2.0
08
2.5
23-M
S#
12
10
28.6
35.2
67
�46.1
0.8
4
23-M
S#
11
50
102
�39.5
23-M
S#
10
100
84
�39.7
23-M
S#
9125
29
23-M
S#
8500
25
23-M
S#
71000
110
�27.3
23-M
S#
62000
74
�31.1
23-M
S#
53000
28
23-M
S#
44001
12
23-M
S#
34331
30
23-M
S#
24390
37
23-M
S#
14435
34
282.8
69
4.3
39
1.2
25-M
S#
11
10
28.6
34.8
100
�42.6
0.9
7
25-M
S#
10
50
72
�45.1
25-M
S#
9100
78
�46.9
25-M
S#
8125
51
25-M
S#
7500
65
25-M
S#
61000
28
�30.2
25-M
S#
52000
19
25-M
S#
43000
18
25-M
S#
34000
24
25-M
S#
24141
38
25-M
S#
14186
16
25-M
S#
12
4233
2
283.9
14
5.5
01
7.9
30-M
S#
12
10
28.4
34.5
57
�1.6
5
30-M
S#
11
50
170
30-M
S#
10
100
70
30-M
S#
9125
109
U. Berner et al. / Deep-Sea Research II 50 (2003) 925–950 933

30-M
S#
71001
34
30-M
S#
62200
48
30-M
S#
52850
10
30-M
S#
43301
20
30-M
S#
33965
21
30-M
S#
24012
20
30-M
S#
14064
14
284.7
03
6.6
31
9.2
33-M
S#
12
10
27.9
34.4
41
�24.5
7
33-M
S#
11
50
65
�39.4
33-M
S#
10
100
60
�44.0
33-M
S#
9125
90
�46.0
33-M
S#
8500
37
�27.6
33-M
S#
7999
33
33-M
S#
62001
22
33-M
S#
53000
17
33-M
S#
43500
11
33-M
S#
33832
20
33-M
S#
23882
37
�34.3
33-M
S#
13937
23
�43.0
285.5
00
7.6
71
7.9
37-M
S#
12
10
27.8
34.2
40
�6.0
7
37-M
S#
ll50
126
�46.5
37-M
S#
10
100
64
�41.8
37-M
S#
9125
33
37-M
S#
8251
32
�30.4
37-M
S#
71000
8
37-M
S#
62000
19
37-M
S#
53000
9
37-M
S#
43715
18
37-M
S#
33767
16
37-M
S#
23812
22
�39.1
285.9
91
8.6
73
8.6
41-M
S#
12
10
28.4
34.2
48
5.3
5
41-M
S#
11
50
63
41-M
S#
10
100
64
41-M
S#
9125
101
41-M
S#
8250
57
41-M
S#
7500
23
41-M
S#
61000
15
41-M
S#
52000
9
Tab
le2
(co
nti
nu
ed)
Pro
file
Sit
ep
osi
tio
n
lon
git
ud
eea
st
Lati
tud
e
no
rth
Win
dsp
eed
(m/s
)
Sam
ple
no
.
Wate
rd
epth
(m)
Tem
per
atu
reS
alin
ity
(%)
CH
4
(nl/
l)
CH
4d1
3C
(%)
CH
4fl
ux
rate
(kg
km
�2
yr�
1)
U. Berner et al. / Deep-Sea Research II 50 (2003) 925–950934
41-M
S#
43001
11
41-M
S#
33619
10
41-M
S#
23662
25
41-M
S#
13715
13
286.0
00
9.6
67
5.4
43-M
S#
12
10
28.3
34.2
26
�46.3
�11.5
0
43-M
S#
11
50
50
�43.9
43-M
S#
10
101
80
�47.4
43-M
S#
9125
94
�42.5
43-M
S#
8250
54
�38.4
43-M
S#
7500
28
�29.5
43-M
S#
61000
17
43-M
S#
52000
2
43-M
S#
33517
13
43-M
S#
23568
19
43-M
S#
1
286.4
34
10.5
32
5.9
44-M
S#
12
10
28.0
34.2
49
3.2
0
44-M
S#
11
50
88
44-M
S#
10
101
92
44-M
S#
9125
96
44-M
S#
8250
54
44-M
S#
7500
27
44-M
S#
61005
13
44-M
S#
52000
8
44-M
S#
33382
8
44-M
S#
23445
31
44-M
S#
13478
11
286.7
00
11.5
00
4.8
48-M
S#
11
10
26.9
33.2
77
�40.2
14.3
3
48-M
S#
10
50
46
�46.4
48-M
S#
9100
94
�48.1
48-M
S#
8125
34
�36.0
48-M
S#
7250
16
�36.8
48-M
S#
6500
6
48-M
S#
51000
32
48-M
S#
42000
27
48-M
S#
33000
13
287.0
00
12.2
51
50-M
S#
11
50
56
50-M
S#
10
101
138
50-M
S#
9125
83
50-M
S#
8250
31
50-M
S#
7500
20
50-M
S#
61000
14
50-M
S#
52001
7
U. Berner et al. / Deep-Sea Research II 50 (2003) 925–950 935
Tab
le2
(co
nti
nu
ed)
Pro
file
Sit
ep
osi
tio
n
lon
git
ud
eea
st
Lati
tud
e
no
rth
Win
dsp
eed
(m/s
)
Sam
ple
no
.
Wate
rd
epth
(m)
Tem
per
atu
reS
alin
ity
(%)
CH
4
(nl/
l)
CH
4d1
3C
(%)
CH
4fl
ux
rate
(kg
km
�2
yr�
1)
50-M
S#
43001
4
50-M
S#
33154
7
50-M
S#
23206
9
50-M
S#
13250
7
287.0
98
13.0
04
1.2
52-M
S#
12
10
27.4
33.5
46
0.0
2
52-M
S#
11
49
63
�44.5
52-M
S#
10
102
78
�45.7
52-M
S#
9126
112
�44.8
52-M
S#
8249
40
�40.6
52-M
S#
7500
20
�38.2
52-M
S#
61000
8�
39.4
52-M
S#
52000
11
52-M
S#
42500
3
52-M
S#
33066
5
52-M
S#
23114
19
52-M
S#
13159
5�
39.9
287.1
20
13.7
82
3.6
55-M
S#
12
10
27.2
33.1
40
�1.5
4
55-M
S#
11
50
49
55-M
S#
10
100
93
55-M
S#
9125
75
55-M
S#
8250
27
55-M
S#
7500
16
55-M
S#
52000
3
55-M
S#
42500
2
55-M
S#
32963
3
55-M
S#
23014
10
55-M
S#
13059
2
287.8
20
14.5
04
5.5
57-M
S#
12
11
26.9
32.8
41
�40.1
�2.9
1
57-M
S#
11
50
64
�42.1
57-M
S#
10
100
113
�43.8
57-M
S#
9125
85
�45.8
57-M
S#
8250
35
�40.1
57-M
S#
7500
19
�40.7
57-M
S#
61001
14
�39.5
57-M
S#
52000
8
57-M
S#
42501
9
57-M
S#
32847
11
57-M
S#
22895
19
57-M
S#
12942
10
�35.4
U. Berner et al. / Deep-Sea Research II 50 (2003) 925–950936

288.0
01
15.5
18
2.7
58-M
S#
12
10
26.1
31.6
57
1.4
1
58-M
S#
11
50
71
58-M
S#
10
101
125
58-M
S#
9123
81
58-M
S#
8250
21
58-M
S#
7500
17
58-M
S#
61000
15
58-M
S#
52000
3
58-M
S#
42500
6
58-M
S#
32680
5
58-M
S#
22730
1
58-M
S#
12775
6
288.4
97
16.5
01
5.9
61-M
S#
12
10
26.1
32.7
39
�40.1
�5.1
0
61-M
S#
11
50
62
�38.7
61-M
S#
10
100
141
�43.3
61-M
S#
9125
82
�40.2
61-M
S#
8250
34
�33.7
61-M
S#
7500
18
�35.5
61-M
S#
61001
8�
34.5
61-M
S#
52001
10
61-M
S#
42500
9
61-M
S#
32555
8
61-M
S#
22605
19
61-M
S#
12651
4�
37.6
289.3
64
17.5
03
6.0
121-M
S#
12
10
26.0
32.1
55
�42.8
5.5
9
121-M
S#
11
50
90
�42.1
121-M
S#
10
100
77
�46.8
121-M
S#
9125
58
�44.3
121-M
S#
7250
22
�34.7
121-M
S#
51000
20
�32.2
121-M
S#
42000
33
�41.1
121-M
S#
12319
43
�42.1
289.9
16
18.2
52
4.8
122-M
S#
12
10
25.1
30.4
67
�43.8
8.4
8
122-M
S#
11
75
92
�49.1
122-M
S#
10
100
57
�44.9
122-M
S#
9125
41
�41.1
122-M
S#
7250
12
�40.2
122-M
S#
51000
20
�40.6
122-M
S#
32000
62
�46.4
122-M
S#
12081
52
�43.7
290.0
02
19.0
02
6.7
123-M
S#
12
10
25.0
29.8
80
�43.8
27.5
3
123-M
S#
11
50
117
�47.0
U. Berner et al. / Deep-Sea Research II 50 (2003) 925–950 937
Tab
le2
(co
nti
nu
ed)
Pro
file
Sit
ep
osi
tio
n
lon
git
ud
eea
st
Lati
tud
e
no
rth
Win
dsp
eed
(m/s
)
Sam
ple
no
.
Wate
rd
epth
(m)
Tem
per
atu
reS
alin
ity
(%)
CH
4
(nl/
l)
CH
4d1
3C
(%)
CH
4fl
ux
rate
(kg
km
�2
yr�
1)
123-M
S#
10
75
146
�57.2
123-M
S#
9101
102
�45.1
123-M
S#
8124
106
�46.2
123-M
S#
6502
29
�31.9
123-M
S#
51000
41
�41.0
123-M
S#
41501
10
�41.3
123-M
S#
31768
18
�37.8
123-M
S#
11863
31
�37.2
290.0
02
19.6
67
1.8
125-M
S#
12
11
26.1
32.3
92
�46.5
2.9
2
125-M
S#
11
51
91
�41.2
125-M
S#
10
75
60
�45.3
125-M
S#
9101
74
�51.8
125-M
S#
7249
26
�38.4
125-M
S#
5500
12
�40.2
125-M
S#
31427
23
�37.9
125-M
S#
11523
34
�41.7
290.0
49
20.1
69
3.3
127-M
S#
910
25.2
30.1
87
�45.3
8.3
7
127-M
S#
850
117
�48.7
127-M
S#
775
62
�44.8
127-M
S#
6100
38
�46.3
127-M
S#
5125
140
�58.6
127-M
S#
4250
32
�49.2
127-M
S#
3489
63
�48.9
127-M
S#
1584
101
�49.6
289.9
98
20.4
98
129-M
S#
630
83
�46.0
129-M
S#
550
100
�52.1
129-M
S#
475
85
�54.5
129-M
S#
3100
81
�52.7
129-M
S#
2130
71
�39.6
290.0
02
21.0
01
1.7
130-M
S#
510
25.4
30.9
71
�45.6
1.3
3
130-M
S#
430
64
�44.4
130-M
S#
350
82
�49.8
130-M
S#
187
77
�48.2
289.8
00
21.3
01
2.8
131-M
S#
45
25.6
31.3
96
�54.5
7.4
8
131-M
S#
310
100
�53.7
131-M
S#
125
252
�61.2
U. Berner et al. / Deep-Sea Research II 50 (2003) 925–950938

Tab
le3
Sam
ple
site
so
fth
en
ort
her
nB
ay
of
Ben
gal
(Ben
gal
Sh
elf)
off
sho
reB
an
gla
des
h(P
rofi
les
3to
5,
Cru
ise
SO
93)
Pro
file
no
.
Sit
ep
osi
tio
n
lon
git
ud
eea
st
Lati
tud
e
no
rth
Win
dsp
eed
(m/s
)
Sam
ple
no
.
Wate
rd
epth
(m)
Tem
per
atu
re
(1C
)
Salin
ity
(%)
Met
han
e
(nl/
l)
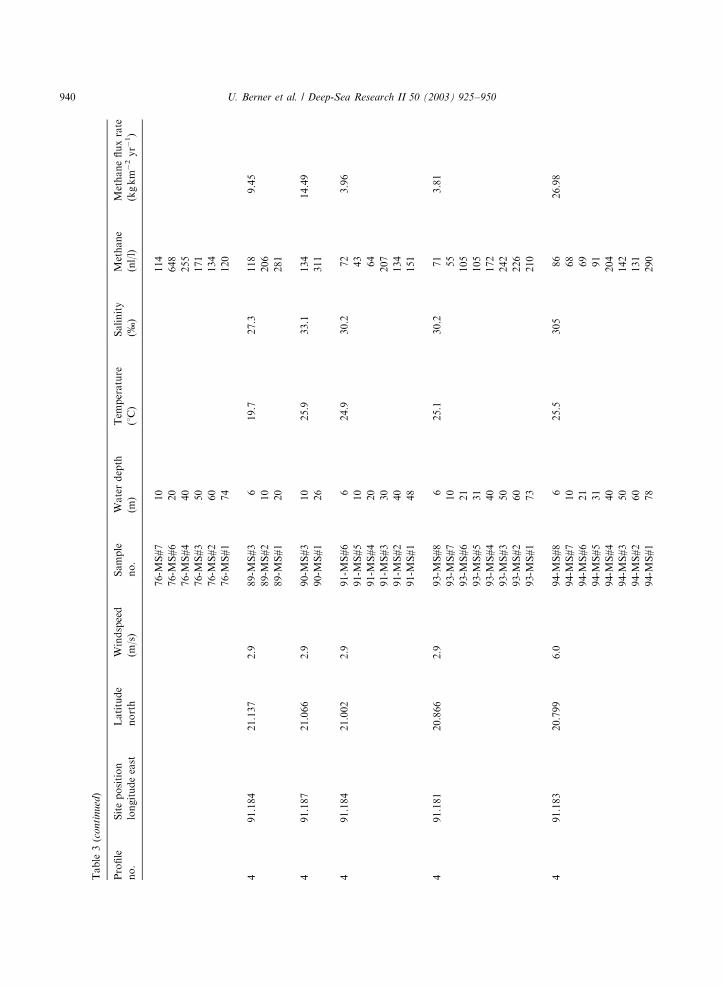
Met
han
efl
ux
rate
(kg
km
�2
yr�
1)
391.9
35
20.8
64
10.1
64-M
S#
94
24.7
30.4
102
106.2
8
64-M
S#
710
83
64-M
S#
521
211
64-M
S#
330
197
64-M
S#
133
232
391.8
45
20.8
67
10.1
65-M
S#
66
25.4
30.9
120
145.3
9
65-M
S#
510
79
65-M
S#
420
156
65-M
S#
330
232
65-M
S#
240
399
65-M
S#
142
360
391.7
51
20.8
50
7.9
67-M
S#
75
24.6
30.2
96
56.9
2
67-M
S#
610
111
67-M
S#
520
115
67-M
S#
430
200
67-M
S#
340
345
67-M
S#
250
418
67-M
S#
159
378
391.6
00
20.8
37
4.9
73-M
S#
85
24.9
30.2
107
27.2
9
73-M
S#
710
87
73-M
S#
620
287
73-M
S#
530
212
73-M
S#
440
152
73-M
S#
350
210
73-M
S#
260
216
73-M
S#
166
185
391.5
09
20.8
54
4.9
74-M
S#
85
24.6
30.0
118
31.9
6
74-M
S#
710
152
74-M
S#
620
178
74-M
S#
530
288
74-M
S#
440
389
74-M
S#
350
310
74-M
S#
260
201
74-M
S#
170
155
391.2
51
20.8
94
5.3
76-M
S#
85
24.6
29.6
90
22.5
0
U. Berner et al. / Deep-Sea Research II 50 (2003) 925–950 939
76-M
S#
710
114
76-M
S#
620
648
76-M
S#
440
255
76-M
S#
350
171
76-M
S#
260
134
76-M
S#
174
120
491.1
84
21.1
37
2.9
89-M
S#
36
19.7
27.3
118
9.4
5
89-M
S#
210
206
89-M
S#
120
281
491.1
87
21.0
66
2.9
90-M
S#
310
25.9
33.1
134
14.4
9
90-M
S#
126
311
491.1
84
21.0
02
2.9
91-M
S#
66
24.9
30.2
72
3.9
6
91-M
S#
510
43
91-M
S#
420
64
91-M
S#
330
207
91-M
S#
240
134
91-M
S#
148
151
491.1
81
20.8
66
2.9
93-M
S#
86
25.1
30.2
71
3.8
1
93-M
S#
710
55
93-M
S#
621
105
93-M
S#
531
105
93-M
S#
440
172
93-M
S#
350
242
93-M
S#
260
226
93-M
S#
173
210
491.1
83
20.7
99
6.0
94-M
S#
86
25.5
305
86
26.9
8
94-M
S#
710
68
94-M
S#
621
69
94-M
S#
531
91
94-M
S#
440
204
94-M
S#
350
142
94-M
S#
260
131
94-M
S#
178
290
Tab
le3
(co
nti
nu
ed)
Pro
file
no
.
Sit
ep
osi
tio
n
lon
git
ud
eea
st
Lati
tud
e
no
rth
Win
dsp
eed
(m/s
)
Sam
ple
no
.
Wate
rd
epth
(m)
Tem
per
atu
re
(1C
)
Salin
ity
(%)
Met
han
e
(nl/
l)
Met
han
efl
ux
rate
(kg
km
�2
yr�
1)
U. Berner et al. / Deep-Sea Research II 50 (2003) 925–950940
589.6
06
21.4
42
2.4
97-M
S#
55
24.5
30.1
858
89.6
1
97-M
S#
320
836
97-M
S#
140
573
589.5
80
21.3
99
98-M
S#
4100
105
98-M
S#
3125
127
98-M
S#
2150
102
98-M
S#
1164
116
589.4
59
21.2
41
0.8
100-M
S#
12
10
25.0
30.5
135
1.0
8
100-M
S#
11
30
420
100-M
S#
10
50
216
100-M
S#
9100
149
100-M
S#
7200
123
100-M
S#
5300
81
100-M
S#
3400
84
100-M
S#
1448
73
589.4
10
21.1
67
2.4
101-M
S#
12
10
24.9
30.5
87
4.4
0
101-M
S#
11
30
241
101-M
S#
10
50
211
101-M
S#
9100
823
101-M
S#
8200
170
101-M
S#
7300
87
U. Berner et al. / Deep-Sea Research II 50 (2003) 925–950 941
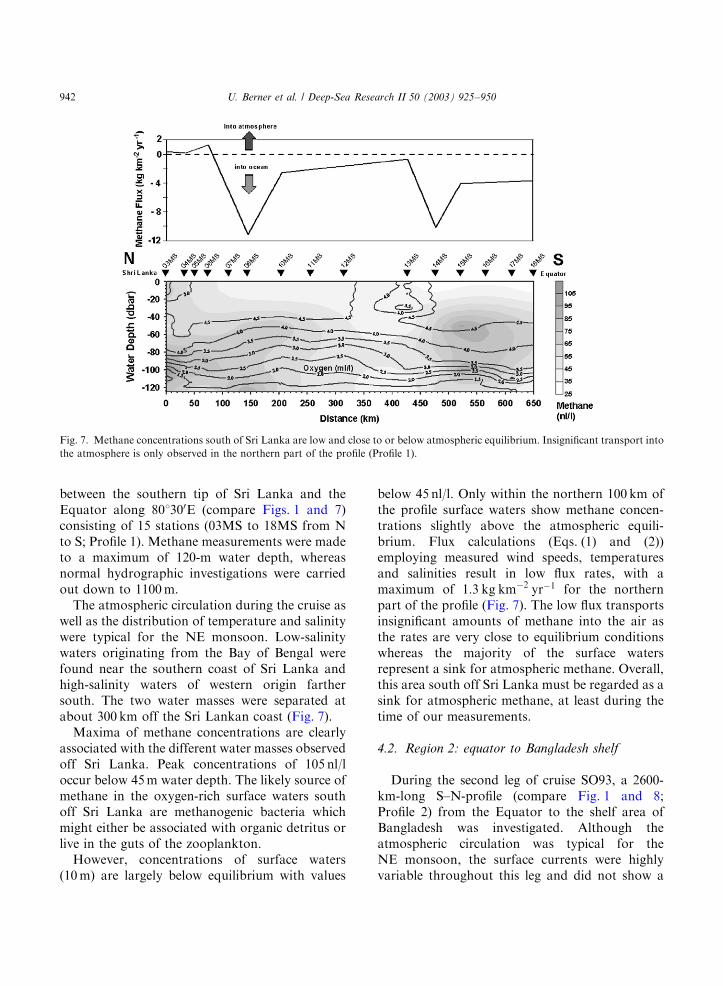
between the southern tip of Sri Lanka and theEquator along 801300E (compare Figs. 1 and 7)consisting of 15 stations (03MS to 18MS from Nto S; Profile 1). Methane measurements were madeto a maximum of 120-m water depth, whereasnormal hydrographic investigations were carriedout down to 1100 m.
The atmospheric circulation during the cruise aswell as the distribution of temperature and salinitywere typical for the NE monsoon. Low-salinitywaters originating from the Bay of Bengal werefound near the southern coast of Sri Lanka andhigh-salinity waters of western origin farthersouth. The two water masses were separated atabout 300 km off the Sri Lankan coast (Fig. 7).
Maxima of methane concentrations are clearlyassociated with the different water masses observedoff Sri Lanka. Peak concentrations of 105 nl/loccur below 45 m water depth. The likely source ofmethane in the oxygen-rich surface waters southoff Sri Lanka are methanogenic bacteria whichmight either be associated with organic detritus orlive in the guts of the zooplankton.
However, concentrations of surface waters(10 m) are largely below equilibrium with values
below 45 nl/l. Only within the northern 100 km ofthe profile surface waters show methane concen-trations slightly above the atmospheric equili-brium. Flux calculations (Eqs. (1) and (2))employing measured wind speeds, temperaturesand salinities result in low flux rates, with amaximum of 1:3 kg km�2 yr�1 for the northernpart of the profile (Fig. 7). The low flux transportsinsignificant amounts of methane into the air asthe rates are very close to equilibrium conditionswhereas the majority of the surface watersrepresent a sink for atmospheric methane. Overall,this area south off Sri Lanka must be regarded as asink for atmospheric methane, at least during thetime of our measurements.
4.2. Region 2: equator to Bangladesh shelf
During the second leg of cruise SO93, a 2600-km-long S–N-profile (compare Fig. 1 and 8;Profile 2) from the Equator to the shelf area ofBangladesh was investigated. Although theatmospheric circulation was typical for theNE monsoon, the surface currents were highlyvariable throughout this leg and did not show a
Fig. 7. Methane concentrations south of Sri Lanka are low and close to or below atmospheric equilibrium. Insignificant transport into
the atmosphere is only observed in the northern part of the profile (Profile 1).
U. Berner et al. / Deep-Sea Research II 50 (2003) 925–950942
well-defined pattern, indicating that transient eddymotion dominated the flow field.
The distribution of temperature and salinityshows strong horizontal gradients in the upperlayer due to the influx of freshwater into thenorthern Bay of Bengal (Figs. 4 and 5). Thethermocline varies around 100 m. The shallow(100 m) salinity maximum of the SubtropicalWater penetrates only to about 71N (33MS). Theintermediate and deep layers are ventilated fromthe south with Central Water and AntarcticBottom Water. An oxygen minimum (Fig. 6)extends from the shelf to about 41N (25MS). Thethickness of the oxygen minimum layer decreasesfrom the shelf (80–900 m) towards the open Bay ofBengal (150–800 m).
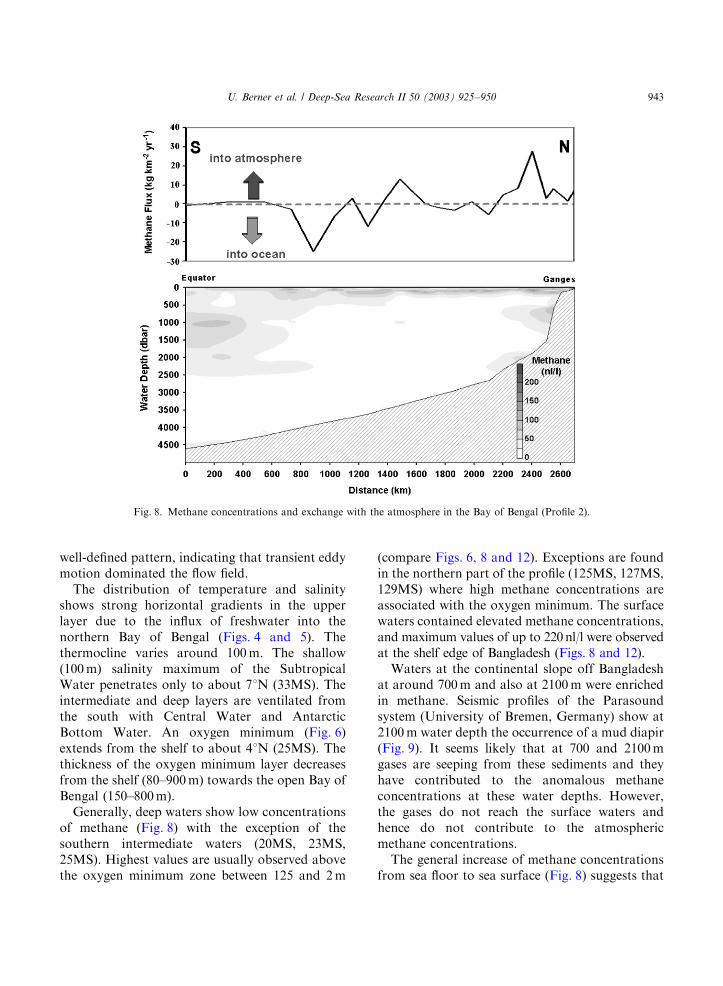
Generally, deep waters show low concentrationsof methane (Fig. 8) with the exception of thesouthern intermediate waters (20MS, 23MS,25MS). Highest values are usually observed abovethe oxygen minimum zone between 125 and 2 m
(compare Figs. 6, 8 and 12). Exceptions are foundin the northern part of the profile (125MS, 127MS,129MS) where high methane concentrations areassociated with the oxygen minimum. The surfacewaters contained elevated methane concentrations,and maximum values of up to 220 nl/l were observedat the shelf edge of Bangladesh (Figs. 8 and 12).
Waters at the continental slope off Bangladeshat around 700 m and also at 2100 m were enrichedin methane. Seismic profiles of the Parasoundsystem (University of Bremen, Germany) show at2100 m water depth the occurrence of a mud diapir(Fig. 9). It seems likely that at 700 and 2100 mgases are seeping from these sediments and theyhave contributed to the anomalous methaneconcentrations at these water depths. However,the gases do not reach the surface waters andhence do not contribute to the atmosphericmethane concentrations.
The general increase of methane concentrationsfrom sea floor to sea surface (Fig. 8) suggests that
Fig. 8. Methane concentrations and exchange with the atmosphere in the Bay of Bengal (Profile 2).
U. Berner et al. / Deep-Sea Research II 50 (2003) 925–950 943

methane flux from the sediments into the watercolumn is of no importance (with the twodescribed exceptions), and that in situ productionwithin the water column must be responsible for
the observed concentrations. The most likelyprocess responsible for the methane anomalies inoxygen-rich waters is bacterial methanogenesisassociated either with the decay of settling organicdebris (from phyto- and zooplankton) or with gutbacteria within zooplankton.
Carbon isotope ratios of methane in the seasurface show a range from �62 to �38%. Thelight isotope values support the assumption thatmethane has been produced from bacterial metha-nogenic processes (Whiticar et al., 1986) within theoxygen-rich surface waters (Fig. 10), whereas themore positive values might be related to bacterialoxidation (Whiticar and Faber, 1986) whereinitially isotopic light methane is consumed andthe residual methane is enriched in 13C. Theresulting carbon isotope ratio of the residualmethane depends on the ratio of new productionand the subsequent bacterial oxidation, and likelyis toggled through ecological conditions in thewaters.
The methane samples from the Bay of Bengalshow a clear dependency on the degree of bacterial
Fig. 9. A mud diapir is observed at 2100 m water depth where
elevated methane concentrations are measured in the water
column.
Fig. 10. Carbon isotope ratios of methane point to bacterial generation in surface waters of the Bay of Bengal (Profile 2).
U. Berner et al. / Deep-Sea Research II 50 (2003) 925–950944
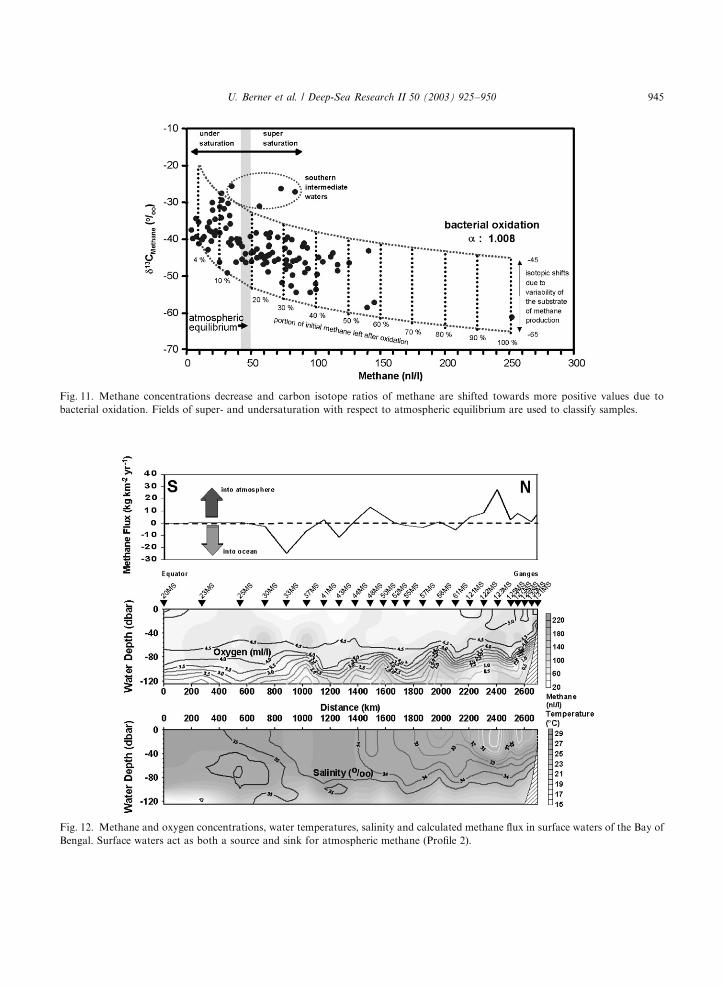
Fig. 11. Methane concentrations decrease and carbon isotope ratios of methane are shifted towards more positive values due to
bacterial oxidation. Fields of super- and undersaturation with respect to atmospheric equilibrium are used to classify samples.
Fig. 12. Methane and oxygen concentrations, water temperatures, salinity and calculated methane flux in surface waters of the Bay of
Bengal. Surface waters act as both a source and sink for atmospheric methane (Profile 2).
U. Berner et al. / Deep-Sea Research II 50 (2003) 925–950 945
oxidation they underwent. With decreasingmethane concentrations as a result of decreasingproduction/oxidation ratios, the heavy carbonisotope is enriched in the residual methane fraction(Fig. 11). If we consider oxidation as the dominantprocess, then the isotopic shift (Fig. 11) withdecreasing concentrations can best be describedthrough a Rayleigh function with a fractionationfactor of a ¼ 1:008; which is compatible with thefindings of Faber et al. (1998) for oxidationprocesses in the surface waters of the Red Sea.The calculated oxidation trend assuming a ¼ 1:008would be the same for lower initial concentrations.The isotopic variability of methane reaches 20%within this trend and likely represents the isotopicvariability of the substrate on which methanogenicbacteria live.
However, the four samples from the intermedi-ate waters at the two southern-most stations(MS20 and MS23) do not plot within the proposedoxidation trend but are shifted to more positive
values (Fig. 11). This shift can be explained eitherby oxidative fractionation with a fractionationfactor of a ¼ 1:008 and a high initial methaneconcentration of about 800 nl/l or alternatively byassuming a higher fractionation factor of a ¼1:020 for the bacterial oxidation process, implyingan initial methane concentration at around250 nl/l.
Despite the fact that methane is at least partlyconsumed in the surface waters, our investigationsshow that the ocean waters of the Bay of Bengalcan be regarded as a minor source, rather than asink of atmospheric methane (Fig. 12), as mostvalues of methane concentrations at 10 m exceedthose for equilibrium between ocean water andatmosphere. Methane concentrations and asso-ciated flux rates are highest close to the Bangla-desh shelf area. They reach up to 28 kg km�2 yr�1.Flux rates tend to decrease with increasingdistance from the shelf, and approach near-equilibrium values close to the Equator.
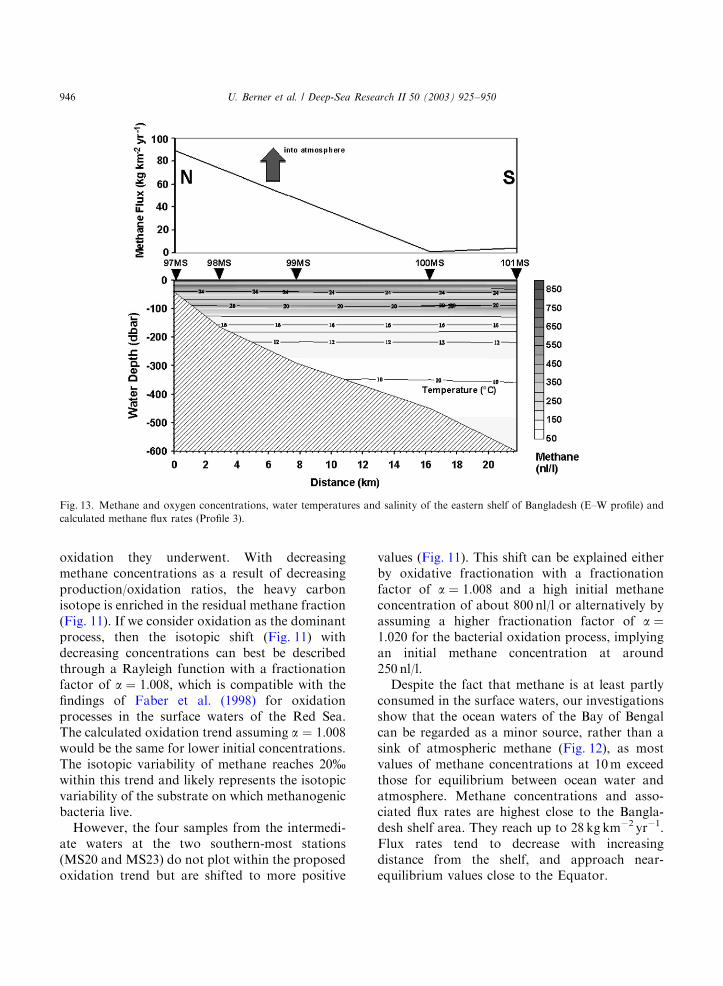
Fig. 13. Methane and oxygen concentrations, water temperatures and salinity of the eastern shelf of Bangladesh (E–W profile) and
calculated methane flux rates (Profile 3).
U. Berner et al. / Deep-Sea Research II 50 (2003) 925–950946
4.3. Region 3: Bangladesh shelf and ‘‘Swatch of No
Ground
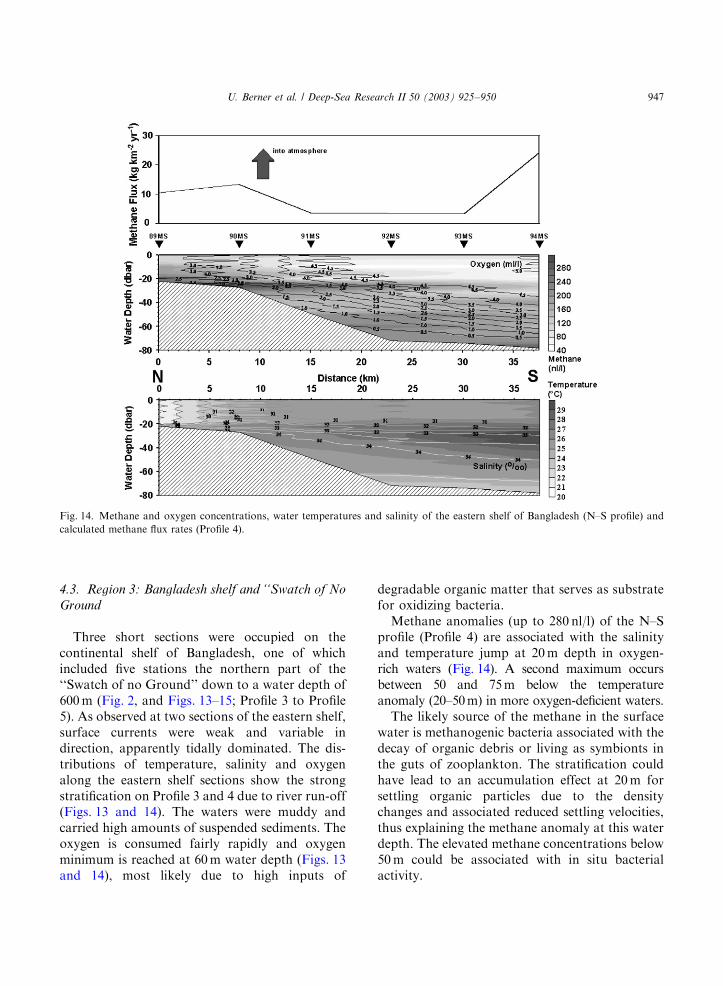
Three short sections were occupied on thecontinental shelf of Bangladesh, one of whichincluded five stations the northern part of the‘‘Swatch of no Ground’’ down to a water depth of600 m (Fig. 2, and Figs. 13–15; Profile 3 to Profile5). As observed at two sections of the eastern shelf,surface currents were weak and variable indirection, apparently tidally dominated. The dis-tributions of temperature, salinity and oxygenalong the eastern shelf sections show the strongstratification on Profile 3 and 4 due to river run-off(Figs. 13 and 14). The waters were muddy andcarried high amounts of suspended sediments. Theoxygen is consumed fairly rapidly and oxygenminimum is reached at 60 m water depth (Figs. 13and 14), most likely due to high inputs of
degradable organic matter that serves as substratefor oxidizing bacteria.
Methane anomalies (up to 280 nl/l) of the N–Sprofile (Profile 4) are associated with the salinityand temperature jump at 20 m depth in oxygen-rich waters (Fig. 14). A second maximum occursbetween 50 and 75 m below the temperatureanomaly (20–50 m) in more oxygen-deficient waters.
The likely source of the methane in the surfacewater is methanogenic bacteria associated with thedecay of organic debris or living as symbionts inthe guts of zooplankton. The stratification couldhave lead to an accumulation effect at 20 m forsettling organic particles due to the densitychanges and associated reduced settling velocities,thus explaining the methane anomaly at this waterdepth. The elevated methane concentrations below50 m could be associated with in situ bacterialactivity.
Fig. 14. Methane and oxygen concentrations, water temperatures and salinity of the eastern shelf of Bangladesh (N–S profile) and
calculated methane flux rates (Profile 4).
U. Berner et al. / Deep-Sea Research II 50 (2003) 925–950 947

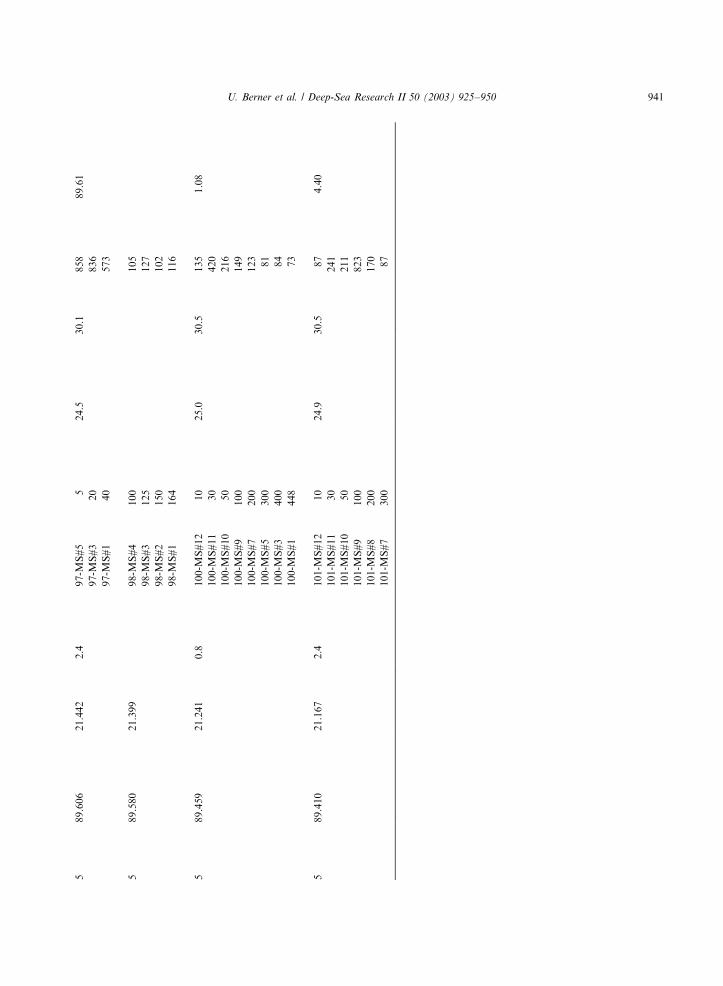
Calculated methane fluxes of the Bengal Shelfare higher than in open-ocean areas, reachingvalues of up to 145 kg km�2 yr�1 (Fig. 13; Profile3). The ‘‘Swatch of no Ground’’ (Profile 5) wasfilled with water masses from offshore and did notshow any evidence for sinking freshwater from theGanges and Brahmaputra Rivers. However,methane concentrations in the surface watersreached anomalous values of up to 880 nl/l(Fig. 15, Profile 5).
Flux rates of methane are higher than thoseoffshore and reach up to 90 kg km�2 yr�1 on theshelf. However, at the two southernmost stationsnear-equilibrium conditions between water surfaceand atmosphere are reached.
5. Conclusions
* During the NE monsoon in January 1994methane concentrations were clearly associatedwith the different water masses observed southof Sri Lanka. A 650-km-long profile from theSri Lankan coast to the Equator revealed peak
concentrations of 105 nl/l below 45 m waterdepth.
* Surface waters of the Bay of Bengal containedup to 800 nl/l of methane on the shelf close tothe Ganges/Brahmaputra mouth. Methane con-centrations of the surface waters are related tobacterial methanogenesis and bacterial oxida-tion as indicated by carbon isotope ratios ofmethane. This methane only partly contributesto the atmospheric methane concentrations,especially on the shelf of Bangladesh close tothe Ganges/Brahmaputra mouth with flux ratesof 145 kg km�2 year�1. Large sections of theprofiles, however, showed near-equilibriumconditions and even undersaturation of methanewith respect to the atmosphere. Undersaturatedareas presumably act as a methane sinks.
* Methane anomalies at 700 and 2100 m waterdepth on the continental slope off Bangladeshare related to gases likely emanating from thesediments, as indicated by seismic data. How-ever, the deep methane anomalies do notexchange with the surface waters, and are nota source for atmospheric methane.
Fig. 15. Methane concentrations and water temperatures of the ‘‘Swatch of no Ground’’ (shelf of Bangladesh) and calculated methane
flux rates (Profile 5).
U. Berner et al. / Deep-Sea Research II 50 (2003) 925–950948

Acknowledgements
The authors thank D. Laszinski for the analysesof carbon isotope ratios of methane. The work wasfunded by the German Ministry of Education andResearch through grants BMFT 03G 0093 A.
References
Atkinson, L.P., Richards, F.A., 1967. Deep-Sea Research II 14,
673–684.
Bange, H.W., Bartell, U.H., Rapsomanikis, S., Andreae, M.O.,
1994. Methane in the baltic and North Seas and a
reassessment of the marine emissions of methane. Global
Biogeochemical Cycles 8 (4), 465–480.
Bange, H.W., Ramesh, R., Rapsomanikis, S., Andreae, M.O.,
1998a. Methane in surface waters of the Arabian Sea.
Geophysical Research Letters 25 (19), 3547–3550.
Bange, H.W., Breves, W., Mitzka, T., Lendt, R., Petuhov, K.,
Hupe, A., Rapsomanikis, S., Andreae, M.O., Reuter, R.,
Zeitschel, B., Ittekkot, V., 1998b. The surface distribution of
nutrients, chlorophyll, and trace gases (CO2, N2O, CH4) in
the upwelling area of the northwestern Arabian Sea during
the SW monsoon. Seventh national JGOFS-Workshop
1998, Bremen, pp. 8–9.
Chappellaz, J.A., 1990. Etude du methane atmospherique au
cours du dernier cycle climatique a partir d l’analyse de l’air
piege dans la glace antarctique. Ph.D. Thesis, University of
Grenoble, 214pp.
Chappellaz, J.A., Barnola, J.M., Raynaud, D., Korotkevich,
Y.S., Lorius, C., 1990. Ice-core record of atmospheric
methane over the past 160,000 years. Nature 345, 127–131.
Chappellaz, J., Blunier, T., Raynaud, D., Barnola, J.M.,
Schwander, J., Stauffer, B., 1993. Synchronous changes in
atmospheric CH4 and Greenland climate between 40 and
8 kyrbp. Nature 366, 443–445.
Chappellaz, J.A., Brook, E.J., Blunier, T., Malaiz!e, B., 1997.
CH4 and d18O of O2 records from Antarctic and Greenland
ice: a clue for stratigraphic disturbance in the bottom part of
the Greenland Ice Core Project and the Greenland Ice Sheet
Project 2 ice cores. Journal of Geophysical Research 102,
26547–26557.
Conrad, R., Seiler, W., 1988. Methane and hydrogen in
sea water (Atlantic Ocean). Deep-Sea Research II 35,
1903–1917.
Crutzen, P.J., 1991. Methane’s sinks and sources. Nature 350,
380–381.
Dlugokencky, E.J., Masarie, K.A., Lang, P.M., Tans, P.P.,
1998. Continuing decline in the growth rate of the atmo-
spheric methane burden. Nature 393, 447–450.
Ericksson III, D.J., 1993. A stability dependent theory for
air-sea gas exchange. Journal of Geophysical Research 98,
8471–8488.
Faber, E., Gerling, P., Berner, U., Sohns, E., 1994. Methane in
ocean waters: concentrations and carbon isotope variability
at East Pacific Rise and in the Arabian Sea. Environmental
Monitoring and Assessment 31, 139–144.
Faber, E., Stahl, W.J., Berner, U., Gerling, P., Hollerbach, A.,
1995. Methane in sediments, waters and in the atmosphere.
Geotechnica 1995, 86–87.
Faber, E., Botz, R., Poggenburg, J., Schmitt, M., Stoffers, P.,
1998. Methane in Red Sea brine waters. Organic Geochem-
istry 29 (1–3), 363–379.
Graedel, T.E., Crutzen, P.J., 1993. Atmospheric Change. An
Earth System Perspective. Freeman and Company, New
York, 446pp.
Heimann, M., 1997. Modellierung von klimarelevanten Stofffl-
.ussen. VDI Berichte 1330, 61–68.
Hein, R., Crutzen, P.J., Heimann, M., 1997. An inverse
modeling approach to investigate the global atmospheric
methane cycle. Global Biogeochemical Cycles 11, 43–76.
Houghton, J.T., Jenkins, G.J., Ephraums, J.J., 1990. Climate
Change. The IPCC Assessment. Cambridge University
Press, Cambridge, pp. 18–22.
Karl, D.M., Tilbrook, B.D., 1994. Production and transport of
methane in oceanic particulate organic matter. Nature 368,
732–734.
Liss, P.S., Merlivat, L., 1986. Air–sea exchange rates: introduc-
tion and synthesis. In: Buat-M!enard (Ed.), The Role of Air–
sea Exchange in Geochemical Cycling. D. Reidel, New
York, pp. 113–127
Michaelis, W., Faber, E., Pl .uger, W., Galimov, E., Keller, M.,
Paetsch, H., Boddem, J., Beckmann, W., et al., 1993.
HYGAPE, Hydrothermale Gas und Partikel Exhalationen
im Bereich des Ostpazifischen R .uckens bei 211S, SO80B.
Zwischenbericht f .ur das Forschungsprojekt 03R 420 B,
Universit.at Hamburg, Institut f .ur Biogeochemie und
Meereschemie, Hamburg, August 1993, p. 178.
Oremland, R.S. (Ed.), 1993. Biogeochemistry of global change
radioactively active face gases. Selected papers from the
Tenth International Symposium on Environmental Bio-
chemistry. San Francisco, August 19–24, 1991, 879pp,
Chapman & Hall, NY.
Owens, N.J.P., Law, C.S., Mantoura, R.F.C., Burkill, P.H.,
Llewellyn, C.A., 1991. Methane flux to the atmosphere from
the Arabian Sea. Nature 354, 293–296.
Rasmussen, R., Khalil, M.A.K., 1981. Atmospheric methane
(CH4): trends and seasonal cycles. Journal of Geophysical
Research 86, 9826–9832.
Raynaud, D., Chappellaz, J.A., Barnola, J.M., Korotkevich,
Y.S., Lorius, C., 1988. Climatic and CH4 cycle implications
of glacial–interglacial CH4 change in the Vostok ice core.
Nature 333, 655–657.
Schmitt, M., Faber, E., Botz, R., Stoffers, P., 1991. Extraction
of methane from seawater using ultrasonic degassing.
Analytical Chemistry 63 (5), 529–532.
Scranton, M.I., Brewer, P.G., 1977. Occurrence of methane in
the near-surface waters of the western subtropical North-
Atlantic. Deep-Sea Research II 24, 127–138.
Scranton, M.I., Farrington, J.W., 1977. Methane production in
the waters of Walvis Bay. Journal of Geophysical Research
82, 4947–4953.
U. Berner et al. / Deep-Sea Research II 50 (2003) 925–950 949
Suess, E., Bohrmann, G., Huene, R.V., Linke, P., Wallmann, K.,
Lammers, S., Sahling, H., Winckler, G., Lutz, R.A, Orange,
D., 1998. Fluid venting in the Aleutian subduction zone.
Journal of Geophysical Research 103 (B2), 2597–2614.
Ward, B.B., Kilpatrick, K.A., Novelli, P.C., Scranton, M.I.,
1987. Methane oxidation and methane fluxes in the ocean
surface layer and deep anoxic waters. Nature 327, 226–229.
Wanninkhof, R., 1992. Relationship between wind speed and
gas exchange over the ocean. Journal of Geophysical
Research 97 (C5), 7373–7382.
Welhan, J.A., 1988. Origins of methane in hydrothermal
systems. Chemical Geolology 71, 183–198.
Whiticar, M.J., Faber, E., 1986. Methane oxidation in sediment
and water column environments—Isotope evidence. In:
Leythaeuser, D., Rullk .otter, J. (Eds.), Advances in Organic
Geochemistry, vol. 1985, pp. 759–768.
Whiticar, M.J., Faber, E., Schoell, M., 1986. Biogenic
methane formation in marine and freshwater environ-
ments: CO2 reduction vs. acetate fermentation - isotopic
evidence. Geochimica et Cosmochimica Acta 50,
693–709.
Wiesenburg, D.A., Guinasso Jr., N.L., 1979. Equilibrium
solubilities of methane, carbon monoxide, and hydrogen
in water and sea water. Journal of Chemical and Engineer-
ing Data 24 (4), 356–360.
Wyrtki, K., 1973. Physical oceanography of the Indian Ocean.
In: Zeitzschel, B. (Ed.), The Biology of the Indian Ocean.
Springer, Berlin, pp. 18–36.
U. Berner et al. / Deep-Sea Research II 50 (2003) 925–950950