Methane emissions from abandoned PA oil and gas wells
5
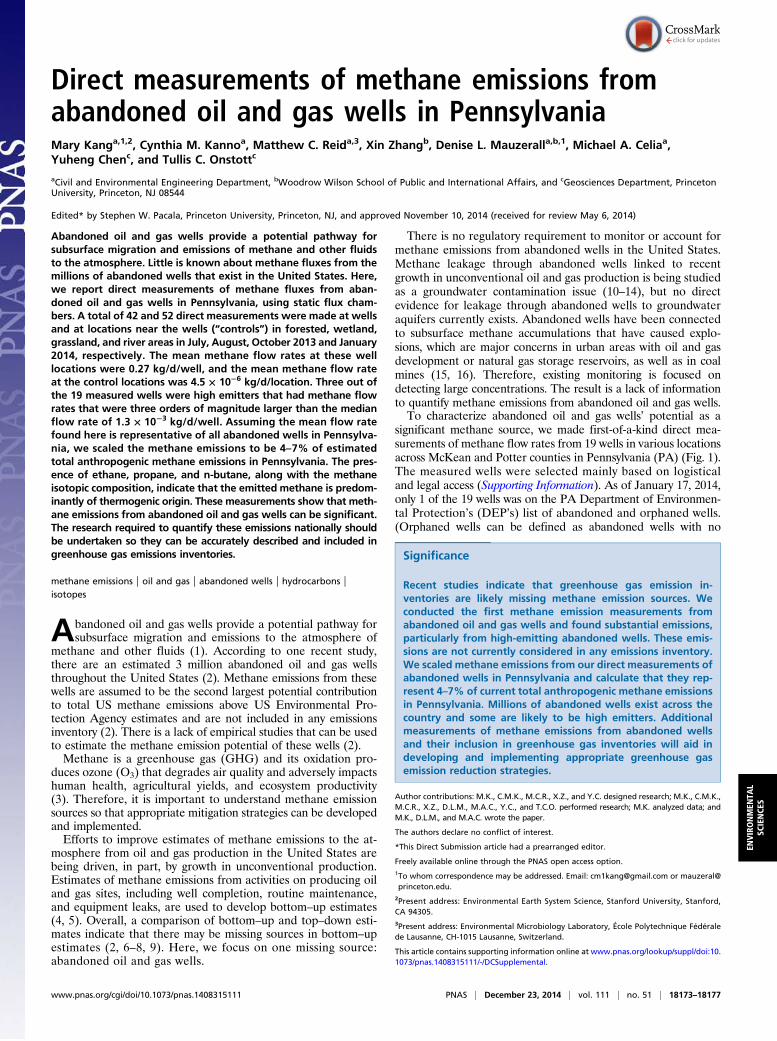
Direct measurements of methane emissions from abandoned oil and gas wells in Pennsylvania Mary Kang a,1,2 , Cynthia M. Kanno a , Matthew C. Reid a,3 , Xin Zhang b , Denise L. Mauzerall a,b,1 , Michael A. Celia a , Yuheng Chen c , and Tullis C. Onstott c a Civil and Environmental Engineering Department, b Woodrow Wilson School of Public and International Affairs, and c Geosciences Department, Princeton University, Princeton, NJ 08544 Edited* by Stephen W. Pacala, Princeton University, Princeton, NJ, and approved November 10, 2014 (received for review May 6, 2014) Abandoned oil and gas wells provide a potential pathway for subsurface migration and emissions of methane and other fluids to the atmosphere. Little is known about methane fluxes from the millions of abandoned wells that exist in the United States. Here, we report direct measurements of methane fluxes from aban- doned oil and gas wells in Pennsylvania, using static flux cham- bers. A total of 42 and 52 direct measurements were made at wells and at locations near the wells (“controls”) in forested, wetland, grassland, and river areas in July, August, October 2013 and January 2014, respectively. The mean methane flow rates at these well locations were 0.27 kg/d/well, and the mean methane flow rate at the control locations was 4.5 × 10 -6 kg/d/location. Three out of the 19 measured wells were high emitters that had methane flow rates that were three orders of magnitude larger than the median flow rate of 1.3 × 10 -3 kg/d/well. Assuming the mean flow rate found here is representative of all abandoned wells in Pennsylva- nia, we scaled the methane emissions to be 4–7% of estimated total anthropogenic methane emissions in Pennsylvania. The pres- ence of ethane, propane, and n-butane, along with the methane isotopic composition, indicate that the emitted methane is predom- inantly of thermogenic origin. These measurements show that meth- ane emissions from abandoned oil and gas wells can be significant. The research required to quantify these emissions nationally should be undertaken so they can be accurately described and included in greenhouse gas emissions inventories. methane emissions | oil and gas | abandoned wells | hydrocarbons | isotopes A bandoned oil and gas wells provide a potential pathway for subsurface migration and emissions to the atmosphere of methane and other fluids (1). According to one recent study, there are an estimated 3 million abandoned oil and gas wells throughout the United States (2). Methane emissions from these wells are assumed to be the second largest potential contribution to total US methane emissions above US Environmental Pro- tection Agency estimates and are not included in any emissions inventory (2). There is a lack of empirical studies that can be used to estimate the methane emission potential of these wells (2). Methane is a greenhouse gas (GHG) and its oxidation pro- duces ozone (O 3 ) that degrades air quality and adversely impacts human health, agricultural yields, and ecosystem productivity (3). Therefore, it is important to understand methane emission sources so that appropriate mitigation strategies can be developed and implemented. Efforts to improve estimates of methane emissions to the at- mosphere from oil and gas production in the United States are being driven, in part, by growth in unconventional production. Estimates of methane emissions from activities on producing oil and gas sites, including well completion, routine maintenance, and equipment leaks, are used to develop bottom–up estimates (4, 5). Overall, a comparison of bottom–up and top–down esti- mates indicate that there may be missing sources in bottom–up estimates (2, 6–8, 9). Here, we focus on one missing source: abandoned oil and gas wells. There is no regulatory requirement to monitor or account for methane emissions from abandoned wells in the United States. Methane leakage through abandoned wells linked to recent growth in unconventional oil and gas production is being studied as a groundwater contamination issue (10–14), but no direct evidence for leakage through abandoned wells to groundwater aquifers currently exists. Abandoned wells have been connected to subsurface methane accumulations that have caused explo- sions, which are major concerns in urban areas with oil and gas development or natural gas storage reservoirs, as well as in coal mines (15, 16). Therefore, existing monitoring is focused on detecting large concentrations. The result is a lack of information to quantify methane emissions from abandoned oil and gas wells. To characterize abandoned oil and gas wells’ potential as a significant methane source, we made first-of-a-kind direct mea- surements of methane flow rates from 19 wells in various locations across McKean and Potter counties in Pennsylvania (PA) (Fig. 1). The measured wells were selected mainly based on logistical and legal access (Supporting Information). As of January 17, 2014, only 1 of the 19 wells was on the PA Department of Environmen- tal Protection’s (DEP’s) list of abandoned and orphaned wells. (Orphaned wells can be defined as abandoned wells with no Significance Recent studies indicate that greenhouse gas emission in- ventories are likely missing methane emission sources. We conducted the first methane emission measurements from abandoned oil and gas wells and found substantial emissions, particularly from high-emitting abandoned wells. These emis- sions are not currently considered in any emissions inventory. We scaled methane emissions from our direct measurements of abandoned wells in Pennsylvania and calculate that they rep- resent 4–7% of current total anthropogenic methane emissions in Pennsylvania. Millions of abandoned wells exist across the country and some are likely to be high emitters. Additional measurements of methane emissions from abandoned wells and their inclusion in greenhouse gas inventories will aid in developing and implementing appropriate greenhouse gas emission reduction strategies. Author contributions: M.K., C.M.K., M.C.R., X.Z., and Y.C. designed research; M.K., C.M.K., M.C.R., X.Z., D.L.M., M.A.C., Y.C., and T.C.O. performed research; M.K. analyzed data; and M.K., D.L.M., and M.A.C. wrote the paper. The authors declare no conflict of interest. *This Direct Submission article had a prearranged editor. Freely available online through the PNAS open access option. 1 To whom correspondence may be addressed. Email: [email protected] or mauzeral@ princeton.edu. 2 Present address: Environmental Earth System Science, Stanford University, Stanford, CA 94305. 3 Present address: Environmental Microbiology Laboratory, École Polytechnique Fédérale de Lausanne, CH-1015 Lausanne, Switzerland. This article contains supporting information online at www.pnas.org/lookup/suppl/doi:10. 1073/pnas.1408315111/-/DCSupplemental. www.pnas.org/cgi/doi/10.1073/pnas.1408315111 PNAS | December 23, 2014 | vol. 111 | no. 51 | 18173–18177 ENVIRONMENTAL SCIENCES
-
Upload
alexander-knight -
Category
Documents
-
view
5 -
download
2
description
Study estimates that there are approximately 3 million abandoned oil and gas wells across the United States. This study denies a direct link between abandoned oil and gas wells and water contamination but raises some very important issues: 1) A consistent 'lack of data' which is a reoccurring theme, and 2) that there is no regulatory requirement to monitor abandoned oil and gas wells.Study released: November 10 2014
Transcript of Methane emissions from abandoned PA oil and gas wells
Direct measurements of methane emissions fromabandoned oil and gas wells in PennsylvaniaMary Kanga,1,2, Cynthia M. Kannoa, Matthew C. Reida,3, Xin Zhangb, Denise L. Mauzeralla,b,1, Michael A. Celiaa,Yuheng Chenc, and Tullis C. Onstottc
aCivil and Environmental Engineering Department, bWoodrow Wilson School of Public and International Affairs, and cGeosciences Department, PrincetonUniversity, Princeton, NJ 08544
Edited* by Stephen W. Pacala, Princeton University, Princeton, NJ, and approved November 10, 2014 (received for review May 6, 2014)
Abandoned oil and gas wells provide a potential pathway forsubsurface migration and emissions of methane and other fluidsto the atmosphere. Little is known about methane fluxes from themillions of abandoned wells that exist in the United States. Here,we report direct measurements of methane fluxes from aban-doned oil and gas wells in Pennsylvania, using static flux cham-bers. A total of 42 and 52 direct measurements were made at wellsand at locations near the wells (“controls”) in forested, wetland,grassland, and river areas in July, August, October 2013 and January2014, respectively. The mean methane flow rates at these welllocations were 0.27 kg/d/well, and the mean methane flow rateat the control locations was 4.5 × 10⁻⁶ kg/d/location. Three out ofthe 19 measured wells were high emitters that had methane flowrates that were three orders of magnitude larger than the medianflow rate of 1.3 × 10⁻³ kg/d/well. Assuming the mean flow ratefound here is representative of all abandoned wells in Pennsylva-nia, we scaled the methane emissions to be 4–7% of estimatedtotal anthropogenic methane emissions in Pennsylvania. The pres-ence of ethane, propane, and n-butane, along with the methaneisotopic composition, indicate that the emitted methane is predom-inantly of thermogenic origin. These measurements show that meth-ane emissions from abandoned oil and gas wells can be significant.The research required to quantify these emissions nationally shouldbe undertaken so they can be accurately described and included ingreenhouse gas emissions inventories.
methane emissions | oil and gas | abandoned wells | hydrocarbons |isotopes
Abandoned oil and gas wells provide a potential pathway forsubsurface migration and emissions to the atmosphere of
methane and other fluids (1). According to one recent study,there are an estimated 3 million abandoned oil and gas wellsthroughout the United States (2). Methane emissions from thesewells are assumed to be the second largest potential contributionto total US methane emissions above US Environmental Pro-tection Agency estimates and are not included in any emissionsinventory (2). There is a lack of empirical studies that can be usedto estimate the methane emission potential of these wells (2).Methane is a greenhouse gas (GHG) and its oxidation pro-
duces ozone (O3) that degrades air quality and adversely impactshuman health, agricultural yields, and ecosystem productivity(3). Therefore, it is important to understand methane emissionsources so that appropriate mitigation strategies can be developedand implemented.Efforts to improve estimates of methane emissions to the at-
mosphere from oil and gas production in the United States arebeing driven, in part, by growth in unconventional production.Estimates of methane emissions from activities on producing oiland gas sites, including well completion, routine maintenance,and equipment leaks, are used to develop bottom–up estimates(4, 5). Overall, a comparison of bottom–up and top–down esti-mates indicate that there may be missing sources in bottom–upestimates (2, 6–8, 9). Here, we focus on one missing source:abandoned oil and gas wells.
There is no regulatory requirement to monitor or account formethane emissions from abandoned wells in the United States.Methane leakage through abandoned wells linked to recentgrowth in unconventional oil and gas production is being studiedas a groundwater contamination issue (10–14), but no directevidence for leakage through abandoned wells to groundwateraquifers currently exists. Abandoned wells have been connectedto subsurface methane accumulations that have caused explo-sions, which are major concerns in urban areas with oil and gasdevelopment or natural gas storage reservoirs, as well as in coalmines (15, 16). Therefore, existing monitoring is focused ondetecting large concentrations. The result is a lack of informationto quantify methane emissions from abandoned oil and gas wells.To characterize abandoned oil and gas wells’ potential as a
significant methane source, we made first-of-a-kind direct mea-surements of methane flow rates from 19 wells in various locationsacross McKean and Potter counties in Pennsylvania (PA) (Fig. 1).The measured wells were selected mainly based on logisticaland legal access (Supporting Information). As of January 17, 2014,only 1 of the 19 wells was on the PA Department of Environmen-tal Protection’s (DEP’s) list of abandoned and orphaned wells.(Orphaned wells can be defined as abandoned wells with no
Significance
Recent studies indicate that greenhouse gas emission in-ventories are likely missing methane emission sources. Weconducted the first methane emission measurements fromabandoned oil and gas wells and found substantial emissions,particularly from high-emitting abandoned wells. These emis-sions are not currently considered in any emissions inventory.We scaled methane emissions from our direct measurements ofabandoned wells in Pennsylvania and calculate that they rep-resent 4–7% of current total anthropogenic methane emissionsin Pennsylvania. Millions of abandoned wells exist across thecountry and some are likely to be high emitters. Additionalmeasurements of methane emissions from abandoned wellsand their inclusion in greenhouse gas inventories will aid indeveloping and implementing appropriate greenhouse gasemission reduction strategies.
Author contributions: M.K., C.M.K., M.C.R., X.Z., and Y.C. designed research; M.K., C.M.K.,M.C.R., X.Z., D.L.M., M.A.C., Y.C., and T.C.O. performed research; M.K. analyzed data; andM.K., D.L.M., and M.A.C. wrote the paper.
The authors declare no conflict of interest.
*This Direct Submission article had a prearranged editor.
Freely available online through the PNAS open access option.1To whom correspondence may be addressed. Email: [email protected] or [email protected].
2Present address: Environmental Earth System Science, Stanford University, Stanford,CA 94305.3Present address: Environmental Microbiology Laboratory, École Polytechnique Fédéralede Lausanne, CH-1015 Lausanne, Switzerland.
This article contains supporting information online at www.pnas.org/lookup/suppl/doi:10.1073/pnas.1408315111/-/DCSupplemental.
www.pnas.org/cgi/doi/10.1073/pnas.1408315111 PNAS | December 23, 2014 | vol. 111 | no. 51 | 18173–18177
ENVIRONMEN
TAL
SCIENCE
S
responsible party available, other than the state.) The DEP da-tabase provides information on the well status (abandoned,plugged, or orphan) and well type (gas, oil, combined oil andgas, or undetermined) but does not provide other informationsuch as well age and depth. No additional information on themeasured wells is available. This is indicative of the generalscarcity of available information on this class of old wells in PA.Given the lack of records on the wells we measured, no distinctionwas made between oil and gas wells; the wells were simply cate-gorized as plugged or unplugged, based on surface evidence ofcementing and/or presence of a marker. With this criterion, 5 of the19 measured wells (26%) were classified as plugged.In addition to methane, we also analyzed the collected samples
for ethane, propane, n-butane, and carbon isotopes of methane, toprovide insight on the potential sources of the emitted methane.This work provides previously unavailable data on methaneleakage rates and other emissions from abandoned oil andgas wells.
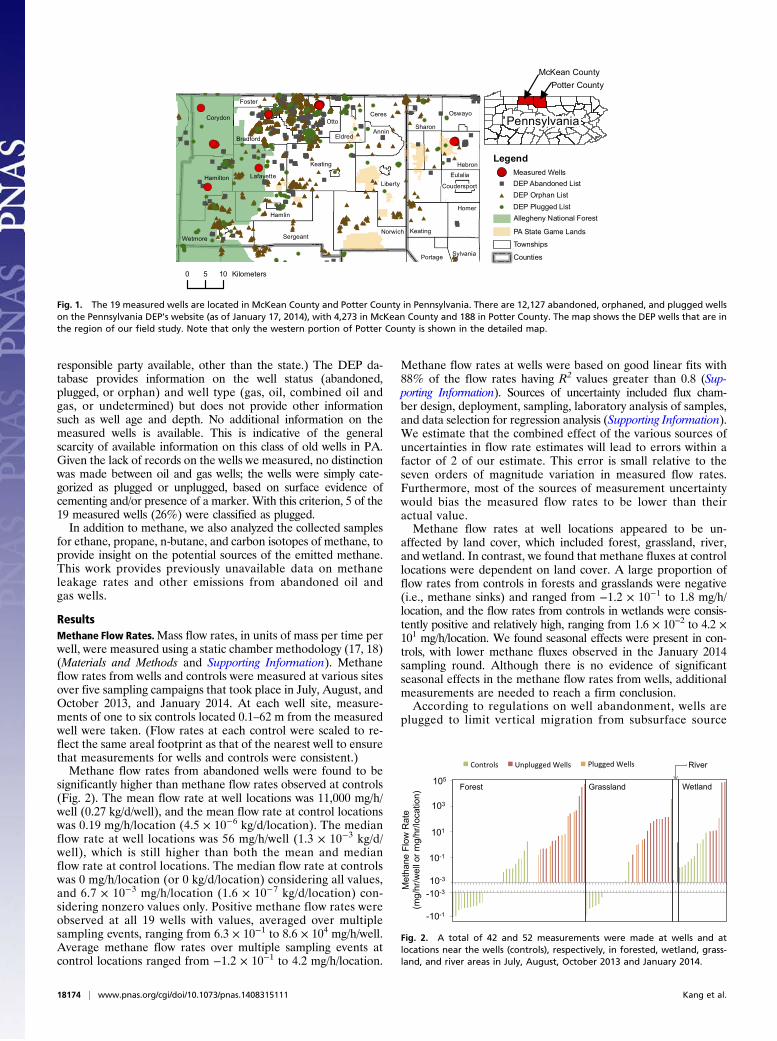
ResultsMethane Flow Rates.Mass flow rates, in units of mass per time perwell, were measured using a static chamber methodology (17, 18)(Materials and Methods and Supporting Information). Methaneflow rates from wells and controls were measured at various sitesover five sampling campaigns that took place in July, August, andOctober 2013, and January 2014. At each well site, measure-ments of one to six controls located 0.1–62 m from the measuredwell were taken. (Flow rates at each control were scaled to re-flect the same areal footprint as that of the nearest well to ensurethat measurements for wells and controls were consistent.)Methane flow rates from abandoned wells were found to be
significantly higher than methane flow rates observed at controls(Fig. 2). The mean flow rate at well locations was 11,000 mg/h/well (0.27 kg/d/well), and the mean flow rate at control locationswas 0.19 mg/h/location (4.5 × 10⁻⁶ kg/d/location). The medianflow rate at well locations was 56 mg/h/well (1.3 × 10⁻³ kg/d/well), which is still higher than both the mean and medianflow rate at control locations. The median flow rate at controlswas 0 mg/h/location (or 0 kg/d/location) considering all values,and 6.7 × 10⁻³ mg/h/location (1.6 × 10⁻⁷ kg/d/location) con-sidering nonzero values only. Positive methane flow rates wereobserved at all 19 wells with values, averaged over multiplesampling events, ranging from 6.3 × 10⁻¹ to 8.6 × 10⁴ mg/h/well.Average methane flow rates over multiple sampling events atcontrol locations ranged from −1.2 × 10⁻¹ to 4.2 mg/h/location.
Methane flow rates at wells were based on good linear fits with88% of the flow rates having R2 values greater than 0.8 (Sup-porting Information). Sources of uncertainty included flux cham-ber design, deployment, sampling, laboratory analysis of samples,and data selection for regression analysis (Supporting Information).We estimate that the combined effect of the various sources ofuncertainties in flow rate estimates will lead to errors within afactor of 2 of our estimate. This error is small relative to theseven orders of magnitude variation in measured flow rates.Furthermore, most of the sources of measurement uncertaintywould bias the measured flow rates to be lower than theiractual value.Methane flow rates at well locations appeared to be un-
affected by land cover, which included forest, grassland, river,and wetland. In contrast, we found that methane fluxes at controllocations were dependent on land cover. A large proportion offlow rates from controls in forests and grasslands were negative(i.e., methane sinks) and ranged from −1.2 × 10⁻¹ to 1.8 mg/h/location, and the flow rates from controls in wetlands were consis-tently positive and relatively high, ranging from 1.6 × 10⁻² to 4.2 ×101 mg/h/location. We found seasonal effects were present in con-trols, with lower methane fluxes observed in the January 2014sampling round. Although there is no evidence of significantseasonal effects in the methane flow rates from wells, additionalmeasurements are needed to reach a firm conclusion.According to regulations on well abandonment, wells are
plugged to limit vertical migration from subsurface source
Fig. 1. The 19 measured wells are located in McKean County and Potter County in Pennsylvania. There are 12,127 abandoned, orphaned, and plugged wellson the Pennsylvania DEP’s website (as of January 17, 2014), with 4,273 in McKean County and 188 in Potter County. The map shows the DEP wells that are inthe region of our field study. Note that only the western portion of Potter County is shown in the detailed map.
Forest Grassland Wetland
River
105
103
101
10-1
10-3
-10-3
-10-1
Met
hane
Flo
w R
ate
(m
g/hr
/wel
l or m
g/hr
/loca
tion)
Fig. 2. A total of 42 and 52 measurements were made at wells and atlocations near the wells (controls), respectively, in forested, wetland, grass-land, and river areas in July, August, October 2013 and January 2014.
18174 | www.pnas.org/cgi/doi/10.1073/pnas.1408315111 Kang et al.
formations (oil and gas reservoirs and coal beds), which includesminimizing impacts on groundwater. We found that methane flowrates from plugged wells were not necessarily lower than methaneflow rates at unplugged wells. For example, in the grassland area,both the largest and the second lowest methane fluxes originatedfrom plugged wells. Evaluation of plugging status and wellboreintegrity was difficult using only visual inspection at the surfaceand lack of additional information.
Presence of Ethane, Propane, and n-Butane. The presence and con-centration of ethane, propane, and n-butane are useful for iden-tifying the methane source as thermogenic or microbial. Becauseethane is not coproduced during microbial methanogenesis, thepresence of ethane-to-methane ratios greater than 0.01 indicatesgas of largely thermogenic origin (14, 19). A similar threshold isnot readily available in literature for propane-to-methane andn-butane-to-methane ratios, but we expect this threshold value tobe less than 0.01. Ratios of ethane, propane, and n-butane relativeto methane were more frequently greater than 0.01, and at highervalues, for wells than for controls (Fig. 3). Nonetheless, thepresence of these nonmethane hydrocarbons in controls indicatesthat there may be subsurface horizontal gas flow away from thewell and subsequent emissions to the atmosphere. We also didnot find a consistent ratio for wells or controls and obtained al-kane ratios ranging from 1 × 10⁻⁵ to 0.8. The high variability inalkane ratios may be a result of mixing between various microbialand thermogenic (deeper) sources.
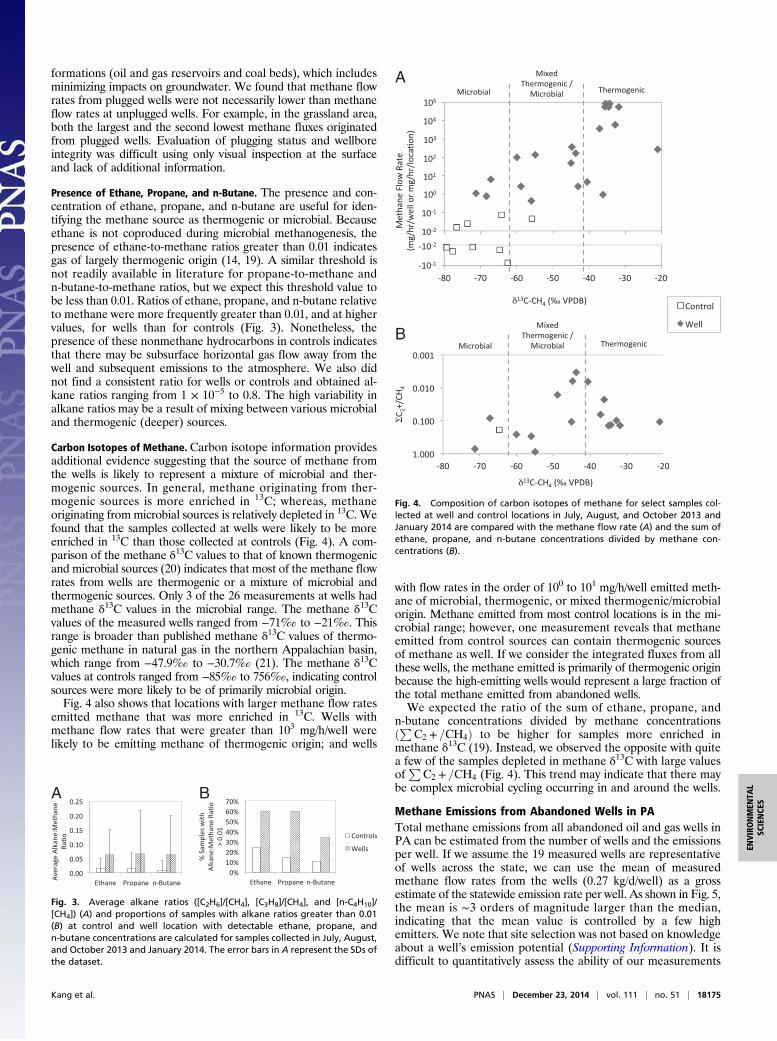
Carbon Isotopes of Methane. Carbon isotope information providesadditional evidence suggesting that the source of methane fromthe wells is likely to represent a mixture of microbial and ther-mogenic sources. In general, methane originating from ther-mogenic sources is more enriched in 13C; whereas, methaneoriginating from microbial sources is relatively depleted in 13C. Wefound that the samples collected at wells were likely to be moreenriched in 13C than those collected at controls (Fig. 4). A com-parison of the methane δ13C values to that of known thermogenicand microbial sources (20) indicates that most of the methane flowrates from wells are thermogenic or a mixture of microbial andthermogenic sources. Only 3 of the 26 measurements at wells hadmethane δ13C values in the microbial range. The methane δ13Cvalues of the measured wells ranged from −71‰ to −21‰. Thisrange is broader than published methane δ13C values of thermo-genic methane in natural gas in the northern Appalachian basin,which range from −47.9‰ to −30.7‰ (21). The methane δ13Cvalues at controls ranged from −85‰ to 756‰, indicating controlsources were more likely to be of primarily microbial origin.Fig. 4 also shows that locations with larger methane flow rates
emitted methane that was more enriched in 13C. Wells withmethane flow rates that were greater than 103 mg/h/well werelikely to be emitting methane of thermogenic origin; and wells
with flow rates in the order of 100 to 101 mg/h/well emitted meth-ane of microbial, thermogenic, or mixed thermogenic/microbialorigin. Methane emitted from most control locations is in the mi-crobial range; however, one measurement reveals that methaneemitted from control sources can contain thermogenic sourcesof methane as well. If we consider the integrated fluxes from allthese wells, the methane emitted is primarily of thermogenic originbecause the high-emitting wells would represent a large fraction ofthe total methane emitted from abandoned wells.We expected the ratio of the sum of ethane, propane, and
n-butane concentrations divided by methane concentrationsðPC2 + =CH4Þ to be higher for samples more enriched inmethane δ13C (19). Instead, we observed the opposite with quitea few of the samples depleted in methane δ13C with large valuesof
PC2 + =CH4 (Fig. 4). This trend may indicate that there may
be complex microbial cycling occurring in and around the wells.
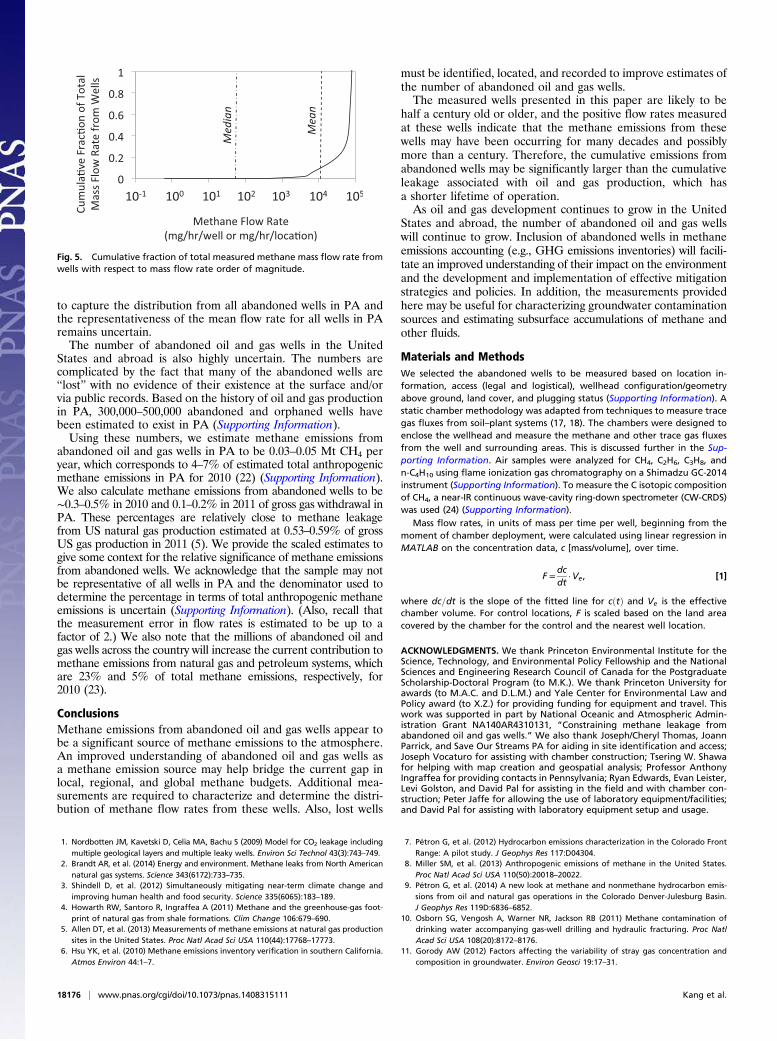
Methane Emissions from Abandoned Wells in PATotal methane emissions from all abandoned oil and gas wells inPA can be estimated from the number of wells and the emissionsper well. If we assume the 19 measured wells are representativeof wells across the state, we can use the mean of measuredmethane flow rates from the wells (0.27 kg/d/well) as a grossestimate of the statewide emission rate per well. As shown in Fig. 5,the mean is ∼3 orders of magnitude larger than the median,indicating that the mean value is controlled by a few highemitters. We note that site selection was not based on knowledgeabout a well’s emission potential (Supporting Information). It isdifficult to quantitatively assess the ability of our measurements
A B
Fig. 3. Average alkane ratios ([C2H6]/[CH4], [C3H8]/[CH4], and [n-C4H10]/[CH4]) (A) and proportions of samples with alkane ratios greater than 0.01(B) at control and well location with detectable ethane, propane, andn-butane concentrations are calculated for samples collected in July, August,and October 2013 and January 2014. The error bars in A represent the SDs ofthe dataset.
A
B
Fig. 4. Composition of carbon isotopes of methane for select samples col-lected at well and control locations in July, August, and October 2013 andJanuary 2014 are compared with the methane flow rate (A) and the sum ofethane, propane, and n-butane concentrations divided by methane con-centrations (B).
Kang et al. PNAS | December 23, 2014 | vol. 111 | no. 51 | 18175
ENVIRONMEN
TAL
SCIENCE
S
to capture the distribution from all abandoned wells in PA andthe representativeness of the mean flow rate for all wells in PAremains uncertain.The number of abandoned oil and gas wells in the United
States and abroad is also highly uncertain. The numbers arecomplicated by the fact that many of the abandoned wells are“lost” with no evidence of their existence at the surface and/orvia public records. Based on the history of oil and gas productionin PA, 300,000–500,000 abandoned and orphaned wells havebeen estimated to exist in PA (Supporting Information).Using these numbers, we estimate methane emissions from
abandoned oil and gas wells in PA to be 0.03–0.05 Mt CH4 peryear, which corresponds to 4–7% of estimated total anthropogenicmethane emissions in PA for 2010 (22) (Supporting Information).We also calculate methane emissions from abandoned wells to be∼0.3–0.5% in 2010 and 0.1–0.2% in 2011 of gross gas withdrawal inPA. These percentages are relatively close to methane leakagefrom US natural gas production estimated at 0.53–0.59% of grossUS gas production in 2011 (5). We provide the scaled estimates togive some context for the relative significance of methane emissionsfrom abandoned wells. We acknowledge that the sample may notbe representative of all wells in PA and the denominator used todetermine the percentage in terms of total anthropogenic methaneemissions is uncertain (Supporting Information). (Also, recall thatthe measurement error in flow rates is estimated to be up to afactor of 2.) We also note that the millions of abandoned oil andgas wells across the country will increase the current contribution tomethane emissions from natural gas and petroleum systems, whichare 23% and 5% of total methane emissions, respectively, for2010 (23).
ConclusionsMethane emissions from abandoned oil and gas wells appear tobe a significant source of methane emissions to the atmosphere.An improved understanding of abandoned oil and gas wells asa methane emission source may help bridge the current gap inlocal, regional, and global methane budgets. Additional mea-surements are required to characterize and determine the distri-bution of methane flow rates from these wells. Also, lost wells
must be identified, located, and recorded to improve estimates ofthe number of abandoned oil and gas wells.The measured wells presented in this paper are likely to be
half a century old or older, and the positive flow rates measuredat these wells indicate that the methane emissions from thesewells may have been occurring for many decades and possiblymore than a century. Therefore, the cumulative emissions fromabandoned wells may be significantly larger than the cumulativeleakage associated with oil and gas production, which hasa shorter lifetime of operation.As oil and gas development continues to grow in the United
States and abroad, the number of abandoned oil and gas wellswill continue to grow. Inclusion of abandoned wells in methaneemissions accounting (e.g., GHG emissions inventories) will facili-tate an improved understanding of their impact on the environmentand the development and implementation of effective mitigationstrategies and policies. In addition, the measurements providedhere may be useful for characterizing groundwater contaminationsources and estimating subsurface accumulations of methane andother fluids.
Materials and MethodsWe selected the abandoned wells to be measured based on location in-formation, access (legal and logistical), wellhead configuration/geometryabove ground, land cover, and plugging status (Supporting Information). Astatic chamber methodology was adapted from techniques to measure tracegas fluxes from soil–plant systems (17, 18). The chambers were designed toenclose the wellhead and measure the methane and other trace gas fluxesfrom the well and surrounding areas. This is discussed further in the Sup-porting Information. Air samples were analyzed for CH4, C2H6, C3H8, andn-C4H10 using flame ionization gas chromatography on a Shimadzu GC-2014instrument (Supporting Information). To measure the C isotopic compositionof CH4, a near-IR continuous wave-cavity ring-down spectrometer (CW-CRDS)was used (24) (Supporting Information).
Mass flow rates, in units of mass per time per well, beginning from themoment of chamber deployment, were calculated using linear regression inMATLAB on the concentration data, c [mass/volume], over time.
F =dcdt
·Ve, [1]
where dc=dt is the slope of the fitted line for cðtÞ and Ve is the effectivechamber volume. For control locations, F is scaled based on the land areacovered by the chamber for the control and the nearest well location.
ACKNOWLEDGMENTS. We thank Princeton Environmental Institute for theScience, Technology, and Environmental Policy Fellowship and the NationalSciences and Engineering Research Council of Canada for the PostgraduateScholarship-Doctoral Program (to M.K.). We thank Princeton University forawards (to M.A.C. and D.L.M.) and Yale Center for Environmental Law andPolicy award (to X.Z.) for providing funding for equipment and travel. Thiswork was supported in part by National Oceanic and Atmospheric Admin-istration Grant NA140AR4310131, “Constraining methane leakage fromabandoned oil and gas wells.” We also thank Joseph/Cheryl Thomas, JoannParrick, and Save Our Streams PA for aiding in site identification and access;Joseph Vocaturo for assisting with chamber construction; Tsering W. Shawafor helping with map creation and geospatial analysis; Professor AnthonyIngraffea for providing contacts in Pennsylvania; Ryan Edwards, Evan Leister,Levi Golston, and David Pal for assisting in the field and with chamber con-struction; Peter Jaffe for allowing the use of laboratory equipment/facilities;and David Pal for assisting with laboratory equipment setup and usage.
1. Nordbotten JM, Kavetski D, Celia MA, Bachu S (2009) Model for CO2 leakage includingmultiple geological layers and multiple leaky wells. Environ Sci Technol 43(3):743–749.
2. Brandt AR, et al. (2014) Energy and environment. Methane leaks from North Americannatural gas systems. Science 343(6172):733–735.
3. Shindell D, et al. (2012) Simultaneously mitigating near-term climate change andimproving human health and food security. Science 335(6065):183–189.
4. Howarth RW, Santoro R, Ingraffea A (2011) Methane and the greenhouse-gas foot-print of natural gas from shale formations. Clim Change 106:679–690.
5. Allen DT, et al. (2013) Measurements of methane emissions at natural gas productionsites in the United States. Proc Natl Acad Sci USA 110(44):17768–17773.
6. Hsu YK, et al. (2010) Methane emissions inventory verification in southern California.Atmos Environ 44:1–7.
7. Pétron G, et al. (2012) Hydrocarbon emissions characterization in the Colorado FrontRange: A pilot study. J Geophys Res 117:D04304.
8. Miller SM, et al. (2013) Anthropogenic emissions of methane in the United States.Proc Natl Acad Sci USA 110(50):20018–20022.
9. Pétron G, et al. (2014) A new look at methane and nonmethane hydrocarbon emis-sions from oil and natural gas operations in the Colorado Denver-Julesburg Basin.J Geophys Res 119D:6836–6852.
10. Osborn SG, Vengosh A, Warner NR, Jackson RB (2011) Methane contamination ofdrinking water accompanying gas-well drilling and hydraulic fracturing. Proc NatlAcad Sci USA 108(20):8172–8176.
11. Gorody AW (2012) Factors affecting the variability of stray gas concentration andcomposition in groundwater. Environ Geosci 19:17–31.
Fig. 5. Cumulative fraction of total measured methane mass flow rate fromwells with respect to mass flow rate order of magnitude.
18176 | www.pnas.org/cgi/doi/10.1073/pnas.1408315111 Kang et al.

12. Jackson RB, et al. (2013) Increased stray gas abundance in a subset of drinking water
wells near Marcellus shale gas extraction. Proc Natl Acad Sci USA 110(28):11250–11255.13. Jackson RE, et al. (2013) Groundwater protection and unconventional gas extraction:
The critical need for field-based hydrogeological research. GroundWater 51(4):488–510.14. Molofsky LJ, Connor JA, Wylie AS, Wagner T, Farhat SK (2013) Evaluation of methane
sources in groundwater in northeastern Pennsylvania. Ground Water 51(3):333–349.15. Gurevich A, Endres B, Robertson JO, Jr, Chilingar G (1993) Gas migration from oil and
gas fields and associated hazards. J Petrol Sci Eng 9:223–238.16. Chilingar G, Endres B (2005) Environmental hazards posed by the Los Angeles basin
urban oilfields: An historical perspective of lessons learned. Environ Geol 47:
302–317.17. Livingston G, Hutchinson G (1995) Enclosure-Based Measurement of Trace Gas Ex-
change: Applications and Sources of Error. Methods in Ecology, eds Matson P, Harriss R
(Blackwell Science Ltd., Oxford), pp 14–51.
18. Reid MC, Tripathee R, Schäfer KVR, Jaffé PR (2013) Tidal marsh methane dynamics:Difference in seasonal lags in emissions driven by storage in vegetated versus un-vegetated sediments. J Geophys Res Biogeosci 118:1802–1813.
19. Taylor S, Sherwood Lollar B, Wassenaar I (2000) Bacteriogenic ethane in near-surfaceaquifers: Implications for leaking hydrocarbonwell bores. Environ Sci Technol 34:4727–4732.
20. Schoell M (1988) Multiple origins of methane in the earth. Chem Geol 71:1–10.21. Jenden P, Drazan D, Kaplan I (1993) Mixing of thermogenic natural gases in northern
Appalachian Basin. AAPG Bull 77:980–998.22. WRI CAIT 2.0 (2013) Climate Analysis Indicators Tool: WRI’s Climate Data Explorer.
Washington, DC: World Resources Institute. Available at cait2.wri.org.23. U.S. Environmental Protection Agency (2014) Inventory of U.S. Greenhouse Gas Emis-
sions and Sinks: 1990-2012. (U.S. Environmental Protection Agency, 1200 PennsylvaniaAve., N.W., Washington, DC 20460, U.S.A.), Technical Report EPA 430-R-14-003.
24. Chen Y, et al. (2013) Measurement of the 13C/12C of atmospheric CH4 using near-infrared (NIR) cavity ring-down spectroscopy. Anal Chem 85(23):11250–11257.
Kang et al. PNAS | December 23, 2014 | vol. 111 | no. 51 | 18177
ENVIRONMEN
TAL
SCIENCE
S